
Fintech is disrupting the financial services industry by creating a digital alternative to traditional institutions. Fintech companies use innovative technologies and data analytics to facilitate access to banking and financial services, including payments, loans, and insurance. There is still a significant percentage of the world's population that is excluded from the financial ecosystem and does not have access to platforms that allow them to track their spending, save money, or use other banking services. The percentage of adults making digital payments increased globally from 26% to 51% between 2014 and 2021, but in Latin America and the Caribbean, this number increased from 5% to 20% over the same period. The increase in account ownership in LAC is largely due to greater access to mobile money accounts, which has made financial products more accessible to women, low-income groups, and other excluded sectors. Financial inclusion in Mexico In Mexico, in 2021, over 40% of the population was considered financially excluded, according to the ENIF survey. This means that they do not have access to formal financial services such as banking, saving, credit, and insurance. However, fintech has been playing a critical role in improving financial inclusion in the country by bringing financial services to the previously unbanked. This has forced large financial institutions to reevaluate their business practices, resulting in 16.8 million adults in Mexico having access to banking services through fintech platforms in 2020. According to the Mexican Banking and Securities Commission (CNBV), financial inclusion in Mexico has four fundamental components: Access: Infrastructure available to offer financial services and products. Use: Acquisition or contracting by the population of one or more financial products or services. Consumer protection: New or existing financial products and services are under a framework that guarantees transparency of information, fair treatment, and good practices. Financial education: Aptitudes, skills, and knowledge that the population acquires in order to be able to correctly manage and plan their personal finances. The World Bank reports that financial inclusion in Mexico has advanced due to the National Financial Inclusion Strategy, whose main policy goal is to allow 77% of the Mexican population to hold at least one financial product by 2024, compared to 68% in 2018. More than $200 million in loans have been given out in the last five years, primarily to residents in rural and marginalized communities. However, there is still a significant percentage of the population that doesn’t have access to essential financial products and services like savings accounts, credit, insurance, and pensions. This leaves a large portion of the population vulnerable to financial shocks, such as job loss or illness, and unable to save for important life events like education or retirement. Fintech is playing an important role in transforming financial inclusion in Mexico and bridging this gap. Fintech Solutions Fintech companies use specialized software and algorithms to bridge the gap between those with access to financial services and those without. As more people access the Internet through their mobile devices, fintech companies are able to reach a wider audience and offer their services through user-friendly mobile apps, making digital banking more accessible and affordable for people living in rural areas, low-income households, the elderly, or those working in the informal sector. In March 2018, Mexico published the Fintech Law after the number of financial technology companies grew by 50% in the previous two years. The Secretariat of Finance and Public Credit (Secretaría de Hacienda y Crédito Público or SHCP), the Mexican Banking and Securities Commission (CNBV), and the Central Bank (BANXICO) are the main regulators of this sector. The law aims to foster financial inclusion, provide greater legal certainty for users of fintech services, and generate more competition in the market. Fintech regulation has placed Mexico at the forefront of regulatory issues and consolidated its position as a pioneer in the field. By 2021, there were around 512 fintech startups in Mexico, making it the second largest fintech ecosystem in Latin America after Brazil. Their competitive advantage is the specialization in some products to meet different sectors, segments, and market needs, such as payments and remittances, loans, corporate financial management, among others. As we can see in Figure 1, Business and Consumer Lending is the subsector with the highest market share, coinciding with credit cards, which are the products for which fintechs are best known today. [caption id="attachment_10139" align="aligncenter" width="473"] Figure 1. Fintech Subsectors and Market Share 2021 Source: Fintech Radar Mexico 2021[/caption] The sectors with the highest market share are Loans (21%) and Payments and Remittances (18%). A good example of those with a presence in Mexico are Nubank and Clip. Clip, as one of the leading companies, was the first terminal in the country (mobile and non-mobile) to accept all payment methods, pioneering innovation in business payment methods in Mexico. This helps SMEs increase their sales and have better control of their finances without paying high rates and commissions. Nubank, the largest neobank (which operates exclusively online) in Latin America, has a presence in Mexico, offering their first product: a credit card without annuities, acceptable in all businesses, and without long waiting times for approval. Nu Mexico is a company that has made a special effort to bridge the financial inclusion gap, as reported in 2022; 46% of its clients report a monthly income of less than 10,000 pesos; 1 in 3 customers over the age of 65 did not have a credit card before Nu card; its clients are located in 80% of the priority rural municipalities for the federal government. Future Prospects for Financial Inclusion with Fintech Financial inclusion has been a hot topic in Mexico, and fintech has played a key role in driving change. As more of the population gains access to internet connections and financial services, it is important to take a look at the future prospects of financial inclusion with fintech in Mexico. Offering individuals financial products like bank accounts and credit cards through their current smartphone service is one method of increasing financial inclusion. In Mexico, 67% of people over the age of 15 had smartphones in 2020, and that number is expected to rise to 74% by 2025. However, only 32% have made or received digital payments. This presents a significant opportunity to improve accessibility through digitized services. It is also important that both traditional financial institutions and fintechs continue to work together to re-educate people on the benefits of using electronic money; this not only expands access to financial services but also helps boost economic growth and reduce inequality. In conclusion, the outlook for fintech and financial inclusion in Mexico is positive. The industry has grown rapidly in recent years, driven by favorable regulatory policies, increasing smartphone penetration, growing demand for digital financial services, and a focus on reaching underserved populations. With continued innovation and expansion, the fintech industry is expected to play a key role in promoting financial inclusion and economic growth in Mexico in the years to come. Author: Meliza Rivas Sources: https://www.inegi.org.mx/programas/enif/2021/ https://www.inegi.org.mx/contenidos/saladeprensa/boletines/2021/EstSociodemo/ResultCenso2020_Nal.pdf https://microvestfund.com/fintech-a-bright-spot-in-mexicos-road-to-financial-inclusion/#:~:text=Despite%20medium%2Dterm%20liquidity%20issues,they%20have%20a%20bank%20account. https://www.afi-global.org/wp-content/uploads/2020/07/EN_Summary_National_Financial_Inclusion_Strategy.pdf https://mexicobusiness.news/entrepreneurs/news/role-fintech-financial-inclusion-mexico https://www.oecd-ilibrary.org/deliver/73e9341b-en.pdf?itemId=%2Fcontent%2Fpaper%2F73e9341b-en&mimeType=pdf https://www.gob.mx/cnbv/acciones-y-programas/inclusion-financiera-25319 https://www.gsma.com/mobileeconomy/wp-content/uploads/2021/11/GSMA_ME_LATAM_2021.pdf https://www.worldbank.org/en/results/2021/04/09/expanding-financial-access-for-mexico-s-poor-and-supporting-economic-sustainability#:~:text=Mexico%20lags%20in%20terms%20of,with%20similar%20levels%20of%20development. https://diafintech.com.mx/noticia/fintech-radar-mexico-2021-principales-hallazgos/ https://labsnews.com/en/news/business/the-13-latin-american-rockets-among-cb-insights-250-top-fintech-companies-of-2021/ https://interesante.com/2022/06/top-10-strongest-fintech-startups-in-mexico/ https://blog.clip.mx/clip-fortalece-la-economia-emergente https://www.endeavor.org.mx/clip_una_revolucion_a_la_inclusion_financiera.html https://blog.nu.com.mx/nu-pieza-clave-de-la-inclusion-financiera/ https://www.bbva.com/es/las-fintech-invaden-mexico/ https://es.statista.com/grafico/27329/paises-latinoamericanos-con-mas-empresas-fintech/#:~:text=Brasil%20es%20claramente%20el%20pa%C3%ADs,del%2030%25%20del%20total%20regional. https://financer.com/mx/wiki/ley-fintech/#:~:text=El%20principal%20prop%C3%B3sito%20de%20esta,Los%20pagos%20electr%C3%B3nicos. https://fintechradar.finnovista.com/mexico/2021/en/ https://www.caf.com/en/knowledge/views/2022/12/financial-inclusion-in-latin-america-how-far-we-have-come/

Autonomous vehicles (AVs), also known as self-driving or driverless cars, are becoming increasingly common on city streets around the world. The developers of these vehicles are striving to provide drivers with a safe, comfortable, and hands-free experience, pushing the boundaries of comfort and safety in road travel. A driverless car relies on sensors, cameras, radar, and artificial intelligence (AI) to travel between destinations without a human driver. Its technology developers use vast amounts of data from image recognition systems, machine learning, and neural networks to build systems that can drive autonomously. This data includes images from cameras mounted on the AV that can identify any driving environment’s components, such as traffic lights, trees, curbs, walkers, street signs, etc. Automakers and technology companies are still far behind in releasing fully autonomous cars. Although there are no commercially available self-driving cars for individual buyers today, some vehicles currently offer advanced driver assistance features. There is some confusion about what today’s cars are capable of and whether today’s active driving assistance (ADA) systems, which automatically steer, brake, and accelerate under certain conditions, are considered self-driving. Levels and types of AVs The Society of Automotive Engineers (SAE) defines six vehicle driving automation system levels according to the degree of automation, ranging from Level 0, where vehicles have no automation, to Level 5, which represents full automation. Most vehicles on the road are at Level 1 equipped with driver assistance or Level 2 with partial automation, while some prototypes are at Level 3 or Level 4 with conditional and high automation, respectively. Right now, we are at Level 2, with cars that can control steering, acceleration, and braking while still requiring the driver to remain engaged. In the future, Level 5 autonomy would mean fully driverless vehicles. According to McKinsey & Company, the first Level 3 traffic-jam pilots or prototypes, in which autonomous systems control driving and monitoring in some situations, have already received regulatory approval in 2021. [caption id="attachment_8808" align="aligncenter" width="641"] Figure 1. Levels of driving Automation (Synopsys, 2023)[/caption] Which vehicle segments could be autonomous? New modes of transportation will emerge, primarily driven by factors such as what is being transported, the type of vehicle ownership, and where the vehicle operates. As of today, the strongest candidates to become fully automated are passenger cars, including private cars and shared autonomous vehicles, also known as robo-taxis or shuttles; the second segment is autonomous truck platooning. It is forecast that by 2040, there will be over 33 million driverless vehicles on the road. When it comes to the cost of shared autonomous vehicles, the cost per mile of a robo-taxi trip could be just 20% higher than that of a private nonautonomous car in specific contexts, depending on the segment, geography, and local conditions such as the city archetype. A robo-shuttle could be 10 to 40% cheaper than private, non-autonomous cars, though less convenient. Another segment where full automation is close to becoming a reality is truck platooning, where a group of vehicles equipped with advanced technology travel together in a line at high speed. In a truck platoon, a lead vehicle is followed by the other vehicles at the same speed and maneuvers as the lead vehicle. Each vehicle communicates with the lead vehicle, which is in control. These new transportation means, especially robo-taxis and shuttle mobility, can potentially disrupt our future mobility behavior and cannibalize the many miles people travel daily. Global Autonomous vehicles Market size According to an autonomous vehicle market forecast by Next Move Strategy Consulting, the global market for L1 and L2 autonomous vehicles reached nearly USD 106 billion in 2021 and is projected to reach over USD 2.2 trillion in 2030, growing at a CAGR of 35.6% from 2021 to 2030. [caption id="attachment_8814" align="aligncenter" width="555"] Figure 2. Global Autonomous Vehicles Market Size (Statista, 2023)[/caption] Asia Pacific is expected to account for the largest market share by 2030, followed by Europe and North America. The main factors driving the growth of the autonomous / self-driven car market are: Increasing demand for a safe, efficient, and convenient driving experience Rising disposable income in emerging economies; and Stringent safety regulations across the globe Autonomous Vehicles market players in 2023 Many companies are already conducting extensive testing of private AV cars, fleets of shared AVs, and AV trucks. The companies involved range from original equipment manufacturers (OEMs) and suppliers to tech players and start-ups. [caption id="attachment_8815" align="aligncenter" width="535"] Figure 3. OEMs and suppliers to tech players and start-ups (AI Time Journal, 2023)[/caption] Autonomous Vehicles in the Middle East UAE becomes the first in the Middle East and the second globally to test self-driving cars on the streets with the approval of a temporary license to test self-driving vehicles on the roads. According to the Dubai Autonomous Transportation Strategy, launched by His Highness Sheikh Mohammad Bin Rashid Al Maktoum, Vice President and Prime Minister of the UAE and Ruler of Dubai, 25% of all trips on various self-driving transport means in Dubai will be driverless by 2030. In April 2021, the Roads Transportation Authority signed an agreement with Cruise, a General Motors-backed company, to operate Cruise autonomous vehicles to offer taxi and e-Hail services until 2029. It is planned to reach 4,000 Cruise AVs in Dubai by 2030 as part of its efforts to enhance Dubai’s pioneering role in self-driving transport and transform it into the smartest city in the world. [caption id="attachment_8817" align="aligncenter" width="578"] Figure 4. Dubai Self-Driving Transportation Strategy 2030 (Road and Transport Authority UAE, 2023)[/caption] Can we see driverless taxis on UAE streets in 2023? According to Dubai’s Roads and Transport Authority, Cruise has sent two of its autonomous Chevrolet Bolt electric vehicles to Dubai to begin mapping the streets in the Jumeirah area, driven by specialist drivers using two Chevrolet Bolt electric vehicles equipped with sensors and cameras in preparation for a planned launch in 2023. The technology uses a high-resolution map of the physical environment using several sensors, including LiDAR, cameras, and others. The cars were driven around the city to collect data, which can then be used to create a navigable map for Cruise’s driverless vehicles to follow. Dubai is aggressively integrating self-driving transport across all modes of public transport, from taxis and metros to buses and shuttles, and wants to set a global example for policy and legislation regarding self-driving transport. Challenges and future of Autonomous Vehicles Regulations and safety According to a McKinsey survey conducted on 75 executives from automotive, transportation, and software companies working on autonomous driving in North America, Europe, and Asia-Pacific in December 2021, 60% of respondents viewed the need for regulatory support as the greatest requirement for autonomous driving; those in Europe were most likely to voice this sentiment. Notably, several European countries have launched independent efforts to create regulations. Different regulations have also emerged in China at the municipal level. [caption id="attachment_8821" align="aligncenter" width="536"] Figure 5. Main challenges to the adoption of Autonomous Vehicles (McKinsey & Company, 2021)[/caption] Technology barriers The technology must be tested for many millions of kilometers before it can be fully commercialized. To achieve a 95% equivalency to a human driver, an autonomous automobile needs to travel around 291 million miles without causing any fatalities. For instance, the first fatal accident happened in March 2018, when a Level-4 Uber prototype collided with a person crossing the street. Lack of required infrastructure In emerging countries, the development of IT infrastructure on highways is slow as compared to developed economies. 3G and 4G-LTE communication networks, which are required for connectivity, are limited to urban and semi-urban areas. Autonomous/ Self-driving cars require basic infrastructure such as well-organized roads, lane markings, and GPS connectivity for effective functioning. We can conclude that the market size of autonomous vehicles is expected to grow rapidly in the next decade, reaching trillions of U.S. dollars by 2030 due to the expected expansion of autonomous vehicle levels. More than half of the new vehicles sold globally will be at least at level 3, while about 10% will be at level 4 or higher. North America and Europe may lead the adoption of higher-level AVs for personal use, while China and Asia-Pacific may dominate the market for robo-taxis and shared mobility services. Highway driving or parking may be more suitable for higher-level AVs than others, such as urban driving or off-road driving. This will be driven by technological improvements, regulatory support, consumer demand, safety benefits, and environmental concerns. Do you think autonomous vehicles will be a reliable and safe option for everyday transportation without the need for a human driver? Author: Eman Abdelmohsen Sources: https://www.theguardian.com/technology/2023/feb/17/taking-ride-self-driving-car-nissan-servcity-autonomous-vehicles https://www.mckinsey.com/features/mckinsey-center-for-future-mobility/our-insights/whats-next-for-autonomous-vehicles https://www.techtarget.com/searchenterpriseai/definition/driverless-car https://www.marketsandmarkets.com/Market-Reports/near-autonomous-passenger-car-market-1220.html#:~:text=The%20global%20autonomous%20%2F%20self%2Ddriving,automotive%20customers%20across%20the%20world. https://www.statista.com/statistics/1224515/av-market-size-worldwide-forecast/ https://www.esquireme.com/gear/cars/dubai-cruise-driverless-taxis-2023 https://www.telecomreview.com/articles/reports-and-coverage/5651-uae-drives-the-future-of-mobility-and-autonomous-technology https://www.rta.ae/links/sdt/sdt-final.pdf https://techcrunch.com/2022/07/24/cruise-starts-mapping-dubais-streets-in-prep-for-2023-robotaxi-launch/?guccounter=1 https://ai4beginners.com/top-10-self-driving-car-companies-in-2020/ https://www.aitimejournal.com/autonomous-vehicles-companies-to-watch/ https://www.neusoft.com/Products/Automotive/2286/ https://www.mckinsey.com/industries/automotive-and-assembly/our-insights/the-road-to-affordable-autonomous-mobility https://techcrunch.com/2022/07/24/cruise-starts-mapping-dubais-streets-in-prep-for-2023-robotaxi-launch/ https://www.telecomreview.com/articles/reports-and-coverage/5651-uae-drives-the-future-of-mobility-and-autonomous-technology https://builtin.com/transportation-tech/self-driving-car-companies https://www.theguardian.com/technology/2023/feb/14/amazon-tests-robotaxis-zoox-california https://www.theguardian.com/technology/2023/feb/20/self-driving-vehicles-from-overseas-face-ban-in-england-and-wales https://www.researchgate.net/publication/366986201_Autonomous_Car_Current_Issues_Challenges_and_Solution_A_Review https://www.mckinsey.com/industries/automotive-and-assembly/our-insights/autonomous-drivings-future-convenient-and-connected https://www.mckinsey.com/features/mckinsey-center-for-future-mobility/our-insights/whats-next-for-autonomous-vehicles https://www.bbc.com/news/technology-60126014 https://www.forbes.com/sites/naveenjoshi/2022/07/22/5-ways-autonomous-cars-will-reshape-our-world/?sh=7b32995b589b https://www.synopsys.com/automotive/autonomous-driving-levels.html

Robots are not what we once thought. They are more than those humanoid creations with odd speech patterns, and they are definitely not as evil as depicted in science-fiction movies like The Terminator (1984) or in novels like Frankenstein’s artificial lifeform monster. Although the now real “killer robots” are making us question whether our subconsciously learned stereotype is really a misconception or rather a prediction of the future, it is safe to say that robots do have many useful applications that benefit society on multiple levels, which is why companies around the world are increasingly opting for them. So, what exactly are robots? There are two main types of robots: industrial robots and service robots. Industrial robots are mainly used in manufacturing industries and factories, and they are programmed to handle dangerous tasks that require precision, consistency, and heavy lifting. They represent an important component of process automation, and they are increasingly being integrated with artificial intelligence and the cloud. On the other hand, service robots are often intended for more “soft” tasks in offices, homes, or similar environments to assist people. They can either be human-operated or fully autonomous, and they are safer to interact with since they are designed to be human-facing devices that mimic human abilities. If we look at the numbers, industrial robots generate higher revenues compared to service ones, with USD 24.18 billion for industrial robots compared to USD 8.23 billion for service ones in 2022. Together, both types generated a total of USD 32.41 billion in revenue in 2022 and are expected to reach USD 43.32 billion in 2027, per the below chart. [caption id="attachment_8789" align="aligncenter" width="549"] Notes: Data shown is using current exchange rates and reflects market impacts of the Russia-Ukraine war. Most recent update: Aug2022; Source Statista[/caption] When it comes to industrial robots and the manufacturing industry, Asian countries are dominating the market, with 74% of the 517,385 newly deployed robots in 2021 installed in Asia. In fact, the highest densities of robots can be found in Asian countries, with 932 robots per 10,000 employees in South Korea, compared to 605 in Singapore and 390 in Japan, as shown in the below graph Manufacturing industry-related robot density in selected countries worldwide in 2020 While the Singapore Government is actively seeking to develop national capabilities in robotics through its National Robotics Programme, it has also unexpectedly caused a ramp-up of automation in the country after enacting the “Serious Disasters Punishment Act” in 2021. The new law imposed criminal liability on CEOs and high-ranking managers in the case of injuries and deaths on job sites to encourage them to invest in making workplaces safer; however, in reality, it has pushed companies to avoid the entire problem by replacing workers with machines. Why the race for robots? Are they really that useful? Technology has come a long way since the first mechanical invention, an automated water clock, was created in early 270 B.C. While robots were later developed as machines that handle repetitive tasks that do not require precision, they are now deployed across a broad spectrum of industries, with many benefits. In the healthcare sector, assistive robot arms are opening doors to independence for people with disabilities or advanced muscular problems. Robots are also assisting in hospitals, such as in Mongkutwattana General Hospital in Bangkok, where three robotic nurses helped face the surge in the number of patients in 2017 by traveling between desks and delivering important paperwork and medicine to doctors. In the retail industry, automation is increasingly incorporated in different stages of the value chain, including logistics and supply chains, back-offices and in-store operations, and sales and marketing, with the aim of optimizing customer experiences and driving revenue. While the global retail automation market was valued at USD 11.3 billion in 2020, it is estimated to reach USD 33 billion in 2030. AI-powered robots such as Effective Retail Intelligent Scanners can take over time-intensive tasks by scanning shelves and alerting staff of any misplaced items and price tag inconsistencies, in addition to issuing stock warnings. In terms of customer support, sensor-based robots can also bring customers the products they are looking for, while AI-powered ones can offer personalized product recommendations. Moving on to the leisure and travel sectors, we can find that the world’s first AI news anchor joined China’s state-run Xinhua News Agency in 2018 with the ability to mimic facial expressions, speak in both English and Chinese, read texts, and report on social media and on the Xinhua website. Moreover, robots are making life easier and more convenient for humans. For example, during the Tokyo 2020 Games, two Toyota human support robots assisted spectators in wheelchairs by carrying their belongings and guiding them to their seats, while at the Lyon Saint-Exupéry Airport, robot valets are parking cars in a robot-lot, fitting 50 percent more cars in the same area by parking them closer together. Not to mention that a three-armed robot, can now prepare, cut, and serve a pizza in less than five minutes while creating 500,000 unique recipes at the Pazzi restaurant in Paris. [caption id="attachment_8755" align="aligncenter" width="369"] The world’s first AI news anchor adopted by China’s state news agency Xinhua in 2018; Source: The Guardian[/caption] Robots are also extremely helpful in addressing climate change. Advanced technologies are now used to create profitable solutions that positively impact the environment and help achieve net zero goals, in what we call “technology eco-advantage”. PwC UK estimated in 2019 that using environmental applications of AI in four sectors—agriculture, transport, energy, and water—could reduce worldwide greenhouse gas (GHG) emissions by 4% in 2030, the equivalent of 2.4 Gt CO2e. This represents the 2030 annual emissions of Australia, Canada, and Japan combined. Real-life applications that back up this estimation include the tree-planting robot “Growbot”, created by SkyGrow with a mission to plant trees faster than the rate of deforestation. The robot is 10 times faster than trained individuals and helps cut costs in half compared to traditional techniques. Researchers at Sichuan University have also invented a 13-mm-long flexible and self-healing nacre robot fish that is programmed to absorb microplastics from seas and oceans up to 5kg in weight just by swimming around. If robots are helpful, then why all the controversy? The truth is, robotic applications are useful for humanity on many different levels, but they rarely come without any serious downsides. Whether it is the displacement effects of robots performing tasks previously done by humans, injuries caused by over-automation, or ethical concerns about killer robots and algorithmic bias, many questions are being raised about what the future holds and how much we can control. Displacement effects and the concept of “Reshoring” A study on the US labor market found that for every robot added per 1,000 workers in the U.S., wages would decline by 0.42%, and one robot would decrease employment by 3.3 workers. This displacement effect varies based on the gender, age, and country of the worker. In fact, the World Economic Forum found in 2019 that women are more likely to lose their jobs due to automation in comparison to men because the positions that have more than a 90% chance of becoming automated, such as cashiers, administrative assistants, and bookkeepers, are mostly dominated by women. Accordingly, for every seven men employed in occupations with a 90 percent likelihood of automation, there are 10 women. The IMF also estimated in 2018 that 26 million women in 30 countries face a high risk of being displaced by technology within the next 20 years. When it comes to age, young people aged 16-24 face the highest vulnerability to losing their jobs compared to other age groups, as shown in the below graph. As for country-level effects, the ILO has also raised the idea of “reshoring”, where labor-intensive tasks previously outsourced to developing countries can be reshored to developed ones to be performed by robots, resulting in a shift in the global division of labor. Injuries and inefficiencies It is true that robots are more efficient than humans in certain aspects, but overusing them can be dangerous. For example, after Amazon began employing robots in its warehouses in 2014 to take on repetitive tasks, the Center for Investigative Reporting revealed in 2020 that during the period 2016-2019, the rate of serious injuries endured by Amazon employees at automated warehouses was 50 percent higher than at facilities that didn’t use robots. This was due to robots increasing workers’ quotas from scanning 100 items per hour to scanning 400, which was far beyond their human capacity. While over-automation might not always lead to injuries, it can often be inefficient. In Japan, after the Henn na Hotel opened in 2015 as the first hotel in the world to be entirely staffed by robots, it had to replace more than half of its 243 robotic workforce with traditional human service providers in 2019. Robots were found to annoy guests and break down many times; they were incapable of answering some basic questions at the front desk, and robot room assistants woke up guests in the middle of the night as they mistook snoring sounds for commands. Despite these risks, robot hotels are increasingly becoming popular worldwide, with NEOM’s first robot-powered Yotel Hotel opening in the Oxagon district in 2025, in Saudi Arabia. Algorithmic bias and toxic stereotypes Another major concern that shakes our trust in robots is their programming, which is based on biased artificial intelligence algorithms. In 2022, in a collaboration between Johns Hopkins University and other educational institutions, scientists asked programmed robots to scan blocks with people’s faces on them and choose a block based on their command. When asked to select a “criminal block”, the robot chose the block with the black man’s face 10% more often than when asked to select a “person block”. Also, when asked to select a “janitor block” the robot selected Latino men 10% more often while selecting men more often than women when asked for a “doctor block” and choosing black and Latina women when asked for a "homemaker block”. On another note, in May 2016, the investigative journalism organization ProPublica claimed that the Correctional Offender Management Profiling for Alternative Sanctions (COMPAS), a computer program used by a US court for risk assessment, was found to mistakenly label black defendants as more likely to re-offend at almost twice the rate as white people. Similar COMPAS and programs are used in hundreds of courts across the US, making us question if robots are being racialized as “white” and programmed with toxic stereotypes. Legal autonomous weapons and killer robots Ethical concerns take a much bigger turn when it comes to lethal autonomous weapons and military robots that use artificial intelligence to identify and kill human targets without human intervention. These are no longer limited to movies but are becoming a reality on the battlefield. A military combat robot experiment developed by the U.S. military’s research labs Source: Teslarati While some see it as more ethical to employ robots in wars rather than human fighters, others think that “killer robots” can cause more collateral damage than human soldiers. They have been designed to be unpredictable to be one step ahead of the enemy, but their unpredictability combined with their speed, lack of situational awareness, risk of inaccurate target identification, and programming based on biometric information can rapidly escalate the conflict and result in selective killing based on age, gender, and race. Once these weapons start being mass-produced, they can be sold on the black market and fall into the wrong hands, leading to human disasters. How are organizations, companies, and employees reacting? The United Nations Convention on Certain Conventional Weapons (CCW) in Geneva started discussing lethal autonomous weapons in 2013 and set up in 2016 a Group of Governmental Experts (GGE) to develop a new ‘normative and operational framework’ for member states. In July 2015, during a joint conference on artificial intelligence, an open letter calling for a ban on autonomous weapons was released and signed by significant figures such as Elon Musk, inventor and founder of Tesla, Steve Wozniak, co-founder of Apple, and Stephen Hawking, physicist at the University of Columbia. Also, the Stop Killer Robots Coalition, formed by Human Rights Watch, Amnesty International, and other NGOs, was launched in 2013 to call for new international law on autonomy in weapons systems, and in October 2022, 70 states delivered a joint statement on autonomous weapons systems in what became the largest cross-regional group statement ever made throughout UN discussions on the issue so far. When it comes to industrial and service robots, many employees perceive robots as the new “digital workforce” that is stealing their jobs. While denying the truth is pointless, companies should try to openly communicate with their workers their vision for the future in terms of automation and technology and invest in training and upskilling their employees to be able to fit in an automated workplace where robots complement employees’ work rather than replace them. So… Are we for or against robots? Robots might be able to perform some of the same tasks as humans with higher speed and accuracy, but they still have a long way to go when it comes to emotional and cultural sensitivity, opening doors to questions, concerns, and fears. It is almost like a love-hate relationship, but it is also one with which we eventually need to make peace if we want to stay ahead of the game. New robotic technologies, or even bots and chatbots like ChatGPT, will never stop breaking new ground, and it is up to us to determine how we perceive them. Allies or enemies? The choice is yours. Author: Mané Djizmedjian Sources: https://www.sciencefriday.com/segments/the-origin-of-the-word-robot/ https://www.bcg.com/publications/2014/business-unit-strategy-innovation-rise-of-robotics https://www.thoughtco.com/timeline-of-robots-1992363 https://www.robotlab.com/group/blog/whats-the-difference-between-industrial-robots-and-service-robots https://www.geeksforgeeks.org/differences-between-industrial-robots-and-service-robots/ https://www.statista.com/outlook/tmo/robotics/worldwide#revenue https://www.statista.com/statistics/911938/industrial-robot-density-by-country/#:~:text=In%202020%2C%20South%20Korea%20had,rounded%20off%20the%20top%20five. https://www.automation.com/en-us/articles/october-2022/ifr-presents-world-robotics-report-2022 https://restofworld.org/2022/korea-factories-replace-humans-with-robots/ https://www.nrp.gov.sg/ https://www.cnbc.com/2018/11/09/the-worlds-first-ai-news-anchor-has-gone-live-in-china.html https://olympics.com/en/news/tokyo-2020-robot-project-dr-hirukawa-hirohisa-to-showcase-future-of-sporti https://news.yahoo.com/hospital-uses-robots-instead-nurses-130000636.html https://sg.news.yahoo.com/2019-03-15-stanley-robotics-robot-valets-airport-france.html https://worldcrunch.com/tech-science/how-five-countries-are-integrating-robots-into-daily-life https://exchange.telstra.com.au/skygrow-muru-d-climate-change/ https://eandt.theiet.org/content/articles/2017/07/the-plantoid-project-how-artificial-plants-could-help-save-the-environment/ https://www.bcg.com/publications/2021/how-technology-helps-sustainability-initiatives https://www.pwc.com/gx/en/news-room/press-releases/2019/ai-realise-gains-environment.html https://www.theguardian.com/environment/2022/jun/22/scientists-unveil-bionic-robo-fish-to-remove-microplastics-from-seas https://www.statista.com/statistics/1257213/retail-automation-market-size/ https://www.engadget.com/amazon-robot-arm-picker-warehouse-sparrow-ai-computer-vision-210545438.html#:~:text=Amazon%20has%20unveiled%20its%20latest,of%20items%2C%20according%20to%20Amazon https://www.wired.com/story/amazons-worker-injury-problem/ https://www.adaptarobotics.com/robots/eris/ https://www.wevolver.com/article/how-ai-powered-robots-are-transforming-the-retail-industry https://www.wns.com/perspectives/articles/articledetail/627/robots-in-retail-driving-innovation-one-aisle-at-a-time https://www.hotelmanagement.net/tech/japan-s-henn-na-hotel-fires-half-its-robot-workforce https://www.revfine.com/robots-hospitality-industry/ https://mitsloan.mit.edu/ideas-made-to-matter/a-new-study-measures-actual-impact-robots-jobs-its-significant https://tcf.org/content/report/robots-beginning-affect-workers-wages/?agreed=1https://projectuntangled.eu/wp-content/uploads/2022/01/Untangled_The_Impact_of_Robots_on-Labour_Market_Transitions_in-Europe_11.01.pdf https://www.weforum.org/agenda/2019/03/women-face-greater-threat-from-job-automation-than-men https://www.imf.org/en/Blogs/Articles/2018/11/16/blog-Women-Technology-the-Future-of-Work#:~:text=On%20average%2C%20women%20face%20an,within%20the%20next%2020%20years https://www.imf.org/en/Publications/fandd/issues/2018/06/japan-labor-force-artificial-intelligence-and-robots-schneider https://hbr.org/2017/04/the-countries-most-and-least-likely-to-be-affected-by-automation https://www.ilo.org/wcmsp5/groups/public/---ed_emp/documents/publication/wcms_751599.pdf https://www.abilities.com/community/buzz/64b-jaco.html https://www.bcg.com/publications/2014/business-unit-strategy-innovation-rise-of-robotics https://www.arabianbusiness.com/industries/travel-hospitality/neom-will-open-futuristic-yotel-hotel-with-robot-concierge-in-2025 https://www.armyupress.army.mil/Journals/Military-Review/English-Edition-Archives/May-June-2017/Pros-and-Cons-of-Autonomous-Weapons-Systems/ https://autonomousweapons.org/ https://www.washingtonpost.com/technology/2022/07/16/racist-robots-ai/ https://dl.acm.org/doi/pdf/10.1145/3531146.3533138 https://www.fastcompany.com/90212508/even-black-robots-are-impacted-by-racism https://www.theguardian.com/inequality/2017/aug/08/rise-of-the-racist-robots-how-ai-is-learning-all-our-worst-impulses https://www.teslarati.com/ai-weapons-darpa-kaist-south-korea-boycott/ https://nexxis.com/overcoming-staff-resistance-to-working-with-robots/ https://www.stopkillerrobots.org/

Artificial intelligence is an integrative discipline that simulates human aptitudes and cognitive behavior. In other words, intelligent systems imitate human aptitudes in order to execute complicated tasks that are outside the limits of human cognitive competence while removing errors and reducing risks of bias that are commonly linked to human beings. There are several established AI applications available nowadays, such as expert systems, neural computing, genetic algorithms, artificial neural networks, etc. Artificial Intelligence’s use in the HR context Artificial intelligence is increasingly being used to enhance managerial decision-making and assist managers in speeding up their day-to-day tasks. Human Resource Management refers to a set of HR policies and related management practices in organizations. The application of AI technology to HRM can increase a company’s profits. The development and refinement of HRM efficiency through the use of AI tools has become an essential trend for the future development of HRM as a field. Artificial Intelligence in recruitment and talent selection AI is becoming more prominent in the HR field, particularly in recruitment and selection. It is crucial for companies to identify, attract, retain, and manage the right talents. Having a talented team and the appropriate tools within a company’s HR department will directly lead to increased profits, but making a rationally perfect decision when it comes to candidate selection is challenging. Traditional recruitment strategies and techniques are built on psychometric doctrines. In addition to that, there are objectivity issues and human biases during the planning and execution of the recruitment process. To avoid this potential problem, organizations have considerably increased their use of screening programs in the past years—smart software programs that offer companies the chance to minimize human bias during the whole screening process of profiles. Below are some examples of AI techniques leveraged by the HR industry: The “Knowledge-based search engine” is considered one of the most frequently adopted AI techniques when it comes to recruitment. The search engines identify the connotation of the search subject and search content on the web for suitable applicants´ profiles based on the keywords or grammatical tags of job advertisements and candidates’ profiles. This includes desired experience, credentials and qualifications, position title, etc. Another popular AI technique is Expert systems, which is considered relevant in Human Resource Information Systems (HRIS) and corporate decision-making and helps propose actions instead of developing opinions. An alternative technique that is widely employed in the recruitment field is “Data Mining” which is the process of searching and evaluating very large arrays of data and then pulling out the information from it. This specific technique is usually employed to identify keywords while screening a large volume of applicants´ resumes. A smart text-treating method employing text mining aimed at emotion analysis could be very useful when recruitment specialists are evaluating the applicants since it can give them a better idea of the candidates´ profiles by analyzing their emotions in a word-based context. HR leaders are also increasingly considering and adopting "Chatbots". Chatbots employ neural language to communicate with candidates via aural or textual approaches; they are intelligent solutions that systematize tasks that are time-consuming, such as sourcing, screening, and evaluating profiles. Chatbots will start an instantaneous interaction with the applicants as soon as they send their job applications. After evaluating the application, the software will conduct different evaluation tests and reply to questions raised by applicants. Studies have demonstrated that most job applicants would develop negative reactions if they did not obtain feedback from firms. Thus, chatbots can significantly enhance candidates´ experiences by eliminating the communication breach that commonly exists between recruitment specialists and candidates. Some of the contemporary chatbots employed in recruitment are Wendy, Mya, and HireVue. The use of AI technologies and machine learning in the recruitment and selection process is becoming more popular. In fact, recruitment specialists have started to use AI techniques and technologies while interviewing face-to-face potential candidates. Specific AI solutions that are accessible in the market target evaluating the performance of candidates through analyzing their video interviews. Some examples of such AI solutions are Hire Vue, Affectiva, or HireIQ. These smart technologies are used to study the facial expressions of candidates, the specific words they choose to use, the voice tone employed when answering specific questions, and even the communication style. They help recruitment professionals assess candidates´ emotional intelligence, trustworthiness, and reliability, as well as get a better interpretation of their personalities. With such AI solutions, recruiters can make more accurate decisions and rank candidates based on their suitability for the job proposed as well as their fit with regard to the company´s culture, thus avoiding the risk of a costly recruitment error for the organization. Recruitment function in danger? With so many promising benefits, there is no doubt that the use of artificial intelligence in recruitment and selection will grow significantly over time. However, substituting a large group of analytical managerial positions is quite a challenge. The use of artificial intelligence technologies and tools in the recruitment and selection process is likely to increase at both the intuitive and empathetic levels/stages. Intuitive intelligence tools such as chatbots are currently used to conduct first interviews and evaluate candidates´ potential. In the near future, organizations are very likely to start using expressive, sensitive, talkative, and extremely interactive machines with face and sound identification technology to perform face-to-face interviews. However, it is unlikely that artificial intelligence will be able to entirely substitute the recruiter´s occupation since the human touch will continue to be indispensable. That being said, regular dependence on artificial intelligence tools will considerably impact recruitment-related occupations within the HR fields, lowering the costs of employing several people to take care of different functions within the recruitment and selection process. Author: Kenza Abadi References https://lumenpublishing.com/journals/index.php/brain/article/view/2011 https://link.springer.com/book/10.1007/978-3-319-63820-1 https://www.sciencedirect.com/science/article/abs/pii/S0957417406002776 https://www.mckinsey.com/capabilities/mckinsey-digital/our-insights/four-fundamentals-of-workplace-automation https://econpapers.repec.org/article/idsijbisy/v_3a6_3ay_3a2010_3ai_3a4_3ap_3a444-462.htm https://www.researchgate.net/publication/337931190_WILL_ARTIFICIAL_INTELLIGENCE_TAKE_OVER_HUMANRESOURCES_RECRUITMENT_AND_SELECTION https://www.intechopen.com/chapters/10951 https://aisel.aisnet.org/cgi/viewcontent.cgi?article=1011&context=iceb2018 https://psycnet.apa.org/record/2002-04710-003 https://terrorgum.com/tfox/books/artificialintelligenceinthe21stcentury.pdf https://iajit.org/PDF/January%202018,%20No.%201/9605.pdf https://www.mheducation.com/highered/product/human-resource-management-gaining-competitive-advantage-noe-hollenbeck/M9781264188895.html https://psycnet.apa.org/record/1983-24691-001 https://www.springerprofessional.de/en/artificial-intelligence-techniques-in-human-resource-management-/2429550 https://www.atlantis-press.com/proceedings/jcis-06/46 https://www.researchgate.net/publication/334897991_Artificial_Intelligence_in_Human_Resources_Management_C_hallenges_and_a_Path_Forward

"The observation that patients with the same clinical diagnosis or symptoms respond differently to the same treatment has led to the development of Precision Medicine (PM), a novel therapeutic approach that relies on biological information and health data from patient tiers to develop tier-specific treatments that lead to better health outcomes." PM is the evolution of healthcare from a “one-cure-fits-all” strategy to the tailored development of precise medications targeted at specific individuals. It is a holistic approach to diagnosis and treatment in which traditional healthcare plays only a minor role in a patient's health, treating each patient as an individual and using his or her unique clinical data, genomic profile, family history, environmental factors, and lifestyle to more efficiently guide diagnosis, treatment, and prognosis Advancements in PM have been driven by the growing understanding of the biological pathways of diseases at the molecular level and the identification of novel biomarkers (a signature component detected in the blood, body fluids, or tissues, such as genes, proteins, etc.) that signal a normal or abnormal cascade of biological processes within the body. These biomarkers act as specific targets for more accurate diagnosis or more efficient treatment. The concept of PM is not new; oncology has been the main early adopter of this approach in treatment, such as with Xalkori from Pfizer. Wider adoption of PM in other therapeutic areas was limited, owing to the high associated costs and technological limitations in data access and utilization. However, the picture is changing due to rising demands to reduce escalating healthcare costs by reducing reliance on: Unnecessary, non-effective medications, especially for diseases (e.g., psychiatry, oncology, and rheumatology) that are commonly associated with high costs of prescription drugs and low response rates. Traditional diagnostic tools, which are characterized by low accuracy and limited detection of biomarkers, increasing the likelihood of subsequent medical interventions to treat complications. On the other hand, advanced diagnostics can screen millions of circulating biomarkers and detect early signs of diseases. A paradigm shift in the way drugs are developed and manufactured Pharmaceutical companies are under increasing pressure to justify the return on their R&D investments. A few years ago, they were reluctant to invest in R&D for PM due to the compromised commercial values associated with targeting limited populations. Nowadays, pharmaceutical companies are shifting their profit focus to price, not volume, as new drugs targeting niche populations can achieve higher selling prices with much lower marketing expenditures and more guaranteed sales. Big pharma companies can technically rely on their in-house manufacturing capabilities to produce precision therapies, but this is not economically viable because small batches of precision therapies will result in underutilized time, machinery, and resources. The traditional pharmaceutical manufacturing process relies on the production of several batches of high volumes of products to control costs and benefit from economies of scale. This cannot meet the complex needs of PM to produce a wider variety of batches of temperature-sensitive, complex products at lower volumes to serve a wider variety of patient populations. Flexible manufacturing and single-use technologies are emerging to provide companies and CDMOs (Contract Development and Manufacturing Organizations) with greater flexibility to manage the production of a variety of products in smaller batches by allowing companies to replace disposable single-use reactors for each medication. This not only reduces cross-contamination but also improves operational efficiency by significantly reducing the time needed to clean the reactors between different product lines. Advances in digital technology are key enablers for realizing the potential of PM For healthcare organizations to realize the full potential of PM, they must be able to collect enormous amounts of genomic, social, and physical data. They must also leverage modern technologies to transform this complex data into structured datasets that generate accurate insights regarding the best treatments while reducing time and errors. The following are key examples of high-potential technologies. Data analytics and AI: Advances in computational power enable the processing of huge amounts of data from various sources and provide valuable insights about the human body’s interactions with drugs. NLP technology: NLP created new opportunities for hospitals to leverage their data, an opportunity that was unattainable with humans alone. NLP can learn and understand the human language within the healthcare context more effectively and rapidly than humans. NLP then extracts valuable information from this vast unstructured data and translates it into more structured data sets ready for analysis. Digital biomarkers: They are physiological and behavioral data collected via digital devices such as wearables and portables. The widespread use of smartphones, along with the rapid development of sensor technologies, has enabled the accurate collection of health and wellness data in real-time. Digital biomarkers can disrupt traditional clinical assessments because objective and specific data is collected in real-life settings without any external bias. This increases the statistical power and increases the accuracy and sensitivity of the clinical results. A huge promise with challenges ahead Despite the unique potential PM can bring to public health, and how technology is making it more feasible than before, PM is not yet broadly integrated within healthcare systems due to some challenges such as: Quality of data: An average hospital produces around 50 petabytes of data annually (1 petabyte is equivalent to 11,000 4K movies). Most of this data is non-standardized and comes from multiple EHRs (Electronic Health Records) and disparate data repositories, making it very challenging and time-consuming to process and use. Economic value: Building an economic case for PM is not an easy task because advanced diagnostics and screening tests have much higher costs than traditional tests. Still, PM has strong potential to increase the efficiency of treatments, produce better outcomes, and thus reduce the overall costs of care. This is because PM eliminates the need for repeated diagnostic tests and the traditional trial-and-error approaches, which are more costly and less accurate. Capacity building: Physicians lack technological expertise and need to be trained and qualified to be able to interpret the data models built from genetic and biological markers via modern data analytics tools and technologies. Data privacy: PM involves the flow of enormous amounts of data among different stakeholders, and it is very critical to ensure the protection of such sensitive data and maintain patients’ privacy. Over the past decade, at least 14 countries have launched genomics-based medicine initiatives According to GlobeNewswire, the global PM market size was estimated at USD 65.89 billion in 2021 and is forecast to increase by a CAGR of 12.1% during 2022-2028, reaching USD 146.57 billion in 2028. Governments and insurance companies are strong advocates of PM to bring healthcare costs down and improve the quality of care, which are the essences of value-based healthcare models. In that sense, they have an important role in developing policies, regulatory reforms, and novel reimbursement plans to accelerate the transition of PM from research to clinical application. Over the past decade, at least 14 countries (Australia, Japan, the USA, the UK, Qatar, KSA, etc.) have collectively invested billions of dollars in large-scale projects to collect genomic and demographic data from thousands or even millions of citizens. These initiatives have great potential to accelerate the integration of genomics within healthcare systems and support the development of PM. Also, big pharma and technology companies are fostering strategic collaborations with strong investments to support the development of precision therapies, for example, in 2022: Google participated in a USD 65 million series A investment round for Vicinitas Therapeutics, which is a precision medicine startup for cancer and genetic disorders. Sanofi has entered into a research collaboration with Exscientia to leverage its AI-based capabilities and personalized medicine platform to develop a pipeline of precision-engineered therapies. Like any new disruptive technology, PM still has many hurdles to overcome, and the key to its success is to get all the ecosystem stakeholders (governments, insurers, pharma and biotech companies, technology providers, etc.) working in silos to collaborate, share resources, and establish standardization frameworks for the diverse data out there. Collaboration is also crucial to reducing costs and driving the development of a sustainable PM-based ecosystem. Author: Ghada Selim Sources: https://persmed.elpub.ru/jour/article/download/3/4 https://www.startus-insights.com/innovators-guide/top-10-pharma-industry-trends-innovations-in-2021/#precision-medicine https://www.thermofisher.com/eg/en/home/clinical/precision-medicine/precision-medicine-learning-center/precision-medicine-resource-library/precision-medicine-articles/overview-precision-medicine.html https://www.efpia.eu/about-medicines/development-of-medicines/precision-medicine/#/ https://www.iqvia.com/-/media/iqvia/pdfs/institute-reports/upholding-the-clinical-promise-of-precision-medicine.pdf https://www.iqvia.com/-/media/iqvia/pdfs/library/white-papers/linguamatics-nlp---precision-medicine-and-population-health.pdf https://www.forbes.com/sites/johnlamattina/2019/04/24/rare-disease-rd-investments-likely-to-grow-in-biopharma/?sh=32117c2274ba https://www.cancer.gov/publications/dictionaries/cancer-terms/def/biomarker https://www.mckinsey.com/industries/life-sciences/our-insights/what-are-the-biotech-investment-themes-that-will-shape-the-industry https://www.technologynetworks.com/biopharma/blog/downstream-processing-in-the-age-of-precision-medicine-trends-and-challenges-365452 https://www.linguamatics.com/solutions/precision-medicine https://www.infosys.com/about/knowledge-institute/insights/documents/precision-medicine.pdf https://www.mckinsey.com/~/media/mckinsey/dotcom/client_service/pharma%20and%20medical%20products/pmp%20new/pdfs/mckinsey%20on%20personalized%20medicine%20march%202013.pdf https://translational-medicine.biomedcentral.com/articles/10.1186/s12967-021-02910-6 https://www.globenewswire.com/news-release/2022/08/23/2503224/0/en/Global-Precision-Medicine-Market-Generate-Revenue-of-146-57-billion-2-68-Billion-Invested-in-R-D-Activities-in-2021-and-is-Projected-to-Expand-to-5-Billion-by-2028-SkyQuest.html https://techfundingnews.com/google-backs-65m-investment-in-precision-medicine-startup-for-cancer-and-genetic-disorders/ https://www.beckershospitalreview.com/healthcare-information-technology/google-backs-65m-funding-for-precision-medicine-startup.html https://www.sanofi.com/en/media-room/press-releases/2022/2022-01-07-06-00-00-2362917

Food production, specifically meat production, is responsible for nearly 60% of the planet-heating gases emitted by humans. In this article, we will explore the significant growth that the plant-based foods market has witnessed in the past few years, as well as its projected expansion over the next decade, highlighting major consumer trends that are driving this growth. How does meat consumption contribute to climate change? Greenhouse gases are gases that affect the earth’s temperature. The most known greenhouse gas is carbon dioxide (CO2). But there are other gases responsible for the greenhouse effect, such as methane, which is up to 34 times more damaging to the environment than CO2 if measured over 100 years; this ratio increases to 86 times more damaging if measured over 20 years. Livestock produces significant amounts of methane as part of their normal digestive processes, and when there is an overconsumption of cattle, there is a strong increase in gas emissions. According to recent studies, by 2050, global meat consumption is projected to reach between 460 million and 570 million tons, which is twice as high as in 2008. And clearly, the processing and transportation of this livestock generate further emissions. Emissions from livestock account for about 14.5 percent of total greenhouse gas emissions globally, and roughly 2/3 of those emissions come from cattle. Meat production is responsible for 57% of all food production emissions; 1 kilo of beef generates around 70 kg of greenhouse gas emissions. Meat production also contributes to the exhaustion of water resources. According to the UN, one quarter-pound burger requires around 1,500 liters of water. In addition to the gas emissions, raising meat requires a large quantity of feed, and cattle ranching requires millions of acres of land and monoculture crop fields to feed this livestock. Cattle ranching drives deforestation 5 times more than any other sector and is responsible for a great majority of the Amazon forests; estimates show that about 70% of its deforested land is used for cattle. Converting natural habitats to agricultural fields releases greenhouse gases that contribute to climate change. As a result of these facts, the plant-based movement has been growing as people understand the relationship between their food choices and the planet's health. From the planet’s perspective, plant-based foods would require 37% less water, and their production would generate significantly lower gas emissions. This is where the race for market share begins. Plant-based foods: the future? 2021 Bloomberg report: The plant-based food market globally is expected to reach $162 billion by 2030, up from $29.4 billion in 2020. A report published by Bloomberg in 2021 stated that global retail sales of plant-based food alternatives (meaning food that consists of all minimally processed fruits, vegetables, whole grains, legumes, nuts and seeds, herbs, and spices and excludes all animal products) may reach $162 billion by 2030, which is an increase of more than $100 billion compared to 2022. The plant-based market is growing 5 times faster than the overall food industry. In the Middle East and Africa, the plant-based meat and dairy products market is projected to witness a CAGR of ~6% from 2022 to 2027. As more people are moving toward a healthier and cleaner lifestyle, the term “flexitarian” (meaning a casual vegetarian) is growing fast. With 14% vegetarians and vegans worldwide and 15% flexitarians, this means that 29% of consumers globally are now embracing plant-based alternatives The Asia-Pacific region has the largest share of the global plant-based market, and with a growth scenario of around $51 billion from 2020 to 2030, its market could reach $64.8 billion. This growth is driven by cultural and demographic factors, since the region’s population is expected to exceed 5 billion people by 2030, increasing the demand for plant-based alternatives. Plant-based meat In 2025, the global meat market share is expected to reach 90% of the global meat supply, and this ratio is expected to decrease by 50% in 2040. While meat alternatives are expected to increase by around 15%, reaching 25% of sales during the same period, cultured meat (genuine meat that is produced by cultivating animal cells directly) is expected to increase by 35%. These predictions demonstrate the market potential of plant-based alternatives, and that plant-based and cell-based meat will account for most of the meat sold by 2040 (with a combined share of 60%). The Asia Pacific plant-based food market was valued at $17.1 billion in 2020 and is forecasted to grow at a CAGR of 15.9 percent between 2018 and 2026. With a market share of 37.9% in 2020, China dominates the Asian plant-based food market. On top of that, the Chinese government is planning to reduce meat consumption in the country by 50% by 2030. According to a study published in 2021 by DuPont Nutrition & Biosciences and IPSOS, demand for plant-based meat substitutes in China and Thailand is expected to increase by 200% by 2025. In the US, the plant-based food market reached $7 billion in sales in 2020, compared to $4.8 billion in 2018, recording a growth of 43%. The growth of plant-based food sales has outpaced the growth of total food sales by 2.5 times during that same period The table below illustrates the top 5 companies in meat alternatives by dollar share: In the Middle East, meat alternatives are increasing, for instance, UAE-based Halal food brand Al Islami launched its first vegan burger in 2021. In 2019, the global plant-based meat market reached $19 billion, with the Middle East accounting for $176.5 million, and was projected to grow by 4 to 5% annually until 2023. Plant-based milk The plant-based milk and derivatives market has already disrupted the dairy market and still has significant room for growth. Multiple factors are contributing to this growth potential, including lactose intolerance, and rising health concerns. According to the Food Intolerance Network, as much as 75% of the world’s population is lactose intolerant. Dairy products also contain high levels of saturated fats, which increases the risk of high cholesterol. As people are moving toward a healthier lifestyle, plant-based dairy alternatives have the potential to reach $68.8 billion by 2030, compared to their 2021 value of $25.2 billion, growing at a CAGR of 11.8% from 2022 to 2030 In the Asia-Pacific region, alternative dairy products are projected to make up 57% of the plant-based protein market by 2030 In the GCC region, 65% of consumers suffer from lactose intolerance, and 48% of consumers claim to prefer the taste of almond and oat milk to cow’s milk. Lulu hypermarket, a leading supermarket in the UAE, stated that the plant-based milk market has grown by 50% in 2020. New market access Millennials and Gen Z are more likely to become vegetarians and vegans, as they are more environmentally aware and have a strong sense of social responsibility. Regarding their consumption, 63% of Gen Zers consume a vegetarian or vegan meal at least once per month, and 44% do so once a week or more. According to a 2022 report, 79% of millennials and Gen Zers are already regularly eating plant-based. In the United States, while only 2.5% of Americans over the age of 50 consider themselves vegetarians, 7.5% of Millennials and Gen Z have given up meat. Since future consumers are millennials and Gen Z, companies are focusing on offering products that appeal to them." The plant-based food industry is rapidly expanding and capturing a sizable market share; it also shows promising growth potential over the next 10 years. Therefore, now is the time for companies to innovate and develop plant-based alternatives. Interest in alternative proteins, for instance, is increasing globally, as plants have limited environmental impacts and are a healthy alternative filled with protein. Although alternative proteins accounted for only 2% of the world protein market in 2020, they are expected to reach 12% by 2035. Pea protein, for instance, grew at a 30% CAGR from 2004 to 2019. Animal protein will stay prevalent in the market; this, however, does not eliminate the room for plant-based foods to grow and solidify their place in the market. According to a Bloomberg study, the plant-based food market is estimated to hit $162 billion in the next 10 years. Author: Dina AlGarf Sources: https://www.theguardian.com/environment/2021/sep/13/meat-greenhouses-gases-food-production-study https://www.myclimate.org/information/faq/faq-detail/what-are-greenhouse-gases/ https://unece.org/challenge https://news.un.org/en/story/2018/11/1025271 https://www.cleanwateraction.org/features/meat-industry-%E2%80%93-environmental-issues-solutions https://www.bbc.com/news/explainers-59232599 https://www.sustain.ucla.edu/food-systems/the-case-for-plant-based/#:~:text=Now%2C%20for%20those%20of%20you%20worried%20about%20protein%20content%3A&text=From%20a%20water%20perspective%2C%20using,to%20eat%20plant-based%20foods. https://www.forbes.com/sites/christophermarquis/2021/03/02/plant-based-foods-are-our-future-and-entrepreneurs-are-helping-us-make-the-shift/?sh=7dbeae5351f5 https://insideclimatenews.org/news/21102019/climate-change-meat-beef-dairy-methane-emissions-california/#:~:text=Emissions%20from%20livestock%20account%20for,for%20grazing%20and%20feed%20crops. https://www.theworldcounts.com/challenges/consumption/foods-and-beverages/world-consumption-of-meat/story https://www.washingtonpost.com/world/interactive/2022/amazon-beef-deforestation-brazil/ https://www.livekindly.co/middle-easts-vegan-food-market-growing-fast/ https://assets.bbhub.io/professional/sites/10/1102795_PlantBasedFoods.pdf https://foodspecialities.com/industry-news/dairy-ingredients-industry-news/high-margin-growth-opportunities-with-plant-based-milks/ https://cultivateinsights.com/2019/07/22/alternative-meats-could-be-60-of-the-market-by-2040/ https://gfi.org/marketresearch/ https://thevou.com/lifestyle/2019-the-world-of-vegan-but-how-many-vegans-are-in-the-world/#:~:text=Right%20now%2C%20the%20total%20number,percent%20of%20the%20world%20population. https://foodinstitute.com/focus/veganuary-2022-coincides-with-growing-flexitarian-trend/#:~:text=Flexitarians%20are%20more%20flexible.&text=It's%20estimated%2015%25%20of%20the%20population%20already%20is%20flexitarian. https://tradeinsights.amys.com/millennial-gen-z-buying-habits-spell-growing-opportunity-for-plant-based/ https://www.visualcapitalist.com/sp/how-does-animal-meat-compare-to-plant-based-meat/ https://www.bloomberg.com/company/press/plant-based-foods-market-to-hit-162-billion-in-next-decade-projects-bloomberg-intelligence/ https://www.mordorintelligence.com/industry-reports/middle-east-and-africa-plant-based-meat-and-dairy-products-industry https://web-assets.bcg.com/a0/28/4295860343c6a2a5b9f4e3436114/bcg-food-for-thought-the-protein-transformation-mar-2021.pdf https://www.plantbasedfoods.org/marketplace/retail-sales-data-2020/ https://www.globenewswire.com/news-release/2022/05/18/2446161/0/en/Plant-Based-Meat-Products-Market-Size-Worth-US-14-527-55Mn-Globally-by-2028-at-15-3-CAGR-Exclusive-Report-by-The-Insight-Partners.html https://www.globenewswire.com/news-release/2019/10/14/1929284/0/en/Plant-based-Meat-Market-To-Reach-USD-30-92-Billion-By-2026-Reports-And-Data.html https://www.globenewswire.com/en/news-release/2022/08/16/2499600/0/en/Dairy-Alternative-Market-Size-to-Hit-USD-68-79-Billion-by-2030.html#:~:text=The%20global%20dairy%20alternatives%20market,11.8%25%20from%202022%20to%202030.

The COVID-19 pandemic accelerated technological advancements to a new level. On one hand, it embraced the work-from-home model, allowing employees to join meetings on online platforms; on the other hand, tech and gaming companies started innovating to provide entertainment experiences as the world was on restricted travel and lockdown. Gaming companies are looking to provide their customers with extended-reality gaming, immersive, and 3D experiences. These experiences are starting to merge with the professional world as companies are looking for new ways to make online meetings more interactive, and the “Metaverse” is a solution that can bridge online meetings with the immersive gaming experience. So, what exactly is the metaverse? And how can companies or businesses join the metaverse? This article discusses the three ways that businesses can gain access to the metaverse: by purchasing land on existing metaverses or by creating their own metaverse, either in collaboration with a developer or using a company's own internal IT team. For each access method, the costs are highlighted along with the requirements and steps to access the metaverse. Last but not least, examples of consulting companies joining the metaverse are provided. The metaverse can be seen as a simulation of the real world in a digital environment, where users can create their own avatars and perform activities (work, shop, interact, etc.) similar to those they would do in real life. The metaverse is destined to be an extension of the real world, not a replica of it. The term is composed of two main words: the prefix “Meta” (Beyond) and verse (Universe); a virtual universe beyond the real one. The metaverse builds on the Internet and requires technologies to enable it. Augmented Reality (AR), Virtual Reality (VR), haptic and brain-computer interfaces, intelligent sensors, cryptocurrency, blockchain, holograms, and digital twins are among the fundamental technologies necessary for the successful launch of the metaverse. How can businesses/companies access the metaverse? Businesses or companies can enter the metaverse via two major possibilities. The first one is to acquire a certain space on an already existing metaverse platform, and the second possibility is to partner with a tech company to create your own metaverse platform/software. According to Everyrealm, formerly known as Republic Realm, there are 4 pioneer metaverses in which you can acquire land: Decentraland, The Sandbox, Cryptovoxels, and Somnium Space. Decentraland is a multiplayer role-playing game developed by two Argentine software engineers. The world centers around a plaza called Genesis City, and all of the parcels (called “Land” in the game) except for roads and plazas can be bought, sold, and developed by the users of the game using “MANA,” Decentraland’s own crypto token, which has a fully diluted market capitalization of about $7 billion. Cryptovoxels is a virtual world built on the Ethereum blockchain by Nolan Consulting, an independent game developer based in Wellington, New Zealand. The main area is a large square continent called "Origin City," and the latter is further subdivided into neighborhoods. Cryptovoxels allows players to display their own NFTs on their property, suitable for art galleries to establish their footprint on the metaverse. The Somnium Space was founded by a Czech Republic-based team in 2017, and its land parcels are located along its river system and are of varying sizes, ranging from small to large. Somnium Cubes (CUBE) is the metaverse’s currency and is based on the Ethereum blockchain (ERC20). Somnium Space managed to forge several partnerships in its metaverse. For instance, Republic Realm built Republic Realm Academy, providing educational initiatives with a virtual classroom, HQ, and gathering spaces. Even though these metaverses might vary in terms of their structure or the currency used, according to Republic Realm, they share a number of defining characteristics: Virtual landowners are free to determine what to develop on their digital property Land can be bought and sold in primary and secondary sales on marketplaces like OpenSea and Rarible Players can spend time in the metaverse however they desire Each metaverse has a different number of total land parcels. The total value of all the land in a metaverse is roughly equal to the average price of a parcel multiplied by the total number of parcels (Republic Realm, 2022). Tables 1 and 2 show the total land area and its value. The prices are as of December 2021. Land prices were around USD 20 in December 2017 when Decentraland first held its land auction. In 2021, parcels were sold for an average of over USD 6,000. By the beginning of 2022, prices had increased to reach around USD 15,000 per land token (Influencer Marketing Hub, 2022). Metaverse Parcels and Land Area [caption id="attachment_8551" align="aligncenter" width="517"] Source: Republic Realm – 2021 Metaverse Real Estate Report[/caption] Metaverse Floor Price and Total Land Value [caption id="attachment_8552" align="aligncenter" width="506"] Source: Republic Realm – 2021 Metaverse Real Estate Report[/caption] To buy land, for instance, in the Sandbox metaverse, here are the steps to follow: Create an account on The Sandbox metaverse and connect a wallet to it. The purchased land will be stored in the secured wallet Purchase SAND tokens on the Binance platform, or buy Ethereum tokens and convert them to SAND tokens. Transfer the acquired SAND tokens to the Sandbox account Buy land on the Sandbox map by locating available land parcels. Premium lands are highlighted in yellow on the map Aside from these four pioneer metaverses and their available parcel lands, businesses can choose the second option: to build their own metaverse, either by partnering with tech companies specializing in metaverse development or by hiring the necessary staff. There are several metaverse development companies; some of the best include Maticz Technologies, LeewayHertz, Program-Ace, Antier Solutions, and Skywell Software. The cost to develop a metaverse platform starts at a minimum of USD 10,000 (Vandhana, 2022). However, the cost can vary depending on a number of factors, including the client's requirements and demands, the time it takes to develop, the industry, and so on. This being said, a metaverse project’s cost can scale up to USD 300,000 (Vartmann, 2021). In case a company would like to hire its own staff to develop a full internal and decentralized metaverse, according to Leewayhertz, the estimated cost is around USD 15,000 to USD 20,000 per month for a metaverse project with approximately 5 virtual rooms and 20 users for the visiting rooms. However, the development of such a request would require: A decentralized database 3-4 full-stack developers well-versed in React.js and Node.js 1 UI/UX developer 1 UNITY/UNREAL/CRYENGINE developer 3 3D modellers 1 decentralized wallet developer 1 decentralized DApp (Decentralized App) developer Initiatives launched by companies in the metaverse Besides the tech companies, such as Meta, Microsoft, Nvidia, etc., consulting companies are making their first moves toward the metaverse. KPMG, for instance, launched a metaverse collaboration hub in the US and Canada where employees, clients, and communities will connect, engage, and explore opportunities for growth across industries and sectors (KPMG, 2022). Prior to that, PwC Hong Kong acquired a land parcel in the Sandbox metaverse (Animoca Brands, 2021). However, the consulting firm did not reveal the location of the land it purchased or the parcel’s cost. Furthermore, Accenture partnered with Microsoft to develop its metaverse, called the “Nth Floor.” It has digital twins of real offices or research labs. Also, Accenture established a virtual campus inside its metaverse, “One Accenture Park”, which the consulting firm uses for onboarding new hires (Microsoft, 2022). The metaverse is gaining considerable interest and is continuing to grow. According to Fortune Business Insights, the global metaverse market was valued at USD 63.83 billion in 2021. This market size is expected to reach a forecasted value of USD 1.58 trillion by 2029, growing at a CAGR of 47.6%. Besides the increased investment coming from venture capital and private equity firms, mergers and acquisitions, and internal corporate investment, other factors such as the ongoing technological advances (5G, mixed reality, blockchain, etc.) and the increased stakeholder (gamer) readiness contribute heavily to the potential value creation in the metaverse, which is expected to generate up to USD 5 trillion by 2030 (McKinsey & Company, 2022). Author: Mohamed Kamal Zaraba Sources: https://elearningindustry.com/will-the-metaverse-benefit-the-elearning-industry https://www.techtarget.com/whatis/feature/The-metaverse-explained-Everything-you-need-to-know https://www.forbes.com/sites/cathyhackl/2021/05/02/defining-the-metaverse-today/?sh=3eceff1c6448 https://www.techopedia.com/definition/34708/metaverse https://mobidev.biz/blog/metaverse-technology-business-application-development https://s4709.pcdn.co/wp-content/uploads/2022/01/Republic-Realm-2021-Metaverse-Real-Estate-Report.pdf https://stealthoptional.com/crypto/what-is-sandbox-metaverse-why-sand-token-price-increasing/ https://ethereum.org/en/what-is-ethereum/ https://www.investopedia.com/news/what-erc20-and-what-does-it-mean-ethereum/ https://dev.stealthoptional.com/how-to/what-is-metaverse-land-how-to-buy/ https://medium.com/sandbox-game/introducing-the-sandbox-land-presale-4-premium-lands-and-assets-d4044b51325#1f92 https://apnews.com/article/technology-blockchain-virtual-worlds-d6e33662ef81df064161705523163f6f https://maticz.com/metaverse-development-company https://www.leewayhertz.com/metaverse-development-company/ https://program-ace.com/expertise/metaverse-development-services/ https://www.antiersolutions.com/metaverse-development/ https://skywell.software/metaverse-development/ https://www.linkedin.com/pulse/how-much-does-cost-build-metaverse-nithi-vandhana/?trk=pulse-article https://insidetelecom.com/top-seven-companies-developing-the-metaverse-in-2022/ https://info.kpmg.us/news-perspectives/technology-innovation/kpmg-us-canada-metaverse-collaboration-hub.html https://www.coindesk.com/markets/2021/12/23/consultants-are-entering-the-metaverse-literally/ https://www.animocabrands.com/the-sandbox-welcomes-pwc-hong-kong-to-the-metaverse https://www.microsoft.com/en-us/worklab/podcast/the-future-of-onboarding-with-accentures-paul-daugherty#:~:text=Accenture's%20metaverse%20includes%20some%20spaces,new%20employees%20go%20for%20onboarding https://influencermarketinghub.com/metaverse-virtual-real-estate/ https://www.fortunebusinessinsights.com/metaverse-market-106574 https://www.mckinsey.com/~/media/mckinsey/business%20functions/marketing%20and%20sales/our%20insights/value%20creation%20in%20the%20metaverse/Value-creation-in-the-metaverse.pdf

In recent years, artificial intelligence (AI) has become a prominent topic of conversation. Advances in other frontier technologies, such as cloud computing, big data, the Internet of Things (IoT), and virtual reality, have led to some major breakthroughs in artificial intelligence. Aside from the financial and societal benefits of AI applications, the technology is also set to revolutionize environmental sustainability. Scientists argue that one of the main challenges to environmental sustainability is understanding how the ecosystem works, given the number and complexity of interactions within it. The amount of information available is simply too large to be analyzed by the human brain or traditional statistical tools. Using advanced tools and technologies can help us understand the impact of the ecosystem on us and vice versa. Sensors enable the collection of large amounts of data, while AI can help analyze this data and build models to help navigate these complexities and make agile decisions in uncertain and volatile conditions. Impact of AI on the ecosystem and environmental management: Technologies such as AI and IoT are expected to drive progress in most areas of ecology and biodiversity research, as well as environmental and ecosystem management. Motion-sensing cameras can collect very large amounts of biodiversity data Motion-detector cameras enable the low-cost and widespread collection of massive amounts of biodiversity data. Analyzing biodiversity images used to be time-consuming, but a recent article in the journal Proceedings of the National Academy of Sciences showed that AI was successful in automating animal identification for 99.3% of the 3.2 million animals, with the same level of accuracy (96.6%) as the crowdsourced groups of human volunteers. The authors of the article state that "the automatic, accurate, and economical collection of data could catalyze the transformation of many disciplines, from ecology, wildlife biology, zoology, conservation, and ethology, into “big data” sciences. Drones equipped with AI technologies can fight deforestation and poaching The use of drones equipped with AI technology can help reduce deforestation and poaching. For instance, the World Wide Fund for Nature (WWF) in Kenya received a US$5 million subsidy from Google to use an AI device equipped with drones to track poachers in the Masai. Impact of AI on Water Management Although AI applications are limited to select cases in the operational water sector, machine learning algorithms are increasingly being used in water science. For instance, the Centre for Water for Sustainable Development and Adaptation to Climate Change, a UNESCO-affiliated organization, has been utilizing AI and statistical modeling to enhance the quality of time-series data in structural and environmental monitoring in Serbia for years. Deep learning, a subset of machine learning, is one of the most crucial methods. Deep learning can be used as a predictive tool to detect patterns, classify and correct remote sensing products, or mitigate risk. An example of a deep learning application for water management is using Echo State Networks (ESN) to provide discharge forecasts and water-level simulations on the Rhine and Danube Rivers in Germany, which provided better results than the existing traditional hydrological model. Internet of Things, machine learning, and blockchain can be combined to support urban water management The Internet of Things, machine learning, and blockchain technology can all be used to improve urban water management. Using these three technologies can improve service provision and quality while protecting the sustainability of water resources. Smart water systems, which use an Internet of Things-based approach, are gaining traction in urban water resource management. These smart systems are composed of a network of physical devices (such as the flow meter), a sensor that records data (such as water amount and quality, pictures, etc.), and a communication device that transmits this data in real time to a cloud-based server. Smart water systems improve efficiency and reliability while reducing costs. Impact of AI on Disaster Risk Reduction AI to prevent disasters Many concepts and prototypes for catastrophe risk mitigation have previously been tested. Thus far, they have mainly focused on the response and rescue phases. Sendai, Japan, for example, has tested a prototype with private companies for a tsunami alert using AI and Blockchain technology, in which the AI system launched a drone, sent an alert via mobile phones and radios, and used facial recognition software to identify survivors, such as individuals drifted in a vehicle by a tsunami wave. AI to manage hydrological hazards A variety of innovative modeling systems are being evaluated for their capacity to accurately forecast drought events. Such models are: Artificial Neural Networks (ANN), Adaptive Neural-based Fuzzy Inference Systems (ANFIS), Genetic Programming (GP) and Support Vector Machines. Currently, the downside to using AI for drought management is the lack of “big data” needed to design models that can make reliable predictions. AI to improve climate change assessment Studying the climate and identifying high-risk areas require large amounts of data, ranging from images to sensor data. Machine learning algorithms can help mitigate and manage climate change effects by improving the accuracy of global climate models and predictions. For instance, extreme weather events such as wildfires and hurricanes can be predicted by analyzing data from satellite images and weather station data in real-time. New research indicates that artificial intelligence and neural networks can also address more complex, smaller-scale meteorological phenomena, such as convective cloud production. As a result, they may be able to mitigate the uncertainties inherent in existing climate models. By enhancing the accuracy of global climate predictions, AI and machine learning algorithms can help mitigate and manage the risk of catastrophic weather events such as tornadoes, hurricanes, and storms, which are anticipated to become more frequent and severe in the future. Impact of AI on Agriculture AI-based solutions can enhance efficiency in the agricultural sector in practices such as crop yield, irrigation, soil content sensing, crop monitoring, weeding, and crop establishment. AI-based technological solutions can enhance the sector’s resource efficiency by reducing the use of land, water, fertilizers, and pesticides while also enhancing output quality and ensuring a faster time to market for produced commodities. Smart Farming Using drones, cameras, and sensors along with AI to scan plantations and detect pests, identify areas that are either excessively or poorly irrigated, and intervene more quickly eliminating the need for expensive and fuel-polluting helicopters to monitor the fields. Robots or drones can help with field inspection and early detection of crop diseases, making the process more effective and ensuring future food security. Weed control can also be significantly enhanced using solar-powered robots that can detect weeds and pull them out mechanically (without chemicals). All these developments are providing farmers with the tools to observe, measure, and analyze the needs of their farms, allowing for improved resource management while reducing environmental impact and waste. The use of artificial intelligence (AI) in environmental sustainability has the potential to significantly improve our understanding of and ability to manage the ecosystem. AI-enabled technologies such as motion-sensing cameras and drones can be used to collect and analyze large amounts of biodiversity data, while machine learning algorithms can be used in water science to improve quality and forecast discharge and water levels. In addition, the combination of the Internet of Things, machine learning, and blockchain technology can improve urban water management. AI can also be used in disaster risk reduction by predicting and mitigating the impact of natural disasters such as earthquakes, hurricanes, and floods. AI can also help enhance the agricultural sector’s resource efficiency and reduce its impact on the environment. With all these advancements in AI applications, it is important to carefully consider the ethical implications of using AI for environmental sustainability and ensure that the technology is used in a responsible and transparent manner. Author: Ismail El bouni Sources: AI - A game changer for Climate Change and the Environment Artificial intelligence for sustainable development: challenges and opportunities for UNESCO’s science and engineering programmes Automatically identifying, counting, and describing wild animals in camera-trap images with deep learning Quel sera l’impact de l’intelligence artificielle sur l’agriculture ? Smart Farming Using Artificial Intelligence, the Internet of Things, and Robotics: A Comprehensive Review Implementation of artificial intelligence in agriculture for optimization of irrigation and application of pesticides and herbicides BI Survey Autonomous Battery Optimization with Machine Learning, Robotics Robots and AI Could Optimize Lithium-Ion Batteries MIT: On the road to cleaner, greener, and faster driving

As with most industries, digitization and increasing automation have revolutionized the automotive industry, giving rise to four major disruptive technological trends: electrification, autonomous driving, shared mobility, and connectivity. These trends, combined with demand and supply challenges such as declining purchasing power, increasing inflation, rising fuel prices, and reliance on Chinese supply, are putting pressure on automotive players to reconsider their current business models. Since the invention of the automobile, the sales model has remained mostly the same. In the early 1900s, multiple distribution models were attempted in the auto industry; however, by the 1950s, the dealership model had proven to be the most effective for distributing automobiles. In this model, the manufacturer builds the vehicles and then sells them to dealers, which act as retailers and service providers. Traditional sales models, however, have undergone fundamental changes in recent years as e-commerce and industry leaders revolutionized the purchasing process. Currently, new automotive players, such as EV startups, have started to adjust their sales model to adapt to evolving buying behaviors. Since 2016, EV pioneers like Tesla have been combining their city showrooms with their online stores, providing their customers with a simple interface and a brand-new purchasing experience when compared to traditional sales models. The agency sales model: transforming the automobile purchase journey The agency sales model can be considered the evolution of the traditional three-tiered sales model towards an integrated online/offline sales model. In that sense, the vehicle manufacturers interact directly with the customers and assume all sales responsibilities. The dealers still play a decisive role in this model, but they act only as agents and only retain activities that require physical interaction, such as the execution of test drives and handling of service appointments. The traditional sales model players, which include dealerships and national sales companies (NSCs), remain present in the agency model but are there to provide a superior omnichannel customer experience, allowing OEMs to establish a 360° customer view, resulting in increased cross-selling and market transparency. Likewise, certain roles and responsibilities are transferred from the dealer to the manufacturer. The dealer’s financial risk can be reduced while gaining full access to the national car inventory and shortening delivery times. [caption id="attachment_8493" align="aligncenter" width="608"] Figure 1 - Traditional sales model (three-tiered, mainly offline) vs agency sales model[/caption] Automotive retailing: a shift toward e-commerce The online car buying market refers to the end-to-end purchase of vehicles through online platforms. This offers customers accessibility and ease of shopping from home, more visibility on pricing, and digital and secure payment processes. Online vehicle sales have increased significantly in recent years. The global online car buying market was valued at $237.93 billion in 2020 and is projected to reach $722.79 billion by 2030. This market was not triggered by the pandemic in 2020, but rather is the result of the accelerated digitalization of car manufacturers and a shift in mindset and consumption behavior. According to BCG projections, it is expected that online billing & payment transactions will account for 5-7% of new vehicle sales in 2025 and up to 33% in 2035. In terms of market share, Tesla continues to be the leader in direct sales, along with “Polestar”, which provides a mature online interface that challenges Tesla. [caption id="attachment_8494" align="aligncenter" width="621"] Figure 2 - Projected Growth in Online Sales of News Cars Around the World[/caption] Online aftermarket sales: the rise of a new sales channel The online automotive aftermarket is a secondary market accessed through e-commerce databases that sell almost all automotive spare parts, marketing services, and auto-related services. Since the pandemic, the automotive aftermarket has registered an important evolution led by multiple trends, which can be perceived through the continuous global demand for used vehicles, auto parts becoming more sophisticated, and consumers holding onto their cars because of the financial downturn caused by the pandemic. The whole automotive aftermarket sector (online & offline) is expected to grow from about $380 billion in 2021 to $449 billion in 2023. Moreover, the COVID-19 pandemic, along with the global disruption of the automotive supply chains, is acting as the main factors affecting buying behavior and leading a growing number of consumers toward the online aftermarket. In that sense, according to Hedges & Company, online sales totaled $16 billion in 2020, a 40% increase from $7.4 billion in 2019 (figure 3). Similarly, business-to-consumer mobile sales also saw a significant increase in recent years, accounting for approximately 50% of all online auto part sales in 2020, an increase of 35% compared to the previous year. Currently, the online aftermarket channels are being led by new players such as Car Parts and Mister Auto, whose business models are 100% online. Likewise, automotive manufacturers are also starting to respond to the current industry disruption by cooperating with online players to sell their parts and accessories. [caption id="attachment_8495" align="aligncenter" width="552"] Figure 3 - Business to consumer online Sales in USD Billions[/caption] Growth of e-commerce automotive aftermarket The trend of consumers looking for aftermarket products online has been accelerated by pandemic restrictions and the accelerated drive toward digitization in 2020 and 2021, which helped online sales channels increase their penetration rates (figure 4). The trend was most noticeable in the parts and accessories segment, which includes enthusiast and general maintenance DIY brands that experienced a sustained increase in sales in 2021. [caption id="attachment_8496" align="aligncenter" width="567"] Figure 4- e-commerce Penetration in the Automotive Aftermarket[/caption] Ultimately, a growing number of customers sought alternative channels for a variety of products, despite the fact that retailers were deemed essential service providers and operated during multiple shutdowns. As a result, retailers have been accelerating their digital solutions projects by improving e-commerce functionality and adding new shopping options, such as curbside pickup and faster home delivery. The automotive industry is experiencing major changes in its landscape with digitization, electrification, and the complexity of the global market. Leading global players, including suppliers, OEMs, and new entrants, are already innovating their business models to adapt to the extremely competitive ecosystem. Even though the industry's online penetration has increased in recent years, there are still plenty of opportunities for leaders to seize. Success in 2030 will require automotive players to prepare for uncertainty, leverage partnerships (e.g., around infrastructure for autonomous and electrified vehicles), and reshape their value propositions. Concurrently, aftermarket players must improve their e-commerce strategies due to a greater emphasis on digital presence, as shoppers are becoming more accustomed to online channels due to the increased breadth, convenience, and ability to find exact specifications over traditional ones. Finally, as suppliers and retailers focus more intently on digital strategies to address consumer purchasing behavior, the e-commerce channel will continue to grow at an exponential rate in the automotive aftermarket. Author: Yassine Falk Sources: https://www.mckinsey.com/industries/automotive-and-assembly/our-insights/disruptive-trends-that-will-transform-the-auto-industry https://europe.autonews.com/guest-columnist/how-auto-industry-revolutionizing-its-sales-model https://home.kpmg/xx/en/home/insights/2022/08/changing-times-new-business-models-pose-challenges.html https://www.capgemini.com/wp-content/uploads/2021/09/Automotive-Agency-Sales-Model_POV_Capgemini-Invent.pdf https://www.alliedmarketresearch.com/online-car-buying-market-A10067 https://www.jefferies.com/CMSFiles/Jefferies.com/Files/IBBlast/Industrials/IB-Autocare-2021-Review-and-Outlook.pdf https://f.hubspotusercontent20.net/hubfs/6890475/PDF-Premium-Downloads/Automotive-Aftermarket-2022-Report-Valtech-Absolunet-V2.pdf https://www.statista.com/statistics/1199431/online-car-sales-share-in-selected-markets-worldwide/ https://www.simon-kucher.com/sites/default/files/2022-02/Brochure_Automotive-Study-2022.pdf https://www.precedenceresearch.com/aftermarket-automotive-parts-market https://www2.deloitte.com/content/dam/Deloitte/global/Documents/Consumer-Business/us-2022-global-automotive-consumer-study-global-focus-final.pdf https://www.globenewswire.com/en/news-release/2021/11/03/2326186/0/en/Global-E-Commerce-Automotive-Aftermarket-is-Anticipated-to-Reach-USD-132-75-billion-by-2028-Fior-Markets.html#:~:text=E%2Dcommerce%20automotive%20aftermarket%20provides,served%20by%20the%20market%20players. https://www.mckinsey.com/industries/automotive-and-assembly/our-insights/disruptive-trends-that-will-transform-the-auto-industry/de-DE

Female entrepreneurship in developing vs. developed countries Studies have shown that empowering women to participate equally in the global economy could add up to $28 trillion in GDP growth by 2025. Many global indicators can be used to assess the level of women’s empowerment across developed and developing economies. Observing the growth in the number of female entrepreneurs is a great sign of women’s empowerment. The more women have access to equal opportunities, the more developed a country can be, and the easier it is to reduce any existing inequalities that can slow down the economic growth of a nation. To determine disparities in female entrepreneurship, 2020 data from the World Bank was used to compare the number and characteristics of firms among benchmark countries using the share of female entrepreneurship among the firms surveyed. The countries chosen for this observation are Egypt, Tunisia, Morocco, the Netherlands, Belgium, and Finland to show where developing countries stand in comparison to more developed countries. As shown in the pie chart below, Finland and Belgium, both developed economies, appear to have the highest number of firms with female participation in ownership. On the contrary, Egypt has the lowest number of firms with female participation in ownership. The World Bank Enterprise survey shows that 44.2% of firms surveyed in Finland are owned by women, compared to 5.2% of firms surveyed in Egypt. These results show the disparities in the progress made toward the empowerment of active females in the labor market. Another important point to note is the fact that Egypt, Tunisia, and Morocco all have lower shares of female entrepreneurship compared to Finland, the Netherlands, and Belgium. In other words, it can be pointed out that economic and social development play a vital role in increasing the number of female entrepreneurs and encouraging more women to start their own business ventures. Figure 1: Percentage of firms surveyed with female owners [caption id="attachment_8472" align="aligncenter" width="542"] Source: World Bank Enterprise Survey 2020[/caption] In many areas, women lack access to an entrepreneurial environment, social and institutional support, equal educational opportunities, and financial support programmes. Digging deeper, the literacy rates in the selected countries can show the knowledge and human capital gap between developed and developing countries. Figure 2: % of females who can both read and write [caption id="attachment_8473" align="aligncenter" width="490"] Source: Global Gender Gap Report 2020 - The World Economic Forum[/caption] Based on that, education levels and enrollment rates directly impact women’s economic participation rates. This can be seen in the graph below: Figure 3: Female Labor Force Participation Rates [caption id="attachment_8474" align="aligncenter" width="492"] Source: World Bank[/caption] The idea here is to show the correlation between female entrepreneurship, education levels, and labor force participation rates. The two chosen indicators prove the positive relationship between education, female labor force participation rates, and female entrepreneurship. This highlights the importance of policies aimed at increasing literacy rates and female economic participation, which can eventually help reduce the gender gap in entrepreneurship rates in both developed and developing countries. Lessons to learn from policies implemented in developed countries As a result of more women joining the workforce, public policy has focused on supporting women’s entrepreneurship since the 1970s. Since then, both developed and developing nations have adopted common policies and programmes aimed at promoting women's entrepreneurship. Despite substantial improvements in aiding women to overcome barriers to starting their own enterprises and working for themselves, women continue to face challenges, demanding further and more inclusive public policy action. Developing countries can observe and track effective policies implemented in developed countries that would enable the increase of female economic participation and, more importantly, female entrepreneurship. The gender gap in entrepreneurship can be reduced with the presence of profound measures and support programmes targeted at encouraging women’s economic participation. Examples of successful policies include: Finland: The Equality Programme includes providing loans to small companies, counseling, training, and establishing an entrepreneurs' mutual assistance network. This draws attention to the importance of access to finance for women entrepreneurs. European Union: The European Union's structural funds support numerous initiatives promoting women's employment. For instance, the Structural Funds' programmes aim to encourage female entrepreneurs, keep unemployed people engaged in the workforce, make it easier for people to re-enter the workforce, and enhance skills. European Union: The Entrepreneurship 2020 Action Plan calls for awareness-raising, entrepreneurship training, improved access to financing, stronger networks, and support in reconciling business and family life. The Programme revolves around 3 pillars: investing in entrepreneurial education, reducing financial burdens by improving access to finance, and recognizing and providing awards to role models. Sweden: The ‘Women Ambassadors’ scheme was set up to (i) increase the visibility of female entrepreneurship; (ii) inspire female entrepreneurship through personal stories and role models;(iii) make it easier for women to identify with entrepreneurial role models; (iv) encourage more women to view entrepreneurship as a potential career; and (v) help women address their entrepreneurial challenges by sharing their experiences. The programme ambassadors have reached more than 170,000 women in approximately 11,000 activities. The survey of the programme’s participants and ambassadors has shown that the participants had more interest in entrepreneurship after meeting an ambassador. Belgium: Young Company initiative aims to give students experience that closely resembles managing a business in the real world. The concept is built on the foundation of a joint-stock firm. This gives young people the chance to work in a variety of firm positions, including those of director and HR manager, among others. Young Company aims to reach children in secondary schools. Currently, policies related to women’s empowerment are not sufficient to overcome the low levels of female entrepreneurship in developing countries. It is also worth noting that allowing women to engage in growth possibilities will help developing nations speed up their economic and social development. Around the world, female business owners significantly contribute to economic growth and the eradication of poverty. Women-owned businesses, for instance, are growing more than twice as quickly as all other businesses in the United States, contributing close to $3 trillion to the national economy and directly supporting 23 million job opportunities. Progress is also taking place in developing countries, where there are between 8 million and 10 million formal small and medium enterprises (SMEs) with at least one female owner, and this number is rising. Studies have also shown that eliminating gender disparities in the workforce could increase the global GDP by 26%, benefiting both developed and developing nations. Globally, women continue to face significant obstacles that hinder the growth of their businesses, such as a lack of capital, strict social constraints, and limited time and skill. Despite the increase in education and school enrollment among women, they tend to lack the combination of education, vocational training, and skills required to promote the growth of highly productive firms. Regarding access to finance, the World Bank showed that 190 million fewer women than men own bank accounts. Therefore, achieving women’s empowerment is a vital step toward reducing gender inequalities and ensuring equal access to opportunities for all. Both the private and public sectors should create incentives to encourage investments in women-owned businesses to help accelerate women’s entrepreneurship. Reforms and policies that promote and encourage women’s entrepreneurship and economic participation should also be more common to achieve economic growth and reduce the global gender gap. More training programmes should be available for women who wish to start their own business ventures, allowing them to accumulate the managerial, financial, and technical skills needed to adapt to a business environment driven by technological advances. Author: Hebatallah Mohamed References: World Economic Forum: https://www.weforum.org/agenda/2018/01/this-is-why-women-must-play-a-greater-role-in-the-global-economy/ World Bank Enterprise Survey: https://www.enterprisesurveys.org/en/enterprisesurveys Labor Force Participation Rates: https://data.worldbank.org/indicator/SL.TLF.TOTL.FE.ZS?locations=EG Global Gender Gap Report 2020 - The World Economic Forum: https://www3.weforum.org/docs/WEF_GGGR_2020.pdf Equality Programme of The Finnish Government: https://www.un.org/womenwatch/confer/beijing/national/finisnap.htm European Commission Entrepreneurship2020 Action Plan : https://www.eesc.europa.eu/sites/default/files/resources/docs/entrepreneurship2020---action-plan.pdf Women Ambassadors, Sweden: https://betterentrepreneurship.eu/en/content/women-ambassadors-sweden?q=/printpdf/919 Entrepreneurship education in Belgium: https://www.schooleducationgateway.eu/downloads/entrepreneurship/Belgium_151022.pdf Female Entrepreneurship Resource Point - Introduction and Module 1: Why Gender Matters: https://www.worldbank.org/en/topic/gender/publication/female-entrepreneurship-resource-point-introduction-and-module-1-why-gender-matters Council on Foreign Relations: https://www.cfr.org/womens-participation-in-global-economy/

No one can disagree that Netflix is the king of streaming right now, a well-deserved place crowned by the many achievements it has accomplished since its inception, most notably bringing streaming media to the forefront. However, its path was not paved with gold. Throughout the two decades and a half of its life, it has known many challenges. In this article, we will delve into the streaming services scene, looking at it through Netflix’s lens, examining how it evolved over time, how it changed the entertainment industry landscape, and finally, exploring some possible scenarios for the streaming world’s future. Birth of the Video-on-demand (VOD) streaming world Contrary to popular belief, the first popular streaming service was not Netflix. That title belongs to YouTube, which started streaming videos on its platform in 2005. There have been many small tech organizations that may have done streaming on their own network, but with limited success. Netflix, on the other hand, started offering its iconic service two years later, in 2007. Still, for all intents and purposes, and given the different business models of the two businesses, over the next few paragraphs, we will often refer to Netflix as the “first” VOD streaming service. Netflix was the brainchild of two entrepreneurs, Reed Hastings and Marc Randolph; they launched their company in 1997, right in the middle of the internet bubble, where anything “.com” was almost guaranteed to be a success. It was in this scene that Netflix was introduced. When the Internet bubble burst, it all came tumbling down. Surviving it was the first hurdle that the nascent company had to overcome. With Marc Randolph as its helmsman, he steered the ship into the 2000s. By that time, the company was hemorrhaging money; its video-on-demand business model was bleeding it dry, a challenging problem that was the catalyst for its current subscription business model. Instead of renting DVDs, which would have had to generate 15 to 20 rent-outs for the company to break even, the company shifted to a recurring business model—the subscription model—which allowed it to lock customers in, resulting in a much higher conversion rate. Its second innovation was the queue system, where customers would select the movies they would like to watch next. This had two major consequences: it reinforced the customer conversion rate and justified the elimination of late fee charges since subscribers were more eager to receive their next film. David and Goliath During its early years, Netflix was not profitable; it attained that status much later, in 2006, to be precise. To alleviate the financial pressure, they sought out Blockbuster, which was a DVD rental giant back in its heyday and an icon of the 90s. When Netflix’s founder proposed the sale of 49% of the company’s stake for 50 million USD, Blockbuster declined the offer. Today, Netflix is valued at 106 billion USD, while the former giant has atrophied to a single store in Bend, Oregon, a true modern David, and Goliath story. The streaming wars The most prominent players: The word “wars” might seem a bit dramatic here, but once we delve deeper into the ins and outs of that period of time, which saw the clash of industry titans, no words can be more befitting. However, before we move into that, we will be introducing the main players on the scene that have shaped or are shaping the current landscape: Netflix: Netflix needs no introduction; it has already etched itself a name in the history of entertainment, from its humble beginnings to becoming a household tech/media company with an offering of over 17,000 titles internationally. On the artistic front, the company boasts 182 Emmy awards for its Netflix originals (between 2013 and 2022) and 16 Oscars as of the moment of writing this article. Prime Video: Prime Video is a subscription video on-demand over-the-top streaming and rental service from Amazon. The streaming service prides itself on having a catalogue of a staggering 24,000 movies and over 2,100 shows to choose from. Much to the delight of its viewers, the platform’s offering will be nourished thanks to the recent deal that Amazon struck to acquire MGM in May 2021. They will be able to enjoy popular franchises such as “Rocky”, “James Bond”, and "The Real Housewives". Not to mention the latest installment of the Lord of the Rings universe, “The rings of power”, a series that cost the studio a shocking 1 billion dollars to produce, an investment that will be detrimental to the studio’s future, according to a company insider. Apple TV+: Another giant that decided to foray into the streaming service world, launching its service in November of 2019, Apple is set on carving itself a piece of that cake, and so far, it seems to be doing just right. A reflection of its success can be seen in the 2022 Oscar ceremony, where the company made history with “CODA” winning Best Picture, a first for any streaming video company. Not to mention that the company has the highest average IMDB score among its peers, standing at a 7.08 IMD average, which might be largely due to its limited library of content, but if the recent awards that the company garnered are anything to go by, the platform seems to be focusing more on quality than quantity. Disney+: Following in the footsteps of Apple TV+, a long overdue step for Disney, they announced their own streaming service, Disney+, in November of 2019, the same month as Apple. The two-year-old platform has become a streaming behemoth in its own right, offering around 500 films, 15,000 episodes, and 80 Disney+ originals (UK Disney+ offering), allowing viewers to access some of the most beloved franchises (e.g., Marvel, Star Wars, Pixar, and so on). HBO Max: HBO Max has been around for only two years, but it has capitalized on the legacy of its namesake, “HBO”, a household name in the entertainment industry that has been around for decades. With many productions being generational defining pop cultural icons, such as “The Sopranos”, “The wire”, “Game of Thrones”, and the current crown jewel, “House of the dragon” which got off to a very good start and seems to be going full steam ahead with HBO reporting a record-breaking 25 million viewers for its first two episodes, and with more series being developed in the fantasy world created by George RR Martin, HBO Max’s star can only shine brighter. Not to mention the planned merger with the discovery+ streaming service, which will bring a whole new catalog to the service along with its subscribers. The late mouse gets the cheese: Until recently, Netflix enjoyed its position as the undisputed king of the streaming world, well ensconced on its throne, until the big studios realized the potential of the market; this paved the way to the so-called “streaming wars”. Prior to 2018, consumers had to navigate a limited offering of streaming services, mainly Netflix, Amazon prime, and Hulu, plus a few smaller niche players. However, the arrival of Disney + and apple TV+ changed the scene dramatically, with both capturing huge market shares and leaving Netflix hanging by a thread. This culminated in the company announcing its first negative subscriber growth for the first time in a decade, a hiccup that was further compounded by the news that, in the last quarter (Q3 2022), Disney edged past Netflix’s total number of subscribers with a total of 221 million subscribers. Although this total includes Disney+, ESPN+, and Hulu subscribers, it is a significant blow to Netflix, which has held first place for far too long than any real competition would allow. *Data for Amazon video prime is based on a late 2021 amazon announcement, * Data for Disney+, ESPN+, Hulu are from Disney’s Q3 2022 earning call, *Netflix numbers from Q2 2022 earning call, *HBO & HBO max numbers are from Q1 2022, * Apple provided few financial details about Apple TV+, the number in the chart is an estimate, Streaming services: A new age At first, the streaming service world seemed like the perfect cure for a sickness that plagued cable TV: fragmentation. There were too many cable TV providers for consumers to choose from and not enough money to spend. Then came the likes of Netflix, a much-needed solution to a problem that overstayed its welcome. By producing and licensing productions from various companies, it provided the most extensive catalogue to consumers. This strategy was going Netflix’s way for a while, until the major media conglomerates realized that they could get a piece of the streaming cake. Streaming platforms started to mushroom all over the place, fragmenting the market further and further, going full circle to the point that started all of this, and putting strain on consumers and even more stress on streaming companies that would have to fight for market share. In the face of rising competition, companies are trying new avenues to distinguish themselves, some of which are: Investing in content: in the streaming world, content is king, which is why so many companies are spending literal billions to reinforce their existing catalogs. To that end, Disney is the forerunner, spending approximately $33 billion, followed closely by Netflix, which is allocating a budget of $19 billion for its TV shows and movies; meanwhile, the other industry giant, prime videos, seems to have budgeted $13 billion in 2021, whereas Apple is very cagey about its budget for its TV shows and movies. One thing is certain: whatever that budget is, Apple would be able to afford it. Ad tiers: In an effort to stem the losses sustained last quarter, Netflix is intending to launch a cheaper ad-supported tier. The new offer was set to be available starting 2023, but in light of the recent announcement by Disney, which is planning on launching the same product for its streaming platform Disney+, Netflix has advanced its release date to November in an effort to get ahead of Disney+’s planned launch. Raising prices: According to BBC news, the price of ad-free Disney+ will increase by 38% to $10.99, a $3 per month increase starting in December. The same thing is true for Hulu, where prices for the offering without ads will rise by $2 per month, from $12.99 to $14.99. As for Netflix, the service’s basic plan now costs $9.99 per month (up from $8.99), its standard tier costs $15.49 per month (up from $13.99), and its 4K tier costs $19.99 per month (up from $17.99). All in all, whether those price increases would prove fruitful or push consumers away is yet to be seen. The least that can be said about the streaming industry right now is that it has already entered the second phase of the streaming war. Unlike the first phase, which was characterized by the launches of new streaming platforms left and right, this new phase seems to be of a different nature; it is more fitting to call it a war of attrition. With many platforms being backed by industry giants such as Disney +, Prime Video, and Apple TV+, companies that can withstand a prolonged war thanks to their diversified portfolios and deep pockets (Disney has already stated it plans to lose money on Disney+ until 2024), this puts Netflix in a delicate position. Depending on streaming as its main source of income and being deprived of its popular licensed products, the future looks uncertain for the streaming giant. Author: Badr Kamli Sources: Was Netflix the First Streaming Service? - DIY SmartThings The Netflix Revolution - History of Netflix (2022 Updated) (vdocipher.com) I visited the last Blockbuster and it was a blast from the past (ktla.com) As the streaming wars enter phase 2, TV takes inspiration from the past (newatlas.com) Disney edges past Netflix in streaming subscribers as it raises ad-free prices | Walt Disney Company | The Guardian FY2022_Q3_PR_Ex99.1 (thewaltdisneycompany.com) Emmy Awards: Netflix nominations and wins 2013-2022 | Statista What Is Amazon Prime Video? a Breakdown of Everything You Need to Know (businessinsider.com) Twitter / Twitter Apple TV+ has highest average IMDb score of any streaming service | iMore Which streaming service is the best value for money? | Self. ‘Succession’ Wins Best Drama at Emmys as HBO Triumphs Again - The New York Times (nytimes.com) Investors alarmed as streaming services lose their magic touch | Netflix | The Guardian What the Top 7 Streamers Will Spend on Content in 2022 | IndieWire Yes, Netflix just got even more expensive - The Verge

After years of being hyped as a possible game-changer and touted as the fuel of the future, green hydrogen is now recognized as a crucial component of any realistic net-zero economy in the long term by both governments and investors. While energy transition plans were slowly taking shape, particularly in Europe, recent events have created a golden opportunity for a more rapid rollout of green hydrogen. The ongoing Ukraine-Russia conflict and its implications for energy dependence have forced European nations to rethink their priorities and sparked a frenetic race to secure new energy alternatives other than Russian-controlled gas supplies. In fact, it didn’t take long for these opportunities to materialize. As part of the RepowerEU strategy, the EU set a target of 10 million mt/year of green hydrogen imports by 2030, in addition to its domestic hydrogen production target of 10 million mt/year. With this massive import opportunity, Africa seems poised to realize its green hydrogen potential. Green hydrogen, fueled by renewable energy, now accounts for 4% of total world hydrogen production. It can be used in several sectors and industries, including refineries, to produce ammonia. Automobile manufacturers have also set their sights on this kind of energy. The market for hydrogen fuel cell electric vehicles is booming, with stiff competition to get enough range for the end user. An overview of Africa Africa stands out as the region with the greatest potential for green hydrogen. Not only is the continent in desperate need of energy infrastructure investment, of which renewables and green hydrogen could represent the lion’s share, but many African countries present unique competitive advantages and environmental characteristics for cheap and reliable energy production. According to H2 Atlas-Africa, wind and solar energy in West Africa could generate up to 165,000 TWh of green hydrogen per year, of which 120,000 can already be produced for less than €2.50. To put this figure into perspective, green hydrogen in Germany currently costs around €7 to €10 per kilogram. Therefore, Africa has been presented with a tremendous opportunity to fulfil its energy needs and requirements, reduce its emissions in line with the current international standards, become a net exporter of energy, and decarbonize its industry, which allows an easier entry into the EU market. Realizing the potential, a few African countries have already started positioning themselves and have taken the lead in establishing a green hydrogen industry powered by their renewable energy capabilities. Egypt, Morocco, and South Africa stand out as great examples of countries taking the opportunity seriously and advancing their plans to transform fiction into reality: Focus on the projects Egypt Egyptian policymakers have taken green hydrogen more seriously in the last year, holding talks with a number of multinational corporations about developing a local sector that has the potential to become an important component of the country's energy mix. Egypt's first green hydrogen generating plant, with a capacity of 100MW, will be operational in November 2022, making it the world’s largest by a factor of five[1]. The output will be used as a supplemental feedstock by the Egyptian Basic Industries Corporation to generate 90,000 tonnes of green ammonia per year. TAQA Power has also signed a Memorandum of Understanding (MoU) with MAN Energy Solutions, a German business, for a pilot project to produce green hydrogen locally in Egypt to power tourist buses with clean fuel. Siemens Energy and the Egyptian Electricity Holding Company have signed a MoU to collaboratively create a hydrogen-based industry in Egypt with export capabilities. They will co-develop a pilot project with a 100 to 200 MW electrolyzer capacity as a first step, which will help drive early technology deployment, start a partner landscape, establish and test regulatory environment and certification, setup off-take relations, and define logistic concepts. Eni, GE, and ThyssenKrupp have all submitted bids to build hydrogen facilities in Egypt. The proposals, which total $2 billion, are for facilities that would create both green and blue hydrogen. Several proposals from European institutions such as the German development bank KfW, the European Investment Bank, and the International Finance Corporation (IFC) were accompanied by financing offers. South Africa Further South on the continent, South Africa has already had a go at green with The National Hydrogen Fuel Cell Technology (HFCT) Research, Development, and Innovation strategy-also known as the Hydrogen South Africa strategy (HySA). The mining sector has also been leading the way in hydrogen technology within the country. Anglo Platinum, for instance, is setting up a 75 MW solar PV-powered plant with plans to further increase the capacity to 320 MW, with the surplus of electricity generation being directed to produce green hydrogen. In May 2021, the German development bank KfW announced a €200 million scheme to help South Africa establish green hydrogen projects. A feasibility assessment issued by the government and private-sector partners in October 2021 found three green hydrogen hubs in the eastern region that had the potential to develop a hydrogen valley. Sasol and the Industrial Development Corporation (IDC) have agreed to work together to advocate for enabling policy frameworks, develop pilot and commercial-scale hydrogen projects, access local and international financing options, and go after strategic projects that will help the country attain its energy transition and economic development goals. Sasol revealed a few months later that it planned to begin manufacturing green hydrogen as early as 2023. Morocco Considered a leader along with South Africa, Morocco is also working to create its own green hydrogen industry. In 2020, the Moroccan government engaged in a partnership with Germany to build the first standalone green hydrogen plant on the continent. The following year, the government signed an agreement on green hydrogen development with Portugal, laying the groundwork for clean energy collaboration between the different economic actors in both countries. Morocco has also inked a strategic collaboration with Irena in June 2021, with the goal of becoming a major green hydrogen producer and exporter. The two parties will work together to conduct green hydrogen studies and examine policy options for incorporating businesses into the green hydrogen economy on a national scale. A joint venture between Greece's Consolidated Contractors Company (CCC) and Ireland's Fusion Fuel aims to build a green hydrogen-powered ammonia facility in Morocco as of 2022, which will be the country's largest green hydrogen project to date. The plant will have the capacity to produce 31,000 tonnes of renewable hydrogen per year and generate 183,000 tonnes of green ammonia by 2026. Finally, in early December 2021, the country saw the establishment of "Green H2A", a technology platform dedicated to research and innovation in green hydrogen. The first of its kind in Africa, it aspires to play a key role in Morocco's industrial deployment of green hydrogen and its uses. One of Green H2A's first initiatives is a pre-industrial pilot project to produce 4 tonnes of green ammonia per day with a 4MW electrolysis capacity. Given both the advancements on the ground and in legislation, and the intense interest by Germany, one of the leaders in green H2 technology, Morocco, Egypt, and South Africa are poised to become the leaders in the field for the coming decades, developing a "decarbonized fuel" made from renewable energy for export to Europe. In this sense, The Africa Green Hydrogen Alliance was officially launched at the first-ever Green Hydrogen Global Assembly in Spain on May 2022, with the goal of developing a strong green hydrogen ecosystem. Egypt, Kenya, Mauritania, Morocco, Namibia, and South Africa are among the founding partners. The energy ministers of 14 Arab nations, including Morocco, have proposed an ambitious plan to create an Arab Common Market for power, with green hydrogen being an important link in the chain. On July 27, 2020, the final versions of two international treaties connected to this project were completed. It is undeniable that green hydrogen shows strong potential on the continent, with several countries taking the lead due to the foresight and available opportunities. In the coming years, we are likely to witness a marked acceleration in the rollout of hydrogen projects and the concretization of decarbonisation plans. However, despite the winds setting the sails on a clear course in the coming years, many African nations have yet to live up to their potential and geographic resources. Sources: African Business - Green hydrogen – implications and prospects for Africa - June 2022 Africa News – Positioning Africa as a green hydrogen leader African Business - South Africa eyes future as green hydrogen hub– October 2021 Atlas of green hydrogen generation potentials in Africa - H2 Atlas Tool Federal Ministry of Education and Research - West Africa can become the climate-friendly energy powerhouse of the world - May 2021 Arab News - Egypt to open its first green hydrogen plant in November 2022 – December 2021 Recharge - World's largest green hydrogen project – with 100MW electrolyser – set to be built in Egypt – November 2021 Siemens Energy - Siemens Energy supports Egypt to develop Green Hydrogen Industry – August 2021 Enterprise - Big global players eye hydrogen investment in Egypt – November 2021 Cliffe Dekker Hofmeyr - Moving towards a green hydrogen energy future – April 2021 Baker McKenzie - South Africa: Green hydrogen policy - a rapidly growing timeline of important developments – November 2021 South Africa’s Department of Science and Innovation – South Africa hydrogen valley final report – October 2021 African Business - Green light for a green hydrogen economy in Africa – November 2021 Le360 – Hydrogène vert: le Maroc et le Portugal main dans la main pour booster la filière – December 2021 Al Jazeera - Green Hydrogen: The new scramble for North Africa – November 2021 Energy & Utilities - Fusion Fuel and CCC to develop $850m Morocco green hydrogen project – July 2021 Le360 – Hydrogène vert: une plateforme technologique pour développer la filière, une première en Afrique – December 2021 [1] The second one, Air Liquid’s 20MW plant, is in Canada.

In 1987, the United Nations Brundtland Commission defined sustainability as “meeting the needs of the present without compromising the ability of future generations to meet their own needs.” In the past, sustainability was often only seen as a buzzword in the PR toolkit. However, during the past few years, it has become a concept of the utmost importance. A few key dates The United Nations Global Compact, launched in 2000, is a multi-stakeholder leadership initiative that aims to align business strategies and operations with ten universally accepted principles in multiple areas, including human rights, labor, environment, and anti-corruption, and to drive efforts in support of broader UN goals. In early 2005, Kofi Annan, the former United Nations Secretary-General, invited a 20-person group of the world’s largest institutional investors from 12 countries to participate in the development of the Principles for Responsible Investment (PRI), with the support of a 70-person group of experts in the investment industry, intergovernmental organizations, and civil society. The PRI helped provide a definition of sustainable investment and the actions that ensure that money is invested in a proper and wise way. However, it would take another ten years for these investment criteria to spread further. 2015 was a turning point for business sustainability. The Paris Agreement, a legally binding international treaty on climate change, was adopted by 196 parties at COP 21 in Paris on December 12th, 2015, and entered into force on November 4th, 2016. It is aiming at “holding the increase in the global average temperature to well below 2°C above pre-industrial levels and pursuing efforts to limit the temperature increase to 1.5°C above pre-industrial levels”. The Paris Agreement is a landmark in the climate change process since it is the first binding agreement that brought all nations together for a common cause: combatting climate change and adapting to its effects. The year also marked the foundation of the Science Based Targets initiative (SBTi), a partnership between CDP, the United Nations Global Compact, the World Resources Institute (WRI) and the World Wide Fund for Nature (WWF). Science-based targets show how much and how quickly businesses need to reduce their GHG emissions to prevent the worst impacts of climate change, creating a path towards decarbonization. In 2018, the Intergovernmental Panel on Climate Change (IPCC) warned that global warming must not exceed 1.5°C above pre-industrial temperatures to avoid the catastrophic impacts of climate change. In order to achieve this target, greenhouse gas (GHG) emissions must decrease by about 45% by 2030 (2010 baseline) and reach net zero by 2050. Sustainability criteria and their impact Sustainability is evaluated using environmental, social, and governance (ESG) factors: The Environmental category focuses on the impact a company has on the environment, e.g., Scopes 1-3 GHG emissions, resource and waste management, water use and conservation, the share of renewables in the energy mix, etc. The Social category considers the social impact a company has within society, as well as whether and how it advocates for social good and change. Indicators relate to stances and efforts on social issues including racial and gender diversity and inclusion, employee development, human rights, operational health and safety, stakeholder, and community engagement, etc. The Governance category refers to the ways a company is managed, or “governed”, to address issues and drive positive change. Indicators in this category include quality and diversity of management and the board, executive compensation, corporate ethics, transparency and disclosure, corporate political contributions, etc. These three categories allow companies to create a holistic approach for business strategies, risk mitigation, and reporting. Investors are also increasingly turning to ESG investing, which incorporates these factors into investment decisions, spurred by growing evidence that ESG integration in business decisions has a positive impact: 57 percent of executives and investment professionals in McKinsey’s Global Survey agree that ESG programs create shareholder value, and 83 percent believe that these programs will create even more value by 2025. Respondents also indicated they would be willing to pay a premium to acquire companies with a positive ESG record. In Accenture’s 2020 report titled “Seeking Responsible Leadership”, 2,540 publicly listed companies were examined between 2015 and 2018. Results show that companies that combine high levels of innovation with sustainability and trust outperform their industry peers, with 3.1% higher operating profits and greater returns to shareholders. S&P Global Market Intelligence analyzed 26 ESG exchange-traded funds and mutual funds, with more than $250 million in assets under management, between March 2020 and March 2021. 19 of those funds performed better than the S&P 500. Outperformers rose between 27.3% and 55% over that period, while the S&P increased 27.1%. On the other hand, companies that are seen as not making enough efforts on ESG issues are facing mounting pressure from stakeholders, and operational consequences: Two shareholders in the Commonwealth Bank of Australia (CBA) filed an application in the Federal Court of Australia in August 2021 seeking access to all documents created by the CBA in relation to the bank’s reported involvement in seven specified gas and fossil fuel projects. It is anticipated that the plaintiffs may bring a substantive claim against CBA if the documents produced demonstrate that the projects did not satisfy CBA’s Environmental & Social Policy. In May 2022, both ExxonMobil and Chevron, the two largest US oil companies, suffered shareholder rebellions led by climate activities and disgruntled institutional investors over their failure to set a strategy for a low-carbon future. This comes one year after a court in The Hague ordered Royal Dutch Shell to cut its global carbon emissions by 45% by the end of 2030 (2019 baseline), in a landmark case brought by the environmental organization Friends of the Earth and over 17,000 co-plaintiffs. Also in May 2022, nearly half of Berkshire Hathaway’s independent investors rejected the advice of the board led by chairman and CEO Warren Buffet, instead supporting proposals requesting climate-change-related reports and reporting on Berkshire’s diversity, equity, and inclusion efforts. Collaboration is essential Some companies have gone beyond their own operations and are trying to catalyze ESG efforts not only along the value chain, but also for whole industries. For example, in 2015, Apple launched the Supplier Clean Energy Program, which allows the company to not only share resources and training material on renewables but also to participate in clean energy investments by suppliers. In November 2021, Schneider Electric announced a collaboration in the same field with 10 global pharmaceutical companies, namely AstraZeneca, Biogen, GlaxoSmithKline, Johnson & Johnson, MSD, Novartis, Novo Nordisk, Pfizer, Sanofi, and Takeda. The new program, called Energize, will give suppliers of these companies the opportunity to participate in the market for power purchase agreements. Other companies have partnered with banks to link supply chain financing to ESG assessments. Henkel and Deutsche Bank announced such a partnership in May 2022, creating incentives for suppliers who can lower their costs by improving their ESG rating. Finally, various initiatives, whether sector-specific or not, have been able to gather pledges and commitments towards different targets. RE100, for example, brings together some of the largest companies in the world that are committed to 100% renewable electricity. Race to Zero is the UN-backed global campaign rallying non-state actors to take rigorous and immediate action. As part of the Race to Zero Breakthroughs: Retail Campaign, companies such as Best Buy, H&M Group, Ingka Group (IKEA), Kingfisher Plc, and Walmart have pledged their support to accelerate a movement in the retail industry to drive climate action and encourage other retailers to set out their plans to achieve 1.5 degree aligned carbon reduction targets. By raising awareness and engaging several stakeholders, these efforts—whether through incentives, resource and knowledge sharing, or other means—are important steps on the path to sustainability. In 2021, the first publication from the IPCC’s sixth assessment showed that the world will probably reach or exceed 1.5 °C of warming within just the next two decades. If emissions aren't slashed in the next few years, this will happen even earlier. Whether we limit warming to this level and prevent the most severe climate impacts depends on actions taken now. Jihane Benazzouz Sources: https://www.un.org/en/academic-impact/sustainability https://www.unpri.org/about-us/about-the-pri https://www.weforum.org/agenda/2022/02/sustainable-investing-esg-finance-future-norm/ https://unfccc.int/process-and-meetings/the-paris-agreement/the-paris-agreement https://www.un.org/en/climatechange/paris-agreement https://www.ipcc.ch/site/assets/uploads/sites/2/2018/12/SR15_FAQ_Low_Res.pdf https://sciencebasedtargets.org/about-us https://www.wri.org/insights/ipcc-climate-report https://www.ipcc.ch/site/assets/uploads/sites/2/2022/06/SPM_version_report_LR.pdf https://online.hbs.edu/blog/post/sustainable-investing https://www.mckinsey.com/business-functions/sustainability/our-insights/the-esg-premium-new-perspectives-on-value-and-performance https://www.accenture.com/us-en/insights/consulting/responsible-leadership https://www.spglobal.com/marketintelligence/en/news-insights/latest-news-headlines/esg-funds-beat-out-s-p-500-in-1st-year-of-covid-19-how-1-fund-shot-to-the-top-63224550 https://www.theguardian.com/business/2021/may/26/exxonmobil-and-chevron-braced-for-showdown-over-climate https://www.theguardian.com/business/2021/may/26/court-orders-royal-dutch-shell-to-cut-carbon-emissions-by-45-by-2030 https://www.morningstar.com/articles/1092856/nearly-half-of-berkshire-hathaways-independent-shareholders-support-climate-diversity-reporting https://www.nortonrosefulbright.com/en-nl/knowledge/publications/901a1a41/climate-change-litigation-update https://www.europeanpharmaceuticalreview.com/news/165113/energize-initiative-to-boost-renewable-energy-access-for-pharma-suppliers/ https://www.apple.com/ma/newsroom/2022/04/apple-helps-suppliers-rapidly-accelerate-renewable-energy-use-around-the-world/ https://www.db.com/news/detail/20220517-deutsche-bank-links-henkel-supply-chain-financing-to-esg-ratings?language_id=1 https://www.there100.org/about-us https://racetozero.unfccc.int/join-the-race/ https://racetozero.unfccc.int/system/race-to-zero-breakthroughs-retail-campaign/ https://www.ipcc.ch/report/ar6/wg1/downloads/report/IPCC_AR6_WGI_SPM.pdf

Historically, Africa has lagged in the technology space. However, in recent years, a new wave of tech startups emerging across Africa is promising to change the narrative. These start-ups are not only more innovative than those seen in the past, but they are also led by founders who have the ambition to solve some of the hardest problems that have plagued the continent. The expansion of mobile connectivity in Africa has facilitated the adoption of digital solutions and fueled innovation. Start-ups are emerging in a variety of tech sub-sectors such as Fintech, Healthtech, Edtech, and Insurtech, aiming to solve the continent’s challenges with innovative technologies such as the Internet of Things (IoT), Artificial Intelligence (AI), machine learning, and blockchain. Focus on innovation and technology The informal sector is a significant source of employment and a major contributor to economic activity in Africa. Africa’s tech startups have recently started to seize this opportunity to build scalable businesses that aim to address this market. According to Khaled Ben Jilani, a senior partner at Africinvest, a Pan-African private equity and venture capital firm, “the potential impact of innovation in the African start-up space is large and imminent due to the size of its gaps and the set of converging positive factors, or innovation drivers.” Cracking Africa’s long-standing developmental problems will increasingly become a commercial tech opportunity for entrepreneurs. The opportunities are uncountable, especially as Africa’s broadband and smartphone penetration rates continue to increase. Africa’s growing start-up ecosystem Over the last few years, Africa's startup ecosystem has grown exponentially. According to Briter Bridges and GSMA, the number of active innovation hubs in Africa reached 643 in Q4 2019, up from 314 in 2016, 442 in 2018, and 618 in Q2 2019. Even though Africa has more than six hundred innovation hubs, nearly half of these hubs are concentrated in only four countries, or what was identified as the “innovation quadrangle”: Nigeria (90 hubs), South Africa (78 hubs), Egypt (56 hubs), and Kenya (50 hubs). Support from Venture Capital (VC) firms is key to the growth of African start-ups Funding has long been a challenge for African start-ups, but the tide has started to turn in the last few years. VC firms have in the past been skeptical about investing in African start-ups, as they believed the continent is characterized by higher risk. However, African venture capital investment inflows have been steadily increasing over the last five years. VC firms have been increasingly more open to investing in African start-ups. Increasing funding rounds and a larger number of deals are being recorded every year. According to the Partech Africa Tech VC report, VC funding raised by African tech startups in 2019 amounted to US$2.02 billion, compared to US$1.16 billion in 2018, representing 74% growth year on year. Examples of African start-ups that are making waves on the continent Across Africa, technological innovation is starting to have an impact on multiple sectors, including energy, agriculture, banking, healthcare, entertainment, transport, education, and many more. Many tech startups are emerging to help the continent overcome its developmental challenges. Examples of such start-ups include the following: Logistics: Kobo360 (Nigeria): A freight logistics platform that assists cargo owners, truck drivers, and cargo recipients in achieving an effective supply chain. Kobo360’s goal is to facilitate the transportation of goods. Agritech: Twiga (Kenya): A mobile-based, cashless business-to-business (B2B) supply platform that connects farmers to millions of small and medium-sized vendors in African cities. Twiga connects farmers and vendors to trusted, modern markets. Healthtech DabaDoc (Morocco): DabaDoc has developed a technology that allows for instant doctor appointment bookings. DabaDoc connects millions of patients with thousands of doctors across Africa and significantly improves the doctor discovery process. Fintech Yoco (South Africa): A technology company that builds tools and services that facilitate payments, with the aim of unlocking economic opportunities for small businesses. Although it's unlikely that tech start-ups will be able to address all of Africa’s development challenges overnight, they can potentially be the driving force behind Africa's growth. Therefore, African countries should do more to support them, such as through entrepreneurial ecosystems and appropriate skill development programmes, regulations that streamline business procedures, a stable political and economic climate, incubators and accelerators, subsidized infrastructure such as office space, and so on. Only then will Africa reap the full benefits of tech start-ups. Author: Jonathan Sumbobo Sources: https://medium.com/@khaledbj/connecting-african-entrepreneurs-to-the-world-with-the-first-pan-african-venture-capital-fund-a689595e6eee https://thegedi.org/2017-global-entrepreneurship-index/ https://startupgenome.com/reports/global-startup-ecosystem-report-2019 https://www.gsmaintelligence.com/research/?file=36b5ca079193fa82332d09063d3595b5&download https://www.weforum.org/agenda/2019/01/african-entrepreneurs-changing-the-direction-of-globalization/ https://www.weforum.org/agenda/2016/05/a-brief-history-of-africa-s-tech-industry-and-7-predictions-for-its-future/ https://www.mckinsey.com/~/media/McKinsey/Industries/Technology%20Media%20and%20Telecommunications/High%20Tech/Our%20Insights/Lions%20go%20digital%20The%20Internets%20transformative%20potential%20in%20Africa/MGI_Lions_go_digital_Full_report_Nov2013.ashx https://briterbridges.com/briterafrilabs2019 https://briterbridges.com/618-active-tech-hubs https://partechpartners.com/documents/12/2020.01_Partech_Africa_-_2019_Africa_Tech_VC_Report_FINAL.pdf https://www.weforum.org/agenda/2019/09/africa-just-launched-the-world-s-largest-free-trade-area/ https://edition.cnn.com/2019/07/01/africa/single-trade-currency-ecowas/index.html

Energy use and CO2 emissions from transportation The transportation sector accounts for around 30% of global final energy consumption. Given that most of our energy is still derived from fossil fuels, despite the growing share of renewable energy generation and the announced carbon neutrality ambitions by 2050, transportation is already at the top of a list of sectors to decarbonize. What’s more, transport has the highest level of reliance on fossil fuels of any other sector. According to the International Energy Agency, road transportation alone accounts for approximately 15% of global energy-related GHG emissions. During the last few years, the public debate on reducing road transport emissions has been dominated by battery electric vehicles (BEVs), which represent a promising path towards decarbonizing the sector. However, despite significant advances in cost and economic competitiveness—EVs are already competitive with internal combustion engine (ICE) vehicles on a total cost of ownership (TCO)1 basis—a few challenges have hampered market development, most notably in terms of practicality, limited autonomy2, and long refueling times of BEVs. The Hydrogen Fuel Case The use of hydrogen as a fuel, particularly green (hydrogen produced from water electrolysis3) or blue hydrogen (produced from natural gas and supported by CCS4), could be the key to decarbonizing road transportation. This is because not only can fuel cell electric vehicles (FCEVs) already, similar to conventional ICE vehicles, refuel in less than 4 minutes and have a driving range of over 450km5 but also, just like BEVs, they produce no harmful tailpipe emissions. From a cost perspective, because the level and type of performance required vary from one vehicle segment to another, it’s important to make a distinction between light and heavy-duty vehicles. For the sake of illustration, we consider the 3 main vehicle segments: passenger cars, HDT, and off-road, and compare the FCEV options to the BEV and ICE versions by the total cost of ownership (TCO). Passenger Cars: Based on a TCO analysis by energy consultancy Element Energy, FCEVs are quite a long way from being cost competitive with electric and conventional passenger cars, especially for first-time owners. And although the TCO of FCEVs in the segment is expected to drop significantly over the next decade due to falling fuel cell costs, BEVs are expected to remain a much more attractive option in comparison, except for larger passenger cars, SUVs, and vans with longer-range requirements and heavier use cycles (e.g., for taxis and ride-sharing) where FCEVs become a reasonable alternative. Heavy-Duty Vehicles/Trucking (HDT): According to a report by the Hydrogen Council and McKinsey, on-demand HDT FCEV is expected to become the cheapest option in terms of TCO by 2030, assuming a hydrogen price at the dispenser of about $4/kg in 2030. The analysis suggests that HDT FCEV should achieve break-even with BEVs by around 2025 and with ICE HDTs by 2028, driven primarily by a drop in hydrogen fuel costs and equipment costs. It’s worth noting that, in a context where targeted subsidies such as Switzerland’s toll exemption policy or other support mechanisms exist, the described timeline could be even shorter. Off-Road Equipment/Vehicles: Due to the specific performance requirements of off-road equipment, fuel cell powertrains are potentially the only alternative to GHG-emitting equipment. In the context of achieving net zero targets, decarbonizing the off-road vehicle segment is of particular importance. That’s because mining rare earth metals is critical for green technology manufacturing (including fuel cells), and off-road equipment (such as excavators and wheel loaders) is heavily used in mining operations. Regarding the cost, the latest estimates from the US DoE and the Journal of Hydrogen suggest that fuel cells are already the lower-cost option for compact tractors/wheel loaders and standard/full excavators. Developing the hydrogen sector Hydrogen-fueled cars have been commercially available for almost a decade. Despite that, due to the lack of infrastructure, their sales remain dwarfed by those of BEVs. Mindful of the sector’s potential, governments have started over the past few years drafting strategies and creating policies in support of hydrogen, including investment incentives for the construction of hydrogen production and refueling facilities to enable the deployment of FCEVs. Below are some examples: Japan: In 2017, the Japanese government issued the Basic Hydrogen Strategy and became the first to adopt a national hydrogen framework. Through a series of legislation and plans, it aims to expand its hydrogen economy and production to 20 million tonnes by 2050. United States: At the federal level: the Emergency Economic Stabilization Act of 2008 introduced incentives in the form of tax credits to help minimize the cost of hydrogen and fuel cell projects. Since then, the tax credit policy has been extended and its scope enlarged to include refueling equipment and energy storage system facilities. A wealth of other incentives has been introduced, most notably through the Biden Administration’s Build Back Better Act. At the state level: energy authorities have taken similar steps. In 2020, the California Energy Commission (CEC) committed to investing up to $115 million to significantly increase the number of Hydrogen Refueling Stations (HRSs) in the state. California is on track to achieve its target of deploying 200 HRSs by 2025. Germany: In June 2020, Germany presented its National Hydrogen Strategy. The strategy document identified several goals that need to be achieved for green hydrogen to become an effective tool in reaching emissions neutrality by 2050, including the scale-up of H2 production and transport capacity, as well as the introduction of support schemes and public funding. Germany committed to providing public funding amounting to €7 billion for the market ramp-up of hydrogen technology in the country. Chile: In addition to their National Electromobility Strategy published in 2017, which includes goals on green hydrogen and fuel cells applications, Chile announced its National Green Hydrogen Strategy in 2020, and the goal to be carbon neutral by 2050. Figure 1: HRS by region, 2021 [caption id="attachment_8368" align="aligncenter" width="486"] source: IEA, 2022[/caption] On the private sector front, energy companies are already competing for market shares of Hydrogen Refueling Stations (HRSs). Today, the fast-growing HRS market is dominated by a few Oil & Gas and hydrogen companies, namely Air Products, Linde, Air Liquid, and Nel. To enter the market, some companies chose to combine their investment efforts through JVs, such as the German H2 Mobility JV, which operates a global network of 200+ HRS. Concerning car manufacturing, major OEMs are offering a limited but growing number of FCEVs to the public in certain markets, in line with what the developing infrastructure can support. It is estimated that around 52 thousand FCEVs are currently in circulation, with the majority of them concentrated in the United States (38%) and Korea (24%). Figure 2: FCEVs by region, 2021 [caption id="attachment_8369" align="aligncenter" width="458"] source: IEA, 2022[/caption] The net zero emissions by 2050 scenario requires transport sector emissions to fall by 20% by 2030. To achieve this goal, new sales of PHEVs, BEVs, and FCEVs need to represent 64% and 30% of total passenger car sales and HDT sales, respectively, by 2030. The TCO data summarized in this article shows that, rather than competing against BEVs, hydrogen-fueled vehicles can help achieve this objective by taking up the baton where BEV technology fails to deliver, in particular in the HDT segment. Notes: 1: The total cost of ownership includes both purchase cost and running cost, i.e., fuel and maintenance costs, over the lifetime of the vehicle. 2: Based on EPA data, the median range for 2021 model EVs was 234 miles (source) 3: Water electrolysis uses an electrical current to separate the hydrogen from the oxygen in water. If this electricity is obtained from renewable sources, hydrogen will therefore be produced without emitting carbon dioxide into the atmosphere. 4: CCS stands for Carbon Capture and Storage. In the case of blue hydrogen production, the CO2 generated during the manufacturing process is captured and stored permanently underground. The result is low-carbon hydrogen that produces no CO2 5: 300 miles based on US DoE estimates –converted to km and rounded for the sake of convenience (Source) Oussama El Baz Sources: IEA, Key World Energy Statistics 2021 IEA, World Energy Outlook, 2021 IRENA, Green hydrogen cost reduction, 2020 IEA, Global EV Outlook 2022 US DoE Alternative Fuels Data Center European Parliament – What if hydrogen could help decarbonize transport? European Commission, Biofuels in the European Union, A vision for 2030 and beyond Element Limited, Electric Cars: Calculating the Total Cost of Ownership for Consumers, 2021 US Department of Energy, Hydrogen and Fuel Cell Technologies Office, 2022 Hydrogen Council, A perspective on hydrogen investment, market development and cost competitiveness, 2021 Cleantech Group, Decarbonizing off-road vehicles, 2022 US DoE, Hydrogen Fuel Cell Technologies Office, 2022 Journal of Hydrogen, Performance, and cost of fuel cells for off-road heavy-duty vehicles, 2022 International Partnership for Hydrogen and Fuel Cells in the Economy Marca Chile, Electromobility: Chile is leading the way in Latin America with ambitious goals, 2021 Watson Farley & Williams, The German Hydrogen Strategy, 2021 Baker McKenzie, How Proposed New US Hydrogen Tax Incentives Should Spur Investment, 2021 US DOE, Financial Incentives for Hydrogen and Fuel Cell Projects JD Supra, Clean Energy Tax Proposals in Biden’s New “Build Back Better” Framework, 2021 California Energy Commission, 2020 Exxon Mobil – What is blue Hydrogen Iberdrola – Green hydrogen: an alternative that reduces emissions and cares for our planet

After years of research and improvements, virtual reality (VR) has now hit the mainstream. Tech giants like Google, Facebook, Samsung, HTC, Huawei, and many others have been introducing VR devices that bring realistic worlds to life. In the 1990s, virtual reality was mostly associated with science fiction movies and games. Virtual reality is increasingly seen as a technological powerhouse in a multitude of industries, including healthcare, education, training, and retail. History Before delving into the current role of virtual reality and its future prospects, let's take a look back at how it all began. The first virtual reality device, Sensorama, was used by a cinematographer named Morton Heilig in the 1950s. The Sensorama machine featured a built-in seat used for 3D movies and generated vibrations and sounds to make the users feel as though they were a part of the movie. Since then, many pioneering innovators have been motivated to create new gadgets that deliver a high-quality experience, such as the Oculus, PlayStation VR, and others. Virtual reality use cases VR has several business use cases where it is improving processes, safety, and knowledge in many firms. Retail Ikea: A whole new home and retail VR application In 2016, Ikea launched a one-of-a-kind virtual reality kitchen in Australia, allowing customers to explore a virtual kitchen and visualize its features. This immersive experience was set up to influence the way customers shop for IKEA products. Through this feature, customers could choose different types of fabric, wall colors, and lighting depending on their preferences. This way, Ikea inspires confidence and helps in customers' decision-making. Nike: VR experience in Nike stores Some of Nike’s physical stores are equipped with VR tools. Nike offers clients a virtual reality experience that immerses them in various phases of the supply chain. Customers can scan items such as shoes or apparel to access information about the item. They can also enter a virtual reality environment to experience the many processes in Nike's supply chain and walk through Nike’s manufacturing process. Manufacturing Boeing: The use of VR to upgrade the Boeing manufacturing process Boeing is using VR in the manufacturing of the 737 MAX 10. This experience allows engineers to visualize the manufacturing process, the tools, and the technologies displayed so they can predict potential problems. All of that helps engineers gather data, make any necessary changes, and incorporate these changes into the production system. The company also uses VR for wiring airplanes. Using VR, technicians can readily identify where the electrical wire runs by walking around the airplane, examining the wire renderings in full detail, and receiving instructions hands-free. Renault: The Renault Group's Virtual Reality and Immersive Simulation Center The Renault Group uses virtual reality for vehicle-related virtual design. Virtual reality helps the engineers see the vehicle architecture through an immersive 3D experience and upgrade the designs of the trucks. It allows the designers to test the vehicles without having to make a physical prototype, which saves time and costs and helps in decision-making. Training Verizon: VR to enhance employees' self-defense Verizon, which is a wireless network operator, has started using VR for training to guide employees through dangerous scenarios. Verizon is investing heavily in training its employees. The company is offering self-defense training to teach its employees how to act in case of a robbery or any attack on their commercial shops. Verizon gives headsets to their employees and teaches them how to defend themselves in case of a robbery. This is done by displaying all the steps and instructions to be followed. The future of VR in business According to Statista, virtual reality is rapidly expanding. The consumer and corporate VR industry is predicted to exceed USD 12 billion in 2024, up from USD 4 billion in 2020. According to the projections, businesses are very interested in this technology and are willing to invest in it as it saves time and money and allows them to keep up with the market's technological advances. [caption id="attachment_8295" align="aligncenter" width="543"] Statista[/caption] VR headset unit sales are expected to increase significantly from 5 million headsets in 2020 to 14 million headsets in 2024. Analysts are also expecting an upgrade to more fashionable, accessible, and small devices. Otherwise, interest is significantly turning to VR in business, which will automatically increase sales of devices and foster competition between the biggest producers to innovate and discover more features that will make the experience more enjoyable. [caption id="attachment_8317" align="aligncenter" width="568"] Statista[/caption] To conclude, virtual reality is shaping the future and is significantly evolving compared to the last few years. To that end, the world's largest technology companies, such as Google, Microsoft, and Sony, are making significant efforts to innovate and keep up with changing and rapidly expanding markets. This is so palpable throughout the investment in virtual reality devices. Being successful today is more about being open to new technologies than it is about mastering processes and value chains. Otherwise, being present in a highly competitive market is not something easy, and companies are aware of how technologies can make a difference, bump sales, inspire confidence, and help in decision making. Author: Abdesslam Falsy Sources: https://www.statista.com/study/29689/virtual-reality-vr-statista-dossier/ https://www.iberdrola.com/innovation/virtual-reality https://www.researchgate.net/publication/318674426_Exploring_the_Impacts_of_Virtual_Reality_on_Business_Models_The_Case_of_the_Media_Industry/link/59772ffa0f7e9b4016c368fb/download https://www.usdigitalpartners.com/future-virtual-reality-business/ https://www.techtarget.com/searchcio/post/3-enterprise-uses-for-virtual-reality https://retailsee.com/nike-hm-jumping-into-metaverse/ https://www.forbes.com/sites/walterloeb/2022/01/12/how-entering-the-metaverse-will-affect-nikes-bottom-line/?sh=15aed5303ac3 https://www.boeing.com/company/about-bca/washington/737-max10-virtual-reality-01-28-19.page https://foundry4.com/5-business-uses-of-virtual-reality https://business.panasonic.co.uk/visual-system/renault-virtual-reality-day-in-day-out-case-study https://demodern.com/projects/ikea-vr-showroom

Aluminum industry in the global economy The Russian military operations in Ukraine had a significant impact on many industries, including the aluminum industry. At the beginning of the year, global aluminum prices were already soaring, but the conflict surely exacerbated the situation in February. Notably, the war has not only impacted the aluminum market but also various products in which aluminum is a vital component, from beverage and food cans to aerospace applications. These various applications are expanding and driving up aluminum demand year after year. As a result, the global aluminum market size has grown from 150 billion USD in 2020 to 152.3 billion USD in 2021 and is expected to reach 160.7 billion USD in 2022. Due to the anticipated growing demand, by 2027, the global aluminum market value is projected to reach 210 billion USD. Global Aluminum Market Size (2020 – 2027), in billion USD [caption id="attachment_8323" align="aligncenter" width="441"] Source: Statista.[/caption] Note: the value from 2023 to 2026 are estimated based on Infomineo analysis (CAGR 4.9%). The high demand for aluminum comes from its essential contribution to multiple industries, including packaging, automotive, and construction. -In packaging, for example, the aluminum content represents 73% of the beverage cans by weight -In the automotive industry, the aluminum share of vehicle weight is expected to grow from 9.1% in 2017 to 16% by 2028. - In construction, the consumption of extruded aluminum (extruded aluminum is the major product used in construction) has grown from 30.7 million tons in 2020 to 33.4 million tons in 2021. It is forecasted to continue to grow to reach 3 million tons by 2025. Major drivers of aluminum prices Aluminum production involves multiple stages until the finished product can be used directly in different industries, including mining the bauxite ore, shipping to smelters, refining, casting, etc. Besides the demand-supply balance, there are many factors in these operations that affect the aluminum price, the most important of which are: Raw material prices: The price of bauxite, as the aluminum-source ore, along with the raw materials used in aluminum production like alumina (refined bauxite), coke, pitch, silicon, magnesium, and caustic soda, all affect the price of the ready-for-shipping aluminum. Shipping costs: Freight costs, particularly sea freight (containers), have a direct impact on raw material prices as well as primary aluminum prices. Energy cost: the cost of power is deeply involved in aluminum production costs as one of the most energy-sensitive industries, accounting for 12% of the global industrial sector’s energy use. National policies and market dynamics: To regulate the market and adjust to national policy, producing countries use instruments such as tax cuts and rebates to respond to importing countries that apply anti-dumping taxes on imported aluminum products. The war’s impact on aluminum price drivers The war pushed the price of aluminum to unprecedented levels. For example, the aluminum price on the LME (London Metals Exchange) with the three-month contract peaked at a record $4,000 a ton in early March 2022, compared to the $3,224 February monthly average of the same year. Market prices have recently declined as price hikes discourage demand, but even in May2022, aluminum trades at the $3,300 level, which is 40% higher than the previous year. There are multiple factors that have impacted aluminum prices. Firstly, and most importantly, oil price spikes had a detrimental effect not only on aluminum, but on all commodities. The Brent oil price was marked at around $80 per barrel at the beginning of 2022, but the price jumped from around $96 per barrel on February 14th, 2022, to around $123 per barrel on March 7th, 2022. More than four months after the start of military operations, the Brent price remains around $120 (June 2022). Secondly, supply chain disruptions due to the Russian invasion increased the cost of shipping operations. The ClarkSea Index (all shipping markets) shows a dramatic increase in the shipping rate from around $30,000 per 40-foot container by the end of January 2022 to over $40,000 in March. ClarkSea Index in Thousands USD/day – all shipping markets [caption id="attachment_8324" align="aligncenter" width="539"] Source: UNCTAD Secretariat[/caption] Finally, the impact of changing national policies on market dynamics should not be overlooked. Since aluminum is one of the biggest emitting industries, China's aim to achieve net-zero carbon emissions by 2060 has resulted in a reduction in China's aluminum output (the world's top producer). To compensate for the decreasing domestic output, China's aluminum imports surged dramatically. The war has reversed the equation. As natural gas and other energy prices skyrocketed, European aluminum companies reduced production, creating a metal shortage and a price gap of roughly $300 per ton between China and Europe. Also, since China has not imposed sanctions on Russia, the country has had access to cheaper energy and lower production costs compared to Europe. This created a profit opportunity when a trader buys Asian aluminum and resells it in Europe or the United States. Secondary aluminum as a solution As a solution to the difficult circumstances ranging from COVID-19 to the Russia-Ukraine war, the top aluminum producing companies focused their efforts on secondary (recycled) aluminum as a less expensive option during the difficult period. Several of the top 10 aluminum producers recently invested in secondary aluminum: Rio Tinto (UK/Australia) – March 2022: Rio Tinto has commissioned a new remelt furnace at its Laterrière Plant, adding 22,000 metric tons of recycling capacity to its aluminum operations in the Saguenay – Lac-Saint-Jean region of Quebec. The $8.4-million project has been completed over two years to offer rolled product customers in the North American automotive and packaging industries a new sustainable supply solution combining low-carbon and recycled aluminum. Alcoa (US) – April 2022: Alcoa has completed the installation of a new furnace in Norway that uses renewable energy to recycle scrap aluminum, saving energy and unlocking the infinite recyclability of our metal. The project stems from a collaboration between Alcoa and MMG Aluminum, a German-based metals trading company that supplies Mosjøen (Norway) with clean aluminum chips and shavings that have been compressed into briquettes. The induction furnace efficiently melts those briquettes and then pours out the recycled aluminum for blending with the smelter’s low-carbon aluminum and other alloying materials, depending on the end-use applications. Norsk Hydro (Norway) – May 2022: Norsk Hydro has announced a tender offer to acquire 100 percent of the shares of Alumetal S.A., based in Poland. Hydro describes that company as the second-largest producer of aluminum casting alloys in Europe. Alumetal has an annual production capacity of 275,000 metric tons at its three plants in Poland and one in Hungary. Hydro describes the company as experienced in the sorting of post-consumer scrap and says Alumetal is currently “constructing a new, state-of-the-art sorting line” for the scrap it melts. The secondary aluminum market aids in reducing demand for primary aluminum. However, much more effort is required to reduce the recent metal price surge. This will eventually allow the global aluminum market to recover and restore normal conditions while mitigating the effects of COVID-19 and the war. Author: Mohammad Sayed Sources : https://www.statista.com/statistics/1113683/global-aluminum-market-size/ https://www.aluminum.org/canadvantage https://www.statista.com/statistics/892783/japan-aluminum-share-in-medium-sized-passenger-cars/ https://aluminiuminsider.com/aluminium-content-automobiles-account-16-curb-weight-2028-aluminum-association/ https://www.statista.com/statistics/1113623/global-aluminum-exports-by-country/ https://www.iea.org/reports/aluminium https://www.eia.gov/todayinenergy/detail.php?id=38392#:~:text=Within%20the%20industrial%20sector%2C%20the,and%20other%20intermediate%20metal%20goods. https://www.reuters.com/article/aluminium-rebate-idAFL3E7FC0WI20110412 https://asia.nikkei.com/Business/Markets/Commodities/Ukraine-war-turns-China-into-net-exporter-of-aluminum https://www.westmetall.com/en/markdaten.php?action=averages&field=LME_Al_cash https://www.statista.com/statistics/326017/weekly-crude-oil-prices/ https://markets.ft.com/data/commodities/tearsheet/summary?c=Brent+Crude+Oil https://unctad.org/news/war-ukraine-raises-global-shipping-costs-stifles-trade https://www.statista.com/statistics/280920/largest-aluminum-companies-worldwide/ https://www.riotinto.com/news/releases/2022/Rio-Tinto-commissions-new-aluminium-remelt-furnace-at-Laterrire-Plant- https://www.alcoa.com/global/en/stories/releases?id=2022/04/alcoa-advances-sustainably-with-recycled-aluminum-produced-using-renewable-energy https://www.recyclingtoday.com/article/hydro-alumetal-aluminum-recycling-norway-poland-acquisition/

A massive amount of data is generated every second by billions of active users across many devices, such as computers, tablets, and mobile phones. Over the past decade, from 2010-2020, the amount of data created increased by an astounding 5,000%. Data is everywhere, but it is worthless unless it is properly processed and analyzed. Nowadays, data analytics serves not only to formulate business strategies and optimize performance but also to improve the lives of individuals. Data analytics is particularly important in the healthcare sector. The efficiency of healthcare organizations depends on converting clinical raw data into valuable and actionable insights to improve patient and clinical outcomes. For instance, electronic health records (EHRs) and other health-related smartphone apps are now essential to determine the patient’s status, optimize the utilization of resources, and provide efficient solutions. What is “Data analytics”? In general, data analytics is the process of collecting, transforming, and analyzing data to identify trends and patterns in order to draw conclusions, make predictions, and drive informed decision-making. Data can be analyzed manually or using tools such as software and algorithms. Data analytics can help optimize operational efficiency, increase revenues, enhance customer service, and boost performance. There are four main types of data analytics: Descriptive data analytics uses past and current data to identify trends and relationships and to understand what’s already happened in an organization. One of the common uses of descriptive analytics is the tracking of KPIs to assess the health and value of a business. Diagnostic data analytics uses the insights identified by the descriptive analytics and dives deeper to understand the causes of the outcomes. Diagnostic data analytics answers the question “Why did it happen?”. Predictive data analytics explores historical data and past trends to predict future outcomes. Predictive data analytics answers the question, “What is likely to happen?” Prescriptive data analytics combines the insights of all the previous data analytics types to identify what actions to take to achieve certain goals or outcomes. It suggests the best possible next steps based on simulations aiming to optimize the performance of an organization. Prescriptive analytics answers questions such as “What is the best course of action?” and “What if we try this?”. What are healthcare data inputs and tools? The healthcare industry is generating a colossal amount of data linked to the health of a patient and the population as a whole. Healthcare data is being collected from a variety of health information systems (HIS) and tools, allowing data to be stored, shared, and analyzed. These tools and systems include: Electronic Health Records (EHR) Personal Health Records (PHR) Electronic Prescription Services (E-prescribing) Patient Portals Master Patient Indexes (MPI) Health-Related Smart Phone Apps Healthcare data is valuable knowledge about the global healthcare system, including patients, staff, and hospitals’ performance. Initially, data inputs are unstructured, uneven, and can be difficult to understand. Data analysts, with the help of several analytical programs and software, clean and validate the gathered data to draw valuable and actionable insights that can help stakeholders formulate decisions. How could data analytics serve the healthcare system? The main function of healthcare data analytics is to gain better insights and enable healthcare organizations to make well-informed clinical and business decisions. Examples of healthcare applications of the four types of data analytics mentioned above include: Descriptive analytics: analyzing the number of positive tests in a specific area in order to determine how contagious a virus is. Diagnostic analytics: detecting an illness or an injury based on the symptoms experienced by a patient. Predictive analytics: exploring the case data of an infectious disease in order to forecast its spread in the future. Prescriptive analytics: examining the pre-existing conditions of a patient in order to determine the risk of future conditions and implement specific preventive treatments. Healthcare data analytics applications can lead to several benefits. According to ArborMetrix, healthcare data analytics is helping organizations enhance their competitive position, improve clinical quality and patient care, promote research advancement, and optimize internal processes (see image below). [caption id="attachment_8268" align="alignnone" width="579"] Source: ArborMetrix[/caption] These key applications cannot be realized without extensive use of advanced software and tools that transform unorganized data into actionable insights. These include artificial intelligence tools, cloud computing platforms, blockchain networks, health information exchanges, and machine learning models. Market overview of healthcare data analytics The fast rate of technological advancements, the increase in healthcare expenditures, and the massive digitalization of the healthcare industry are driving monumental growth in the healthcare analytics industry. According to Grand View Research, the global healthcare analytics market was valued at USD 29.1 billion in 2021 and is forecasted to grow at an annual growth rate of 21.5% between 2022 and 2030 to reach USD 167.0 billion by 2030. Now let’s look at some of the leading market players that are constantly innovating and using cutting-edge technology to interpret healthcare data and deliver solutions to healthcare providers and institutions. These leading companies include: UnitedHealth Group McKesson Corporation Health Catalyst Microsoft IBM Corporation Cerner Corporation Allscripts Healthcare Solutions MedeAnalytics, Inc. Apixio Inc. Lumiata Inc. Healthcare data analytics in the time of COVID-19 The pandemic has had a significant economic and social impact around the world. Disrupted supply chains, medical supply shortages, and the healthcare system's burden are some of the drastic examples of the detrimental effects of the COVID-19 crisis. Big data analytics tools have played a significant role in decision-making to counteract the effects of the pandemic. The enormous amount of data generated by the pandemic incentivized researchers and providers to turn to data analytics and predictive modeling as a means to optimize resource allocation, predict surges and outbreaks, improve patient care, and implement preventive measures. During the pandemic, health organizations started to leverage predictive models to better identify the patients at risk by understanding the factors influencing disease severity and forecasting the number of cases, hospitalization rates, and death rates. In June 2020, Cleveland Clinic researchers developed a predictive analytics model that aims to determine an individual's likelihood of testing positive for COVID-19 and the potential consequences. Predictive models were also useful at a time when patients overwhelmed hospitals and health systems. Many organizations have implemented predictive tools to optimize resource allocation. It has helped hospitals predict staff needs, bed capacity, ventilator usage, and many other metrics. The use of data analytics in the healthcare industry has become crucial. By collecting, processing, and analyzing data, healthcare organizations are able to make more informed decisions. Data analytics in healthcare allows organizations to improve patient care, enhance their competitive position, advance their research efforts, and manage their financial and clinical risk. The global healthcare analytics market is rapidly expanding. This is driven by the monumental rate of technological advancement and the digitalization of the healthcare industry. New technologies continue to emerge at a high pace, driving the healthcare industry toward a major change. From artificial intelligence (AI) to natural language processing (NLP) to machine learning, data analytics is changing every facet of the healthcare industry. While healthcare data analytics has a bright future ahead, there are also major security concerns. Patient data is particularly sensitive, and it is difficult to determine the acceptable uses of data while prioritizing security and patients' right to privacy. Healthcare data, no matter how crucial it is for medical scientific development and the success of healthcare providers, should only be utilized if security and privacy concerns are addressed. Author: Anas Ghoulam Sources https://www.arbormetrix.com/blog/intro-big-data-analytics-healthcare https://online.hbs.edu/blog/post/data-analytics-in-healthcare https://www.sisense.com/glossary/healthcare-analytics-basics/ https://www.grandviewresearch.com/industry-analysis/healthcare-analytics-market https://online.maryville.edu/blog/data-analytics-in-healthcare/ https://online.shrs.pitt.edu/blog/data-analytics-in-health-care/ https://healthitanalytics.com/news/how-big-data-analytics-models-can-impact-healthcare-decision-making https://www.ibm.com/topics/healthcare-analytics https://www.emergenresearch.com/blog/top-10-leading-companies-in-the-healthcare-analytics-market https://www.testingxperts.com/blog/Big-Data-Analytics-Healthcare https://www.oracle.com/business-analytics/data-analytics/ https://www.naukri.com/learning/articles/types-of-data-analytics-and-their-applications-in-real-world/ https://healthitanalytics.com/news/3-ways-healthcare-is-using-predictive-analytics-to-combat-covid-19 https://www.sas.com/en_us/insights/articles/analytics/fighting-coronavirus--4-ways-analytics-is-making-a-difference.html https://www.marketsandmarkets.com/Market-Reports/healthcare-data-analytics-market-905.html https://www.mordorintelligence.com/industry-reports/global-healthcare-analytics-market-industry https://www.alliedmarketresearch.com/big-data-analytics-in-healthcare-market

Spending on virtual credit cards (VCCs) has surpassed corporate card expenditure for the first time in 2019, according to the Research and Markets business credit card report. Additionally, a new study by Juniper Research estimated that the global value of virtual card transactions will reach $6.8 trillion in 2026, representing a 370% increase from 2021. Businesses will account for 71% of total VCC transaction value, as preference for the convenience and security of virtual cards over costly and time-consuming methods grows over time. Is it necessary for your company to use virtual credit cards (VCCs)? What should you know to help your company avoid fraud and take advantage of VCC benefits? In this article, we’ll address those concerns by presenting the features of a VCC and explaining how it varies from a typical corporate credit card. What is a virtual card? Unlike a typical credit card, a virtual credit card is not a physical object. It’s a temporary and random set of 16 digits. It’s typically used to buy a single item using your smartphone or PC, and it’s generated online within seconds. Each time you use it, the disposable number changes, and it expires when it is no longer in use. A virtual credit card connects to but does not replace, your actual credit card account, so the charge you make on a VCC still pops up on your regular credit card statement. What does it look like & how is it generated? The electronic image of a VCC resembles that of a regular credit card, but it contains a number string that looks like this: xxx xxx xxx xxx 1234. The “x’s” stand for a random collection of numbers that hide your actual credit card number from fraudsters. The cards also feature a three-digit card verification number and an expiration date. Users may be able to get a virtual card number through their online account management site, depending on their bank or card issuer. They can set spending limits on each virtual card number they get and set unique expiration dates (typically no more than 60 days) using their current account to protect themselves from abuse, fraud, and overspending. Virtual credit cards are offered by a variety of major financial institutions, including Visa, American Express, Citibank, Capital One, and MasterCard (which operates its own virtual credit card service). If you have a credit card, you may already have access to a virtual card number. To find out, simply log into your online bank or card account and search for “Virtual Card Number” or “Virtual Account Number.” Can you get a virtual credit card with no deposit? As previously explained, a virtual credit card number is connected to an existing account with cash or a credit account with a line of credit. Users are given the option to create the virtual credit card as a single-use or multi-use card, with an expiration date of their choosing. They are also given the option to place a spending limit on the card, which allows them to access cash from their current account in a more structured and controlled manner. What’s the difference between digital wallets and virtual credit cards? A digital wallet works similarly to a virtual card, with a few noteworthy distinctions. Apple Pay and Google Pay, for example, store a digital version of your physical credit or debit card, including full card details. Digital wallets are considered a safe payment method since most digital wallets generate a temporary card number, similar to a virtual card, guaranteeing that your actual card number is never shown to a retailer. However, digital wallets are not accepted everywhere. Unlike virtual cards, which may be used for any online purchase that accepts credit cards, digital wallets can only be used at participating stores, whether online or in-store. VCC advantages Security: Global credit card fraud losses totaled $28.58 billion in 2020, with projections to reach $49.32 billion by 2030. Given the magnitude of these numbers, security should be a priority for all companies. Virtual credit cards help prevent fraudsters from stealing your company’s credit card information or hacking into your online transactions. Why? because VCC numbers are meaningless to fraudsters. The growth in corporate credit card fraud, as previously mentioned, is a driving reason for growth in the VCC industry. A JPMorgan survey of over 8,000 professionals found that VCCs were only targeted by scammers in 3% of the cases, while corporate credit cards were attacked in 34% of the cases. Low fees and costs: Most virtual card issuers don't charge customers anything more for the service, and it allows them to use a new asset without having to open a new account. Seamless Payment Method: There are various levels to the exceedingly complicated structure of domestic business payments. The sheer number of payments made and received by each company is the first layer of complication. According to Juniper Research, the average North American company makes 2,275 domestic payments in a single year. With so many small firms in North America, the average number of payments made by major corporations will exceed 100,000 every year, which works out to more than 270 payments every day. Given a large number of payments, the effort of handling these payments is massive, and the number of channels involved adds to the complexity. There’s also the issue of payment terms and deadlines, which differ from one vendor to the next. Other factors, such as invoice factoring or supply chain financing, may also further complicate the process. Fundamentally, this means that controlling payment flows is a difficult problem that demands a significant amount of resources. Virtual cards often allow additional transaction data, such as payee reference numbers, transaction category data, etc., to be linked to records, which is a crucial advantage for business operations. This speeds up payment reconciliation for both A/P and A/R procedures. Expense Management: Businesses can use VCCs to get more control over their employees’ expenditures. When an employee travels on business, they can estimate the cost of the trip and establish a VCC spending limit accordingly. For example, if the estimated amount is $1,000, the employee can request a $1,000 VCC from the corporation. By establishing spending limits on employees, a VCC reduces the financial risk to the company. VCC adoption challenges Like other innovative technological applications, virtual credit cards present their own set of challenges: Vendor adaptation: The fact that not all vendors are ready to take payments via virtual methods is a significant barrier. This problem occurs most frequently when purchasing goods or services from businesses that demand a physical card as proof of identity to prevent fraud, such as hotels that require visitors to provide a physical card at check-in or fax a credit card authorization form to confirm their reservation. However, as the payment industry evolves, many suppliers are making greater efforts to handle virtual payments, and major credit card networks have begun to offer mobile wallets for corporate use, implying that virtual credit cards will combine with mobile wallets in the not-too-distant future. Returns & Refunds: This point is not particularly limited to companies, as individual consumers also face the same issue. With virtual credit cards, returning products ordered online to a real store might be difficult. This is because some retailers ask customers to swipe or enter the card used to make the transaction in order to process any refund. This certainly isn’t possible with a virtual credit card. In some situations, customers may have to accept store credit rather than a refund on their credit card. Recurring payments: recurring payments such as subscriptions may be affected by virtual credit cards with short expiration dates. To keep the subscription active, users have to update the virtual credit card information each time it expires. If they forget, the subscription may be suspended, requiring customers to repeat the process with a new virtual credit card number. However, some virtual credit cards could be easily set up with a specific spending limit and the preferred recurrence (for example, monthly or quarterly). Company migration: For some businesses, implementing virtual credit cards might be a difficult task. Companies that sign up directly with a payment partner will work with them to develop this payment mechanism on the technical side. Employee training following the rollout is another challenge for some organizations, especially those in industries that have long depended on more traditional payment methods. To sum up, virtual cards are gaining in popularity and are an excellent way to make safe payments. They are especially useful in business settings where a large number of employees require company cards, which are more expensive to operate with physical equipment and may be more vulnerable to manipulation and fraud. Virtual card numbers are one option for companies to manage finances and transactions with increased spending controls and reporting features while eliminating security concerns on both sides of a transaction as privacy becomes more essential. However, like any new technology, virtual credit cards have their own set of obstacles that might hinder some companies from using them based on their payment needs. Author: Mariam Elmaghraby Sources https://www.juniperresearch.com/press/virtual-card-transaction-values-to-increase?ch=370% https://www.juniperresearch.com/researchstore/fintech-payments/virtual-cards-market-research-report https://www.paymentsdive.com/news/card-industry-faces-400b-in-fraud-losses-over-next-decade-nilson-says/611521/#:~:text=Fighting%20fraud&text=Global%20card%20fraud%20losses%20of,2019%2C%20per%20the%20Nilson%20report. https://cdn2.hubspot.net/hubfs/418036/WP_Sage_AP_Automation_virtualcreditcard-jul2017.pdf https://www.forbes.com/advisor/credit-cards/virtual-credit-card-numbers-guide/ https://www.axerve.com/en/learn/insights/virtual-credit-cards https://www.creditkarma.com/credit-cards/i/virtual-credit-card https://www.avidxchange.com/blog/virtual-credit-cards-what-they-are-why-theyre-so-popular/ https://www.cnet.com/personal-finance/credit-cards/what-is-a-virtual-card-and-how-do-you-use-it/

The rapid evolution of technology has opened multiple doors for innovation. Despite the economic plunge caused by the COVID-19 pandemic, industries all over the world are trying to recover. Even better, they are coming back with greater visions. Industries have been increasingly focusing on developing unique and innovative products designed to address current needs while incorporating futuristic features. The automotive industry is no exception. For decades, car producers and Original Equipment Manufacturers (OEMs) challenged themselves to offer customers a wide variety of cars, equipped with the latest technologies. Opportunities in the automotive industry seem nearly endless. However, two key trends are set to further push the automotive industry forward in the long run: electrification and connectivity. These trends are mainly driven by policy changes and technology. Electrification Initiatives & Regulations Electrification in the automotive industry refers to the replacement of a car’s Internal Combustion Engine (ICE) with an electric battery. Cars equipped with such “Engine” are referred to as Battery Electric Vehicles (BEVs), or simply EVs. One of their main benefits is their contribution to greenhouse gas (GHG) emission reduction, which is highly encouraged by policymakers and governments through various initiatives and regulations. Among these is the European Union’s “Fit for 55” program, which aims to reduce GHG emissions by 55% by 2030 (McKinsey, 2021). As for the US, President Biden announced a new target of up to a 52% GHG reduction by 2030 (The White House, 2021). In Asia, India aims for a 45% reduction target by the same year (BBC, 2021). However, China, the world’s number one in CO2 emissions, is still behind in such initiatives, having announced that it would reduce carbon emissions by 20% by 2035 and achieve neutrality by 2060 (IHS Markit, 2021). Incentives Besides the regulations, governments have introduced several incentives to encourage the use of EVs. In Europe, for instance, France and Poland offer grants which can go up to EUR 6,000, if some conditions are met, for the purchase of an electric or hybrid car. Italy provides incentives of up to 40% of the purchase price as well as tax exemptions for the first 5 years. In the US, car buyers can benefit from a federal tax credit of up to $7,500. In Asia, China proposed a tax exemption on purchases for 2 years, and India offers a subsidy of INR 10,000 ($136.4) per kWh. Future projections Electric vehicles are projected to become more widely available globally. Some countries are even planning to completely ban the sale of diesel cars, leaving electric vehicles with essentially no competition. In 2020, more than 10 million electric cars were on the road globally. This number is set to grow to 300 million vehicles by 2030, according to the Net Emissions by 2050 Scenario (IEA, 2021). OEMs are also determined to increase their EV car production. According to the research team of Credit Suisse Global Auto, the global EV production share of total vehicle production is set to increase from 11% in 2020 to 62% in 2030, with the number of fully electric vehicles projected to reach around 29 million. (Embedded Computing, 2021). While these figures might seem too ambitious, many OEMs have already started taking initiatives to reach that goal. For instance, Volkswagen Group, converted its German plant in Zwickau to produce EVs instead of ICE vehicles, making it the first large-scale EV production plant worldwide. Jaguar Land Rover (JLR), on the other hand, started on R&D of BEVs after a loan securement of EUR 749 million (Autovista, 2022). By 2030, several OEMs plan to reach about 50% as an EV fleet. Percentage of OEM EV Fleet Over Time [caption id="attachment_8218" align="aligncenter" width="440"] Source: Embedded Computing[/caption] Sales of EVs are forecasted to represent 60% of all new vehicle sales, compared to 4.6% in 2020 (IEA, 2021). Projected EV Car Sales in Units [caption id="attachment_8223" align="aligncenter" width="443"] Source: International Energy Agency[/caption] Electric Vehicle Chargers Market The electric vehicle charger market is also expected to grow at a CAGR of 26.8% (2020-2027) to reach USD 25.5 billion by 2027. A fast scenario projection done by the International Energy Agency sees the number of chargers publicly available around the world reaching 2.5 million chargers by 2030, from only 385,678 chargers in 2020. One example of government incentives encouraging charging installation is France. The country offers a tax grant of up to EUR 300 per person for the installation of a charging station at home. This shows the emphasis governments place on making sure that it is more convenient to own an electric vehicle rather than a diesel engine car. Connectivity Apart from electrification, connectivity through technology is another factor contributing to the race to build the cars of the future. From digital screens to external platforms such as Android Auto or Apple CarPlay, we have witnessed the introduction of several connectivity features in the automotive industry in the last decade. Yet, the automotive industry is still looking for new ways to innovate. With the continuous efforts to integrate 5G, Internet of Things (IoT), and Artificial Intelligence (AI), automotive connectivity can only be seen as imminent. The three pillars of connectivity Connectivity can be separated into three pillars: infotainment, telematics, and infrastructure. Infotainment represents the link between the passengers and the vehicle, including in-car entertainment, integrated digital cockpit, heads-up display, and Wi-Fi. Telematics consists of the monitoring of information through telecommunication devices, including the cloud. It can allow the car to gather data on the driver’s behavior, for example. The infrastructure connects the car to its surroundings, allowing it to recognize and distinguish traffic lights, pedestrians, and even other vehicles with the same feature(s). Automation (Level 5) Several features within automotive connectivity are growing, and one of them is driving automation. Connectivity will soon enable OEMs to provide the ultimate level of driving automation — level 5. Level 5 is the full automation level where the vehicle performs all the driving aspects without any supervision or human interaction requirements. According to a McKinsey report, this ultimate level is expected to be reached and widely adopted by 2030. Vehicle-to-Vehicle (V2V) Another feature is the Vehicle-to-Vehicle (V2V) connectivity, which enables vehicles to “talk” to each other through real-time data sharing. For instance, Stellantis, the joint venture between Fiat-Chrysler-Alfa Romeo (FCA) and the French PSA group, announced last year its software strategy, which aims to provide 36 million connected cars by 2030, through a 4-year investment of more than EUR 30 billion (Stellantis, 2021). Mercedes-Benz also announced plans to reach 20 million fully connected vehicles by 2025 (Automotive World, 2020). Future projections In 2020, the connected car market was worth around USD 55.6 billion, with nearly 47.5 million connected cars circulating worldwide. This same market is set to reach USD 191.83 billion, growing by 245% in 8 years (Carzato, 2021). By 2025, connected vehicles are expected to attain a share of 53%. The latter is expected to grow even more, reaching 77% by 2030 (Ericsson, 2021). Overall, the automotive industry is heading towards a brighter and cleaner future. OEMs are extensively working on their R&D to create cars tailored to the customers’ needs and suitable for the environment. While electrification will play a big role in reducing GHG emissions, connectivity will provide customers with interactivity and more comfort. What does this mean for OEMs? There will certainly be a massive need for expert skillsets to develop these cars of the future. Partnerships between car manufacturers might be a solution to overcome the skillset shortage. As for consumers, the main topic of debate will be data privacy. Connectivity will require access and storage of data, meaning that your personal car will have data on exactly where you have been every single time. However, according to Deloitte, this would not be an issue as consumers might consent to share their own data with their car’s laptop, provided this would allow them to save time or money, and it would provide them with a safe driving experience. Author: Mohamed Kamal Sources: https://www.iea.org/articles/global-ev-data-explorer https://www.alliedmarketresearch.com/electric-vehicle-charger-evc-market https://www.mckinsey.com/industries/automotive-and-assembly/our-insights/why-the-automotive-future-is-electric https://www.whitehouse.gov/briefing-room/statements-releases/2021/04/22/fact-sheet-president-biden-sets-2030-greenhouse-gas-pollution-reduction-target-aimed-at-creating-good-paying-union-jobs-and-securing-u-s-leadership-on-clean-energy-technologies/ bbc.com https://www.french-property.com/news/money_france/tax_credit_purchase_electric_cars https://cleantechnica.com/2022/02/01/polands-ev-market-is-quickly-catching-up-with-the-rest-of-europe/ https://blog.wallbox.com/italy-ev-incentives/ https://www.fueleconomy.gov/feg/taxevb.shtml#:~:text=Federal%20Tax%20Credit%20Up%20To,local%20incentives%20may%20also%20apply. cleantechnica.com https://e-amrit.niti.gov.in/electric-vehicle-incentives https://autovista24.autovistagroup.com/news/analysis-eu-electric-vehicles-gain-share-market/ https://www.iea.org/reports/global-ev-outlook-2021/trends-and-developments-in-electric-vehicle-markets https://embeddedcomputing.com/application/automotive/electric-vehicles-powertrain/the-race-to-automotive-electrification-what-it-takes-to-win https://www.volkswagenag.com/en/news/2019/03/VW_Group_JPK_19.html https://www.cnbc.com/2021/05/26/ford-ups-ev-investments-targets-40percent-electric-car-sales-by-2030-under-latest-turnaround-plan.html https://www.carzato.com/the-future-of-connected-cars/#:~:text=There%20were%20roughly%2047.5%20million,to%20%24191.83%20billion%20by%202028. https://www.ericsson.com/en/blog/2021/6/charting-the-future-of-connected-cars-and-mobility-with-5g https://www.stellantis.com/en/investors/events/sw-day-2021?adobe_mc_ref= https://www.jabil.com/blog/automotive-connectivity-trends-fueling-the-future.html https://www.mckinsey.com/features/mckinsey-center-for-future-mobility/overview/autonomous-driving https://www.automotiveworld.com/news-releases/new-mercedes-benz-strategy-announced-targeting-structurally-higher-profitability/ https://ihsmarkit.com/research-analysis/auto-electrification-and-decarbonization-shift-toward-net-zero.html https://medium.com/connectedcars/key-trends-shaping-the-future-of-the-automotive-industry-3655c15687c7

After attracting mainstream attention when Beeple sold his NFT collection for a whopping $69 million at Christie’s (1), the non-fungible token marketplace registered an unprecedented boom by the end of 2021, with sales recording a 21,000% jump compared to 2020’s numbers, according to a report from NFT data company “Nonfungible.com”, partnered with BNP Paribas’s L’Atelier (2). While the future of this market remains open to speculation, we will explore three possible scenarios the NFT market might experience based on examples of real NFT projects. Blockchain & Ethereum: Key enablers of NFTs To better speculate on the future scenarios of NFTs, we need to gain a better understanding of their foundation, specifically Blockchain, which serves as the backbone of NFTs. Blockchain was developed in the aftermath of the 2008 financial crisis, becoming a massive enabler for change in a broken system. Blockchain records all transactions in a way that makes it nearly impossible to hack, cheat, or change the system. The goal behind this technology was to create a new decentralized monetary system by transferring control and decision-making from centralized entities to a distributed network. The major blockchain innovations were cryptocurrencies (e.g., Bitcoin, Ethereum…) and NFTs. Ethereum is a cryptocurrency that can be obtained in the same manner that a national currency can be exchanged for a foreign currency. The only difference is that instead of going to banks, people can exchange their money on secure platforms such as Coinbase or Metamask (3). Although banks might be considered a more secure option given the fact that they are insured, crypto exchanges are far more secure since they are built on Blockchain technology, which ensures that every touchpoint is tracked, making it near impossible for any transaction to be hacked. Ethereum provides an additional versatile platform to other cryptos, which allows developers to implement Smart Contracts, improving traceability and verification (4). 1st Scenario: -The Good- NFTs Advantages and use cases as an enabler for a better future Historically, the economy works in such a way that the final consumer earns money, which he then spends on buying physical goods. However, with the advent of digital tools (social media, gaming, streaming…), consumption habits are changing. Transactions are shifting away from physical goods and more toward digital goods, which poses a problem: digital goods are harder to monetize. Consider the following example: an artist creates a physical painting that he attempts to sell, and someone attempts to produce replicas of his artwork. The buyer, in this case, would be able to tell the difference between the authentic and “fake” painting (brush strokes, signature, etc.). However, in the case of a digital artist, painting the same piece of art on his digital tool, he runs the risk of losing control over the asset the moment he puts it up for sale (as a JPEG image), given how easy it is to make copies, which would then look identical to the original art form, causing it to lose scarcity and thus value. This is what NFTs are trying to change. Based on Blockchain technology, NFTs can indisputably verify the original version of a digital product, which is attributed to a one-of-a-kind token of ownership that has a unique value. So, when people are trading NFTs, what they are really doing is buying and selling their virtual ownership of something. Based on this formula, we will present 3 future usages of NFTs that can potentially change how we perceive the digital world. Community -Bored Ape Yacht Club- While the bar regarding customer relationship is currently set so low in many NFT projects (essentially no customer relationship after the transaction), there is one collection of NFTs called the “Bored Ape Yacht Club”, with 10,000 unique ape images (the cheapest one going for $200,000). The point is, we regularly find that superstars (Neymar, Post Malone, etc.) and people who own these NFTs are using these photos everywhere, as a symbol of pride that they’re part of this exclusive club. On top of that, the creators of this Bored Ape collection organize physical get-togethers for people who own a bored ape NFT (5). Although this remains the exception, for now, we can expect a brighter future for NFT projects following a similar, or inspired approach, giving more than ownership of an NFT. Gaming -Blankos Block Party- Many companies are betting that NFTs will enter the video game world in a big way, which, if successful, could introduce NFTs to a massive new audience and forever change the way we value digital objects. Think of this: gamers already spend money on buying and selling game keys, digital weapons, and rare skins (cosmetic gear). Although these operate on legally dicey ground, it’s the game developer that ultimately owns the traded goods, not the players. A good example that comes to mind is Counter Strike: Global Offensive, which has always had one of the most significant grey markets, with players allegedly spending $100,000 on a specific weapon skin (6). This is where Blankos comes into play. The game operates on the premises of accessibility, ownership, and scarcity. It is a free title where players can collect, customize, or sell NFTs of characters and objects created by developers and major brands. The results so far speak for themselves. Blankos entered early access in June 2021. One week later, it recorded 100,000 NFT purchases, with major brands and artists including Burberry, Quiccs, and Deadmau5 launching in-game items (7). Documentation -Blockcerts- It is possible to use NFTs to verify documentation, such as certifications, diplomas, medical histories, passports, etc. For example, when it comes to academic credentials, hiring managers can quickly verify the certifications and degrees of job candidates. This would be a huge breakthrough to prevent fraud and smooth the verification processes. Blockcerts is a blockchain-based service that already makes it possible to verify academic credentials (8). However, it doesn’t use NFT technology quite yet, which would make it even more useful in the future. 2nd Scenario: -The bad- NFTs, the next financial bubble The NFT market has lately been criticized for being a bubble. A report from “Nonfungible.com” presents the market as a buyers’ market. In fact, while the number of NFT sellers increased by a mind-blowing 3,669% compared to last year, the number of buyers increased by “only” 2,962%. The report also finds that NFTs are kept for only 48 days on average in 2021 before being sold, compared to 156 days the year before (9). This sparks concerns that the market might be saturated. Additionally, looking at NFT’s “Silent Crash”, which occurred in April 2021, the floor value of NFTs dropped significantly. Although prices had been slowly dropping since February 2021, as buyers weren’t investing or buying and sellers had to drop their prices because the market wasn’t moving, the NFT market took a hit. By June 2021, news headlined that the NFT market had officially crashed, falling nearly 90% from its peak (in May) (10). Eventually, the NFT market survived, mainly with NFT buyers showing an upward trend, helped by athletes and celebrities showing off their NFT collectibles. Fast forward to March 2022, where the average sale price of an NFT is now below $2,000, down from over $6,800 in January, according to Nonfungible (11). Even the Bored Ape Yacht Club, one of the best names in the NFT sphere, has seen its value slip. Not so long ago, the NFT market capitalization had reached $23 million. By April 21st, 2022, it was barely over $10 million, according to CoinMarketCap(12) . Although this drop may seem to be caused by a variety of factors, such as inflation, the Ukrainian/Russian war, as well as the increased scrutiny of NFTs by the Securities and Exchange Commission, skeptics are still warning of an NFT collapse, described as a “cataclysmic market crash” (13). 3rd Scenario: -The ugly- NFTs, scam, cash grab, and environmental disaster The more people discover about how NFTs are currently being used, the more concerned they get about what is yet to come. In fact, while NFTs were created with the intention of respecting the artist, the majority of them now are being used as cash grabs by opportunistic business owners. As an example, we can take a look at the Lazy Lions, which have been described as mass-produced, computer-generated cash grabs that have been manipulating the market (14). Additionally, almost all NFT transactions use Ethereum, which is not environmentally friendly, to say the least. Ethereum uses a security mechanism called proof of work, which is what makes the NFTs fraud-proof. This security measure requires a significant number of computers around the world to be working simultaneously, resulting in high electricity consumption. While many do not see how NFTs could be the next big thing in the digital world, some see it as a digital breakthrough. NFTs are believed to be putting power and economic control back into the hands of digital creators and pushing forward the next internet revolution. This being said, NFTs have a long way to go to reach this potential. Sources: 1: The Wall Street Journal: Your NFT Sold for $69 Million. 2: The 2021 NFT Market Report: Presented by Non-fungible and L’Atelier 3: Forbes: How to Buy a Cryptocurrency? 4: Ethereum: What’s an NFT ? 5: CNET: Bored Ape Yacht Club NFTs: Everything you need to know 6: Ginx: Someone bought a CS:GO Skin for $100,000. 7: Engadget: Blankos Block Party is an NFT Trojan Horse for the video game industry 8: Blockcerts.org 9: The 2021 NFT Market Report: Presented by Non-fungible and L’Atelier 10: Kotaku The NFT Market Has Collapsed, Oh No 11: Nonfungible.com/Market-tracker 12: CoinMarketCap/Nft 13: Fortune: NFT Collector predicts the market is about to crash 14: NFT evening: Lazy lions market manipulation

Economic shockwaves have been felt across all industries as penalties from the European Union, the US, and many other countries ramp up on the Russian Federation. Energy prices are rising, stock prices are falling, supply chains are collapsing, and inflation has reached record levels. These recent events have demonstrated that countries can be completely cut off from the global financial system or have their assets become worthless overnight. However, how strong will the Russian war affect the financial sector, and most importantly, how long will this effect last? In order to assess the consequences of the war in Ukraine, it’s vital to list the main restrictions imposed on Russia recently: Restrictions on the Russian financial sector According to statistics from S&P Global Market Intelligence, the vast majority of Russia's commercial banking industry has been subject to international sanctions as a result of the country's invasion of Ukraine. Foreign governments have imposed a set of restrictions against Russian banks, including capital market bans, asset freezes, and withdrawal from the Swift messaging system that facilitates financial transactions globally. The value of assets held by Russian commercial banks that are subject to the new sanctions exceeds 91 trillion rubles, or approximately over 80% of the 114.55 trillion rubles in total assets held by the country's banking industry as of September 30, 2021. The majority of the lenders that have been impacted are Russia's systemically large financial institutions. Swift withdrawal Several banks have been removed from Swift: PJSC Bank Otkritie Financial Corp., Joint-Stock Commercial Bank NOVIKOMBANK, PJSC Promsvyazbank, Bank Rossiya, PJSC Sovcombank, State Development Corp. VEB.RF, and VTB Bank PJSC. Sberbank of Russia and Gazprombank JSC, two of the country's biggest lenders, were exempted from the Swift cut-off so that energy payments to Russia could continue. The US, on the other hand, placed correspondent and payable-through account sanctions on Sberbank and its subsidiaries, effectively cutting them off from the US financial system and limiting their access to dollar transactions. Similar restrictions were also imposed in the United Kingdom. Frozen assets Most of the banks that were withdrawn from Swift had their assets frozen by the EU and the UK, while the US imposed full blocking sanctions on them, shutting them off from the US financial system, freezing their assets, and forbidding US individuals and businesses from doing business with them. Individual sanctions have also been imposed on a number of bank executives and major shareholders. Some of the banks were already operating under restrictions imposed after Russia's 2014 annexation of Crimea. The US, EU, UK, and Canada also decided to freeze foreign assets of the Central Bank of Russia, reducing its ability to mitigate the impact of the sanctions and support the country's banks with their foreign exchange needs. As a result of the sanctions, Russia lost access to over half of its $640 billion in reserves, according to Reuters, citing Russian Finance Minister Anton Siluanov. It is important to note that the Russian subsidiaries of international lenders such as France's Société Générale Société anonyme, Italy's UniCredit SpA, Austria's Raiffeisen Bank International AG, and Hungary's OTP Bank Nyrt are not subject to these sanctions. Many international banks, however, have warned that the conflict may cause them to lose their investments in Russia, especially after the USA decided to prohibit all investments in the Russian Federation by U.S. citizens. OFAC Blocking of Sberbank and Alfa-Bank The U.S. Department of the Treasury’s Office of Foreign Assets Control (“OFAC”) imposed blocking sanctions on two major Russian banks – Sberbank and Alfa-Bank – and added them and 48 of their subsidiaries to OFAC’s Specially Designated Nationals and Blocked Persons List (“SDN List”). Prior to this, both entities had been subjected to considerable but less severe restrictions. By implementing the blocking sanction, OFAC has effectively banned all transactions involving these two banks by U.S. individuals or in (or through) the United States. Furthermore, all entities directly or indirectly owned (50% or more) by one or more of these institutions, whether individually or collectively, and any other blocked Russian individual or organization, whether or not named on the SDN List, are subject to the same penalties. Impact of the war and restrictions SWIFT alternative With the United States, the UK, Europe, and Canada suspending some Russian banks from SWIFT on February 26th – essentially attempting to deny Russia access to the financial markets – many have speculated on the impact this will have on the payments ecosystem. Concerns have been raised about how payments for Russian energy imports would be handled, whether international creditors would be reimbursed, and how much nesting would be encouraged. In reaction to its withdrawal, the Russian Central Bank has claimed its SWIFT alternative – the Financial Message Transfer System (FMTS), established in the wake of the 2014 invasion of Crimea – is primed. FMTS delivered two million messages in 2020, according to Reuters, which accounts for almost a fifth of Russia’s internal traffic. Institutional participation in the system, on the other hand, is nowhere near what it has to be to keep Russia afloat in the international money transfer sector. Currently, the majority of members are Russian and Belarusian banks. Regardless of FMTS’ short-term success, the bottom line here is that the west’s use of the SWIFT “financial nuclear weapon” – as French Finance Minister Bruno Le Maire called it – will, at the very least, be fragmenting the global payments landscape. Currency The Russian ruble has suffered a severe depreciation as a result of geopolitical tensions and the international response to the situation in Ukraine. The central bank boosted the benchmark interest rate to 20% from 9.5% in an effort to support the currency and urged exporters to convert 80% of their revenue into rubles. Bans on foreign-currency loans and transfers to non-residents have also been implemented by the government, among other restrictions. US dollar to Russian ruble exchange rate: Number of rubles against the dollar from Feb 1, 2022, to March 16, 2022. [caption id="attachment_8243" align="aligncenter" width="451"] Data compiled March 17,2022Source: S&P Global Market Intelligence[/caption] Rise of Cryptocurrencies However, it should be noted that not all areas of the financial services industry are at a disadvantage during this crisis. "Cryptocurrency and related services will benefit," said Michael Clouser, co-founder of The Startup Race. “People are losing trust in central currencies due to political instability, and actors are seeking to circumvent sanctions and SWIFT shutdowns.” Rising oil prices might lead to even more inflation, according to Clouser, and central bank-controlled currencies will lose value as people lose confidence in them. “Alternative currencies – those besides Bitcoin – will rise in price, such as Monero and other cryptos with privacy by design.” Additionally, cryptocurrency is also operating as a safe haven for many ordinary Russian residents who are trying to keep their savings secure from a banking system that has several restrictions and vulnerabilities as the ruble's value falls. Threat to global banks With over US$100 billion of Russian debt held by foreign banks, concerns have been raised about the risks to banks outside Russia and the potential for a default to trigger a liquidity crisis similar to the one that occurred in 2008. European banks, particularly those in Austria, France, and Italy, are the most vulnerable to Russia's latest sanctions. According to data from the Bank for International Settlements (BIS), French and Italian banks each have roughly US$25 billion in outstanding claims on Russian debt, while Austrian banks have US$17.5 billion. Banks will certainly be impacted in other ways as well. Switzerland, Cyprus, and the UK, for example, are the most popular locations for Russian billionaires looking to deposit their money abroad. Cyprus also attracts Russian wealth with golden passports and visas. Because of the sanctions, all of these nations' financial institutions are expected to lose business. For example, the stock values of UK banks, Lloyds and NatWest, have both fallen by more than 10% since the invasion started. To sum up, the war's effects might be vast, and many more will almost certainly emerge in the coming weeks and months. The financial sector has responded to the Russia-Ukraine war in a way that has never been seen before. With the increasing speed with which banks and financial corporations announce their own embargoes against Russia, the country is becoming increasingly isolated from the rest of the world. Internationally, the markets have been highly unstable as the global economy continues to recover from the pandemic while also dealing with high inflation. Yet, the invasion of Ukraine has exacerbated the situation, and financial markets will be on high alert to observe how things unfold. Author: Mariam ElMaghraby Sources: https://www.finextra.com/the-long-read/358/how-is-the-russia-ukraine-war-impacting-the-financial-and-tech-sectors https://www.spglobal.com/marketintelligence/en/news-insights/latest-news-headlines/more-than-80-of-russia-s-banking-sector-subject-to-sanctions-over-ukraine-war-69434351 https://www.natlawreview.com/article/biden-administration-rolls-out-new-tranche-sanctions-russia-blocking-major-russian https://www.business-standard.com/article/international/could-the-russian-invasion-of-ukraine-spark-a-global-financial-crisis-122030600191_1.html https://www.worldbank.org/en/news/press-release/2022/04/10/russian-invasion-to-shrink-ukraine-economy-by-45-percent-this-year https://theconversation.com/how-the-russia-ukraine-conflict-has-put-cryptocurrencies-in-the-spotlight-180527

The technology sector has experienced a very difficult year in 2021 on many levels. The global shortage of chips affected many high-value industries. The year 2022 does not look much different with major supply chain concerns. But it's not all doom and gloom. The tech sector and the gaming industry specifically are known for their great adaptability. The cloud gaming market is led by several giant companies with various models, including Google, Amazon, Facebook, Apple, Intel, Nvidia, and Sony. But what is cloud gaming about? How does it work? Cloud gaming promises top-notch graphics and performance without the need for expensive hardware or extensive updates or downloads. Instead of having a high-end PC gaming console at home, cloud gaming platforms run the software from a remote data center. Amazon, Microsoft, EA, Sony, Facebook, and Google are betting that the emerging business of cloud gaming will become the future of the gaming industry and an alternative solution to the supply chain issues faced by the sector. Amazon Amazon Luna is only available in early access, which means users must receive an invitation to sign up for the service. However, users of Fire TV and/or Fire Tablet devices, don't need an invitation and can instantly sign up for one or more of Amazon Luna's subscription plans. Buyers can purchase the Luna Controller even if they don't have an Amazon Luna subscription. Amazon Luna has three "Channels" subscription packages, which give access to different game selections. At the same time, Amazon has an extremely important competitive advantage, namely its video game streaming platform, Twitch. In 2020, there were about 41.5 million Twitch users in the U.S., and that number is expected to grow to 51.6 million by 2024. Twitch remains a high potential tool for Amazon to switch or even onboard users to its cloud gaming platform. It seems Amazon has a well-laid plan to take the crown of cloud gaming platforms. It's hard to say whether Luna will be a success, as the cloud gaming service is still in its infancy. Also, when comparing Amazon Luna to other cloud gaming services, from Xbox's xCloud to PS Now, it doesn't seem to attract many gamers. However, at a price point of $5.99, Luna is ideal for those just getting into cloud gaming. That said, Amazon's cloud gaming service behaves similarly to its larger competitors: even with a great internet connection, gamers will notice a slight delay. One of the key factors in Amazon Luna's success compared to other platforms is the way the service is approached as a whole: no additional fees when a new game is introduced, no hidden charges, and consistent quality of service. Amazon has acted differently in its strategy, focusing on what consumers want - better access to the games they already love or look forward to and not exploiting its platform to promote and highlight its games as Google Stadia did, which has had a positive effect on user perception. The idea of exclusivity is not as important as it used to be, and the release of a library of Google Stadia exclusives is a testament to that. Nvidia GeForce Now Nvidia did not let the opportunity pass without launching its streaming platform. The final version of its GeForce Now was launched in February 2020 after several beta versions and offers three levels of service. GeForce now service is not a platform with a catalog of games like Luna, but more of an access to a selection of compatible games from Steam, Epic Games, GoG, or Uplay game stores. With Cloud Play, Steam integrates GeForce Now directly into its platform, which makes it possible to play directly on Nvidia's servers from the Steam client with a few clicks. A pertinent question arises in this case, what's the point of subscribing to the GeForce Now service if the service will also redirect us to another game store? The answer lies in the fact that Nvidia offers these games on high-performance servers, so the real service is the rental of servers included in the subscription, such as its RTX 3080 which delivers the ultra-performance that gamers crave. However, Nvidia's weak point is the lack of agreement with some publishers who explicitly refuse to offer their games on the service. Nvidia's GeForce Now has a free tier, but the best experience costs $10 a month for the priority tier or $100 every six months for the new RTX 3080 tier (graphics cards deliver the ultra-performance that gamers crave), which allows 1440p gaming at 120Hz. Since the end of 2021, a third level is available, using RTX 3080. This power boost allows for a 1440p definition at 120 frames per second. The servers are also separated, with an Adaptive-Sync system. PS Now – Sony Sony, one of the leaders of the gaming market in the world, offers through its PlayStation Now platform a catalog of more than 600 games available for streaming in 720p definition. Sony’s experience in the gaming market with the PlayStation, as well as its large user base, have contributed to the company’s smooth transition into cloud gaming. The service, which has several million subscribers, offers its catalog of PS4 games for download on a PS4 or PS5, which can be played even offline and in native definition. Faced with the competition, Sony had the idea of offering each month strong games from its catalog such as Metro Exodus or Spider-Man that are available temporarily, usually for three months, in the catalog. This was for the gaming giant, a way to remedy the fact that the catalog of games is a bit sparse in recent titles. Google Stadia Google was one of the first entrants into the cloud gaming market in 2019. The concept was neither more nor less than a dematerialized game console. The platform's compatibility makes it accessible on a TV using a Chromecast Ultra and a Stadia controller, on a PC with Google Chrome, and on Android with the official app. In early February 2021, Google decided to shut down its video game studio after several technical problems, in addition to its very limited catalog of games. Google could not take advantage of the promising start of the service. Stadia’s hastened launch, compared to other operators, had implications that contributed to its fall. Unlike the other players in the gaming industry, Google did not have much to show for it, except for the technology, which is mainly seen in the games offered on Stadia. The company had to find expensive solutions to feed its catalog by introducing third-party games on the platform such as Red Dead Redemption, which would have cost tens of millions of dollars. Stadia's case has prompted other players to seek third-party support before launch, coupled with a strong lineup of exclusives. This experience has shown that being the first to enter the market does not ensure an advantage, even when backed by significant funding. Microsoft: Xbox Game Pass (xCloud) Microsoft has launched its Xbox Game Pass Ultimate offer in September 2020. The company has benefited from its gaming successes (Gears of War, Forza, Halo, etc.), but has also made use of games from third-party studios or independent games. Every month, new games are added to the catalog, which ensures that xCloud has a strong position among users. Potential entrants Apple, Netflix, and Facebook have thought about launching their own cloud gaming services. Electronic Arts also wants to enter the race. The game publisher announced at "The annual Electronic Entertainment Expo (E3) 2018" that it is developing its cloud gaming service. In October 2018, EA's CTO Ken Moss said that this cloud gaming service was called Project Atlas, but the offerings of this product remain unclear. This service should combine Frostbite (graphics engine designed by DICE for EA), servers in the cloud, and artificial intelligence. Cloud gaming is transforming the video game market, with all the main players in digital technologies either already offering or currently developing their cloud gaming services. However, some players remain very discreet on the subject. The diversity of products and packages offered by Amazon, the flexibility in the use of its hardware, and the monopoly on streaming with its famous platform, Twitch, which continues to attract millions of users each year, make Amazon a major player in the sector. Amazon could also allow Twitch streamers to earn revenue from streaming Luna games and encourage viewers to join them in the game using Luna. There is also the prospect of a "Play on Luna" feature eventually appearing on Amazon as an alternative to buying physical or digital copies, although publishers may have a big problem with that. Cloud gaming has everything to be the future of video games, although it is not ready yet to completely replace home computers and consoles. The technology is in its infancy, and its development would depend on advancements in connectivity to provide a better alternative to gaming machines. 5G offerings could be a catalyst for the cloud gaming industry, eliminating connectivity issues and enhancing user experience. Sources: https://www.bbc.com/news/technology-53838645 https://www.gamesindustry.biz/articles/2018-05-22-ea-acquires-gamefly-subsidiary-for-cloud-gaming https://superparent.com/article/3006/amazon-luna-a-superparent-guide https://venturebeat.com/2021/11/09/intel-acquires-cloud-gaming-service-remotemyapp/ https://vortex.gg/ https://www.theverge.com/2021/7/23/22589398/facebook-cloud-gaming-web-app-launch-apple https://superparent.com/article/3006/amazon-luna-a-superparent-guide https://fossbytes.com/what-is-amazon-luna-everything-about-amazons-cloud-gaming-service/ https://www.lifewire.com/one-year-later-amazon-luna-just-keeps-getting-better-5205850 https://gizmodo.com/samsung-is-bringing-cloud-gaming-to-its-2022-tvs-1848295807 https://www.nvidia.com/en-us/geforce/graphics-cards/30-series/rtx-3080-3080ti/ https://9to5google.com/2022/02/21/amazon-luna-twitch-button-click-to-play/ https://9to5google.com/2022/02/21/amazon-luna-twitch-button-click-to-play/ https://www.theaureview.com/games/nvidia-geforce-now-review-a-next-gen-alternative/ https://www.theverge.com/2021/9/28/22698101/microsoft-xcloud-xbox-cloud-gaming-console-integration https://www.theverge.com/2021/8/9/22616774/microsoft-xcloud-windows-xbox-app-xbox-cloud-gaming-beta https://www.protocol.com/entertainment/cloud-gaming-future-google-stadia https://www.xda-developers.com/stadia-pro-50-games/ https://www.techradar.com/news/ps-now-gets-its-first-ever-day-one-release-but-it-isnt-as-great-as-it-seems https://www.altchar.com/game-news/ps-now-february-gta-vice-city-death-squared-little-big-workshop-and-more-aVc3i3m9YAJd https://www.pcgamesn.com/dying-light-2/nvidia-geforce-now-rtx-3080-ray-tracing

The telecommunications landscape has been ever-changing since the emergence of the competitive operators’ market in the 1980s. While traditionally players in this market have been known for providing their network services and infrastructure, nowadays, many telco operators are reporting a decrease in average revenues per user under these segments, which led to investors shying away. This new dynamic is mostly due to the diversification of consumer needs in the now technologically driven ecosystem, and telco players are not letting this golden opportunity pass by. The global abundance of tech is slowly but surely creating a new type of players in the industry, often referred to as Techcos. These players seek to differentiate their offerings, by providing tech-based products and services such as artificial intelligence (AI) analytics, Internet of Things (IoT), network automation, cloud…etc. Opportunities There are many positive outcomes that come with the diversification of telco players’ offerings into techs, such as performance improvement, a competitive edge in big data, and new revenue streams. New systems and tools such as IoT, data analytics, and cloud help players across the telecom industry reduce costs and cut down on resource waste. Furthermore, many jobs in the telecommunications industry can benefit from utilizing software services to improve their processes, such as technicians, line installers, and media providers. This entails the use of new technology to automate systems and increase performance for the tasks in question. Another opportunity that results from the shift to Techcos is the utilization of cloud technology specifically, which can help telco providers in delivering better and faster services to both channels (businesses and consumers). These new digital services can include the use of AI and machine learning (ML) infrastructures to increase the performance provided. This feature of the combined use of data and AI is unique to the emerging Techco players, who are already experienced at handling large-scale data, thus giving them a differentiating edge over their major cloud vendors/other tech competitors. Finally, 5G technology opens a new major revenue stream in digitization and the IoT market, which offers ground for new businesses and business models to develop and grow. The latter will see the telco players as more than just network providers but a digital marketplace that offers the possibility to monetize assets. This new segment has shone a light on the future of telcos, which would have been otherwise bleak had they continued to remain only a connectivity provider. Risks On the other hand, there are also challenges to the launch of telco players in ICT services, such as some players’ choice of the wrong approach, the obstacle of converting to customer-centric solutions, and the building of efficient partnerships. One of the key downsides is for players who chose to dive into the tech industry too quickly. Many have attempted to hastily convert their traditional services and offerings into the cloud, expecting to meet their customers’ needs. However, these players have underestimated the various complex aspects of this transition, which resulted in them incurring higher than expected costs. As they later discovered, the most effective approach for this transition is to use a hybrid model that encompasses aspects from both the traditional and new models. While the shift to digital offerings opens a new market for these telco players, such as the possibility of IoT solutions. Techcos must seek to become more than just commodity connectivity providers. The challenge is not to offer the fastest or most reliable network, but to become a solution provider, which entails a sense of “digital empathy” for their clients. This is to say that to achieve the desired results the shift must occur in a comprehensive manner that allows for the adoption of a new operating system, which considers all elements – from connectivity to infrastructure, to user security and customer-focused services. Finally, this transformation requires the players in the industry to become a sort of “one-stop-shop” for both B2B and B2B2C channels, thus taking on the responsibility that was once undertaken by ICT players who traditionally developed the tech used for the telco network. This shift, therefore, calls for partnerships and investments in both automation and the workforce in this field. COVID-19 Impact The digitalization of the telco market, which is a feature of the Fourth Industrial Revolution (Industry 4.0), has been sped up due to the COVID-19 pandemic. This is because of the highlighted need for a global digital transformation, consequently showing the potential for telcos to gain new streams of revenues. The COVID-19 outbreak has highlighted the fact that the telco industry is on the front lines of the world economy. Telco players are therefore aiming to keep the community connected and to ensure continuity in business operations during and after the pandemic. It also shows that advanced technology such as AI and 5G are critical to delivering solutions and platforms that can help navigate the pandemic. The cloud-computing segment, which was already gaining increasing popularity, has also become a catalyst of growth for telcos thanks to the pandemic. The flourishing demand for collaboration, remote work, and SaaS applications is helping companies profit from the surge of digital transformation. [caption id="attachment_8068" align="aligncenter" width="393"] Source: BusinessWire[/caption] Use Cases: MTN and Vodafone One of the leading examples of this shift can be seen in Africa’s biggest telco company MTN. This player announced its rebranding into a technology company in February of 2022. The shift also involves a logo change that is part of MTN’s newly adopted “Ambition 2025” strategy, aimed at providing “leading digital platforms for Africa’s progress”. The new-look is “aligned to our evolution from a telecommunications company to a technology company underpinned by one simple and consistent yet striking brand”, said Nompilo Morafo, MTN Group Chief Sustainability, and Corporate Affairs Officer. Vodafone on the other hand started developing a new technologically backed value proposition that relies on the use of IoT, 5G, and edge capabilities. Its efforts to become more than just a telco revolves around the digitalization of its customer experience, services, and business operations. During its 2020 industry analyst summit in London, which was intended for its Vodafone Business segment, it announced that around 60% of its core IT has been moved to the cloud. Moreover, the company has adopted a digital-first approach within its business and overall culture, which spans across its departments, from marketing and customer management to platform and solution development. The telecommunication industry is witnessing a shift in its landscape as telcos are beginning to build and offer tech-like products. While this new market offers many opportunities - such as automated systems, a competitive edge in data manipulation and additional revenue streams – the companies’ success depends on their capability to adopt the correct approach for the shift, offer customer-centric solutions, and build efficient partnerships. When done correctly, the transition of telco players into Techcos is a new source of growth that cannot be overlooked. Sources: Telco to Techco – Telecoms Europe Events From Telco to Techco (workpath.com) Vodafone idea: ‘From Telco to a Techco’: Enterprise business to catapult telecom industry to next level, Telecom News, ET Telecom (indiatimes.com) From telecoms to tech: MTN changes logo to look the part | TechCabal A Technological Shift in Telecommunications - Programming Insider Why telcos need to become 'Techcos' - TechCentral The Telecommunications Service Provider Journey - From Telco to Techco - Cloudera Blog Telco Vs Techcos – a Battlefield for the Future of ICT - IT News Africa - Up to date technology news, IT news, Digital news, Telecom news, Mobile news, Gadgets news, Analysis and Reports Vodafone Business: from telco to tech comms How has COVID-19 influenced the telecoms industry so far? - Telecoms.com

In recent times, inflation has been a topic of discussion for economists, politicians, and citizens alike. The pandemic has brought an end to a period that was marked with low-to-moderate inflation rates with even deflation plaguing countries such Thailand, Qatar, and Malaysia before the COVID outbreak. There has been a noticeable spike in the number of advanced economies with an inflation rate of above 5%. The number of emerging markets seeing higher inflation has also increased with 78 out of 109 Emerging market & Developing countries having an inflation rate of 5% or more. This leap is the first of its kind in a 20-year period. [caption id="attachment_8040" align="aligncenter" width="541"] Source: Project-Syndicate[/caption] Pandemic-related factors brought the annual inflation rate in the US to 7% in the last month of 2021, a fresh high since June of 1982. The U.K. and Canada had a whopping 30-year high inflation rate reaching 5.4% and 4.8% respectively. [caption id="attachment_8042" align="aligncenter" width="459"] Source: oecd.org[/caption] One of the major problems with inflation is that the lower social classes are the ones hit the hardest. According to the IMF, inflation has particularly negative consequences for households in low-income countries, where about 40% of consumer spending is on food. The reason inflation does not affect higher-income individuals and households is because they can afford to spend more money on basic goods contrary to their lower-income counterparts. A study conducted by Ipsos of 20,000 people from 30 different countries found that over 50% of participants reported an increase in the prices of clothing and shoes, housing, healthcare, and entertainment. Over 40% expect these costs to keep rising for several months to come. The UN noted that the FAO, Food Price Index, a measure of the monthly change in international prices of a basket of food commodities, reached a 10-year high in 2021, despite a small December decline. [caption id="attachment_8043" align="aligncenter" width="457"] Source: FAO.org[/caption] Reasons for the increase Many reasons contributed to prices rising at a substantial rate. Most of these reasons relate to the COVID-19 pandemic including supply constraints, economies reopening, fiscal stimulation, increased liquidity, higher energy prices, lower inflation in past years, higher unemployment, conflict between countries, and labor shortage. Supply constraints The fast spread of the virus in 2020 caused the shutdown of many industries around the world and with that, consumer demand also dampened, which in turn reduced industrial activity. After vaccines became widely available and many countries deemed their vaccination campaigns successful, economies reopened and suddenly, supply chains were faced with tremendous pressure. The supply of goods, once systematic and free-flowing pre-pandemic, was forced to a halt post-pandemic which damaged all the systems that were in place originally. Supply chain systems are not easy to implement as it requires coordination between a multitude of different parties. The surge in demand necessitated these systems to switch on and be fully functional in a short period, which is not feasible. [caption id="attachment_8044" align="aligncenter" width="454"] Source: BEA, BLS[/caption] A major culprit in price increases coming from the supply constraints is the semiconductor industry. Chips are increasingly present in most of the products we use, ranging from cars to remote controls to smart lights and a variety of different items that are used today. High Energy Prices [caption id="attachment_8045" align="aligncenter" width="443"] Source: U.S. Bureau of Labor Statistics[/caption] Oil prices have reached their highest level since 2008. Brent Crude, which represents the global oil benchmark, has increased to $130 per barrel. The spike has been driven primarily by fears of supply-side disruptions. The attack by Yemen’s Houthis on fuel trucks in Abu Dhabi, in which three people were killed played a part but the main reason has to do with the tensions between Russia, the world’s second-largest oil producer, and Ukraine. Energy prices in households are rising dramatically and their effects are directly being felt by consumers. Further, the key oil-producing countries have kept supply on a gradually increasing schedule despite the sharp increase in global crude prices. The OPEC countries decided to increase overall daily production by only 400,000 barrels in February, even though its own prediction is for demand to rise by 4.15 million barrels per day in 2022. 2022 Outlook According to the World Bank, Global inflation is expected to remain elevated throughout 2022. Supply bottlenecks and labor shortages are assumed to gradually dissipate through 2022, while inflation and commodity prices are assumed to gradually decline in the second half of the year. In the U.S. the central bank is under pressure to raise interest and tighten the economy further to combat inflation. However, the country is at a crossroads where raising rates might trigger a fresh global debt crisis, as its emerged poor-country repayments to creditors are already running at their highest level in two decades. The IMF warned that a quantitative tightening from the U.S. Federal Reserve could have a ripple effect on emerging markets by leading to capital outflows and currency depreciation. Emerging markets that borrowed most from the U.S. dollars are going to be hit the hardest by an increase in Interest Rates leading to potential country defaults. In the MENA region, the Economist Intelligence Unit has pointed out that the CPI is expected to remain high in 2021-2022 at an annual average of 14% due to the rise in international food and energy prices. Inflation will continue to be aggravated with Supply Chain bottlenecks and the post-pandemic increased demand in Middle Eastern countries. [caption id="attachment_8046" align="aligncenter" width="471"] Source: The Economist Intelligence Unit[/caption] There are also expectations that inflation will greatly impact low-income non-oil exporting countries within the MENA region such as North African countries. The effects of higher inflation will be less impactful in wealthier GCC and Asia-Pacific Economies. Regarding food, shortages might arise in low-income non-oil exporting countries due to dry spells and lower crop yields. Sharply depreciating currencies in countries such as Lebanon will further aggravate inflation in 2021/22, driving up the cost of imported goods. In a more distant future, inflation is expected to slow down toward the end of 2022 and the beginning of 2023, as Supply chain disruptions start to dissipate and the labor markets around the world are back to their healthy state. Conclusion Inflation seems to be quite a persistent rather than a transitory threat. The escalation of the conflict between Russia and Ukraine will most definitely not help ease inflation but rather further aggravate the matter since Russia is one of the biggest producers of raw materials such as oil, wheat, and a variety of different metals. Gasoline prices will further increase with the cost for food and goods such as smartphones most likely to follow suit. However, with supply chains recovering to their original efficiency, inflation will eventually slow down to settle at a fair rate. Author: Othmane Zidane Sources https://www.project-syndicate.org/commentary/return-of-global-inflation-by-carmen-reinhart-and-clemens-graf-von-luckner-2022-02?a_la=english&a_d=62067728a72fe630c0cb5cc7&a_m=&a_a=click&a_s=&a_p=homepage&a_li=return-of-global-inflation-by-carmen-reinhart-and-clemens-graf-von-luckner-2022-02&a_pa=curated&a_ps=&a_ms=&a_r= https://data.oecd.org/price/inflation-cpi.htm https://www.weforum.org/agenda/2021/12/rising-prices-inflation-ipsos-survey/ https://www.eiu.com/n/threat-from-inflation-in-the-mena/ https://www.theguardian.com/business/2022/jan/23/fears-grow-that-us-action-on-inflation-will-trigger-debt-crisis https://globalnews.ca/news/8523037/inflation-canada-jan-2022-record/ https://www.naturalgasintel.com/oil-natural-gas-prices-drive-sustained-surge-in-inflation/ https://research.stlouisfed.org/publications/economic-synopses/2021/12/16/supply-chain-bottlenecks-and-inflation-the-role-of-semiconductors#:~:text=Along%20with%20unprecedented%20labor%20market,to%20shortages%20of%20key%20inputs. https://www.ecb.europa.eu/ecb/educational/explainers/tell-me-more/html/high_inflation.en.html https://www.imf.org/external/pubs/ft/fandd/basics/30-inflation.htm https://www.fao.org/worldfoodsituation/foodpricesindex/en/ https://blogs.worldbank.org/voices/global-economic-outlook-five-charts-1 https://www.morganstanley.com/ideas/global-macro-economy-outlook-2022#:~:text=The%20surge%20in%20global%20inflation,global%20GDP%20growth%20in%202022.

While virtual worlds have been around for quite a few years, it is only recently, following Facebook’s rebranding as Meta, that significant attention has been brought upon what have come to be called metaverses. Believed to be the next phase of the internet and possibly even a future complementary reality to our physical world, metaverse worlds are gaining momentum. With this rise in popularity, much attention has been focused on a particular aspect of these virtual worlds: real estate and virtual land ownership. Metaverse Property as Land Parcels Metaverses are virtual worlds or spaces, where users can socialize and interact through avatars, with features that often gamify social interactions while simulating real-world environments. Some metaverses also allow for VR integration, providing a more immersive experience for their users. A distinctive feature of Metaverse ecosystems is their use of well-elaborated economies, backed by their own crypto-based currencies. This allows their users to purchase in-world items and assets that hold real monetary value. Chief among these assets is virtual real estate, represented by parcels of land parcels that constitute the respective metaverses, and can be freely traded among its users. These land parcels are NFT-based assets and are traded on decentralized platforms, such as Opensea or Nonfungible.com, that allow property exchange across metaverse worlds. A select number of metaverses have been frontrunners in this space, providing their users with the ability to buy virtual lands and construct houses or buildings on their proprietary parcels, with only their imagination as the limit. These parcels of land hold value, and are increasingly seen as investments, for two main reasons: First, despite being in virtual worlds, land parcels are limited in supply (the exact number and size of parcels vary widely by platform). Second, users can monetize their parcels, which allows them to generate revenue from their virtual land assets. The Frontrunners Currently, the most prominent decentralized metaverses are Decentraland, Somnium Space, Sandbox, and CryptoVoxels. Decentraland Decentraland is a completely decentralized virtual world, built on the Ethereum blockchain, wherein users can socialize, play, or exchange virtual goods, using its cryptocurrency MANA. Users can even vote for changes they would like to see in the metaverse, through an open organization, the "Decentralized Autonomous Organization". Decentraland is currently divided into 90,601 land parcels, each of which measures 16x16 meters. Somnium Space Somnium Space is a more immersive metaverse, offering its users the opportunity to explore the world with their VR headsets, in the metaverse’s built-in VR mode. Its decentralized currency, CUBE, allows users to purchase one of the 5,026 purchasable land parcels available in the metaverse. These parcels come in sizes ranging from small, to extra-large, measuring 200sqm and 10 meters in build height at one extreme, and 1,500 sqm and 50 meters in build height, at the other. The Sandbox The Sandbox is another metaverse where players can own, build, and monetize their virtual assets. Users can shop for parcels of land using its currency SAND, and as of December 15, 2021, could choose from among the 74% of parcels still available for trade. CryptoVoxel This virtual world is distinguished by its pixelated Minecraft-like aesthetic, and as of November 4, 2021, its users could buy choose among a maximum supply of 5,919 parcels. This metaverse platform has so far carved out a unique space for itself by hosting several well-received art exhibitions and galleries. So far, these Metaverses have been the main playing field for large businesses as well as individual users. PwC recently acquired parcels in The Sandbox, while retailer Adidas now owns 144 parcels on the same platform. Governments are getting in on the act as well, with Barbados recently becoming the first to establish a virtual embassy, following its move into Decentraland. A Booming Virtual Market In the past few years, virtual worlds have seen a surge in land prices, with some registering millions of dollars in record spending. In June 2021 Reuters reported that a patch of virtual lands in Decentraland was sold for more than $900,000 to the virtual real estate fund Republic Realm. More recently, in November 2021, Tokens.com set a record by buying 116 parcels in Decentraland valued at 618,000 MANA, equivalent to $2,400,000 at the time of acquisition. Tokens.com completed the acquisition through its subsidiary Metaverse Group, which bought the land parcels in the Fashion District of Decentraland, as a strategic acquisition aimed at hosting fashion projects and events, in partnership with players in the Fashion industry. Digital real estate trading is also extending into the realm of video games. The blockchain-based game Axie Infinity, for instance, recently sold an in-game land plot for 550 ETH, valued at $2.5 million at the time of acquisition. The rush of investors towards virtual land has seen the price of virtual parcels skyrocket. Based on exchange data from the platform ‘Nonfungible’, the average price of asset transactions across the major metaverses has seen a considerable increase over the past two years (Figure 1). [caption id="attachment_7987" align="aligncenter" width="634"] Figure 1 - Average asset transaction values based on Nonfungible.com, data spanning from 2020/01/01 to 2021/12/31. Quarterly data based on monthly assets trade value across the main metaverses (The Sandbox, Decentraland, Somnium Space and Cryptovoxels) in USD.[/caption] Although land parcels constitute the main items traded in Metaverses, virtual token transactions are becoming more diversified, and now encompass avatars, estates (sets of multiple land parcels), and all types of virtual equivalents to everyday items. As data from ‘Nonfungible’ shows, the average value of exchanged virtual assets had jumped to thousands of dollars in each of the main metaverses, by the end of 2021, compared to just a few hundred dollars in early 2020. Facebook’s recent announcement of its rebranding to Meta has given more visibility to existing Metaverses, further boosting both their asset prices and currencies. Decentraland has seen its average asset transaction price jump from as low as $200 in the first quarter of 2020 to more than $12,000 during the last quarter of 2021. Not only has the value of its land parcels risen exponentially, but so too has its cryptocurrency, surging 164% after Facebook’s announcement. Although the current crypto crash has devalued several metaverse currencies, the parcels market, and virtual tokens more generally have shown no signs of a slowdown in recent months. Looking Forward Metaverse worlds and their applications are still in the early phases of their development, but the underlying virtual real estate market has, nevertheless, seen real development in recent years, experiencing a sustained boom in parcel prices. Whether investors are eagerly rushing in because they believe in the future value of these virtual assets, or out of simple fear of missing out, is a matter of ongoing debate. What is undeniable, however, is that a very real, albeit virtual real estate market, has rapidly matured over the past two years. Aside from parcel trading, companies like Metaverse properties or Republic Realm are now providing virtual real estate development to their clients along with virtual property management solutions. More broadly, the idea that the Metaverse is shaping up to be the internet’s next great frontier, is rapidly gaining traction, with several tech companies and governments taking concrete steps to develop Metaverse-related applications. In addition to Facebook’s rebranding, Microsoft recently announced plans to integrate a metaverse mode, ‘Mesh’, into its ‘Microsoft Teams’ productivity tool. Nike sent a clear statement on the company’s willingness to enter the virtual universe with its acquisition of virtual clothing brand RTFKT, in December of last year. The Korean government has gone a step further by announcing a digital metaverse vision 2026, aimed at making South Korea the 5th largest Metaverse market by 2026. The shift towards the Metaverse is still in its early stages. The technology and ecosystem will likely see further integration with software and hardware still in development – such as rapidly developing VR and AR technologies – and this, in turn, will likely trigger the integration of further verticals in the foreseeable future. What verticals these might be, however, and how they will compare with virtual real estate, remains to be seen. Khawla Jaidi Sources https://www.businesstimes.com.sg/real-estate/investors-snap-up-metaverse-real-estate-in-virtual-land-boom https://www.bloomberg.com/news/articles/2021-03-19/virtual-land-prices-are-booming-and-now-there-s-a-fund-for-that Metaverse properties Decentraland Metaverse properties Somnium space Metaverse properties the Sandbox Metaverse properties Cryptovoxels Somnium Space Economy paper https://nftplazas.com/somnium-space/somnium-space-map/ https://nftplazas.com/decentraland/decentraland-land/ https://stealthoptional.com/metaverse/the-sandbox-land-how-much-land-is-left/ https://www.cryptovoxels.com/about https://nftplazas.com/cryptovoxels/cryptovoxels-land/ https://www.bloomberg.com/news/articles/2021-12-14/barbados-tries-digital-diplomacy-with-planned-metaverse-embassy https://www.lifestyleasia.com/bk/gear/tech/what-is-decentraland-digital-real-estate/ https://futurism.com/virtual-real-estate https://www.nytimes.com/2021/11/30/business/metaverse-real-estate.html https://finance.yahoo.com/news/most-expensive-virtual-plot-land-185000712.html?guccounter=1&guce_referrer=aHR0cHM6Ly93d3cuZ29vZ2xlLmNvbS8&guce_referrer_sig=AQAAAKkSEoD2k62cSGIO_hYTdqF1-ArB7dGx5z1qsTRr4Z1GMSplzpTHZjSo98q8kUTnLaycu5MleC9XUFDFU2BStONpwajzJywNX3f1Rrnh5wzWirckl7Q-7B05LAPBidn7fMsXjz4FP91Vzrz02eE0N4jOLpHGCD3doa1qcNI7KnUm https://blog.bitnovo.com/en/what-is-cryptovoxels-the-minecraft-of-nft/ https://www.vox.com/recode/2021/12/2/22812608/metaverse-real-estate-meta https://www.consultancy.uk/news/30011/pwc-buys-virtual-land-nft-in-the-sandboxs-metaverse https://www.republicrealm.com/digital-real-estate https://www.theblockcrypto.com/linked/125497/axie-infinity-plot-of-virtual-land-sells-for-record-2-4-million https://currency.com/adidas-dives-in-the-metaverse-buying-lands-on-the-sandbox https://nypost.com/2021/10/31/decentralands-mana-virtual-reality-cryptocurrency-soars-following-facebooks-rebrand/ https://markets.businessinsider.com/news/currencies/metaverse-1-trillion-opportunity-grayscale-virual-land-sales-decentraland-2021-11 https://www.korea.kr/news/policyNewsView.do?newsId=148898285 https://www.forbes.com/sites/jackkelly/2022/01/23/the-metaverse-is-the-web3-wave-that-democratizes-buying-and-building-real-estate-hosting-fashion-shows-and-monetizing-video-gaming/?sh=2a11a176751f https://techxplore.com/news/2021-10-facebook-hire-eu-metaverse.html

With the world becoming increasingly virtual by the day and almost 84% of the world’s population using a smartphone, it has become increasingly difficult to ignore the facts and figures regarding the detrimental effects of smartphones on nature and the environment. Smartphones are making a substantial contribution to the problem of climate change with significant figures being highlighted in various studies and research. Extensive research has been conducted in recent years to identify and draw attention to the negative impact of smartphones on the environment, but the topic is still insufficiently appreciated and addressed, by users and manufacturers, respectively. While advocating for the environment and promoting recycling and sustainability on social media via our smartphones, we often neglect the impact on the environment imposed by the smartphone itself. From the extraction of raw materials to assembly, distribution, transport, use, and end-of-life treatment, smartphones contributed to the creation of a staggering 580 million tons of CO2 emissions in 2020. The ICT sector — including personal computers, laptops, smartphones, tablets — as well as its digital infrastructures such as data centers and communication networks, is expected to contribute to the global carbon footprint by 14% in 2040, representing more than half of the contribution made by the transportation sector worldwide. While the role of technology in promoting environmental awareness and fighting climate change is indeed significant, the business of smartphones is one that is very much focused on profit, with minimal attention paid to the environmental impact of their production and disposal. Device Statistics In the past five years, global smartphone usage has almost doubled. In 2016, the number of smartphone users amounted to just over 3.6 billion users, while by 2021 that figure had reached an estimated 6.3 billion users worldwide, with the number expected to reach over 7.5 billion by 2026. While this demonstrates an expected increase at a decreasing rate compared to the past 5 years, that figure would constitute almost 90% of the world’s population, according to world population projections. [caption id="attachment_7964" align="aligncenter" width="600"] Note(s): Worldwide, Africa, North America, Europe, China, Central and South America, MENA; 2018 to 2021 Further information regarding this statistic can be found on page 8. Source(s): Gartner; ID 755388 [/caption] Impact Breakdown A smartphone contributes to global warming and climate change throughout the entirety of its life cycle, from production to disposal. The raw materials needed to produce a smartphone, including gold, cobalt, lithium, and other heavy metals, require energy-intensive mining, and their extraction often causes significant environmental pollution. [caption id="attachment_7949" align="aligncenter" width="615"] Bruno Martin, OpenMind BVA[/caption] The mass production of smartphones in mega factories, of course, also greatly contributes to climate change with 85%-95% of a smartphone’s overall carbon footprint produced during the production process. The batteries, integrated circuits, speakers, and screens used to manufacture smartphones — along with every other single component that goes into their manufacture — are themselves mass-produced, creating carbon footprints, heat emissions, and environmental pollution of their own. The environmental impact associated with smartphones, however, does not end with their hardware production and the smartphone’s physical components. The networking and data centers needed for the software development of the operating systems used in smartphones, such as IOS and Android among others, can also be energy-intensive, with significant carbon and heat emissions. According to the International Energy Agency, for instance, data centers consume approximately 200 terawatt-hours (TWh) of electricity, or nearly 1% of global electricity demand, contributing to 0.3% of all global CO2 emissions The actual usage of smartphones also produces an environmental impact. Research on the annual carbon emissions from smartphone usage provides an estimate of an average of 63 kilograms of CO2 emissions produced, from only one hour of smartphone usage per day, for a year, and up to 90 kilograms of CO2 emissions produced for 10 hours of usage per day, for a year. Although this demonstrates that the impact of the production process is much higher than that of the smartphone’s use, CO2 emissions from usage continue to increase as more people are becoming smartphone-dependent. The practice of frequently upgrading our smartphones when new versions are released creates an enormous amount of physical e-waste. In 2019 that figure was estimated to weigh more than 50 million tonnes, constituting approximately 10% of global e-waste. Finally, the telecom sector on which our phones rely produces its own carbon footprint, heat emissions, and e-waste. [caption id="attachment_7950" align="aligncenter" width="701"] Ericsson Mobility Report 2021[/caption] Smartphone Manufacturers Launching new smartphone models every 2-3 years is a profit mechanism used by market players who rely on brand loyal customers with a hunger for new features, better quality, and brand image. This strategy encourages the discarding of smartphones more quickly, a situation made worse by the lack of transparency on the part of most market players regarding the recyclability of disposed smartphones. Another strategy used to elicit more profit is the creation of components that are difficult or costly to replace, such as batteries or screens, essentially incentivizing consumers who suffer broken phones to simply replace the phone entirely. Some efforts, however, have been made by various manufacturers to operate more efficiently. A case in point is that of Apple, who announced in 2018, that its global facilities - including retail stores, data centers, and other facilities in 43 countries - had completed a transition to 100% clean energy. Not all market players have made similar commitments to transition to renewable energy for their operations and manufacturing, and the majority continue to lack transparency as to the sustainability of their production processes and the recyclability of their products. Indeed, the same players have made sustainability-minded investments in other areas, while refraining from doing the same with their smartphone production process. [caption id="attachment_7951" align="aligncenter" width="618"] Apple Datacenters in Denmark, PV Magazine, https://www.pv-magazine.com/2020/09/04/apple-data-center-in-denmark-powered-by-50-mw-of-solar/[/caption] Does the problem end with smartphones? The path of digital transformation of communications, manufacturing, and banking, among others, of which we believe ourselves to be in dire need, does not come at no cost to the environment, labor market, and societal well-being Many of the other technologies that are currently trending have been found to have a significant impact on the environment. Digital currencies are one such example, with Bitcoin and Ethereum, in particular, being so damaging to the environment that they threaten to reverse any gains achieved through the transition to electric vehicles and the reduction in fossil fuels use. Much of this impact resides in the energy and processing intensive mining of these digital currencies, and the proofs of work that underpin their production. According to the Cambridge Bitcoin Electricity Consumption Index, for instance, Bitcoin already consumes more energy than the whole of Argentina, and the total carbon footprint left by Bitcoin currently exceeds the total reduction in emissions made by electric vehicles. Training models and deep machine learning for Artificial Intelligence systems are also energy and data processing intensive, with their own significant power consumption levels and, accordingly, their own emissions. As we continue to transition to a more digitalized world, careful consideration will be needed to determine what trade-offs we will find acceptable, and exactly how we can collectively manage the costs and benefits of such a transition. Mariam AbdEl-Aziz References: https://www.ericsson.com/4ad7e9/assets/local/reports-papers/mobility-report/documents/2021/ericsson-mobility-report-november-2021.pdf https://www.dw.com/en/fairphone-shiftphone-cell-phone-smartphone-environment-climate-co2/a-59356342 https://www.ericsson.com/en/reports-and-papers/research-papers/life-cycle-assessment-of-a-smartphone https://www.anthropocenemagazine.org/2018/04/the-energy-hogging-dark-side-of-smartphones/ https://reboxed.co/blogs/outsidethebox/the-carbon-footprint-of-your-phone-and-how-you-can-reduce-it https://www.un.org/en/global-issues/population https://inform.tmforum.org/insights/2021/08/can-the-telecoms-industry-power-down-its-impact-on-the-environment/ https://www.earth.com/news/smartphone-harmful-environment/ https://www.compareandrecycle.co.uk/blog/this-is-why-mobile-phone-recycling-matters James Mckinven, https://unsplash.com/photos/Ohu89iIorIc

The world is currently shifting its energy system away from hydrocarbons and towards low-carbon energy sources, with a view to eventually transitioning to a net-zero energy system. As a result, governments and energy companies alike are placing large wagers on hydrogen, in an effort to lower emissions. The GCC countries have long been concerned about the sustainability of their hydrocarbon revenues and have taken early steps to develop national hydrogen strategies. Saudi Arabia and the United Arab Emirates lead the way in this regard and have positioned themselves to become major hydrogen exporters. Japan, China, and South Korea, on the other hand, currently some of the top destinations for Saudi and Emirati crude oil, are set to emerge as major importers of hydrogen. The recent export by the Emirates’ state-owned oil company ADNOC, of its first blue hydrogen cargo to Japan, marks the first step toward solidifying this emerging relationship. Hydrogen Steadily Gaining Ground in the GCC The UAE joined the Global Hydrogen Council in July 2021, and developed its National Clean Energy Strategy 2050, under which ADNOC will produce 300,000 metric tonnes of hydrogen annually. In Saudi Arabia, a green hydrogen project is scheduled for completion by 2025, with a capacity of 650 metric tonnes of hydrogen, and 1.2 million tonnes of green ammonia, making it one of the largest such projects in the world. In Kuwait, meanwhile, the National Petroleum Company (KNPC) has completed work on a hydrocracker unit at a cost of $16 billion, that can produce 454,000 tonnes of clean fuel. Oman Oil Company, for its part, is implementing a project to produce 1.8 million tonnes of green hydrogen at a cost of $30 billion, using solar and wind energy. Factors favoring the production of Blue Hydrogen* in the GCC (*Hydrogen produced using carbon capture and storage technology to store the CO2 created as a byproduct of the process) The GCC is one of the largest and lowest-cost producers of natural gas globally, accounting for 20% of the world’s gas reserves. Qatar is the third-largest worldwide, with 24.7 trillion cubic meters (TCM) of proven natural gas reserves, while Saudi Arabia (6 TCM) and the UAE (5.9 TCM) hold the ninth and tenth spots, respectively. The availability of existing facilities in the GCC involved in the production of ammonia, fertilizers, methanol, steel, and hydrogen. These facilities are often already concentrated in clusters along with power and desalination plants, making ideal centers to expand the use of the carbon capture, use, and storage (CCUS) needed to create blue hydrogen. Examples include the facilities of SABIC in Saudi Arabia, FERTIL in the UAE, QAFCO in Qatar, PIC16 in Kuwait, OMIFCO in Oman, and Bahrain’s SULB. GCC hydrocarbon producers have significant CO2 storage capacity. Carbon capture, utilization, and storage (CCUS) enable the production of low-carbon hydrogen, and the voided spaces in oil and gas fields alone, within the GCC, accounting for a storage capacity of 33.4 GtCO2e, allowing for ample reservoirs for hydrogen producers. GCC producers have well-developed existing infrastructure, such as their natural gas grids, which could be modified for transporting hydrogen inland for domestic purposes. Factors favoring the production of Green Hydrogen* in the GCC: (*Hydrogen produced using electricity generated from renewables, such as wind or solar) The GCC is a high-potential region for renewables benefitting from some of the highest solar radiation levels in the world, as well as strong and regular winds in some areas. This makes the GCC region potentially one of the most cost-competitive for hydrogen production, with long-term costs potentially reaching USD 1.5 - 2 per kg, compared to USD 3.0 - 4+ per kg in Europe and parts of Asia. GCC countries enjoy sufficient funding availability for investment in hydrogen, having created significant financial reserves from their oil & gas economies. These reserves allow them to cover the cost of producing green hydrogen, which is high compared to that of producing blue hydrogen. The GCC already has a highly qualified workforce in the oil & gas sector. This represents a major opportunity for the development of the hydrogen economy in the region, due to the high transferability of their skills. GCC countries have advanced export infrastructure. The UAE’s Jebel Ali and Saudi Arabia's Jeddah ports, for instance, were among the top 40 ports in the world in 2019, according to the World Shipping Council. GCC countries are centrally located relative to energy demand markets, situated as they are between the potentially large European and East Asian markets. Potential Hydrogen Imports from High Demand Regions EU hydrogen imports from the GCC could reach 100 mMT by 2050, according to a recent report published by Dii & Roland Berger. In East Asia, meanwhile, imports from the GCC could reach approximately 85 mMT of ammonia by the same year, leaving GCC countries in a prime position to become major players in the hydrogen industry. Source: Vision Port of Rotterdam, Germany's National Hydrogen Strategy, EU Hydrogen Strategy, METI, Hydrogen Korea Team, Roland Berger, Dii Desert Energy. Potential Revenues from Hydrogen Exports Global hydrogen demand is expected to reach approximately 580 mMT by 2050. All indicators point to the potential for the GCC to replace its position as a global oil giant, with that of a global hydrogen hub, with potential green hydrogen revenues alone expected to reach USD 70-200 billion by 2050. Looking Forward The GCC is in an excellent position to become a leading green and blue hydrogen producer, which would allow the region to occupy an important place in the nascent hydrogen industry. By seizing this opportunity, GCC countries can ensure their continued prominence in the global energy market, all the while moving towards a decarbonized world. Author: Dina Amer References: MEI@75, Warming to a Multi-Colored Hydrogen Future? The GCC and Asia Pacific, 2021 https://www.mei.edu/publications/warming-multi-colored-hydrogen-future-gcc-and-asia-pacific Gulf News, Gulf economies are ready to take on clean energy and hydrogen projects, 2021 https://gulfnews.com/business/analysis/gulf-economies-are-ready-to-take-on-clean-energy-and-hydrogen-projects-1.1628060444446 Qamar Energy, Hydrogen in the GCC, a report for the regional business development team Gulf Region, 2020 https://www.rvo.nl/sites/default/files/2020/12/Hydrogen%20in%20the%20GCC.pdf Dii Desert Energy & Roland Berger, The Potential for Green Hydrogen in the GCC region, 2021 https://www.menaenergymeet.com/wp-content/uploads/the-potential-for-green-hydrogen-in-the-gcc-region.pdf Brookings, Economic diversification in the Gulf: Time to redouble efforts, 2021 https://www.brookings.edu/research/economic-diversification-in-the-gulf-time-to-redouble-efforts/ The IEA, The Future of Hydrogen; Seizing today’s opportunities, 2019 https://www.iea.org/reports/the-future-of-hydrogen The IEA, The Role of CO2 Storage, 2019 https://www.iea.org/reports/the-role-of-co2-storage KAPSARC, Opportunities for Natural Gas Trade and Infrastructure in the GCC, 2020 https://www.kapsarc.org/research/publications/opportunities-for-natural-gas-trade-and-infrastructure-in-the-gcc/

Over the past two years, just about anything that could go wrong with global supply chains has done just that. The COVID-19 pandemic has led to volatile swings in demand, widespread factory shutdowns, and every type of supply chain disruption in between. But which industries were most affected by these stresses to their supply chains? How were companies able to adapt their supply chain management? And what are countries doing to make sure that future shutdowns don't affect their supply chains so drastically? [caption id="attachment_7875" align="aligncenter" width="621"] Click the image to access the report![/caption] Which industries experienced significant stress on their supply chains? The COVID-19 pandemic brought to light long-standing vulnerabilities in global supply chains. Lockdowns slowed or stopped the flow of raw materials and disrupted manufacturing in several industries, putting supply chains under significant stress. Factory shutdowns caused a shortage of semiconductors, already in short supply amid sustained demand from a growing EV market, and the increased demand for electronic goods from consumers confined to homes by lockdowns. Major automakers bore the brunt of this shortage, made worse by the concentration of the world’s semiconductors manufacturing among just a handful of producers—Taiwan’s Semiconductor Manufacturing Co.(TSMC), for instance, along with South Korea’s Samsung, manufacture a combined 70% of the world’s semiconductor supply. The automotive industry was also hit hard by the supply chain issues affecting both battery manufacturers, and the mining industry that extracts the rare-earth elements needed for those batteries. Automakers’ over-reliance on the Asia-Pacific region for these critical components was made clear when major battery manufacturers such as BYD and CATL announced extended production delays, forcing automakers to slash production. The textile and fashion industries are two more to have been extremely hard hit by the global supply chain crisis. With China being a critical global supplier of textile inputs, pandemic-related production disruptions there reverberated throughout the rest of the textile and fashion industries. These industries were further affected when the global transportation system came to a halt, preventing or delaying the transport of components to manufacturers, and finished products to consumers. How were companies able to adapt their supply chain management? With COVID-19 related shortages exposing vulnerabilities in the global supply chain, companies across different industries have taken action to determine how best to deal with the disruption and mitigate the effects of future supply chain shocks. China plus one strategy One way to address the risks associated with over-reliance on a single supply source, is to use sources in locations not vulnerable to the same risks. This is the core idea behind the ‘China plus one’ strategy currently in use by several major companies. It emphasizes diversification by establishing a factory in one other developing Southeast Asian country – such as Thailand or Vietnam – in addition to existing facilities in China, to minimize the risks of geographic concentration. Strengthening local supply networks Some companies are strengthening their supply networks by investing in local suppliers. Samsung, for instance, has invested a combined $238 million in nine midsize companies since the summer of 2020, to develop a network of chip equipment and materials suppliers inside South Korea and reduce its reliance on overseas suppliers. Similarly, Tesla is creating a domestic US lithium supply chain by sourcing the lithium ore necessary for lithium-battery fabrication within the US, thereby reducing its reliance on traditional lithium-producing countries. Innovative workarounds Major companies have been forced to find innovative solutions to their supply chain problems. Tesla, for instance, has dealt with the chip shortage by rewriting vehicles’ software to support alternative chips. Cardinal Health, a leading US healthcare services company, has turned to the use of tracking software to track shipments of their products between manufacturing plants and Cardinal's distribution centers. This allows for the making of predictive decisions to adjust supply plans and production schedules. How are countries making sure that future shutdowns don't affect their supply chain? Global supply chain problems have made clear to governments the need to take action to strengthen and support their domestic supply chains, and many have taken important first steps towards doing just that, in preparation for future crises. USA President Biden signed an executive order in February 2021, for a comprehensive review of critical US supply chains, with the associated White House report being released in June. Among other recommendations, the review determined that a solid supply chain must include a small and medium-sized business manufacturing base and highlighted the US’s need to diversify its international suppliers to reduce the risks associated with geographic concentration. Japan The Japanese government has focused its efforts on subsidizing local businesses to strengthen domestic supply chains. It has distributed 146 subsidies totaling 247.8 billion yen ($2.4 billion) with the goal of encouraging an increase in domestic manufacturing, to reduce the country’s dependence on Chinese supply. Japan is also investing in overseas rare earth minerals projects, particularly in Australia and India to reduce its reliance on China’s supply from 58% registered in 2019, down to 50% by 2025. Outlook: The Global Supply Chain Looking Forward As lockdowns have lifted and a global economic recovery has gathered pace, consumer demand has increased sharply. Supply chains that were disrupted during the crisis continue to face significant challenges and are struggling to bounce back, much less meet increased demand. While companies and governments alike have taken substantial action in response to the supply chain crises, these will not be sufficient to solve supply chain woes in the near term. Months of shipping backlogs and continuing labor shortages have caused bottlenecks that are proving difficult to resolve, and most analysts agree that supply chain problems will only get worse before they get better, with some estimates warning that the crisis could last another two years. Author: Mohamed SAIDI Sources https://www.ey.com/en_gl/supply-chain/how-covid-19-impacted-supply-chains-and-what-comes-next https://www.pwc.com/ng/en/assets/pdf/impact-of-covid19-the-supply-chain-industry.pdf https://hbr.org/2020/09/global-supply-chains-in-a-post-pandemic-world https://www.nytimes.com/2021/10/02/business/tesla-electric-q3-sales.html https://www.cambridge.org/core/journals/mrs-bulletin/article/covid19-disrupts-battery-materials-and-manufacture-supply-chains-but-outlook-remains-strong/158FE30E4868EE8D2952216B6CCB8B4F https://asia.nikkei.com/Business/Tech/Semiconductors/US-China-tension-brings-both-a-risk-of-chip-dependency-on-Taiwan https://asia.nikkei.com/Business/Electronics/Samsung-builds-chip-supply-chain-on-home-turf-to-cut-overseas-risk https://www.nsenergybusiness.com/news/piedmont-lithium-agrees-to-supply-spodumene-concentrate-to-tesla/ https://www.theverge.com/2021/7/26/22595060/tesla-chip-shortage-software-rewriting-ev-processor https://www.theguardian.com/environment/2021/apr/17/the-race-for-rare-earth-minerals-can-australia-fuel-the-electric-vehicle-revolution https://asia.nikkei.com/Politics/International-relations/Japan-to-pour-investment-into-non-China-rare-earth-projects https://techwireasia.com/2021/10/heres-what-the-2021-global-semiconductor-shortage-is-all-about/ https://www.semiconductors.org/semiconductors-101/what-is-a-semiconductor/ https://www.metalbulletin.com/Article/4002802/OUTLOOK-Securing-lithium-biggest-challenge-to-battery-supply-chain-in-H2-2021.html https://www.argusmedia.com/en/news/2191594-qa-chip-shortage-shows-need-to-diversify-supply-chain https://www.bloomberg.com/news/articles/2021-07-22/tight-battery-market-is-next-test-for-evs-caught-in-chip-crisis https://www.bloombergquint.com/global-economics/japan-allocates-2-4-billion-for-better-supply-chain-resilience https://www.japantimes.co.jp/news/2020/03/06/business/japan-aims-break-supply-chain-dependence-china/ https://www.eenewsanalog.com/news/reports-tsmc-lost-market-share-2q20 https://www.e3s-conferences.org/articles/e3sconf/pdf/2021/21/e3sconf_aeecs2021_03044.pdf https://www.financialexpress.com/investing-abroad/stockal-specials/semiconductor-industry-key-growth-drivers-and-the-changing-trends-an-overview/2287214/ https://www.ifc.org/wps/wcm/connect/1d32e536-76cc-4023-9430-1333d6b92cc6/210402_FCDO_GlobalPPE_Final+report_v14updated_gja.pdf?MOD=AJPERES&CVID=nyiUnTU https://www.theguardian.com/business/2021/dec/18/global-supply-chain-crisis-could-last-another-two-years-warn-experts

Between October 31 and November 12, more than 130 heads of state along with many more business and industry leaders, gathered in Glasgow for the United Nations Climate Change Conference, or COP26, with the aim of accelerating action towards the goals of the 2015 Paris Agreement and the 1992 UN Framework Convention on Climate Change. Going into the conference, scientists and experts had warned that nations must make an immediate and decisive turn away from fossil fuel energy, with many describing it as the last chance for countries to reach consensus on two goals: reaching net zero emissions by 2050 and limiting global warming to 1.5C above preindustrial levels. The commitment to aim for 1.5C is important because every fraction of a degree above that figure is expected to result in the loss of many more lives and livelihoods, due to the resultant climate-related consequences. The talks ultimately led to various important and significant pledges from nations and companies to commit to new targets for cutting emissions, and otherwise act to avert severe climate change. In this article, we examine some of the more significant such agreements reached at the conference, as well as the implications they are likely to hold for businesses. Agreements Reached at COP26 The agreements reached at the conference can be divided into five broad categories of change: Phasing out Coal More than 40 countries agreed to phase out their use of coal-generated power while 23 countries signed the Coal to Clean Power Transition Agreement, committing themselves for the first time to halt the issuance of new permits for unabated coal-fired power generation projects. Notable hold-outs to the agreement include Australia, India, Russia, and the US. China, which was responsible for 54% of global coal consumption last year, was also absent from the agreement Major international banks and lenders like HSBC, Fidelity International and Ethos, also made landmark coal-related commitments at COP26. HSBC, for instance, has pledged to phase out financing of coal-fired power and thermal coal mining by 2030 in the EU & OECD, and worldwide by 2040. Cutting Methane The Global Methane Pledge was signed by more than 100 countries, representing 70% of the global economy and nearly half of its methane emissions. These signatories committed to a collective goal of reducing global methane emissions by at least 30% from 2020 levels, by 2030. The top three emitters of methane globally – China, Russia, and India – did not sign up to this pledge. Ending Deforestation The Glasgow Leaders’ Declaration on Forests and Land Use was signed by more than 140 leaders, representing over 90% of the world’s forests. Signatories committed to halting and reversing deforestation and land degradation by 2030, with $19.2bn already committed to the facilitation of these goals. New Net-Zero Pledges One of the main objectives of COP26 was to secure governmental and company commitments to reach net-zero emissions by 2050. Countries answered the call in Glasgow, with 29 making such commitments at the conference, bringing the total count to 74. India’s Prime Minister Narendra Modi added his country to the list, to the surprise of many, albeit with a deadline of 2070. His pledge included a promise to secure 50% of India’s energy from renewable resources by 2030. More than 450 banks, insurers, and other firms with more than 130$ trillion under collective management acted similarly, committing to the use of their funds to reach net-zero emissions by 2050. China-US Climate Cooperation The US and China – the two largest emitters of CO2 – signed an unexpected joint declaration promising to boost climate cooperation over the next decade, with the specific aims of reducing methane emissions, tackling deforestation, and regulating decarbonization. As outlined in the text of the declaration, the two powers are slated to share policy and technology development, announce new national targets for 2035 by the year 2025 and revive a working group to ‘meet regularly to address the climate crisis and advance the multilateral process’. Although the commitment has been welcomed by many, it lacks concrete steps to meet the 1.5C Paris Agreement goal. U.S. special climate envoy John Kerry has acknowledged as much but nevertheless defended the agreement, pointing to its expected contribution to enabling mutual accountability and action. How will COP26 Impact Companies and businesses? Implications for companies and businesses can be divided into 4 main categories: Carbon Offset Market The Paris Agreement laid down a framework for a carbon offset market, wherein states and private entities could generate and trade carbon offset credits. After five years of unsuccessful deliberations, negotiations at COP26 reached a breakthrough on the rulebook for this market. For businesses, this agreement provides an opportunity to strengthen their green credentials, ensures offsets, and gives them the opportunity to reduce the cost of reaching their emissions targets. Heightened ESG Standards and Expectations The set of deals made and agreements reached, at COP26, mean that businesses will have to reconsider their carbon footprints and business strategies if they hope to continue generating profits. This is due mainly to the imperative of these agreements on investors and industry leaders to bring in check the emissions associated with their businesses. Of the many deals announced, one includes plans to establish a standards organization that will inspect corporate climate disclosures and challenge boardrooms on the basis of its findings. Companies that do not align their strategies with COP26’s carbon level targets’ regulations are likely to suffer in terms of ESG-based credit ratings, attracting investment, and their ability to attract and retain talent. A Turning Point for Companies’ Sustainable Business Practices According to a March 2021 global survey conducted by IBM on the topic of sustainability, 73% of respondents said that addressing climate change was very or extremely important to them. In the wake of COP26, this consumer pressure will only continue to mount. Sustainability will also be increasingly important from an investment perspective, owing to the agreements reached and the resultant pressure on investors. According to a study at the Chicago Booth University, causal evidence suggests that investors, market-wide, already strongly value sustainability, to the extent that sustainability is viewed as positively predicting future performance. With the ratcheting up of pressure brought on by COP26 agreements, companies can expect investors to be even more reluctant to invest in companies that don’t make net zero an organizing principle of their business. Finally, by focusing on reducing their carbon footprint, businesses may be able to take advantage of opportunities arising from the regulatory changes governments are expected to make in accordance with their new COP26 commitments. There will be Winners and Losers Countries’ climate goals and their road maps for achieving those goals will pave the way for public spending plans that will boost green stocks. Given the domestic nature of these goals, many of the changes felt by companies will vary on a country-by-country basis. Companies’ fortunes will also vary by sector, as a result of agreements reached at COP26. Many stocks are set to benefit from decarbonization trends, including those of sectors such as renewables, hydrogen power, green mobility, and carbon capture, utilization and storage (CCUS). High-carbon sectors, on the other hand, like power generation, steel, cement, mining, airlines and shipping, can expect to face significant challenges. Looking Beyond COP26 The COP26 pledges announced on methane, coal, transport, and deforestation are expected to nudge the world only 9% closer to a pathway that keeps heating to 1.5C, according to Climate Action Tracker, one of the world’s most respected climate analysis coalitions. As such, the achievements of the conference, taken alone, appear to be insufficient with respect to the goal of limiting global warming to the extent needed to avert severe climate consequences. The conference was, nevertheless, an unprecedented step in the fight against global climate change and has ushered in agreements that will have broad-ranging effects, and be widely felt by consumers companies, and governments alike. Companies, in particular, will be forced to make significant changes to the way they do business and would be well advised to keep ESG-related consumer and investor sentiment at the forefront of all strategy considerations. Moreover, they can expect to face serious challenges if they fail to adjust their strategies in accordance with the new reality emerging in the wake of COP26. As the U.N. High-level Climate Action Champion, Nigel Topping, puts it "If you haven't got a net-zero target now, you're looking like you don't care about the next generation, and you're not paying attention to regulations coming down the pipe." Author: Ayoub Rahmouni Sources: Carbon Relief UNFCCC IPCC Independent The Guardian Climate Action Tracker Al Jazeera Statista Energy & Climate Intelligence Unit Bloomberg Reuters SSE Energy Solutions Barron’s UNFCCC NPR Clean Energy Wire Chicago Booth study IBM study Food & Land Use Coalition Gov.UK HSBC World Resource Institute

At a time when some travel industry forecasts had begun to express optimism that the sector could expect a full recovery by the end of the year, or early 2022, the new Omicron variant has dashed all such hopes. Once again, the world finds itself confronted with a new COVID-19 variant that is spreading globally at alarming rates, and countries have been forced into immediate action to limit further spread of the highly contagious variant. As more restrictions are imposed, travel in general, and leisure travel in particular has become extremely challenging. This is especially true for those traveling from countries with skyrocketing infection rates. At Infomineo, we previously published an article and research on how COVID-19 impacted the travel & tourism industry globally, in which we plotted the major effects of the pandemic on several tourism sectors. In this article, we aim to shed light on the travel restrictions being put in place following the emergence of the Omicron variant, by highlighting recent restrictions enacted in selected countries. Detection and Early Development Omicron was first identified in late November by South African scientists, who reported the variant to the World Health Organization (WHO). On 26 November 2021, the agency designated the variant B.1.1.529, or Omicron, a variant of concern, on the advice of its Technical Advisory Group on Virus Evolution. The origins of the new variant remain uncertain, however, with the National Institute for Public Health and the Environment in the Netherlands, reporting that retests of samples taken on Nov. 19 and 23 found that Omicron was already in the Netherlands before South Africa reported it to WHO. In a statement released December 1, Nigeria's national public health institute announced it had detected the country's first omicron case in a sample that was collected in October. As of December 16, Omicron had been detected in 89 countries, with coronavirus cases involving the variant doubling every 1.5 to 3 days, according to the World Health Organization. Impact on Travel & Tourism As a result of the new variant, travel & tourism have been severely disrupted. Just days after Omicron was identified, several countries had already closed their borders to halt the spread of the virus. Many countries first reacted by restricting travel from South Africa. Some governments, including those of the US, and all 27 member states of the European Union, broadened these restrictions to include seven other countries in the region, having deemed them high-risk areas where the Omicron variant is spreading rapidly (Namibia, Zimbabwe, Botswana, Mozambique, Eswatini, Malawi, and Lesotho). Travel restrictions are no longer limited to travelers from southern Africa, however, with many countries around the world putting in place wide-ranging restrictions and regulations to limit the spread of the virus: Sweden has introduced a new testing protocol for all travelers regardless of their vaccination status and country of origin, with the decision coming into effect on December 28. Germany has imposed a mandatory 14-day quarantine on all travelers arriving from the UK, which began on December 20. Israel added the US to its list of "red countries”, on December 20, along with Belgium, Germany, Hungary, Italy, Morocco, Portugal, Switzerland, and Turkey. This designation means that Israeli citizens and permanent residents are banned from traveling to those countries unless they get a special exemption and that all travelers from those countries must quarantine on arrival, regardless of vaccination status. France imposed tighter restrictions for travel between the U.K. and France, requiring "compelling reasons" for such travel — tourism and business do not qualify under the changes. South Korea has restricted flights from eight countries. Thailand Singapore and Japan have closed their borders to most foreign travelers. The countries listed above are only a sample of those that have taken immediate action to halt the spread of the new Omicron variant. As the situation continues to evolve, many more countries are imposing travel restrictions and updating those already in place. While it is unclear exactly how long travelers, or the industry, can expect such restrictions to continue, it seems safe to assume that travel will be greatly affected for some time to come. Author: Mohamed Aref Sources: https://www.who.int/news/item/28-11-2021-update-on-Omicron https://www.cdc.gov/coronavirus/2019-ncov/variants/Omicron-variant.html https://www.advisory.com/daily-briefing/2021/12/03/Omicron-origins https://www.cnbc.com/2021/12/20/Omicron-casts-a-shadow-over-winter-holidays-as-countries-mull-strict-restrictions.html https://edition.cnn.com/travel/article/Omicron-hitting-travel-to-europe/index.html https://edition.cnn.com/2021/11/29/world/covid-Omicron-variant-countries-list-cmd-intl/index.html https://www.dw.com/en/Omicron-which-countries-have-closed-their-borders/a-59979182 https://www.dw.com/en/Omicron-present-in-netherlands-earlier-than-thought-say-health-authorities/a-59977047 https://www.npr.org/2021/12/20/1065865472/Omicron-holiday-travel-gatherings-restrictions-world https://www.forbes.com/sites/roberthart/2021/12/01/omicron-case-in-nigeria-dates-back-to-october-weeks-before-it-was-first-reported-in-south-africa/?sh=1417301f2abc https://www.dw.com/en/eu-states-agree-to-suspend-travel-from-southern-african-nations-over-new-coronavirus-variant/a-59942074 https://www.who.int/docs/default-source/coronaviruse/20211217-global-technical-brief-and-priority-action-on-omicron_latest-2.pdf?sfvrsn=bdd8297c_9&download=true https://abcnews.go.com/International/wireStory/israel-add-us-canada-travel-ban-omicron-variant-81852722 https://www.bbc.com/news/world-europe-59713503 https://www.ft.com/content/2642cd6a-c35d-40e5-8300-77f4423113ba https://www.schengenvisainfo.com/news/sweden-introduces-testing-requirement-for-all-travellers-regardless-of-vaccination-status/

Amidst the growing global coronavirus caseload, and the saturation of healthcare systems across the world, the concept of telemedicine has seen a rapid and pronounced rise to prominence. But just what is telemedicine? The World Health Organization defines it as “The delivery of health care services, where distance is a critical factor, by all healthcare professionals using information and communication technologies for the exchange of valid information for diagnosis, treatment and prevention of disease and injuries […]”. Telemedicine is not a new phenomenon, however, having registered one of its first applications in the early 20th century when electrocardiograms were transmitted at a distance using the telephone line. The technology would go on to find one of its most famous applications in the 1960s, when it was used by NASA to monitor astronauts’ biometric data away from Earth, with the aim of providing remote support in the event of a medical emergency. Telemedicine and the COVID-19 Pandemic With the advancement of ICT, and its ever-increasing penetration rates, telemedicine has seen its possible applications multiply over the last few decades. Before the outbreak of the COVID-19 pandemic, however, there was very limited investment in telemedicine and remote patient monitoring solutions by most countries. Instead, there were only experimental projects that met with limited physician adoption. In Italy, for instance, 2019 research by the Polytechnic University of Milan’s Digital Innovation in Health Observatory showed that only 5% of specialist doctors and 3% of family doctors used these solutions, although more than half were interested in doing so (osservatori.net). In response to the pandemic, governments and healthcare providers were forced to resort to telemedicine in an effort to counteract the shortage of available hospital rooms, beds, and medical staff. Private practices were forced to act similarly as they sought to avoid in-person visits where possible, in a bid to limit further spread of the virus. Telemedicine saw a further surge in adoption as countries pushed their healthcare systems to fill the technology gaps impeding its wider adoption. Looking again at Italy as an example, new data published by the Observatory clearly shows the extent to which the pandemic has brought telemedicine into the spotlight. Three out of four specialist physicians reported believing that telemedicine was critical during the peak of the crisis, with 36% reporting that they were convinced of its benefits and intended to use it in the future. On average, according to general practitioners (GPs), 30% of chronic patient visits and 29% of visits by non-chronic patients could be carried out using digital tools, while for specialist providers these proportions dropped to 24% and 18% respectively. According to McKinsey, by April 2020, overall telehealth utilization at the global level for office visits and outpatient care was 78 times higher than the level registered in February of the same year. By July 2021, that figure had stabilized “at levels 38X higher than before the pandemic” (McKinsey, 2021). Telemedicine in a Post COVID-19 World Given the above figures, it is clear that telemedicine is undergoing something of a renaissance in various parts of the world. Less technologically advanced countries have rushed to pave the way for its development just as eagerly as their more advanced counterparts. But what will the future of telemedicine look like once healthcare resources are no longer so thinly stretched? Will it continue along the trajectory it has followed thus far? Or, will it find itself instead relegated to the theoretical realm, as is so frequently the case with such innovative ideas? The issue needs to be examined from two different perspectives: that of the consumer, on one hand (patients, clinics, hospitals), and that of the providing structures, companies, and governments on the other. Regarding the former, recent surveys carried out by various institutions indicate that both patients and physicians see great value in telemedicine, with many intending to continue using it once the pandemic subsides.(These results vary greatly depending on the type of care provided – psychiatric care witnessed the highest rate of telemedicine uptake, while specialties such as surgery and ophthalmology, quite logically, saw much less significant uptake rates). (McKinsey, 2021). Regarding the latter, we need to consider the profitability of telemedicine to the companies supplying the technologies. Viewed from this perspective, telemedicine is unlikely to spur significant market interest if it remains simply a method to conduct remote patient visits. Analysts seem to agree that videoconferencing visits seem unlikely to disappear any time soon, but that they will have to become more than just a tool to facilitate calls between doctors and patients. Instead, companies active in the sector will have to combine their services with both digital therapy technologies, as well as more traditional treatments. Only vertically integrated players who provide end-to-end solutions will be able to survive. A Good Strategy: Adding Digital Therapeutics to the Package For telemedicine to be profitable and hence attractive to the market, companies providing this service will need to integrate it with other functions. Digital therapy technologies serve as a prime example of the type of additional services that could make a company more competitive in the ever-growing digital healthcare sector. Also known as "digital therapies" (or "DTx"), digital therapy technologies are those that offer therapeutic interventions guided by high-quality software programs. These programs are based on scientific evidence obtained through rigorous clinical trials with the aim of preventing, managing, or treating a broad spectrum of physical, mental, and behavioral conditions. Digital therapy, then, does not refer simply to telemonitoring interventions, nor does it refer to the types of systems offered by pharmaceutical companies to help patients in the management of their diseases (such as Patient Support Programs to monitor adherence to drug treatment). Rather, it represents a host of validated curative interventions, capable of improving clinical results. Whereas pharmacological treatments interact with the patient's biology, digital therapies interact with the thoughts and behaviors of those who use them. They can take the form of apps, video games, websites, or wearable devices, and work by spurring behavioral or lifestyle changes, as well as the application of cognitive-behavioral interventions through the digital creation of guidelines and programs. There are already various examples of digital therapeutics in the market. In 2017, The FDA approved ReSET, an app that offers cognitive-behavioral therapy to those suffering from addiction and opiate abuse issues. That was followed by the June 2020 approval of Endeavor, the first video game for therapeutic purposes, designed for children with attention deficit hyperactivity disorder (ADHD). From Telemedicine to Digital Care to Value-Based Healthcare The deployment of telemedicine, coupled with the addition of other digital health services such as digital therapeutics, goes hand in hand with an approach that has been gaining traction in recent years; that of Value-Based Healthcare (VBHC). This approach recognizes the importance of putting the patient at the center of the healthcare discourse, urging policy-makers and healthcare providers to build a system in which the human side of the patient is not only acknowledged but pushed to the forefront of all considerations. In this context, telemedicine, digital therapeutics, and digital care, in general, can help to create a more holistic and personalized approach to healthcare. Considered alongside the more obvious benefits of telemedicine, such as the decentralization of health interventions and the increased reach of, and accessibility to medical care, it would seem that telemedicine is destined to thrive, becoming a fundamental element of care in the years to come – but only so long as it is accompanied by a general evolution towards more patient-centered, cost-saving and socially sustainable healthcare policies. Author: Pietro Morabito Sources https://www.marionegri.it/magazine/terapie-digitali https://www.eng.it/resources/whitepaper/doc/telemedicina/ENG21_IP_Telemedicina_ita.pdf https://www.who.int/goe/publications/goe_telemedicine_2010.pdf https://www.osservatori.net/it/ricerche/osservatori-attivi/sanita-digitale https://www.mckinsey.com/industries/healthcare-systems-and-services/our-insights/telehealth-a-quarter-trillion-dollar-post-covid-19-reality https://www.resetforrecovery.com/ https://www.endeavorrx.com/

Sustainability Concerns Continue to Rise Issues of sustainable production and consumption have, over the last ten years, become increasingly important in the eyes of consumers around the world. Companies have had to make changes to meet these new expectations and can expect to do more of the same, in the future, in line with the continuation of this trend. According to a 2015 study by NielsenIQ, 66% of global consumers surveyed responded they would be willing to pay more for sustainable brands, up from the 50% who said they would do so in 2013. Almost half responded they would pay more to environmentally friendly companies and those demonstrating a strong commitment to social values. In recent years, pressure on companies to pay attention to issues of sustainability has only continued to mount. In a 2018 survey conducted across 5,000 consumers in Europe, for instance, nearly 40% of respondents said their top priority was that food and drink be produced in a way that doesn’t harm the environment, while almost a third prioritized paying workers a fair wage and ensuring that animals were not harmed during production. Almost three-quarters of all respondents wanted to know how their food is produced and a similar number wanted food companies to say where the ingredients in their products come from. Further, 61% reported looking for information about how food companies protect workers’ human rights. Respondents placed even greater emphasis on the need for companies to act on global challenges. Protection of the environment was cited as important by 88 % of those surveyed, with 85% and 84%, respectively, responding similarly with regards to tackling climate change and global poverty. Sustainability: The Global Nature of the Change in Consumer Preference The European findings are echoed in a 2018 Accenture study of 35,000 people in 35 countries, which revealed that two-thirds of consumers make decisions about what to buy based on a company’s transparency, while 62% wanted companies to have ethical values and demonstrate authenticity. A BCG survey conducted in July 2020 found that in the six-member states of the Gulf Cooperation Council, more than 80% of consumers said they were willing to live more sustainability. Moreover, 56% of respondents said they felt strongly about the need to adopt a sustainable lifestyle The 2021 Voice of the Consumer: Lifestyles Survey, published by Euromonitor International, further demonstrates the extent to which changing consumer preferences are global, and not restricted to Western or developed markets. It found, for instance, that almost 35% of those polled in emerging or developing markets reported that they buy sustainably produced goods. (Figure 1.) [caption id="attachment_7865" align="aligncenter" width="450"] Figure 1. Euromonitor International, 20-Aug-21, Ethical Claim Potential Index Identifies Top Market. Source: Voice of the Consumer: Lifestyles Survey, 2020 n=26,321; 2021 n=26,222[/caption] The Sustainable Market Share Index report, published by the NYU Stern School of Business in 2021, showed that the same shift in consumer preferences could also be seen among US consumers. The annual share of sustainability-marketed products there, for example, grew from 13.7% in 2015, to 16.8% in 2020. (Figure 2.) [caption id="attachment_7862" align="aligncenter" width="450"] Figure 2. NYU Stern, 1-Mar-21, Sustainable Market Share Index 2021[/caption] Covid-19’s Impact on the Shift Towards Sustainability Several surveys conducted in the wake of the pandemic have found that people are more concerned about environmental challenges because of the pandemic and are more committed to changing their own behavior to contribute to sustainability. Consumers are, as a result, reducing their household energy consumption, increasing recycling and composting, and buying more local goods. In a recent BCG survey, 90% of consumers said they were equally or more concerned about environmental issues after the COVID-19 outbreak, while 87% of respondents felt companies should better integrate environmental concerns into their products, services, and operations. In May 2020, research firm Kantar found that COVID-19 had led to a global surge in localism, with 65% of consumers responding that they preferred to buy goods locally (local products do not have to be shipped over long distances and therefore require fewer resources to bring to market, producing fewer carbon emissions in the process). November 2020 Data collected by data analytics firm GlobalData shows similarly that consumer perceptions have changed during the pandemic, with over 50% of respondents interviewed during lockdown claiming they found locally sourced ingredients more important than before the outbreak Perhaps most interestingly, the COVID-19 pandemic has changed consumer perceptions and priorities with regard to sustainability. Prior to the outbreak, the term was used as a synonym for environmentalism. Now, however, consumers report expanding their definition of sustainability to include how companies treat employees and interact with their local community. Company Reactions Companies have had to make changes in line with changing consumer sentiments and have done so in ways that can be broadly categorized into four areas of action. 1- Addition of Sustainable/Ethical Labels Leading food companies and retailers are growing their share of assortment with sustainable claims. Nestlé, for instance, has been purchasing more local and healthier food labels to offset declines in some of its mass-market brands. Another example is Dutch supermarket Coop’s switch entirely to Fairtrade bananas. German retailer Lidl’s has done the same across several European countries, and Nespresso has also expanded its sourcing of Fairtrade goods. 2-ESG Commitments Companies are increasing or shoring up their commitments to ESG policies and plans. Unilever, for instance, had already established sustainability goals that included net-zero emissions from its products by 2039, and investments of $1.1 billion in ESG-friendly initiatives over the next ten years. It recently added to these goals by announcing plans to label all its products with information on how much greenhouse gases they generate throughout the entire value chain of their production. Further examples include Zara’s 2020 pledge to use 100% sustainable fabrics by 2025, H&M’s recently stated commitment to achieving the same goal by 2030, and Adidas’ commitment to phasing out virgin polyester by 2024. Finnish grocer Kesko serves as another example, with its aim to become carbon neutral by 2025 and achieve net zero by 2030. 3-Sustainable Packaging Other companies are increasing their focus on sustainable packaging, to reduce their use of plastics. Giro Pack, for instance, has developed compostable bags that are produced using plant-based or organic materials. In April of 2021, P&G announced that Old Spice and Secret deodorants would appear in plastic-free packaging in certain stores, as part of a 2030 goal to reach 100% recyclable or reusable. Nestlé has also reported strong progress on its commitment to make 100% of its packaging recyclable or reusable by 2025, and to reduce its use of virgin plastics by one-third, by that year. 4-Social Impact Initiatives Other companies have chosen to prioritize initiatives that aim to produce positive social impact. Germany’s REWE, for instance, along with Portugal’s Jerónimo Martins, launched initiatives to better integrate migrants into the labor market and promote intercultural cooperation. Similarly, Swedish furniture giant IKEA recently broadened its social impact by committing to employ refugees at production centers in Jordan — part of the company’s stated long-term goal to employ some 200,000 disadvantaged people around the world. Outlook Going forward, increased, and rising awareness, the influence of social media, and regulatory initiatives with regards to sustainability are expected to drive the market. While no company can expect to be immune from these influences, the pressure to act will be felt most keenly by companies operating in certain consumer goods sectors, such as food and beverage, and fashion. According to the Ethical Food Global Market Report 2021, the global ethical food market is expected to grow from $542 billion in 2020 to $574.42 billion in 2021, before reaching a projected $727 billion in 2025. The global ethical fashion market is expected to show even greater rates of growth, going from $6,345.3 million in 2019 to $8,246 million in 2023, before growing further to $9,808 million in 2025 and $15,173 million in 2030. Smaller though significant increases in market size should also be expected across almost all categories of sustainably produced consumer goods, and if the shifts that have taken place over the past decade are any indication of the decade to come, the importance to consumers of sustainability will only continue to grow. Consumers have shown that they have become far more attuned to how brands speak and more importantly, how they behave. With consumers focusing more on sustainable, socially, and environmentally responsible consumption, companies will need to demonstrate that they’ve changed with the times. Only companies that can prove they meet the new, more ethical consumer standards will be able to thrive in a more sustainability-conscious world. Author: Omar Elkayal Sources: Mi3, 12-Oct-21, As Australia re-opens, brands truly delivering social good, localism and sustainability will roar ahead https://www.mi-3.com.au/11-10-2021/australia-re-opens-brands-truly-delivering-social-good-localism-and-sustainability-will Euromonitor International, 20-Aug-21, Ethical Claim Potential Index Identifies Top Market https://www.euromonitor.com/article/ethical-claim-potential-index-identifies-top-market Boston Consulting Group, 11-Aug-21, Sustainability Matters Now More Than Ever for Consumer Companies https://www.bcg.com/publications/2020/sustainability-matters-now-more-than-ever-for-consumer-companies MarketResearch.com, 1-Aug-21, Global Ethical Food Market - 2021-2028 https://www.marketresearch.com/DataM-Intelligence-4Market-Research-LLP-v4207/Global-Ethical-Food-30031892/ ThinkwithGoogle, 1-Aug-21, How localism is driving brand engagement with consumers across the globe https://www.thinkwithgoogle.com/consumer-insights/consumer-trends/localism-brand-engagement/ Euromonitor International, 1-Jul-21, Where to Play and How to Win? Mapping the Opportunity of Sustainability in Packaged Food https://www.euromonitor.com/where-to-play-and-how-to-win-mapping-the-opportunity-of-sustainability-in-packaged-food/report Mckinsey, 14-Jun-21, The path forward for sustainability in European grocery retail https://www.mckinsey.com/industries/retail/our-insights/the-path-forward-for-sustainability-in-european-grocery-retail Blend, 22-Mar-21, The Newest Fashion: Sustainability and Ecommerce Localization https://www.getblend.com/blog/fashion-sustainability-ecommerce-localization/ NYU Stern, 1-Mar-21, Sustainable Market Share Index 2021 https://www.stern.nyu.edu/sites/default/files/assets/documents/Final%202021%20CSB%20Practice%20Forum-%207.14.21.pdf Mckinsey, 12-Feb-21, The ESG premium: New perspectives on value and performance https://www.mckinsey.com/business-functions/sustainability/our-insights/the-esg-premium-new-perspectives-on-value-and-performance Mckinsey, 26-Jan-21, NEF Spotlight: The path forward for retail’s sustainable future https://www.mckinsey.com/business-functions/strategy-and-corporate-finance/our-insights/nef-spotlight-the-path-forward-for-retails-sustainable-future Businesswire, 11-Jan-21, Global Ethical Fashion Market Report 2020: Opportunities, Strategies, COVID-19 Impacts, Growth and Change, 2019-2030 https://www.globenewswire.com/en/news-release/2021/05/11/2226889/28124/en/Global-Ethical-Food-Market-Report-2021-COVID-19-Impacts-Growth-and-Change-to-2030.html Boston Consulting Group, 1-Jan-21, Are Consumers in the Gulf States Ready to Go Green? https://web-assets.bcg.com/c6/4e/57c1320644f0b64e6c0bc25942a0/bcg-are-consumers-in-the-gulf-states-ready-to-go-green-jan-2021.pdf GlobalData, 17-Nov-20, Localism will show high relevancy after COVID-19 pandemic has subsided https://www.globaldata.com/localism-will-show-high-relevancy-covid-19-pandemic-subsided/ Boston Consulting Group, 14-Jul-20, The Pandemic Is Heightening Environmental Awareness https://www.bcg.com/publications/2020/pandemic-is-heightening-environmental-awareness McKinsey, 1-Jun-20, The State of Fashion 2020 https://www.mckinsey.com/~/media/mckinsey/industries/retail/our%20insights/the%20state%20of%20fashion%202020%20navigating%20uncertainty/the-state-of-fashion-2020-final.pdf Fair Trade International, 10-May-19, Shoppers are demanding sustainable options – are companies getting on board? https://www.fairtrade.net/news/shoppers-are-demanding-sustainable-options-are-companies-getting-on-board NielsenIQ, 10-Jan-19, A natural rise in sustainability around the world https://nielseniq.com/global/en/insights/analysis/2019/a-natural-rise-in-sustainability-around-the-world/ ATKearney, 1-Sep-18, Competing in an Age of Multi-Localism https://www.kearney.com/documents/3677458/3679865/Competing+in+an+Age+of+Multi-Localism.pdf/42d71ac6-40b5-3bee-607a-2459b3ecec0a?t=1568061500000

Modern crypto assets offer fast and simple payments, innovative financial services, and access to untapped markets and un-banked parts of the world. All these innovations are made possible on account of the fast-evolving crypto ecosystem. However, the rapid growth and adoption of crypto assets have led to new risks and challenges. The Growth of Crypto Assets The market capitalization of crypto assets has registered substantial growth in recent years, albeit it amid large bouts of price volatility. In 2021, it increased three-fold compared to October 2020 reaching a record high of $2.5 trillion in early May. Concern from institutional holders on the influence of crypto assets on the environment, along with heightened global regulatory scrutiny led to a 40% decrease at the end of May, but the market value of crypto assets has since increased again, reaching more than $2 trillion by October 2021 — a 170 percent increase year to date. Numerous factors have played a role in the recovery of the crypto-assets market, most notably increasing interest from investors and consumers in decentralized finance (DeFi), Stablecoins, and “Smart Contract” blockchains. [caption id="attachment_7778" align="aligncenter" width="604"] Figure 1 - Market Capitalization for Crypto Assets (Billions of US dollars)- Source: IMF[/caption] Decentralized Finance (DeFi) Decentralized Finance is a blockchain-based open alternative to the current financial system that does not rely on financial entities such as banks, brokerages, or exchanges to provide traditional financial instruments, relying instead on smart contracts on blockchains such as Ethereum. The DeFi market size reached $110 billion in September 2021, up from just 15 billion at the end of 2020, due largely to the growth of decentralized exchanges that allow users to trade cryptos without resorting to an intermediary, and credit platforms that allow lenders to access borrowers without the need to undergo a credit risk evaluation. Stablecoins Most DeFi services are built on the Ethereum blockchain and use Ethereum-based tokens, including stable coins. Stablecoins are a form of cryptocurrency that is designed to provide price stability, by anchoring their value to a specific asset. While this is typically the US dollar, it can also include commodities such as gold or oil, or simply other fiat currencies. In 2021, the market capitalization of stable coins grew to more than $120 billion, a four-fold increase over 2020. The largest of these, “Tether”, saw its market share gradually decline as leading crypto exchanges such as USD coin by Coinbase and USD Binance introduced their own versions to the market. According to the IMF, the trading flows of Stablecoins outstrip all crypto assets, primarily because they are so usable for settlement of derivates and spot trades on exchanges. Moreover, their price stability continues to improve, protecting users from the volatility of other crypto-assets and in so doing encouraging them to keep their funds inside the crypto ecosystem. “Smart Contract” blockchains Smart contracts are computer programs or transaction protocols that are executed automatically when a set of conditions are met. They are used to automate the execution of a contract so all parties involved can be confident of the outcome without time loss or the need to rely on an intermediary. While Bitcoin remains the leading crypto asset in 2021, it has seen its market share decrease from 70 percent to less than 45 percent. The main reason behind this decrease is the shifting market interest towards more recent blockchains that operate smart contracts offering features that ensure sustainability, interoperability, and scalability. Ether, for instance, saw its trading volumes surpass those of Bitcoin earlier this year. Challenges Posed by the Crypto-Ecosystem The crypto ecosystem’s rapid growth has encouraged the entrance of new players and entities, many of which have poor cyber risk management, operational and governance frameworks. Cyber risks These include cases of hacking thefts of customer funds and the most common target centralized elements of the ecosystem, such as exchanges and wallets, though they have also been carried out against the consensus algorithms underpinning all crypto operations. Operational Risks These include failures and disruptions that prevent the use of services, leading to significant downtime and losses of customer funds. Such failures typically occur during periods of high transaction activity and are usually attributable to inadequate system and control design. Governance risks These encompass the lack of transparency regarding the issuance and distribution of crypto assets and have resulted in significant investor losses. Noteworthy examples of such risks include the hacking thefts of Coincheck in 2018, and KuCoin in 2019 — in Japan and Singapore respectively — and the sudden price collapse and rapid outflows from Bitmex in 2020. More recent examples include the temporary shutdown of the Philippines Digital Asset Exchange and the collapse of Turkish exchanges Vebitcoin and Thodex, all of which took place this year. Cryptoization In emerging markets, the advent of crypto assets brings with it heightened macro-financial risk, primarily in the form of asset and currency substitution, or ‘cryptoization’. Cryptoization can negatively impact such economies in several ways, with perhaps the biggest risk coming from its tendency to reinforce dollarization forces, impeding the ability of central banks to implement effective monetary policy. Looking Forward While the above-mentioned crises did not have a substantial impact on global and domestic financial stability, the macroeconomic impact of such risks will only increase as the crypto ecosystem continues to expand. According to the IMF, regulators can mitigate these risks by enhancing their monitoring of crypto-assets through targeting data gaps in the market, while policymakers can do the same by implementing global standards for crypto assets. As Stablecoins continue to gain prominence, regulations will have to increase in accordance with the economic functions they perform and the risks they present. This will be especially important in emerging and developing markets — where the macro-criticality of Stablecoins can be considerably higher. Finally, emerging markets threatened by cryptoization should reinforce their macroeconomic policies and consider the benefits of issuing central bank digital currencies. Author: Yassine Falk Sources: https://www.pwc.com/us/en/industries/financial-services/library/cryptocurrency-evolutiohtml https://www.firstposcom/business/imf-warns-rapid-growth-and-increasing-adoption-of-crypto- assets-pose-financial-stability-challenges-1001865html https://www.imf.org/-/media/Files/Publications/GFSR/2021/October/English/ch2.ashx https://economictimes.indiatimes.com/markets/cryptocurrency/emerging-market-cryptoization-threatens-financial-stability-imf/articleshow/86688539.cms?from=mdr https://www.reuters.com/business/finance/el-salvador-leads-world-into-cryptocurrency-bitcoin-legal-tender-2021-09-07/

The Challenge of Post-Pandemic International Travel International leisure travel in the post-pandemic world poses challenges to travelers ranging from PCR tests and vaccination requirements prior to departure, to quarantine periods and local safety protocols once they’ve arrived at their destination. At Infomineo, we previously published an article on how COVID-19 impacted the global travel and tourism industry, in which we outlined the major effects of the pandemic on the different tourism sectors. In this new study, we analyzed the arrival statistics of different countries, alongside the travel restrictions they put in place, allowing us to identify several trends among countries that have lifted all COVID-19 travel restrictions, and key differences between them and the countries that have maintained said restrictions. We examined the number of visitors to four countries, two of which reopened their borders post-lockdown with no COVID-19 travel restrictions in place, and the other two of which maintain travel restrictions to the current day. We grouped the countries into color groups as indicated below. Group 1: Countries with no travel restrictions: Mexico & Albania – Blue Group The first country in this group, Mexico, is one of the world’s top tourist destinations, with 95-99 million visitors annually. The second, Albania, has not historically received such high levels of visitors. Group 2: Countries with travel restrictions: Spain & Italy – Red Group The countries in this group traditionally rank among the top-visited countries worldwide, with each of Spain and Italy expecting around 82 and 65 million annual visitors respectively. We set out to examine how each set of countries has fared in terms of recovering previous numbers of visitors and looked at the number of monthly visitor arrivals to all four countries—both pre & post-lockdown—to discern arrival trends and provide you with the relevant insights. How Lifting Covid-Restrictions Aids in the Quick Recovery of Tourist Arrivals Having examined the tourist arrival figures in the countries selected, it appears that international travelers currently favor destinations with minimal or no COVID-19 restrictions, over those with such restrictions in place. This is clearly visible in the case of Albania, which opened its borders to travel in 2020 and implemented a visa-free initiative in 2021. Global tourism giant, Mexico, also witnessed a quick resurgence in tourist arrivals after reopening its borders, averaging 81% of their pre-pandemic monthly visitors during the peak season of 2021. Albania Despite its rich archaeological sites, pristine beaches, and low prices, Albania has not historically figured among the top travel destinations for many countries. We leveraged the country’s tourism statistics and concluded that most of Albania’s tourist arrivals are from its neighboring border countries (Kosovo, North Macedonia, Italy & Greece). In May 2020, Albania reopened its borders to welcome back tourists after the country reported no new coronavirus deaths for more than three consecutive weeks. In April of the following year, Albania announced that it would permit visa-free travel, through December 31st, 2021, to citizens of Bahrain, Egypt, Oman, India, Qatar, Russia, Saudi Arabia, and Thailand. The new initiative allowed citizens of these countries to visit Albania, without the need to obtain a visa nor the need to present negative PCR test results on arrival. After the country implemented its free-visa initiative, the number of tourist arrivals during its high season in 2021 reached 97.7% of the tourist flows registered in 2019. The share of visitors from new markets increased from 8.4% prior to the outbreak of the pandemic, to 19.1% in 2021, with new market visitors taking advantage of the absence of visa and COVID-19 travel restrictions to Albania. We interviewed Geri Cakoni, head of sales for the inbound-tourism company Good Albania, who explained that the initiatives provided much-needed relief in terms of incoming tourism. This was especially true, he highlighted, for the first few months after reopening, when tourism figures were stale and the countries from which travelers usually arrived were still reluctant to open to Albania for tourism. He explained further that his company witnessed a dramatic increase in the number of inquiries from middle eastern travelers and estimated that 20-30% of his company’s clients this year have been a direct result of the visa-free entry initiative. Mexico Thanks to its vivid landscapes, coastal resorts, cultural festivals, and archeological ruins, Mexico has consistently ranked among the world’s top visited countries globally by the number of tourist arrivals. In March 2020 it closed its borders to travel due to the international lockdown, and an increase in COVID-19 cases locally. It reopened for tourism in July of the same year, however, and did so without putting any COVID-19 restrictions on travelers in place. In July 2020, shortly after opening for tourism, the country recorded tourist flows of 1.3 million visitors (around 33% of pre-pandemic rates). By December, the number of tourists reached 2.6 million (55% of pre-pandemic rates). Because these figures were recorded during mid and late 2020, we believe that the low figures were due to the international lock-down and travel restrictions from the source markets. In 2021, the number of visitors increased to between 1.6 and 3.3 million tourists monthly, representing a recovery rate as high as 81% in June & July 2021, when compared to 2019 tourist arrivals. The country appears to be well on its way to pre-COVID 19 levels of tourist arrivals due to its early border reopening and the non-imposition of travel restrictions. Are Top Tourism Destinations Still in Pole Position? In the second part of our study, we examined the arrivals of tourists to Spain and Italy, two of the most popular tourist destinations globally. Spain receives around 82 million visitors annually while Italy welcomes 65 million tourists, on average, per year. Due to their delayed border reopening, however, coupled with tight COVID-19 restrictions & requirements, both still struggle to recover pre-pandemic levels of tourist arrivals. Both countries allow only vaccinated visitors and require that these same visitors present proof of a negative PCR test before departure from their home countries. Because both countries also lie within the EU, their border openings are further subject to EU regulations. Spain Spain suspended tourism and travel in March 2020. In the following 2 months, April & May, inbound traffic held stable at zero with airports in the country remaining shut down. Arrivals to the country increased as restrictions were eased to permit necessary travel in May 2020, but these figures would not have included any tourist visitors. When EU travel borders reopened in June 2021 and Spanish borders were opened to vaccinated foreign travelers, traveler arrival figures failed to rise as dramatically as they had in the blue group countries. The number of inbound tourist arrivals increased from 400k-600k in early 2021, to 2.2, 3.4, and 5.2 million tourists in June, July, and August respectively. Despite the increase in tourist arrivals, these figures represent only about 40% of the 2019 figures through its high season. Italy Italy’s tourist arrival figures plot a similar trajectory to that of Spain, albeit with lower figures. Prior to the pandemic, Italy received between 3-5 million tourists during its low seasons and 6-8 million tourists during its high season travel months. Italy reopened its borders in June 2021 with arrivals that month reaching around 1.8 million. In July 2021, that number increased to 3.1 million. That translates to a recovery rate of 27%, 35%, and 62% of pre-pandemic figures for its high season months of June, July & August 2021 respectively. Outlook Although both Spain & Italy have reopened their borders to tourism, there remains great potential in reactivating their tourism sector due to their long-held positions at the top of the global tourism standings. Nevertheless, they are unlikely to quickly return to pre-pandemic levels of arrivals, due to their late border reopening & the COVID-19 travel restrictions currently in place. While countries with strict travel restrictions struggle to recover their pre-pandemic numbers of visitors, those without such restrictions in place can expect to continue to see rising recovery rates. Just how long they can expect to do so, however, and whether they can expect to see their number of monthly arrivals eclipse previous records, remains to be seen. Author: Mohamed Aref Disclaimer All calculated figures are Infomineo’s team analysis. All inbound tourism figures refer to visitors for the purposes of vacation or holiday. (Arrivals>Tourist>Leisure) High-season touristic months are calculated by Infomineo according to the seasonality charts provided by the UNWTO Glossary Arrivals: Includes the total number of entries from all border crossings (air, sea, and land) Tourist: Any visitor who spends at least one night at a destination country (regardless of accommodation type) High Season: The months in which a country usually receives the highest number of inbound travelers. Raw Data To access the raw data and sources used, along with the team’s calculations, click here to download the file Interested in capturing your project-specific travel & tourism data? Get in touch with our team!

The global e-commerce market has, over the last two years, undergone revolutionary change. Consumers have grown accustomed to buying items from the comfort of their own home – a change spurred largely by strict lockdowns and restrictions on movement – and many analysts agree that this shift in consumer behavior has propelled the e-commerce industry forward by at least five years. This shift in shopping behavior, moreover, looks likely to be permanent and not transitory. Global E-Commerce Market Overview The global e-commerce market is expected to reach $4.92 Trillion in sales by the end of 2021, representing 17% year-on-year growth. This growth is, however, down from the stellar 26% increase experienced by the market in 2020. Sustained double-digit growth is forecast for the coming three years, representing a tremendous opportunity for businesses that have not yet provided their customers with an online sales channel. Global Retail E-commerce Sales (USD Trillions, % Change YOY) Businesses that had not yet invested in establishing an online presence were the ones most affected by the pandemic. According to data from Yelp, 163,735 businesses had closed due to the pandemic as of August 2020, with 60% of these closures being permanent (97,966). Businesses that moved online, on the other hand, have largely been able to survive or even thrive. Global Retail Sales (%) (2019 – 2025) * *eMarketer, May 2021 The pandemic has also significantly impacted the growth of certain product categories. Hardware-based products, for instance, such as laptops, TVs, phones & video game consoles have seen a 134% increase in order volume since the start of the pandemic. This is largely due to lockdown and confinement-induced changes in consumer needs. As more workers moved to remote work, the need for suitable computer and office equipment drove up sales. Similarly, house-bound consumers have looked to update their home entertainment systems, driving up sales of TVs, gaming consoles, and other such products. The sporting goods category also benefitted from confinement measures as people looked to replace their gym memberships with home exercise equipment and the sporting goods necessary for outdoor recreation. E-Commerce Market Breakdown by Region Looking at e-commerce sales figures by region, Asia-Pacific leads the pack with $2.4 trillion in sales in 2020. The region — home to e-commerce juggernauts Alibaba, JD, and Pinduoduo among others — saw a 26% growth in e-commerce sales. Within the region, China is a frontrunner by some margin, and according to eMarketer is well on its path to becoming the first country in history in which e-commerce sales will amount to more than half of retail sales, with 52.1% of retail sales forecast to take place through online channels in 2021. The top spot in terms of growth, however, is held by Latin America, which saw a 37% increase in e-commerce sales compared to 2019. Many countries contributed to this outstanding growth with Argentina leading the way; the country’s online retail sector grew by 79% in 2020, helped in large part by the presence of homegrown e-commerce giant Mercado Libre, often dubbed the “Amazon of Latin America”. Mercado Libre’s sales saw a surge of 46.5% in Latin America in 2020. Its stock has also outperformed Amazon's over the last year, increasing by just under 65% during 2020 compared to Amazon's 33% increase during that period. The Impact of COVID-19 on the Top Players in E-Commerce Gross merchandise volume, or GMV, is often used to assess the health of e-commerce businesses. It indicates the total sales of merchandise over a given period and is calculated prior to the deduction of any fees or expenses. Considered alongside data from the financial statements of the top global e-commerce, a clear picture of the impact of COVID-19 on e-commerce can be gleaned. Services e-commerce companies, such as those involved in ride-hailing and travel, suffered a sharp decline in GMV pushing them below their peers in the rankings of top B2C e-commerce companies by that measure. Expedia, for instance, fell from 5th place in 2019 to 11th in 2020, while Booking Holdings fell from 6th to 12th, and Airbnb fell from 11th to 13th. Despite the reduction in services companies’ GMV, the total GMV for the top 13 companies rose by 20.5% in 2020, surpassing the 17.9% in growth registered in 2019. Demand Side E-Commerce Trends The COVID-19 pandemic has brought about a plethora of changes in consumer shopping behavior. Some of these have proved positive for e-commerce retailers, while others have forced sellers to make substantial changes. Post-Pandemic Transition from “Need Buying” to Indulgence Spending Throughout the pandemic, consumers were limited as to where and when they could spend their money. According to McKinsey, 51% of US consumers reported a desire to splurge and indulge in "revenge spending" once the pandemic subsides. Another figure, reported in the Deloitte consumer behavior tracker, shows that 47% of consumers surveyed reported delaying large purchases in 2020. This figure dropped to 37% in June 2021, indicating that consumers are beginning to spend more as they move away from necessity-based buying. Ethical Shopping and Ethical Brands During the pandemic interest in ethical shopping and ethical brands rose by 450% according to Google, while a survey done by Accenture revealed that 45% of consumers are making more sustainable choices when shopping and report that they will likely continue to do so. Brand Loyalty Disruption According to a McKinsey study, 75% of consumers tried new shopping behaviors during the pandemic while 39%, mainly millennials and Gen Z, deserted trusted brands for new ones. Permanent Consumer shopping Behavior Change Just under 49% of people who tried shopping online during the outbreak said they would do it more frequently once the pandemic subsides. This varies by geographical location, however; while 60% of Italians shopped online during the pandemic, less than 10% reported being satisfied with the experience. In contrast, 73% of Finnish consumers who shopped online during the COVID-19 pandemic said they would continue doing so after the crisis. Supply Side E-Commerce Trends Increasing consumer tech adoption, alongside changes imposed by the outbreak of COVID-19, has brought about significant changes that might well alter the e-commerce space permanently. Click & Collect Also known as curbside pickup, click & collect services have seen growing popularity during the pandemic due to consumers’ safety concerns. Orders placed online or by phone are packaged and then either put in the trunk of customers’ cars or set outside for pick up. Among stores ranked in the Digital Commerce 360 Top 500, just under 44% of the 245 retailers surveyed offered Click & Collect in 2020, a sharp increase from the 6.9% figure registered at the end of 2019. Direct to Consumer Direct to consumer brands are increasing in popularity and the COVID-19 pandemic has given these brands an extra boost. Consumer goods companies saw 70% growth coming from DTC sales online, and according to eMarketer, web traffic on DTC shops has doubled in the last two years. Omnichannel Strategy Omnichannel marketing strategies have become one of the most dominant trends in the e-commerce space. According to Google, omnichannel strategies drive an 80% higher rate of incremental store visits, while another study done on EU consumers found that 67% of consumers use multiple channels to conduct a single transaction. Buy Now Pay Later The BNPL model allows consumers to make an upfront payment toward a purchase, then pay the remainder off in a predetermined number of installments. E-commerce retailers get the full price paid, making this transaction one between the BNPL service provider - such as PayPal and Klarna - and the customer. BNPL market share worldwide is expected to double from 2.1% in 2020 to 4.2% by 2024. Global e-commerce’s post-pandemic future Looking forward, changes that were either ushered in or accelerated by the pandemic, look likely to prove permanent. Consumers who were introduced to the convenience of online shopping are unlikely to revert completely to old shopping behaviors, though the growth in e-commerce is expected to slow as more physical stores reopen and shoppers return to the high streets. The Asia-Pacific region’s position as the largest regional e-commerce market is unlikely to change soon despite the continued rapid growth forecast for both Latin America and North America. E-commerce market leaders have mostly cemented their positions, benefiting greatly from lockdowns and the associated changes in consumer behavior. Services e-commerce companies such as Expedia, Airbnb, and Uber, however, are an exception to this trend and may struggle to recover the positions they enjoyed before the outbreak of COVID-19. Demand-side trends such as brand loyalty disruption and the increased interest in ethical shopping, promise to continue to play an important role, as do supply-side trends such as click & collect m-commerce, and BNPL. The exact degree to which this will be the case, however, remains to be seen and retailers will have to remain flexible to respond appropriately to these changes. Author: Othmane Zidane Sources https://www.shopify.com/enterprise/global-ecommerce-statistics#2 https://www.statista.com/statistics/534123/e-commerce-share-of-retail-sales-worldwide/ https://www.yelpeconomicaverage.com/business-closures-update-sep-2020 https://internetretailing.net/covid-19/covid-19/85000-businesses-launch-online-shops-as-b2c-and-b2b-ecommerce-surge-in-lockdown-21639 https://www.bazaarvoice.com/blog/the-impact-of-covid-19-on-e-commerce-by-category/ https://www.statista.com/statistics/311357/sales-of-e-commerce-worldwide-by-region/ https://www.emarketer.com/content/global-historic-first-ecommerce-china-will-account-more-than-50-of-retail-sales https://www.emarketer.com/content/mercado-libre-will-surpass-20-billion-ecommerce-sales-2020 https://www.emarketer.com/content/global-ecommerce-forecast-2021 https://www.fool.com/investing/2021/05/25/better-buy-mercadolibre-vs-amazon/ https://unctad.org/system/files/official-document/tn_unctad_ict4d18_en.pdf https://www.mckinsey.com/business-functions/marketing-and-sales/our-insights/emerging-consumer-trends-in-a-post-covid-19-world https://www.thinkwithgoogle.com/consumer-insights/consumer-trends/pandemic-shopping-behavior/ https://www.investopedia.com/how-shopping-habits-changed-due-to-covid-5186278 https://www.digitalcommerce360.com/2021/02/19/ecommerce-during-coronavirus-pandemic-in-charts/ https://www.bigcommerce.com/blog/mobile-commerce/#common-benefits-of-mobile-commerce https://www.businessinsider.com/mobile-commerce-shopping-trends-stats https://www.groovecommerce.com/ecommerce-blog/mobile-ecommerce-examples/ https://www.imrg.org/blog/direct-to-consumer-booms-during-covid-19/ https://www.retaildive.com/news/how-nike-is-using-dtc-and-data-to-expand-its-empire/596602/ https://www.thinkwithgoogle.com/consumer-insights/consumer-trends/meeting-shoppers-needs-omnichannel-drives-instore/ https://inviqa.com/blog/magic-disneys-omnichannel-experience https://www.statista.com/topics/8107/buy-now-pay-later-bnpl/#dossierKeyfigures https://www.retaildive.com/news/target-adds-buy-now-pay-later-options-with-affirm-sezzle/607842/ https://www.emarketer.com/content/voice-commerce-holds-promise-yet-shoppers-are-skeptical https://medium.com/@Rubingh/the-year-of-voice-50aa2c6d3f5b https://voicefront.ai/blog/how-starbucks-increased-their-mrpu-by-16-using-voice-commerce/

Covid-19 has increased the number of poor people in the world The COVID-19 pandemic has revealed stark inequities that are simultaneously acute and chronic. Even more so, it triggered a global humanitarian crisis, putting both lives and livelihoods at risk. According to the World Bank, global extreme poverty rose in 2020 for the first time in over 20 years as the disruption of the COVID-19 pandemic compounds the forces of conflict and climate change, which were already slowing poverty reduction progress. The estimated increase in global poverty in 2020 was truly unprecedented, with COVID-19-induced new poor estimated to be between 119 and 124 million. NGOs and governments have been particularly active and have stepped up to provide relief. These relief packages will continue to be important as the pandemic stretches out, with recovery likely to be a long-drawn process. Official development assistance (ODA) from members of the OECD’s Development Assistance Committee (DAC) rose to an all-time high of USD 161.2 billion in 2020, up 3.5% in real terms from 2019, boosted by additional spending mobilized to help developing countries grappling with the COVID-19 crisis. Bilateral ODA to Africa and least-developed countries rose by 4.1% and 1.8% respectively. Humanitarian aid rose by 6%. The world is off-track to ending poverty in 2030 Poverty eradication, especially in developing countries, is one of the greatest challenges facing the world today, and an indispensable requirement for sustainable development. This explains why in 2015, the international community enshrined the aim of ending extreme poverty by 2030 in the Sustainable Development Goals. According to the most recent estimates, in 2019, 8.2 percent of the world’s population lived on less than $1.90 a day. Even before COVID-19, baseline projections suggested that 6 percent of the global population would still be living in extreme poverty in 2030, missing the target of ending poverty. [caption id="attachment_7649" align="aligncenter" width="545"] Source: Lakner et al. (2020) (updated), PovcalNet, World Bank (2020)[/caption] According to UN data, the share of the world’s population living on less than $1.90 per day was between 9.1% and 9.4% in 2020. These estimates are close to the global poverty rate of 9.2% in 2017, implying a three-year setback in the poverty reduction goals. Projected estimates for 2030 incorporating the COVID-19 pandemic suggest a 6-to-7-year setback in the poverty reduction goal relative to the projections without the pandemic. Accounting for COVID-19 suggests a global extreme poverty rate between 6.7% and 7.0% in 2030, which translates to between 573 and 597 million poor people. This suggests that the COVID-19 pandemic is likely to set back progress towards the World Bank’s poverty goal by 6 to 7 years. Aid and economic growth are not enough to end extreme poverty Historically, the quest to reduce poverty has relied on two levers: economic growth and the intentional redistribution of resources to the poor, either by the domestic state or foreign aid. Lucy Page and Rohini Pande (“Ending Global Poverty: Why Money Isn’t Enough, 2018” published by Journal of Economic Perspectives) argue that growth and aid, at least as currently constituted, are unlikely to suffice to end extreme poverty by 2030. They added that the total volume of aid has increased substantially over time, rising nearly fivefold between 1960 and 2016, from about $32 billion to $158 billion in 2016—both in constant 2016 US dollars (OECD 2018). Indeed, if the cost of ending poverty were simply the dollar value of the shortfall between the poor’s daily consumption and $1.90, then the problem would appear to have been solved because official development assistance has exceeded this value since 2006. Economic growth may not help reduce poverty because growth often discriminates. But poverty can have a long half-life in the presence of inequality. In India, which in 2013 contained the largest share of the world’s extremely poor, over 100 billionaires lived alongside 210.4 million people in extreme poverty. This imbalance arises from unequal growth. These trends in inequality suggest that growth does not reduce poverty as quickly as the equitable distribution of resources might permit. Results-Based Financing (RBF) vs traditional funding mechanisms The complexity and interconnectedness of the variables that drive poverty reduction and inclusion outcomes call for the use of different approaches other than the traditional approaches that have yielded very few results. To end extreme poverty sustainably and as quickly as possible, the states governing the world’s poor need to maximize finance for poverty eradication by leveraging innovative financing models that are both accountable to the needs of the poor and have the capacity to meet those needs. Traditional development funding approaches, where payments are made based on inputs and activities have perpetuated unsatisfactory results. This is because traditional funding rewards implementers for delivering the activities of development programs according to pre-established plans and timelines and not based on the results or impact made by the intervention. Results-based financing responds to these limitations through a simple but fundamental change in the way poverty reduction programs are funded: Shifting from paying for inputs and activities to paying based on measurable results being achieved and verified. RBF thus provides an additional guarantee of value for money compared to traditional funding. With RBF, payments are closely linked to the intended development results and hence bridge the gap between good intentions and results. By tying payments to results, RBF ensures that funding supports outputs or outcomes. Results based financing is the way to go In 2014, UNCTAD estimates that achieving the Sustainable Development Goals (SDGs) by 2030 will require $3.9 trillion to be invested in developing countries each year. It also notes that with an annual investment of only $1.4 trillion, the annual investment gap is $2.5 trillion. To fill this gap, countries have increasingly adopted results-based financing, or RBF, as an innovative and effective approach to funding poverty alleviation projects. This approach (RBF approach) has risen to the challenge. In the last decade alone, at least $25 billion of development spending has been tied to results, an increase from just a few billion the decade before. This growth has largely been led by the World Bank with its Program-for-Results Financing (PforR) instrument involving $19 billion tied to results. The World Bank’s Global Partnership for Results-Based Approaches (GPRBA) has tested RBF approaches in Africa, South Asia, and other developing regions which has benefited around 11 million people in 30 countries, improving services for low-income communities in a range of sectors. RBF is defined as a financing arrangement in which payment is contingent upon the achievement of predefined and subsequently verified results. To help eradicate poverty and ensure that no one is left behind, governments and donor groups can use results-based financing (RBF) approaches which can catalyze social impact for long-term structural change. RBF ensures that development funding is linked to pre-agreed and verified results, and that funding is provided when the results are achieved. Through a range of mechanisms, RBF drives both innovation and efficiency by aligning incentives to the welfare of program beneficiaries, providing flexibility to maximize results, and enhancing the accountability of the incentivized agent to the beneficiaries. By putting a portion of the funding at risk, or providing a bonus payment, RBF promotes alignment between the interest of the funder, the incentivized agent, and the welfare of the beneficiaries. It does so by rewarding the incentivized agents financially for delivering results, thus compelling them to implement activities that meet the beneficiaries’ needs. Evidence of the effectiveness of RBF Whilst the practice of RBF remains nascent, there is overwhelming evidence of its impact. In Burkina Faso, Trickle Up partnered with community-based organizations to deliver its program under a results-based financing model. The program is based on the graduation program, which combines seed capital, savings, skills training, coaching, confidence-building, and social support. Since 2007 Trickle Up has implemented the Graduation approach with approximately 5,450 households, effectively impacting over 27,000 beneficiaries. Results show that the Trickle Up program has contributed to increasing households’ income and daily spending on foods other than grains by 3 times, increasing participation in savings to up to 99%, up from only 34% at baseline, supporting the creation of livelihoods with 65% of participants in Burkina Faso reporting having two or more businesses, increasing the resilience of participant households to environmental shocks and market trends. As the number of poor people increases due to the COVID-19 pandemic with its resultant effect of more funds needed to eradicate poverty. Now more than ever is the time to use innovative financing models such as RBF to finance poverty alleviation projects to make sure that the desired results are achieved with limited resources deployed. Much progress has been made but much more is still required. Author: Jonathan Sumbobo Sources https://blogs.worldbank.org/opendata/updated-estimates-impact-covid-19-global-poverty-looking-back-2020-and-outlook-2021 https://documents1.worldbank.org/curated/en/765601591733806023/pdf/How-Much-Does-Reducing-Inequality-Matter-for-Global-Poverty.pdf https://sustainabledevelopment.un.org/content/documents/3770chapeau_clean.pdf https://mappingignorance.org/2018/12/19/when-money-is-not-enough-to-help-the-poorest/ https://pubs.aeaweb.org/doi/pdfplus/10.1257/jep.32.4.173 https://www.oecd.org/dac/financing-sustainable-development/development-finance-standards/official-development-assistance.htm https://sdgs.un.org/goals/goal1 https://blogs.worldbank.org/opendata/projecting-global-extreme-poverty-2030-how-close-are-we-world-banks-3-goal https://www.worldbank.org/en/news/feature/2019/06/28/banking-on-impact-what-you-need-to-know-about-results-based-financing http://gpoba.org/sites/gpoba.org/files/publication/downloads/2018-11/Guide_for_Effective_RBF_Strategies.pd https://www.instiglio.org/impact/trickle-up-performance-based-contract-design-in-burkina-faso/ https://trickleup.org/wp-content/uploads/2020/03/OurWorkBurkinaFaso_2016_10.pdf

Critical shortages of crucial semiconductors are causing severe problems in various industries across the globe. Why is there a microchip shortage, how is it influencing policies and strategies implemented by governments, and will it end anytime soon? What are microchips? A microchip (sometimes referred to as a chip, a computer chip, an integrated circuit or IC) is a set of electronic circuits on a small flat piece of silicon. Transistors on the chip act as small electrical switches. Silicon, the material of choice in the chip manufacturing industry, is a ‘semiconductor’. By mixing it with other materials such as phosphorus or boron, its conductive properties can be increased, which makes it possible to turn an electrical current on or off. Microchips are used in many consumer products such as smartphones, laptops, gaming consoles, household appliances like fridges and washing machines, alarm clocks, and even cars, as well as a variety of other industries, including medical devices and networking equipment. What are the causes of the shortage? Chips themselves are quite resilient pieces of technology. They are made to handle external shocks such as vibrations and extreme temperatures. However, the global supply chain, as has been demonstrated these past months, is fragile and prone to disruptions from natural and man-made shocks. In Spring 2020, the COVID-19 pandemic caused a significant drop in auto sales. This prompted car manufacturers to cancel orders of various materials and parts, including microchips, which are used for everything from computer management of engines for better fuel economy to driver-assistance features such as emergency braking. At the same time, a significant part of the workforce purchased equipment to recreate the office at home, school systems switched to virtual learning through laptops and tablets, and households increased their spending on home entertainment products. These changes, accompanied by the continuous growth experienced by cloud computing, as well as the 5G rollout, ended up capturing the capacity that had been freed up by car manufacturers. When the latter realized demand was bouncing back sooner than they had forecasted, chip factories were already committed to their customers in industries such as consumer electronics. But these ended up experiencing shortages as well due to the “stay at home” effect that resulted in some of the strongest demand in decades. Shortages were also exacerbated by geopolitical factors. Since early 2017, the US and Chinese administrations triggered a new era of trade restrictions that led to major microchip supply chain disruptions. These became even more critical after official bans in 2019 for Huawei, the world’s largest communications equipment and second-largest smartphone manufacturer, and in 2020 against Semiconductor Manufacturing International Corporation (SMIC), China’s largest semiconductor foundry and the fifth largest in the world, while over 40 major Chinese technology companies were designated as military-related entities by the US department of Defense in 2020 and 2021. Constraints in the global transportation system have added another layer of complexity. With shortages of shipping containers, companies ended up having to pay premiums for shipping, thus driving demand towards airfreight. The latter was, however, already under heavy strain because of the pandemic, and thus lacked the necessary freight capacity. Finally, weather-related disruptions contributed as well to transforming a supply shortage into this global supply crisis. The state of Texas was hit by a record blizzard and extreme cold weather in February 2021, which triggered a triple power outage of the electric grid, gas and diesel. Several major semiconductor manufacturers, including Samsung, NXP Semiconductors and Infineon, were thus forced to shut down their local plants. In Japan, a fire at the main facility of Renesas Electronics’ Naka plant in March shut down production. These events were devastating for the automotive sector since Renesas, NXP and Infineon represent nearly one-third of the entire supply of auto semiconductors. In Taiwan, the worst drought the country has experienced in half a century placed a strain on semiconductor producers, who require large volumes of water for chip manufacturing. How are governments reacting to the crisis? Since these devastating chip shortages have exposed the fragility of the global supply chain, governments across the world have started to take action. In the United States, an estimated 169 industries spend more than 1% of their GDP on chips and have thus been impacted by the crisis, according to a Goldman Sachs analysis. Acknowledging the importance of semiconductors for the economy, President Biden signed Executive Order 14017, “America’s Supply Chains” in February 2021, directing the government to undertake a comprehensive review of domestic supply chains to identify and address risks and vulnerabilities, as well as develop a strategy to foster resilience. Congress also introduced in June 2020 the Creating Helpful Incentives to Produce Semiconductors (CHIPS) for America Act. The Senate approved in June 2021 $52 billion in order to strengthen domestic capacity for semiconductor manufacturing. As part of its $2 trillion COVID-19 economic recovery package, the European Union’s “Digital Compass” includes as one of its goals the production of at least 20% of the world’s next-generation semiconductors by value in 2030, compared with 10% of the world chip market in 2020. In September 2021, during her State of the European Union address, President of the European Commission Ursula von der Leyen announced a European Chips Act. With member states currently designing national strategies, the Act would aim to integrate these efforts through a European semiconductor research strategy, a collective plan to enhance European production capacity, and a framework for international cooperation and partnership. In South Korea, Samsung Electronics and SK Hynix will be leading a $451 billion investment on domestic semiconductor production over the next decade under a national blueprint devised by President Moon Jae-in’s administration. They will be among 153 companies, focusing on the K-semiconductor belt, a newly named region south of Seoul that hopes to be the epicenter of South Korea's semiconductor push. Kung Ming-hsin, the head of Taiwan's economic planning agency, the National Development Council, told Reuters in late April 2021 that between now and 2025, Taiwanese companies have planned more than $107 billion in investments in the semiconductor industry, with chip giants such as Taiwan Semiconductor Manufacturing Co Ltd (TSMC) and Powerchip Semiconductor Manufacturing Corp looking to expand. How is the crisis evolving? While the semiconductor crisis had been expected to be solved by the end of 2021, experts believe that the global supply chain could remain in dire straits until 2023. This sentiment was also mirrored by Intel CEO Pat Gelsinger: "We're in the worst of it now, every quarter, next year we'll get incrementally better, but they're not going to have supply-demand balance until 2023," Gelsinger was quoted as saying. Indeed, while investments have started to accelerate, it will take time before they can have a real impact. Furthermore, supply chains are bound to keep experiencing severe strains as demand for electronics grows. As Gartner analyst Alan Priestley put it, “The capacity [the chip makers] are putting in place now will be enough for the next few years, and as these things come on stream there’ll be too much capacity. But then, in another five years, we’ll be maxing out capacity again because everyone wants the latest smartphones, and we expect to see demand for things like smart homes and electric vehicles increasing. The industry is very cyclical; that’s just the nature of the beast.” Jihane Benazzouz - Sr. Business Research Analyst Sources: https://www.asml.com/en/technology/all-about-microchips/microchip-basics https://www.cnbc.com/2021/08/04/moodys-analytics-on-global-semiconductor-shortage-and-governments.html https://hbr.org/2021/02/why-were-in-the-midst-of-a-global-semiconductor-shortage https://www.scmp.com/tech/tech-war/article/3133061/why-there-global-semiconductor-shortage-how-it-started-who-it-hurting https://www.euronews.com/next/2021/08/03/global-semiconductor-shortage-more-challenging-times-ahead-for-europe-s-major-carmakers https://spectrum.ieee.org/chip-shortage https://www.ssga.com/library-content/pdfs/ic/Insight/chip-shortages-created-by-demand.pdf https://www.1cornhill.com/files/documents/magazine/newsletter-2021-06-archive.pdf https://finance.yahoo.com/news/these-industries-are-hit-hardest-by-the-global-chip-shortage-122854251.html https://www.sdxcentral.com/articles/news/can-congress-52b-chip-bill-overcome-the-silicon-shortage/2021/09/ https://www.whitehouse.gov/wp-content/uploads/2021/06/100-day-supply-chain-review-report.pdf https://ec.europa.eu/commission/commissioners/2019-2024/breton/blog/how-european-chips-act-will-put-europe-back-tech-race_en https://www.wsj.com/articles/eu-seeks-to-double-share-of-world-chip-market-by-2030-in-digital-sovereignty-drive-11615305395 https://www.counterpointresearch.com/chips-governments-move-address-shortage/ https://www.bloomberg.com/news/articles/2021-05-13/korea-unveils-450-billion-push-to-seize-global-chipmaking-crown https://www.reuters.com/technology/taiwan-minister-sees-years-growth-chip-industry-2021-04-23/ https://techmonitor.ai/technology/chip-shortage-tsmc-samsung-us-uk-taiwan-automotive https://www.businessinsider.in/tech/news/intel-ceo-says-global-chip-shortage-will-not-end-before-2023/articleshow/87200140.cms

Expo 2020 Dubai, the region's first of its kind, has been a long-awaited event. With its “Connecting Minds, Creating the Future” theme, Expo 2020 is focusing on three main elements: sustainability, mobility, and opportunity. Aiming to become the most sustainable expo so far, Expo 2020 Dubai has taken diverse measures from installing renewable energy systems to reducing water usage and segregating waste. Expo 2020’s sustainability efforts are supported by its partners that have been undertaking various sustainability initiatives of their own besides helping realize the expo's sustainability vision. Expo 2020 partners and environmental sustainability efforts GHG emissions Expo 2020 partners are taking climate action by setting ambitious GHG emissions reduction goals. For example, Accenture is targeting net-zero carbon emissions by 2025, with specific goals to reduce absolute GHG emissions by 11% and its scope 1&2 emissions by 65% from its 2016 baseline. Cisco has also promised to have net-zero emissions by 2040, with near-term goals of reaching net-zero for global scope 1&2 emissions by 2025 and reducing scope 3 emissions by 30% by 2030 from its 2019 baseline. Water consumption Expo 2020 partners are also working on reducing their water consumption. For example, PepsiCo has reduced its consumption by 21% from 2018 to 2020. The company has also pledged to improve its water use efficiency by 15% in agriculture, and by 25% in operations from its 2015 baseline. It is also hoping to replenish the water consumed in manufacturing by 100%. Renewable energy Expo 2020 partners are conscious of the impact of their operations on the environment and thus have been switching to clean energy sources. For instance, both SAP and Mastercard are fully relying on renewable energy, with 100% of their electricity being generated from renewables in 2020. Waste recycling Waste recycling initiatives are also key for the Expo 2020 partners. Among the partners, Nissan is a leader, with 96% of its wastes either recycled or diverted in 2020. It is followed by Siemens, with 93% of its wastes recycled or diverted in the same year. Some partners have set other waste recycling goals such as Accenture, which pledged to repurpose or recycle 100% of its e-waste by 2025. Partners’ contribution to a more sustainable Expo 2020 Siemens As the Expo 2020 Infrastructure Digitalization Partner, Siemens is helping the expo achieve its sustainability targets by integrating its smart building technology across the expo structures, providing transparency into their energy and water consumption. PepsiCo In preparation for the event, PepsiCo has launched Expo 2020 Dubai co-branded Aquafina cans and glass bottles, as well as limited-edition Pepsi cans, which are all fully recyclable. PepsiCo is also collaborating closely with Dulsco, the official waste management partner for Expo 2020, to ensure waste is collected and recycled, supporting the Expo’s waste diversion targets. Mastercard Mastercard, Expo 2020's official payment technology partner, has created an add-on feature to Expo 2020 tickets, which allows visitors to donate to Mastercard's Priceless Planet Coalition. Expo 2020 highlights the urgent need to embrace sustainability, which can be observed through the efforts made by the organizers and partners to change their practices to create a more sustainable future. Partner companies have come a long way to achieving their goals in terms of reducing greenhouse emissions, curbing their water consumption, using renewable energies, and recycling their waste. Some had more noticeable successes than others, such as SAP, Accenture, and Cisco, while others are still on the way. Expo 2020 partners, including Siemens, Emirates, PepsiCo, MasterCard, and DP World have also contributed to a more sustainable expo, emphasizing the significance of sustainability to all Expo visitors. Khawla Khrifi - Business Research Analyst Sources: Expo 2020 and Environmental Sustainability

US bank branches could become extinct by 2034 if current branch closure plans don’t change, according to a study published by Self Financial. This past decade has seen the progressive closure of physical banks and the global pandemic seems to have accelerated this trend worldwide. In the UK, over 4,300 branches closed since 2015, representing a 44% decrease. Northern European and Baltic countries recorded some of the biggest declines in the number of bank branches per 100,000 adults in the last few years. A well-known example for this is Danske bank which decided to close down all banking activities in Estonia, Latvia, Lithuania, and Russia; in addition to closing 50 branches in Northern Ireland. The United States had 83,060 branches in 2012, but just 77,647 in 2018 – a loss of 5,413 branches, or 6.5%, according to Self's figures. Are these closures really significant, and who would get hit the hardest if physical banking were to become extinct? Branch closures worldwide If major banks like Citigroup Inc. and Bank of America Corp. were greatly affected during the 2008 crisis and closed/sold more than 1,500 branches since 2009, regional banks have only seen an impact on their physical footprint more recently with the rise of internet banking and fewer people visiting branches. Examples of regional banks include Capital One Financial Corp. slashing 32% of its branches between mid-2012 and mid-2017, SunTrust Banks Inc. 22% and Regions Financial Corp. 12%. On the other hand, major banks reported similar numbers such as Citigroup closing 32% and BOA 17% during the same period even though they’ve had a head start over regional banks for several years. During the pandemic, Banco Sabadell was the first to act in Spain, announcing the loss of 1,800 jobs on the same day that its merger discussions with BBVA failed in November 2020. Later, Santander announced the loss of 3,572 employees and the closure of 1,033 branches in Spain by December 2020. Also, BBVA reportedly planned 3,798 layoffs and the closure of 530 locations. A one-day strike by employees in June caused them to amend their decision to only 2,935 layoffs and 480 branch closures. In April, CaixaBank planned 8,291 job layoffs and 1,534 branch closures; however, after discussions with unions, the bank agreed to 6,452 job layoffs and the closure of 1,500 branches. Commerzbank, Germany's second-biggest bank by assets, will exit Hong Kong, Luxembourg, and Hungary, as well as close branches in Bratislava, Slovakia, Barcelona, and Brussels. According to Bloomberg, the number of global correspondent banks would be reduced from 1,600 to around 1,300 with more than 80% of headcount reductions set to be completed by the end of 2023. Deutsche Bank will close 150 branches this year, with a further 50 Postbank branches going in 2022, costing more than 1,200 jobs. Deutsche Bank’s branch closures are part of a plan announced in 2019 to cut 18,000 positions, or one-fifth of the company's worldwide staff, and spend €13 billion on new technologies over the following four years. Reasons behind branch closures . Banks are shutting branches to save costs Opening a new branch costs a bank millions of dollars, on average $2-4 million. Then they pay $200,000-400,000 each year to run it, especially in high-cost cities. Therefore, it might take years for a branch to achieve its potential profit. In the UK for example, each client visiting a branch on a regular basis may cost banks up to £118,000 per year in some branches. Also, according to a report published by Bain & Co. in 2016, a mobile banking transaction costs around 10 cents, whereas connecting with a bank teller costs about $4. Bain also stated that the 25 largest U.S. banks could save more than $11 billion a year if they decreased their branch count per capita. Commerzbank is planning on saving €1.4 billion by 2024 with the closure of 340 branches and the elimination of about 10,000 jobs, according to their "Strategy 2024”. . Customers’ increasing reliance on online banking As reported by the American Bankers Association (ABA), 71% of Americans prefer online or mobile banking business to brick and mortar. Also, 39% of customers now report using mobile apps as the primary source for banking, a 3% increase from pre-COVID levels. BBVA reported a 48% drop in in-person transactions and a 115% increase in the use of its digital channels in the first half of 2021. Also, according to YouGov, most bank customers (up to 84%) use internet banking monthly in the UK, while only 25% still visit branches once a month. Disadvantages of branch closures However, banks should also consider that they will alienate some customers when they shut down physical locations, especially since many customers face difficulties using technologies like mobile and online banking. . Disabled and elderly customers suffering Statistics show that physical bank branches are mostly visited by older, retired people. Almost a third (32%) are over the age of 65, and 33% are retired. Their seeming inability to use digital banking is not due to a lack of access as nearly all (93%) own a smartphone, and 75% own a laptop. It appears to be due to either a lack of understanding or a lack of faith in the technology. Additionally, a survey conducted by consumer group “Which?” stated that 41% of disabled consumers said the closures had a negative impact on their ability to access bank services, with more than half (54%) of NatWest customers and nearly 58% of Barclays customers agreeing. Additionally, one in five also struggled with the security measures needed which is a serious issue for those with memory problems, as 30% of them indicated security measures were a difficulty for them. According to the same study, even branches that remain open lack complete accessibility for customers with disabilities, specifically, 34% mentioned they found it difficult to use branch services in the UK. . Cost of closures Branch closures are likely to lose customers for banks, not only employees. According to the Bain & Co. report, the likelihood of a U.S. consumer switching banks rises 14% when that consumer is affected by a branch closure. When a branch closes, the nearest alternative branches are typically much farther away. Hence, customers who can't or don't want to drive must rely on local transport services in rural areas. Also, when banks decide on the closure of a branch they also decide for the reduction of the workforce, which isn’t as cheap as it sounds. Studies show that Commerzbank’s 10,000 job cuts which are caused by branch closures will cost the bank around 160,000 euros each in severance. In conclusion, branch closures might be a very suitable solution for banks to reduce costs and impress shareholders. However, they should keep in mind that some customers (even if just a minority) still rely on physical branches and will end up with no access to banking services if banks did not put their vulnerable state into consideration. Mariam Elmaghraby – Research Analyst Sources: https://www.self.inc/info/the-death-of-the-banks/#historical-banking-trends https://www.thebanker.com/Editor-s-Blog/Is-this-the-beginning-of-the-end-for-bank-branches https://danskebank.com/news-and-insights/news-archive/company-announcements/2019/ca19022019 https://www.irishnews.com/business/2021/07/10/news/danske-bank-set-to-close-50th-branch-since-2010-this-year-2382147/ https://www.spglobal.com/marketintelligence/en/news-insights/latest-news-headlines/spanish-banks-look-to-leaner-future-as-cost-cutting-plans-survive-union-pushback-66008050 https://www.macaubusiness.com/spanish-bank-sabadell-to-cut-1800-jobs-union/?__cf_chl_managed_tk__=pmd_GW9QU41YJKTOMT9fAedi9eb6duXtDmztKulhCy8AQH8-1633335135-0-gqNtZGzNAyWjcnBszRS9 https://inews.co.uk/inews-lifestyle/money/saving-and-banking/banks-failing-disabled-customers-amid-branch-closures-1121783 https://citymonitor.ai/economy/bank-branches-are-closing-and-theyre-leaving-the-most-disadvantaged-areas-behind https://www.thetimes.co.uk/article/why-banks-are-closing-their-high-street-branches-zzkh2hdc0 https://yougov.co.uk/topics/finance/articles-reports/2019/02/04/how-much-will-closure-bank-branches-affect-custome https://www.spglobal.com/marketintelligence/en/news-insights/latest-news-headlines/commerzbank-to-trim-global-ops-shutter-branches-8211-bloomberg-62916382 https://thefinancialbrand.com/71090/branch-networks-retail-experience-mobile-first-banking/ https://www.finextra.com/newsarticle/37958/deutsche-bank-to-close-branches-move-to-hybrid-working-model https://www.bankingdive.com/news/challenger-branches-extinct-by-2034/596885/ https://www.wsj.com/articles/banks-double-down-on-branch-cutbacks-1517826601 https://www.which.co.uk/money/banking/switching-your-bank/bank-branch-closures-is-your-local-bank-closing-a28n44c8z0h5 https://arca.com/resources/blog/cutting-branches-to-cut-costs-does-it-work https://www.newsobserver.com/news/business/article119764788.html https://thefinancialbrand.com/107582/garret-online-mobile-banking-adoption-rates-covid/ https://www.yourmoney.com/saving-banking/disabled-customers-suffer-as-bank-branches-close/ https://www.bloombergquint.com/onweb/deutsche-bank-targets-450-jobs-in-first-round-of-branch-closures https://ncrc.org/research-brief-bank-branch-closure-update-2017-2020/

. COVID-19 Vaccines and the Nocebo Effect Ever since Covid-19 vaccines were approved in December 2020 (if not before) public opinion has been strongly polarised between supporters of the life-saving drug (which include the vast majority of the medical and scientific communities) and skeptics. While most of the skeptical positions regarding the need or efficacy of the vaccine can be traced back to a misunderstanding of epidemiology and public health, misinformation, or even political bias, the conversation surrounding the vaccine’s side effects is more complex. For one, vaccines actually have officially recognised and common side effects. These are the now-ubiquitous headaches, fever, body aches, nausea, and general tiredness that we’ve come to know. However, as vaccination rates grow beyond high levels (>70%) more cases of rare severe side effects (such as an allergic reaction) will emerge. This is not because vaccines are more dangerous than initially estimated, or because of some nefarious governmental conspiracy, but because of a “paradox effect” where the absolute number of severe side effects increases because of the growth of the vaccinated population. In this case, correlation really is not a causation. This issue, especially when it encounters a hypercharged media environment, can cause quite a headache for governments who are trying to anticipate public anxiety and encourage people to take the vaccine. This was the case last March when viral-vector-based vaccines, like the Oxford-AstraZeneca and Johnson & Johnson vaccine, became temporarily associated with rare, but dangerous and even fatal blood clots. Countries were too fast to react, with some completely banning these vaccines, or restricting them to the 60+ population. Further investigation showed that the cases of blood clots were in fact consistent with rates in the general population, and the vaccination campaign has resumed. However, the structural growth of side effects (whether they be real or only correlated) is a major factor contributing to vaccine hesitancy worldwide. What’s worse is that social apprehension surrounding vaccination may even be inducing adverse effects unrelated to the chemical properties of the drug. For example, the following phenomenon occurred in vaccination centers in the US: cases of “fainting, excessive sweating, nausea, and vomiting” were reported in vaccination centers across the country, after individuals received their dose of the Johnson & Johnson vaccine. The CDC noted that for most individuals, fainting, nausea, etc. were indeed anxiety-induced events. Why do individuals experience such effects after receiving the new COVID-19 vaccine? The answer lies in the phenomena known as the placebo and nocebo effects. What is a Placebo or Nocebo Effect? The previously mentioned (indirect) effects of the COVID-19 vaccine on individuals, causing dizziness, fainting, nausea, etc. is a clear example of an altered nocebo effect. Literature defines the classic nocebo as “a substance without medical effects but which worsens the health status of the person taking it by the negative beliefs and expectations of the patient”. For example, as proven in many experiments, patients are given a sugar pill as a treatment for a certain condition and are told to expect side effects such as nausea, drowsiness, or pain. Although they are merely given a sugar pill, patients still reported experiencing such side effects. It’s easy to understand how powerful this effect can be for a treatment like the COVID-19 vaccine, which has been the source of daily discussions and media coverage for the better part of a year. On the other hand, a placebo is the exact opposite of a nocebo. Defined as “a substance without medical effects, which benefits the health status because of the patient's belief that the substance is effective”. Like a nocebo, a placebo sees patients experiencing a clear improvement of symptoms and general advancement of wellbeing. In conclusion, whether interlinked with positive or negative health outcomes or experiences for individuals, both effects are the result of psychological and physical reactions to non-active ingredients and most often occur due to expectations, conditioning, idea framing, and individual psychological state. Clinical Management and Reversing (or Fortifying) of Both Effects The question remains as to how both effects can be clinically managed, or if they even should. Recent research and experiments, especially regarding the nocebo effect, highlight the importance of managing patient expectations, providing a comprehensive overview of the treatment plan, clearly discussing possible side effects as well as double-checking with each patient on an individual level if all parameters associated with the treatment are understood and accepted. Additionally, the method of “counterconditioning” has also been proven to be highly effective in the case of nocebo effects. By “turning previously negative learned associations into positive ones”, nocebo effects can be drastically reduced and even converted into a (sometimes) useful placebo effect. By definition, a nocebo effect is always undesirable as it produces negative effects in a patient. It is not always possible to completely reduce or prevent nocebo effects, however, they can be countered by combating false rumors of unfounded side effects, and improving effective communication between doctor and patient, etc. On the other hand, placebos pose a slightly different type of problem as they produce effects that to a certain extent can be beneficial to patients. In fact, a placebo effect may even be desirable if it occurs within the context of an appropriate treatment since it reinforces the positive outcome. On the other hand, a placebo is dangerous when it occurs within the context of inappropriate treatment and it only provides the illusion of an improvement convincing the patient to insist on an ineffective or even dangerous therapy and to ignore better ones. Placebos therefore should be carefully examined and managed, following a “Minimize, Maximize, and Personalize” approach. Research indicates that during clinical trials, the placebo effect should be minimized as far as possible to correctly evaluate the efficacy and success rates of a drug still in the clinical research phase. However, once a drug is approved, physicians should aim to maximize placebo effects by managing patient expectations. This can be optimally achieved by personalizing care to a patient's genetic predispositions, personal preferences, personality, and medical history. In sum, both effects are very common globally, and the COVID-19 pandemic has exacerbated them tremendously. In this period of public health crisis, policymakers face the double task of suppressing nocebo effects which undermine national vaccination campaigns while at the same time also contrasting placebo effects associated with alternative and unproven Covid treatments (such as hydroxychloroquine, ivermectin, or homeopathic remedies) which may even be dangerous to individuals or prevent them from seeking proven medical help. In both cases, the only instrument is transparent and coherent communication especially from physicians which aims at educating the public on these phenomena. Now more than ever public relations play a fundamental role that directly affects our wellbeing, determining even whether we may get a headache or not. Sources Information and Data: https://www.frontiersin.org/articles/10.3389/fphar.2020.581840/full https://clinicaltrials.gov/ct2/show/NCT04325893 https://jamanetwork.com/journals/jama/fullarticle/2774382 https://pubmed.ncbi.nlm.nih.gov/23449306/ https://pubmed.ncbi.nlm.nih.gov/29119079/ https://journals.lww.com/painrpts/Fulltext/2019/06000/How_to_prevent,_minimize,_or_extinguish_nocebo.23.aspx https://www.healthline.com/health/placebo-effect#the-psychology https://www.healthline.com/health/placebo-effect#real-examples https://www.healthline.com/health/placebo-effect#what-we-dont-know https://www.healthline.com/health/placebo-effect#takeaway https://www.webmd.com/pain-management/what-is-the-placebo-effect https://www.healthline.com/health/placebo-effect https://www.frontiersin.org/articles/10.3389/fpsyt.2020.00801/full https://www.karger.com/Article/FullText/490354 https://www.webmd.com/balance/features/is-the-nocebo-effect-hurting-your-health https://www.nejm.org/doi/pdf/10.1056/NEJMra1907805 https://www.nejm.org/doi/full/10.1056/NEJMra1907805 https://pubmed.ncbi.nlm.nih.gov/24909245/ https://www.foxnews.com/health/anxiety-fainting-johnson-johnson-covid-19-vaccination-cdc-warns https://www.nature.com/articles/d41586-020-03441-8 https://www.who.int/news/item/31-12-2020-who-issues-its-first-emergency-use-validation-for-a-covid-19-vaccine-and-emphasizes-need-for-equitable-global-access https://www.fda.gov/news-events/press-announcements/fda-takes-key-action-fight-against-covid-19-issuing-emergency-use-authorization-first-covid-19 https://jamanetwork.com/journals/jama-health-forum/fullarticle/2779081 https://www.kent.ac.uk/news/science/28135/explainer-why-do-covid-19-vaccines-cause-side-effects https://www.linkedin.com/pulse/35-vaccinations-second-nocebo-effect-rich-parker https://pubmed.ncbi.nlm.nih.gov/33682603/ https://www.euronews.com/next/2021/05/27/why-are-aztrazeneca-and-j-j-vaccines-causing-blood-clots-scientists-claim-they-have-the-an

It is evident that consulting companies are increasingly putting more emphasis on research and knowledge teams and functions. However, how firms choose to expand, organize and structure these teams varies significantly. In the last 5 years, the R&K teams in most strategy consulting firms have grown in absolute numbers, with McKinsey and BCG having by far the largest R&K teams among the top tier consulting firms. R&K teams can be classified into 2 main functions, either Research or Knowledge. Researchers are dedicated to increasing the knowledge of an organization, by supporting consulting projects, proposals, and other initiatives with freshly gathered data and added-value insights generation. As for Knowledge teams, they are devoted to capitalizing on the knowledge already existing within an organization, by sharing it and making it available to the right person at the right time. When it comes to the type of profiles within these teams, R&K professionals are classified into analysts or librarians based on the experience or background of these professionals. We have primarily examined the education and years of experience in the current position as indicators of whether these profiles are librarians or analysts. Librarians typically hold degrees in library science, linguistics, or literature while analysts usually have a background in business or economics. In terms of years of experience in the current job, librarians tend to spend considerably more time at their positions than analysts. We have therefore classified professionals who have spent 5 or more years within their positions as librarians. Based on our study, we can conclude that business research professionals outnumber knowledge experts in most companies - with McKinsey having the highest number of research professionals among the companies benchmarked. Meanwhile, BCG exceptionally places a strong emphasis on knowledge which is less pronounced in other firms such as Roland Berger and Kearney. In terms of profiles, McKinsey and BCG are increasingly extending the roles of R&K and relying on analysts for more value-added research while Bain, Oliver Wyman, and (to a lesser degree) Kearney have retained more traditional librarian profiles, primarily focused on gathering and organizing data and research. Moreover, the study also dedicates a section for the analysis of the Big Four. This is because, despite being historically focused on the fields of accounting, tax, and legal, they are expanding more and more their presence in the strategy consulting area. Booz Allen Hamilton has been analyzed along with the Big four, as a large share of its activity is not strictly strategy consulting Within the Big Four, EY and Deloitte have the largest R&K teams followed by PWC. KPMG and Booz Allen Hamilton have significantly smaller R&K teams. Also, EY and Deloitte have balanced teams of research and knowledge professionals, while PWC and KPMG make a significant investment in Research capabilities compared to Knowledge. Remarkably, there are more librarians in the big 4 than in strategy consultancies, potentially demonstrating a more traditional approach to research. The knowledge function has more librarian profiles than the research function. The Big Four also choose to locate their R&K teams similarly to strategy consulting, with the USA, India, and Western Europe being the most popular choices. The Infomineo Research and Knowledge benchmark examines and compares how consulting firms are organizing their knowledge and research functions internally, and where they've chosen to locate them globally. The findings and the figures reported in this study are the results of the screening and the analysis performed on ~4,000 LinkedIn profiles.

The 21st century has witnessed major efforts by industries all around the globe to seize new technological capabilities to improve personal lives, corporate dynamics, and industrial processes. In an era of severe climate change crises, new technologies and industrial philosophies are becoming more and more essential. In this context, green architecture emerged as a solution to conserve nature and initiated the transformation of the real estate industry. “At the turn of the 21st century, a building’s environmental integrity as seen in the way it was designed and how it operated, became an important factor in how it was evaluated.” What is Green Architecture Green architecture is an eco-conscious approach that advocates for the preservation of nature in designing, constructing, and operating buildings. In green architecture, the architect adopts a design philosophy that considers the environmental impact of all aspects of the project. A green building or community is one that takes into account the efficiency and sustainability of energy resources, the preservation of water and air resources, waste reduction, and the adaptability of materials to a changing environment. Green architecture does not only aim to limit or eliminate the negative impact that construction activity has on the environment, but to have a positive effect on the people and nature through environmentally conscious designs, practices, building materials, and the use of the latest technologies. Why Green Architecture? Construction harms the environment in several ways: high energy consumption, generation of waste, high direct CO2 emissions compounded by deforestation, and water and air pollution. From architectural design to operations, a construction project contributes to climate change, disrupts wildlife, and consumes a lot of resources. The United Nations Environment Program reported that the “buildings and construction sector accounted for 36% of final energy use and 39% of energy and process-related carbon dioxide (CO2) emissions in 2018, 11% of which resulted from manufacturing building materials and products such as steel, cement, and glass. And according to research and statistics, in 2018 the worldwide emissions from buildings rose to 9.7 gigatonnes of carbon dioxide (GtCO2).” The Rise of Green Architecture and Technologies The green architecture was founded in 1969 by Ian McHarg who theorized a holistic approach to transform the way buildings and communities are designed, built, and operated. His most important contribution are detailed in his book “Design with Nature” where he outlined the process of living harmonically with nature by applying a “landscape suitability analysis”. His principles of regional ecological planning explain the importance of assessing the health of a region, its ecological constraints, and accordingly where and how construction should take place to live in harmony with nature. In 1994, the U.S Green Building Council formalized McHarg’s principles establishing the Leadership in Energy and Environmental Design standards (LEED). The LEED standards were made to provide measurable guidance and framework for the design and construction of environmentally responsible, highly efficient, and cost-saving green architecture projects and green buildings. The standards mainly focus on sustainable site development, water savings, energy efficiency, material selection, and indoor environmental quality and are updated frequently. The Green Building Council also tackles awareness, education, innovation, and design of sustainable development. Green architecture was founded in 1969 by Ian McHarg who theorized a holistic approach to transform the way buildings and communities are designed, built, and operated. His most important contribution are detailed in his book “Design with Nature” where he outlined the process of living harmonically with nature by applying a “landscape suitability analysis”. His principles of regional ecological planning explain the importance of assessing the health of a region, its ecological constraints, and accordingly where and how construction should take place to live in harmony with nature. Simultaneously, the advancements in environmental technology and different fields of hydrogeology, geology, biochemistry, and nature-cybernetics have encouraged the goals of sustainable city planning and green architecture. Technology in the 21st century creates the opportunity for a different approach to architecture and design that embraces the environment. Green Architecture Technologies Green walls and vertical gardens along with green roofs are all hallmarks of green buildings that help minimize heating and cooling costs, prevent storm-water runoff, filter out pollutants, and accordingly reduce energy use and cost. Solar power, in addition to hydropower and wind power, is very often used as renewable energy resources for heat and electricity so that any residential or commercial building is able not only to fulfill its own needs but to generate and store electricity. Recycling and waste reduction are also features of major importance in green architecture. Recent smart city projects are trying to blend green infrastructure with internal smart home solutions and seize technological tools to improve sustainability. Smart appliances are being used to minimize energy consumption aiming at establishing net-zero energy in residential and commercial buildings. Net-zero energy buildings rely only on the energy produced onsite from renewable resources through a combination of energy efficiency and renewable energy generation. Green water technologies are also being used along with different irrigation technologies to enhance the quality of water for irrigation and the ecosystem overall. Other water technologies and techniques include dual plumbing systems, the re-use of water, and harvesting rainwater to minimize the consumption of traditional freshwater resources. Sustainable design is based on energy-minimizing strategies as designing windows that constantly reflect daylight, the use of low emitting materials, and the use of smart glass to save a lot on heating, ventilation, and air conditioning costs. In addition, the design also considers the materials used internally and externally to ensure the health and safety of people with regard to carcinogenic elements or toxic materials. Green Architecture around the Globe: Several countries have initiated green building investment projects around the world to meet the Paris Agreement and Sustainable Development Goals (SDGs) for 2030. As of 2015, several countries have already incorporated Green buildings in their master plans. Singapore is one of the earliest countries in Asia to incentivize and initiate green architecture projects. In 2009, the Singapore Green Building Council was established to encourage green architecture and to encourage private-public partnerships. “Singapore is the only country that makes it mandatory for any building of 5,000 square meters to achieve minimum standards as per the code for environmental sustainability,” says Mayank Kaushal, an architect, senior sustainability consultant, and researcher with Future Cities Laboratory. The Parkroyal on Pickering hotel in Singapore designed and completed in 2013 is a prime example of this philosophy in action featuring 161,459 square feet of sky gardens, waterfalls, and planter walls. The hotel incorporates different technologies including solar power grids, rain sensors, and water and light saving tools. The project was designed and completed by WOHA, and the project won Interior Design’s 2013 Best of Year Award for Hotel Common Space. Several countries around the globe have been either developing or planning on going green as well including Canada, Germany, Guatemala, U.S.A, Australia, China, Denmark, Italy, India, Japan, Mexico, Netherlands, U.K, U.A.E, Egypt, South Africa. However, each country may pursue green architecture and sustainable development differently according to its resources and climate. Challenges and Conclusions Green building practices are gaining more acceptance in the construction and real estate industries as a viable solution to becoming environmentally sustainable. Yet green architecture was founded more than 50 years ago, and its uptake hasn’t been progressing as one would expect. Adopting sustainable development and green architecture practices remains challenging for several reasons. Compared to conventional methods, the capital and additional costs needed constitute the major challenge to even consider going green especially for developing countries. The materials and equipment used in the construction of green buildings are expensive as are the technologies needed for energy efficiency and generation. But more recent research shows that: “investments can be recouped through operational cost savings and, with the right design features, create a more productive workplace.” However, the cost is not the sole challenge, other major obstacles include the lack of expertise and skilled manpower, the lack of awareness and environmental education, minimal adoption incentives, and the lack of laws and policies. More importantly, the lack of dedicated research and development is a major issue. And while the main purpose of adopting green architecture is nature-driven, the indirect effects this new approach can have on society is revolutionary. Adopting sustainable development in fact stimulates environmental awareness, technical and scientific research, new skills in the workforce, and efficient industrial practices. The future is ours to lose. References Bold Business, Building Green, 2019. https://www.boldbusiness.com/infrastructure/green-construction-environmental-impact/ Inso Architectural Solutions, Green Architecture Vs. Sustainable Architecture in South Africa, 2021. https://www.inso.co.za/blog/green-architecture-vs-sustainable-architecture-in-south-africa/ World Green Building Council, How Green Building is Facilitating Rapid Sustainable Growth in Africa, 2021. https://www.worldgbc.org/news-media/how-green-building-facilitating-rapid-sustainable-growth-africa DNA Barcelona, DNA Unveils a Futuristic Eco-Building for Singapore, 2020. https://www.dna-barcelona.com/dna-unveils-a-futuristic-eco-building-for-singapore/ TessilBrenta Nonwovens Technology, Green Roofs and Terraces, 2021. https://www.tessilbrenta.com/en/ecotess#roofs EliteTraveler, Futuristic Target Tower to be Built in Singapore, 2021. https://www.elitetraveler.com/design-culture/architecture-interiors/futuristic-garden-tower-to-be-built-in-singapore High Speed Training, Pollution from Construction, 2019. https://www.highspeedtraining.co.uk/hub/pollution-from-construction/ IEREK, Green Buildings and its Benefits in Smart Cities, 2017. https://www.ierek.com/news/index.php/2017/08/01/smart-cities/ Conserve Energy Future, Green Construction, 2021. https://www.conserve-energy-future.com/top-sustainable-construction-technologies-used-green-construction.php CNN, Green buildings: 18 examples of sustainable architecture around the world, 2020. https://edition.cnn.com/style/article/green-buildings-world-sustainable-design/index.html BGP, Green Buildings South Africa, 2021. https://bhejaneprojects.co.za/green-building-south-africa/ Daniels, T. 2019. McHarg’s theory and practice of regional ecological planning: retrospect and prospect https://www.researchgate.net/publication/335080769_McHarg's_theory_and_practice_of_regional_ecological_planning_retrospect_and_prospect Britannica, The Rise of Eco-Awareness, 2021. https://www.britannica.com/art/green-architecture/Principles-of-building-green United Nations Environment Program, 2019 Global Status Report for Buildings and Construction Sector. https://www.unep.org/resources/publication/2019-global-status-report-buildings-and-construction-sector U.S Green Building Council, Vision, 2021. https://www.usgbc.org/articles?Channels=%5B%22Industry%22%5D Britannica, The Rise of Eco-Awareness, 2021. https://www.britannica.com/art/green-architecture/Principles-of-building-green Conserve Energy Future, Green Construction, 2021. https://www.conserve-energy-future.com/top-sustainable-construction-technologies-used-green-construction.php Interior Design, 8 Sustainably Designed and Architecturally Significant Buildings in Singapore, 2019, https://www.interiordesign.net/articles/16140-8-sustainably-designed-and-architecturally-significant-buildings-in-singapore/ World Green Building Council, The Business Case for Green Building: A Review of the Costs and Benefits for Developers, Investors and Occupants, 2021. https://www.worldgbc.org/news-media/business-case-green-building-review-costs-and-benefits-developers-investors-and-occupants

In recent years, Big Tech companies’ interest in the healthcare industry has strengthened. The global pandemic accelerated Big Tech’s march into a sector experiencing a digital revolution and generating an ocean of data. Today, after making vast fortunes from processing data, these companies are orienting their expertise to healthcare and are very keen to offer their services to overwhelmed healthcare systems. The current state of healthcare The rise in the number of wearable sensors, the digitization of patient records and expansion of virtual healthcare services formed digital biomarkers, this type of biomarkers is expected to have the biggest impact on medicine because of the vast amount of data it’s creating. Benefiting from computing power and expertise in data analytics, Big Tech is entering a $3.6 trillion market in the U.S. just by utilizing the same tools that have allowed them to disrupt other industries. GAMA’s interest in healthcare Accelerated by the Covid-19 pandemic, the digitization of healthcare fueled investors interest in digital health companies raising a record $14.8 billion in VC funding in 2020 and amplified big 4 tech firms’ collaboration with healthcare industry and support of startups and new innovations. The chart below showcases the considerable interest in Telemedicine which increased by 140% compared to 2019. At the same time, Big Tech companies are accelerating their presence in the healthcare market with different strategies. Below, we break down the tools and efforts of these players to disrupt healthcare. Amazon Amazon launched a health care service called ‘Amazon Care’ for its own employees allowing them and their families to get in touch with health care providers within a minute of their requests. Amazon is also leveraging its delivery capabilities to make headway into the medical supplies’ distribution space. Microsoft In 2021, Microsoft announced that it had struck a $19.7 billion agreement to purchase Nuance Communications. This company’s technology is used by almost 80% of hospitals in the US and helps automate the process of taking notes during patient consultations, reducing the time doctors spend on administrative work. Apple Apple enables the collection of healthcare data via apps and wearable tech through the Apple Watch. The company has teamed up with various institutions to establish the clinical accuracy of Apple Watch features. One of the most recent ones showed that the cardiac metrics it monitors is as good as clinical tests. The results suggest that the Apple Watch could be adequate for remote monitoring of elderly patients with cardiovascular disease. Google (Alphabet) Google uses artificial intelligence to read electronic health records and then try to predict or identify medical conditions. The company uses machine learning to analyze a vast array of health records collected by hospitals and other medical institutions. The matrix below showcases Big tech companies’ strengths, weaknesses, opportunities, and threats in the healthcare industry. Challenges in Digital Healthcare Infrastructure As the virus spread and safety concerns grew, virtual interactions became a necessity exposing weaknesses in healthcare infrastructure. Healthcare systems around the world have been quite slow in using modern technology to revolutionize their sector as revealed by a study conducted by OECD on 23 countries. The study indicates that many members of OECD have a high proportion of digitized health data but only a small percentage of them are regularly linked with other sources of information making vast quantity of data redundant. In other words, Big Tech companies need to assemble and link datasets to give insights and identify patterns and trends. However, digitization of healthcare systems around the world is slowed by the technological readiness of some countries and lagging of regulatory legislation. Privacy Evidently, governments play a crucial role in facilitating Big Tech’s entry in healthcare especially allowing access to patients digitized health records, a very sensitive subject considering tech companies’ spotty track record regarding privacy and use of personal data. A survey conducted by Rock Health shows that patient’s willingness to share health data, with technology companies is predictably low with only 11% of respondents willing to do so. By contrast, patients were more willing to trust their doctor as the study indicates that 72% of patients are willing to share health data with their physician. This is not happenstance, Apple’s and Google’s previous mishandling of user data is slowing their progress in healthcare markets as they need to rebuild their public image before gaining patient’s trust back. Outlook of Digital Health market Big Tech giants are targeting a growing market armed with $500 billion in cash giving them a substantial force for disruption. A Roland Berger forecast predicts an estimated 24.7% CAGR in the global digital health market reaching $657 billion in 2025. As tech companies move into healthcare, it is necessary for legacy players such as hospitals and pharmacies to adapt their strategies and embrace new technology like telehealth and remote patient monitoring tools. Products and solutions from tech companies will increasingly become more distributed and sophisticated as the quality and volume of data improves. It goes without saying that the future of healthcare will be told outside the hospital. In a future where healthcare is embedded into all aspects of everyday life, it will be crucial for Big Tech to win over consumer trust with their solutions and digital advances to make primary health care more convenient, accessible, and helpful to the general population. Sources Google to Store and Analyze Millions of Health Records https://www.spglobal.com/marketintelligence/en/news-insights/latest-news-headlines/big-tech-to-continue-healthcare-push-in-2021-with-500b-in-capital-to-deploy-61583319 https://www.investorschronicle.co.uk/ideas/2021/04/15/ideas-farm-is-a-big-tech-healthcare-revolution-on-its-way/ https://resultshealthcare.com/wp-content/uploads/2021/01/Big-Tech-in-Healthcare-Results-Healthcare.pdf https://medicalfuturist.com/tech-giants-in-healthcare-2021/ https://www.pharmiweb.com/article/the-influence-of-big-tech-on-healthcare https://newrepublic.com/article/162553/amazon-care-pharmacy-big-tech-universal-healthcare https://www.globalxetfs.com/introducing-the-global-x-telemedicine-digital-health-etf-edoc/ https://www.businessinsider.com/2-21-2021-big-tech-in-healthcare-reporthttps://www.oecd-ilibrary.org/docserver/55d24b5d-en.pdf?expires=1623542895&id=id&accname=guest&checksum=D3993356186104EECFED54092A2764D9

On the 2nd of December 2020, the Commission on Narcotic Drugs (CND), the UN's main decision-making body on drug control, removed cannabis from its list of most dangerous drugs, which includes heroin and synthetic opioids. Cannabis is subject to the 1961 Single Convention on Narcotic Drugs and was, until December 2020, included in a category allowing it to be banned because of its "particularly dangerous properties". This amendment was based on a recommendation by the World Health Organization (WHO). In fact, in January 2019, the WHO unveiled six recommendations for the inclusion of cannabis in the UN drug control treaties. Among the many points made by the Organization, it has been clarified that cannabidiol (CBD), a non-toxic compound, is not subject to international controls and it has, in fact, become a prominent part of wellness therapies in recent years, sparking a billion-dollar industry. The decision made by the WHO was supported by 27 countries against 25. The decision is not in favor of a legalization of cannabis worldwide, which remains among the "highly addictive and liable to abuse substances”. However, it implies that its production and marketing remain reserved for scientific and medical use under international law. According to this decision, Morocco has raised the issue at the Government Council level. In fact, the Ministry of Interior has drafted a law on the legalization of Cannabis for medical use, in order to regulate the activities related to the cultivation of cannabis, its production, manufacture, transport, marketing, export, and import for medical and therapeutic purposes, subject to authorizations issued exclusively by a specialized agency. What is the composition of the Cannabis Plant? Cannabis is a type of hemp, which is a plant used in the yarn industry. As for its composition, the most important part of the plant is its “flower”, it is responsible for producing the so-called “Resin”, this material contains 2 molecules, “THC” and “CBD”. THC contributes to altering the consumer's state of consciousness making them “high”. It is also used for anesthesia purposes as in the case of cancer patients undergoing chemotherapy. Meanwhile, CBD does not have the same purpose. In addition to its sedative effect, it works against THC to limit its properties, particularly by calming the nervous system. CBD has major therapeutic virtues, according to the U.S. National Centre for Biotechnology Information (NCBI), such as anti-inflammatory properties, it alleviates anxiety and depression, it can calm the symptoms of epilepsy, and it can even contrast certain psychotic disorders (such as schizophrenia), etc.…. Studies conducted by NCBI even suggest that at high concentrations, CBD inhibits the proliferation of tumor cells from certain cancers and that it could reduce the risk of necrosis of the arteries after a heart attack. That’s why the debate about the advantages and disadvantages of Cannabis has risen again, and some countries have realized that maybe they are missing out on the benefits of this plant and its potential for both healthcare and the economy. Cannabis, what is the potential for the Moroccan economy? Globally, according to the report released in 2019 by New Frontier Data on the global cannabis industry, the global total addressable cannabis market (regulated and illicit) is estimated at USD 344 billion in the top five regional markets: Asia ($132.9 billion), North America ($85.6 billion), Europe ($68.5 billion), Africa ($37.3 billion) and Latin America ($9.8 billion). On the other hand, the global legal marijuana market size according to a recent research study by Precedence Research was valued at USD 17.5 billion in 2019 and predicted to reach a market value around USD 65.1 billion by 2027 expanding at a compound annual growth rate (CAGR) of around 17.8% during the period 2020 to 2027. A report has been published as a result of a study conducted in Morocco in 2003 -2004 by the United Nations. According to this report, the area dedicated to the cultivation of cannabis in Morocco was estimated at 134,000 ha in 2003 with a turnover of USD 15 billion in 2003 and 13 billion in 2004. At that time, the total Moroccan production was estimated at 98,000 tons and its conversion into resin (hashish) at about 2,760 tons, with almost half of it originating from the region surrounding Chefchaouen. However, these numbers have been reduced drastically thanks to the "cannabis-free provinces" campaign that Morocco conducted in 2007. As a matter of fact, the area cultivated for cannabis resin in Morocco amounted to 47,000 ha in 2017 for only 1,147 ha destroyed (2.4%), according to the United Nations Office on Drugs and Crime (UNODC). With this area, the Kingdom would have an estimated open air production around 38,000 tons, and 760 tons from indoor production. Morocco thus, retains its position as the world's largest producer of cannabis resin with a market value of USD 9 Billion in 2017. The illegal market takes the lead over the legal one, of course. As stated above, the total global market is valued at USD 344 billion in 2019, of which only USD 17.5 billion is legal. Therefore, the illegal market is valued at USD 326.5 billion. Even if the legal market is very limited, the study by Precedence Research predicts an expansion at 17.8% CAGR and a total value of USD 65.1 Billion in 2027. Morocco will be in a prime position to exploit this legal market if more widespread legalization occurs. What would be the legal frame of Cannabis legalization? The country acknowledges that legalization should have clear rules to regulate the cultivation and production of Cannabis. In fact, last February the Ministry of Interior presented a draft law on the legalization of Cannabis for medical use which was adopted by the House of Representatives in May. The proposed law contains 56 articles, a third of which establishes clear rules to regulate this activity which will be conditioned by an authorization granted by a national agency that will be created for this specific purpose. The law covers cultivation, production, exploitation, export/import of seeds and plants, processing, transportation, marketing, and the export of final products. The authorizations would be granted only in areas indicated in a dedicated decree. They will be issued within the limits of the quantities necessary to meet the needs of medical, pharmaceutical, and industrial production. Similarly, authorization will not be granted to produce THC (tetrahydrocannabinol) which is the main molecule of cannabis whose content must not exceed a level set by a regulatory text. On top of that, it is to be specified that the applicant for authorization must be of Moroccan nationality, has the legal majority, domiciled in one of the douars (villages) of the identified provinces. He also must be a member of a cooperative that will be created for this purpose and must own the land or have permission to grow cannabis on it. Additionally, authorized producers must comply with the provisions of the specifications to be prepared by the National Agency, in coordination with the relevant government authorities. In conclusion, the legalization of Cannabis will unlock great potential for the Moroccan economy, especially since the market is estimated to reach USD 69 billion by 2027. Not to mention that many countries are currently conducting massive research regarding the uses of Cannabis in the medical field. However, the country must not rely on local market’s demand only, efforts should be oriented to exploit global markets and partner with global pharmaceutical firms to build strong exporting business models. ***Numbers are not completely reliable since the scope is illegal Sources: https://www.leconomiste.com/flash-infos/cannabis-47-000-ha-cultives-au-maroc https://www.globenewswire.com/news-release/2019/04/18/1806583/0/en/New-Study-Estimates-the-Global-Cannabis-Market-at-Over-340-Billion-USD.html https://encadrementcannabis.gouv.qc.ca/le-cannabis/ https://www.cbdcorner.fr/difference-cbd-thc/ https://www.leconomiste.com/session/limit//article/1075528-legalisation-du-cannabis-les-details-du-projet-de-loi%3Fdestination%3Dnode/1075528 https://www.globenewswire.com/news-release/2020/12/01/2137727/0/en/Legal-Marijuana-Market-Growth-is-Expanding-over-17-8-by-2027.html http://www.apdn.ma/apdn/images/stories/file/etudes_enquettes/Morocco_survey_2004_reference.pdf https://www.youtube.com/watch?v=eAP5N2gPHhM&t=746s https://www.leconomiste.com/flash-infos/legalisation-du-cannabis-le-projet-de-loi-adopte-chez-les-representants https://www.ncbi.nlm.nih.gov/pmc/articles/PMC7023045/ https://www.ncbi.nlm.nih.gov/pmc/articles/PMC7693730/ https://www.ncbi.nlm.nih.gov/pmc/articles/PMC6387667/

Non-fungible tokens, or NFTs, have been making headlines during the past few months as they went from something very few people had heard of, to the latest crypto trend. NFT advocates say that they can fix a significant problem within art and entertainment, while critics only see it as another crypto bubble soon to pop. What are NFTs? Non-fungible tokens are individually unique digital assets — which include songs, images, videos, and even tweets. The metadata that an NFT is composed of makes it unique through various attributes, including size, rarity, the artist’s name, etc. [1] NFTs determine an item’s ownership by storing the details in a digital ledger known as a blockchain. [2] In the context of NFTs, there is some debate over this concept of ownership. Indeed, in various transactions involving NFTs, they do not represent the asset itself, but rather only the record of its ownership. But the inherent characteristics that are commonly mentioned when defining these tokens as a “new form of ownership” include scarcity and uniqueness, trade and interoperability, and immutability. [3] A brief history of NFTs What could be called the ancestor of NFTs dates back to 2012 when “colored coins” were first mentioned in an article titled “bitcoin 2.X (aka Colored Bitcoin) — initial specs”, by Yoni Assia, which describes coins that are made of small denominations of a bitcoin and can be as small as a single satoshi, the smallest unit of a bitcoin. Another article, published by Meni Rosenfeld titled “Overview of Colored Coins”, discussed the potential of these new assets. Further iterations followed over the years, such as the trading cards on Counterparty, a peer-to-peer financial platform and distributed, open-source Internet protocol built on top of the Bitcoin blockchain, as well as Cryptopunks, which are unique characters generated on the Ethereum blockchain, and CryptoKitties, a blockchain-based virtual game that allows players to adopt, raise, and trade virtual cats. These experiments collectively laid the groundwork for the growth the market would witness until NFTs finally reached the mainstream. [2, 3] In fact, monthly sales on OpenSea, an NFT marketplace, reached $95.2 million in February 2021, up from $8 million in January of the same year. [4, 5] [caption id="attachment_7255" align="aligncenter" width="690"] Monthly sales volume on OpenSea, in U.S. dollars. Source: Reuters, 2021[/caption] How much are NFTs worth? Everyone is able to tokenize digital assets and sell them as NFTs, but interest in these past few months has been fueled by headlines of multi-million-dollar sales. In March, Mike Winkelman, a conceptual 3D artist who goes by Beeple, became the third wealthiest living artist after renowned auction house Christie’s sold his digital work, a piece titled “Everydays: The First 5000 Days” for $69.3 million (€58.9 million), breaking all previous NFT sales records. [caption id="attachment_7253" align="aligncenter" width="404"] Beeple, Everydays: The First 5000 Days, 2021. Source: Christie's auction house[/caption] In the same month, Kings of Leon, a music group, released one of the first major records to also be released as a collection of NFTs and generated between $1.45 and $2 million in sales in its first five days, and electronic musician Grimes sold digital artwork for around $6 million (€5.1 million). [6, 7, 8] The National Basketball Association (NBA) and its players union (NBPA) partnered with Vancouver-based blockchain company Dapper Labs to develop NBA Top Shot, a new digital platform where fans can buy, sell and trade NBA moments, which are packaged highlight clips that operate like digital trading cards. To date, the platform has generated around $500 million in sales. The most valuable NFT was that of LeBron James dunking against the Houston Rockets, which sold for a reported $387,600. [9] Jack Dorsey, the CEO of Twitter, offered his first tweet, which was published on March 21, 2006, for sale as an NFT. It was sold in late March 2021 for 1,630.58 ether, a cryptocurrency that was equivalent to about $2.9 million. [10] How can artists benefit from NFTs? According to a report published by Citi GPS, the potential revenue of the music business in 2017 was $43 billion, only 12% of that amount flowed to artists. Indeed, the aggregate revenue of the industry is shrunk by various costs including retailer mark-up for music sales (digital or physical), the cost to put on a concert, the costs of running various distribution platforms (e.g. Spotify), and EBITDA, etc... Fees from royalty collection entities, costs for the artist’s manager, record producer, concert promoter, concert agents, and record labels must also be subtracted. The remaining balance is then the only revenue for the artist. [11] In this context, NFTs could become an important and independent revenue stream for musicians by cutting out the middlemen in an industry rife with them. [caption id="attachment_7252" align="aligncenter" width="554"] 2017 Allocation of Music Revenues ($ billions). Source: Citi GPS, 2018[/caption] Digital artists face a major challenge, which lies in the very definition of their work. Digital art is by nature infinitely reproducible. NFTs, which work as public ledgers, offer a technological solution. Collectors can now buy an NFT that essentially acts as a tamper-proof digital receipt, which allows the artist to retain a percentage of the revenue each time their work is sold. NFTs can thus benefit established and emerging digital artists alike by providing additional revenue streams. [12] A double-edged sword It is important to note that the NFT boom also has its drawbacks. Many artists around the world have been reporting the theft and sale of their work on NFT sites without their knowledge or permission. Automated technology, such as a tweet-mining bot which is at the center of many reports of theft, can “tokenize” a tweet or an image in an instant. [13] Another major concern surrounding NFTs is the negative impact they have on the environment. Indeed, they are built on the same blockchain technology used by cryptocurrencies which are yet to solve the issue of their high energy consumption. For instance, a single NFT transaction on the Ethereum network consumes as much as the daily energy used by two American households. [14] [caption id="attachment_7254" align="aligncenter" width="629"] Ethereum energy consumption. Source: Digiconomist, Ethereum Energy Consumption Index[/caption] Most of today’s blockchain networks function on security systems based on special computers called “miners”, which compete to solve complex math puzzles. Mining requires a significant amount of computational power, which in turn causes high electricity consumption. Ethereum’s technology is said to be moving towards a design that would be less computationally intensive to try to compete with more efficient blockchains. The speed of this transformation into an eco-friendlier version of blockchain technology may decide the future of the NFT market in the short term, as some artists feel strongly about climate change trends and are opposed to NFTs because of their environmental impact. [14] With these drawbacks in mind, and considering the recent plunges of Bitcoin and Ether [16] which may scare away potential investors not familiar with the market, it remains an open question whether NFTs can truly become the next form of art and entertainment monetization, or become the next financial bubble to burst. Sources: [1] NonFungible, Non-Fungible Tokens Yearly Report, 2020 [2] Euronews, What are NFTs and why are they suddenly so popular?, 2021 [3] CB Insights, NFTs: Is The Spotlight-Stealing Blockchain Tech A Cash Grab Or The Next Big Thing?, 2021 [4] Digital Trends, A brief history of NFTs, 2021 [5] Medium, The History of Non-Fungible Tokens (NFTs), 2019 [6] Reuters, Explainer: NFTs are hot. So what are they, 2021 [7] NME, Kings Of Leon have generated $2million from NFT sales of their new album, 2021 [8] Cointelegraph, ’Breaking new ground is never easy’ — Kings of Leon's NFT release takes in $2M, 2021 [9] SportsPro, What is NBA Top Shot? Dapper Labs’ Caty Tedman explains the NFT platform everyone is talking about, 2021 [10] CNBC, Twitter CEO Jack Dorsey’s first tweet NFT sells for $2.9 million, 2021 [11] Citi GPS, Putting the Band Back Together - Remastering the World of Music, 2018 [12] UCLA, For digital artists, NFTs are promising – and problematic, 2021 [13] ABC News, Artists report discovering their work is being stolen and sold as NFTs, 2021 [14] The Conversation, How nonfungible tokens work and where they get their value – a cryptocurrency expert explains NFTs, 2021 [15] Digiconomist, Ethereum Energy Consumption Index [16] CNBC, Bitcoin’s wild price moves stem from its design, 2021 [17] Christie’s, EVERYDAYS: THE FIRST 5000 DAYS, 2021

Today some countries are progressing more rapidly than others in terms of covid-19 vaccinations. In this article, we will look at the cases of Israel, the UAE, and Morocco, and how successfully they have administered their inoculation campaigns. Then we will cover the issue of vaccine access inequality, and the reasons behind the gap between various nations. Countries with the most successful and rapid vaccine rollout are the smaller ones in terms of population: Israel, UAE, etc. These countries’ advanced digitized and centralized healthcare systems allow for a quick and effective roll-out. With a Covid-19 vaccination drive that has reached more than half of the population, Israel has pulled far ahead of the rest of the world, becoming a world leader in vaccinations per capita, and in return, it supplies BioNTech/Pfizer with valuable data and information from its campaign. Israel has started to reopen its economy since the Health Ministry data showed that the two-shot regimen has reduced COVID-19 infections by 95.8% since February and that it was 98% effective in preventing fever and breathing issues and 98.9% in preventing hospitalizations and death. In the UAE, Dubai has also decided to take the risk of gradually reopening its economy on New Year’s Eve, as it relies on international tourism for nearly a third of its GDP; by the end of January, with coronavirus cases spiking, hospitals had reached their limit and cases quadrupled to almost 4,000 a day. The currently approved vaccines in the country are Sinopharm, Pfizer/BioNTech, and Sputnik V. The Emirates are one of the first countries to start vaccinations, having administered at least 11 million shots as of May 9th. Thanks to this early action, the economy of the UAE, is forecast to grow by 1.3% this year according to the IMF, after contracting 6.6% in 2020. In Morocco, the vaccination campaign started on January 28th and has benefited some 4.5 million people (fully vaccinated), making it the most advanced African country in Covid-19 vaccinations. It currently uses the British AstraZeneca and Chinese Sinopharm vaccines and intends to further diversify its supplies with the Russian vaccine Sputnik V. The Kingdom is emerging as a model country that seeks to vaccinate, free of charge, 80% of its population aged over 17, including foreign residents. On March 3rd, The World Health Organization congratulated Morocco and announced that it is among the first 10 countries that have “successfully completed the challenge of vaccination against COVID-19.” Success of the Covid-19 vaccination campaign One of the key factors of the success of the Covid-19 vaccination rollout is the population’s attitude towards it. Both the UAE and Israel have invested resources in reassuring their population that the vaccine is effective and safe. In many countries, health authorities relied on faith leaders to make sure their communities are getting their vaccines. In the UAE the Fatwa Council issued a Fatwa (Islamic ruling) allowing the Covid-19 vaccines to be used in compliance with Islamic Sharia’s objectives, and its chairman, Shaykh Abdallah bin Bayyah, was vaccinated in public. Religious leaders are also spreading the word in Israel: ultra-Orthodox media and community leaders are taking part in the vaccination campaign, as a significant minority is still resistant and suspicious of the mass vaccination campaign. In Morocco, the government has successfully managed the response to the pandemic by acting quickly and preemptively as the first cases appeared: through strict application of quarantine, acquisition of masks, and all the necessary PPE, early involvement in vaccination, and securing multiple doses of the vaccine. This effort has reduced the number of fatalities per day, from 92 deaths in November to only 5 in April. How fair and equitable is the vaccine distribution plan? So far, the richest countries have been prioritizing their own population and have been able to buy far more doses than the poorest ones: high-income countries hold a confirmed 4.2 billion doses, while low-middle income nations only hold 670 million. In Africa, the delay appears to be playing out across the continent, which raised doubts about the effectiveness of political leadership. The delayed arrival of doses in some African nations could regrettably add more hospitalizations and deaths and increases the risk of multiplication of dangerous variants. Led by the WHO with the Coalition for Epidemic Preparedness Innovations CEPI and Global Vaccine Alliance GAVI, the Covax initiative is aiming to focus on the 92 poorest countries: more than 49 million vaccine doses have been delivered through Covax so far. The World Health Organization approved the AstraZeneca vaccine to be rolled out globally through the Covax program and Ghana became the first to receive the Covid-19 vaccines in February. A country with no vaccination plans: Tanzania For months in 2020 the Tanzanian government, then led by the late John Magafuli, has insisted the country was "Covid-19 free". And without providing any evidence, the government also expressed doubt about the efficacy of Covid-19 vaccines and instead promoted unfounded remedies like steam inhalation and herbal medicines, neither of which have been approved by the WHO. The health minister even went so far as to announce that the country “has no plans in place to accept COVID-19 vaccines”. The deceased President opted to maintain strict control over public discussions of Covid-19 issuing a directive that only himself, Dr. Gwajima, and three other top officials could give information about Covid-19 in the country. But in an unusual move, some leaders of the Catholic church broke their silence and warned the public to observe health measures to prevent the spread of the virus. WHO's Africa director Dr. Matshidiso Moeti said that the vaccines work and that he encourages the Tanzanian government to prepare a Covid-19 vaccination campaign, adding that the WHO is ready to support them. As the country has not published any data on the virus for months, it is difficult to say how well Tanzania’s approach has worked; the last time the country published data on its Covid-19 numbers was 29 April 2020, when it reported only 509 cases. Why are such disparities allowed? Since Covid-19 vaccines are not a public good, the market decides who gets it first. Wealthy countries are racing to have their population vaccinated this year, but in most developing and poor countries, the vaccine remains unavailable, undermining the efforts for global immunization. The choices made by the wealthiest nations will determine which future takes hold: a global community unified to bring the virus under control, or a world divided between the wealthy and immunized and the vulnerable and poor. Boutaina Benaboud Sources: https://www.theguardian.com/world/2021/mar/11/israeli-real-world-data-on-pfizer-vaccine-shows-high-covid-protection https://covid19.ncema.gov.ae/en/page/about-the-vaccine https://datadashboard.health.gov.il/COVID-19/general?utm_source=go.gov.il&utm_medium=referral https://www.khaleejtimes.com/coronavirus-pandemic/covid-vaccine-uae-14742-doses-administered-in-24-hours https://abcnews.go.com/Health/wireStory/dubais-covid-vaccine-scramble-sikhs-serve-doses-75755555 https://ourworldindata.org/covid-vaccinations https://www.imf.org/en/Countries/ARE https://www.aljazeera.com/news/2021/2/21/israel-reopens-bits-of-its-economy-as-vaccinated-people-nears-50 https://www.wsj.com/articles/israels-leaders-clash-with-ultraorthodox-over-lockdowns-vaccines-11612199623 https://www.khaleejtimes.com/coronavirus-pandemic/uae-covid-19-vaccine-fatwa-council-chief-gets-the-jab https://www.bbc.com/news/world-55795297 https://www.bbc.com/news/world-africa-55900680#:~:text=Coronavirus%20in%20Tanzania%3A%20The%20country%20that's%20rejecting%20the%20vaccine,-6%20February&text=For%20months%20Tanzania's%20government%20has,of%20having%20had%20the%20disease. https://www.eiu.com/n/85-poor-countries-will-not-have-access-to-coronavirus-vaccines/ https://twitter.com/omsmaroc?lang=en https://www.africanews.com/2021/03/09/morocco-vaccinates-more-than-four-million-people-against-covid-19// https://www.medias24.com/la-campagne-de-vaccination-anti-covid-demarre-au-debut-de-la-semaine-prochaine-15721.html https://www.mapnews.ma/en/actualites/social/covid-19-morocco-champion-vaccination-french-media https://www.thenationalnews.com/uae/health/coronavirus-uae-administers-10-million-vaccine-doses-1.1209141

Ever Given ship was not allowed to depart from Suez Canal unless the vessel’s owners pay up to $1 billion to compensate for the enormous disruption it resulted in. Ever Given’s Ship Blockage Causes the World’s Heaviest Traffic Jam. On the 23rd of March 2021, the Ever Given was sailing through the Suez Canal. Strong winds whipped up by a sandstorm affected the steering of the ship causing it to turn into the banks blocking the entire span of the canal. The blockage of the Suez Canal brought a lot of attention to the global maritime importance of this passage. In this article, we look at the various negative effects the Ever Given caused and also shed light on other interlinked questions, mainly, how big is the global maritime trade transport market? Are there penalties imposed on the Ever Given Vessel? Are there other canals that are considered key trade passages? Is this the first time the Suez Canal was blocked? How Important is the Suez Canal and what are the canal’s investments/projects? Global Maritime Trade Transport & Key Choke Points A sole country can’t be entirely self-sufficient. Shipping helps ensure that the benefits of trade and commerce are evenly spread. Almost every country relies on maritime trade to buy its necessities and sell its products. Maritime transport is the backbone of international trade and the global economy: almost 80% of global trade by volume is carried by sea and is handled by ports worldwide. Because of its importance, commercial shipping relies on strategic trade routes to move goods efficiently. A vast number of vessels use these waterways every year, but it does not always go smoothly as there are risks that can disturb the whole system. The most serious risks to global trade are posed by choke points which are strategic, narrow passages that connect two larger areas to one another. When it comes to maritime trade, these are typically straits or canals that see high volumes of traffic because of their optimal location. Although these vital routes are very convenient, they impose several risks: Structural risks: As demonstrated in the recent Suez Canal blockage, ships can crash along the shore of a canal if the passage is too narrow, causing traffic jams that can last for days. Geopolitical risks: Because of their high traffic, choke points are particularly vulnerable to blockades or deliberate disruptions during times of political unrest. The location affects the risk type and degree. Below are listed the biggest threats concerning 8 of the world’s major choke points. Is the Suez Canal the Only Maritime Artery? What Do Other Maritime Passages Mean to the World? Global Maritime canals and straits shorten navigation time of transport of cargoes and contribute to reducing transport costs. Despite the most recent crisis, Suez is not the most vulnerable bottleneck for world trade. Ever Given is not the First Ship to Block the Suez Canal The Suez Canal has been blocked and closed several times since its opening in 1859. According to the Suez Canal Authority, the Canal has closed 5 times since it opened for navigation in 1869: 1956, after a British-French-Israeli invasion. That tension following the Egyptian President’s announcement of nationalizing the canal led to its closure for months 1967, Egypt enters a war with Israel and the canal closed for 8 years 2004, the Tropic Brilliance oil tanker got jammed in the waterway which took 3 days to refloat and sail again 2006, the Okal King Dor drifted at a wrong angle and got jammed leading to a temporary blockage in the canal for 8 hours 2017, OOCL Japan malfunction caused the ship to to block the canal but the tugboats freed the ship in a few hours In comparison with the 5 previous incidents, the Ever Given falls in the middle in terms severity. The Ever Given’s Blockage tragically affected Global Economy & Maritime Flow In less than a week, global trade has been tremendously affected by this incident. Although the ship was freed and floated on March 29th, the canal could not immediately process full traffic flow. The blockage has been the source of much worry and frustration for the global shipping industry. Waiting Vessels since the blockage: More than 300 ships waiting in and around the Suez Canal Upcoming Vessels: 130 vessels were on their way to the canal Global Oil & Gas: An average of 12% of global trade, around one million barrels of oil and roughly 8% of liquefied natural gas pass through the canal each day Egypt’s losses due to the damage: The Suez Canal Authority Chairman stated that the Canal’s blockage results in revenue losses averaging $14m-$15m for each day Delayed Cargo: Estimated $9.6bn of trade along the waterway each day. That equates to $400m and 3.3 million tons of cargo an hour, or $6.7m a minute Global Trade: Allianz’ analysis showed the blockage could cost global trade between $6bn to $10bn a week and reduce annual trade growth by 0.2 to 0.4 percentage points How was the ship freed? The main obstacle in re-floating the ship once again from the Suez Canal bank was its enormous size. The ship is 400 m (1,312 ft) long, 59 m (194 ft) wide while the canal itself is only 200 m wide (656 ft). This vast size comes with a massive weight as well, the ship weighs around 200,000 tons. A 24/7 emergency effort was put into place to get the shop back on track. 3 main forces were used in the strategy to free the boat. Dredgers clawed away underwater sand, Excavating equipment was used to dig out the keel of the ship, Tugboats, were used to push and rotate the ship and pull it with tow lines. Ever Given ship is forbidden to leave the Suez Canal Egyptian authorities reported they wouldn't release the vessel unless its owners agree to pay up to $1 billion in compensation. Osama Rabie, who leads the Suez Canal Authority reported “Egyptian authorities would demand $1 billion to cover the costs of freeing the vessel. The figure will cover the expense of the equipment and machinery used to clear the way, the damage to the canal itself, and the compensation of the 800 people who worked to release the 200,000-ton ship. It will also refund the costs from the blocking of the canal, which ended up causing an epic traffic jam of more than 300 ships on either side of the channel.” Is it Ever Given or Evergreen? There was some confusion occurred regarding the name of the ship as news outlets started calling the ship “Ever Given” while the name “Evergreen” was prominently painted on the side of the ship in large capital letters. Ever Given is the name for the ship, and the ship is operated by a Taiwanese company called Evergreen Marine. Careful observers or sailing aficionados will notice that Ever Given is also written on the ship at the bow and stern of the vessel in smaller lettering. Global Repercussions VS Egypt’s Efforts & Its Worldwide Recognition At the beginning of the incident, maritime experts globally warned that it may take weeks to dislodge the Ever Given and that the blockage would last for a long time. However, thanks to the effort of the Suez Canal Authority and the support from the government, the ship was refloated within less than a week. Egyptian officials said that the backlog of ships waiting to transit through would be cleared in around three days. Evergreen thanked the Suez Canal Authority and other concerned parties for managing to successfully release the mammoth. Several countries also extended their congratulations to Egypt as they watched with bated breath how this problem was resolved. Investments in Suez Canal Investments in the Canal. The Suez Canal has been receiving investments to its economic zone and for canal renovation. In the last 5 years, Suez Canal Economic Zone (SCZone) investments hit more than 15 billion dollars. In the same timeframe, over 220 companies from different industrial sectors were established at the SCZone. The strategic role in promoting trade exchange between Egypt and other regional and African countries was aided by Egypt’s national road network developments and the Cairo-Cape Town road project. Governance. SCZone will establish a subsidiary company to work as an investment and commercial arm to channel funds for projects along the Canal Opportunities in the Canal. With investments more than $15 Billion, the SCZone gathers 14 industrial developers, 247 operational establishments, covering 239 sqms of land that creates 70,000 job opportunities. Resources. The canal has a strong infrastructure that includes 7 power stations and 13 power-distribution units, 2 desalination plants and 2 water-treatment plants, establishing tunnels and bridges to support the transportation network, and expanding the telecommunications and natural-gas networks. Future Investments. Suez Canal Container Terminal (SCCT) aims to invest $60 million during 2021 to enhance the competitiveness of the container handling terminal at East Port Said Port. The company’s investments are currently estimated at over $900 million. The new investments aim to add 6 giant cranes to increase the total number to 12, in addition to increasing the number of yard winches from 50 to 60-yard winches. Author: Mohamed Aref References: https://www.businessinsider.com/ever-given-forbidden-leave-suez-canal-until-owners-pay-compensation-2021-4#:~:text=Ever%20Given%20ship%20forbidden%20to,for%20the%20chaos%20it%20caused&text=The%20Ever%20Given%20can't,are%20paid%2C%20officials%20said%20Thursday.&text=The%20owner%20of%20the%20Ever,heard%20from%20Egyptian%20authorities%20yet. https://www.bbc.com/news/world-middle-east-56567985#:~:text=Traffic%20has%20resumed%20in%20Egypt's,with%20the%20help%20of%20dredgers. https://www.bbc.com/news/business-56559073 https://www.bbc.com/news/56523659 https://www.visualcapitalist.com/mapping-the-worlds-key-maritime-choke-points/ https://www.dw.com/en/suez-canal-blockage-4-of-the-biggest-trade-chokepoints/a-57020755 https://unctad.org/webflyer/review-maritime-transport-2018#:~:text=Maritime%20transport%20is%20the%20backbone,are%20handled%20by%20ports%20worldwide. https://www.npr.org/2021/03/26/981600153/heres-how-a-long-shutdown-of-the-suez-canal-might-roil-the-global-economy CNBC Television News https://www.usatoday.com/in-depth/graphics/2021/03/29/ever-given-refloated-and-freed-how-did-they-get-the-ship-out-of-the-suez-canal/7043678002/ https://www.usatoday.com/in-depth/graphics/2021/03/26/how-evergreens-ship-got-stuck-in-the-suez-canal/7010375002/ https://www.ctvnews.ca/business/ever-given-or-evergreen-what-s-the-actual-name-of-the-suez-ship-1.5366697 https://www.egypttoday.com/Article/1/100302/Evergreen-Line-thanks-Suez-Canal-Authority-for-refloating-its-stuck https://www.nytimes.com/2021/03/26/business/suez-canal-blocked-ship.html https://www.france24.com/en/tv-shows/business-daily/20210326-vessels-start-diverting-amid-warning-suez-canal-blockage-may-last-for-weeks https://www.france24.com/ar https://www.un.org/press/en/2016/sgsm18129.doc.htm https://english.ahram.org.eg/NewsContent/50/1202/359583/AlAhram-Weekly/Economy/More-investment-in-the-Suez-Canal-Zone.aspx https://english.ahram.org.eg/NewsContent/3/12/379611/Business/Economy/Investments-at-Suez-Canal-Zone-hit-bln-in--years,-.aspx https://www.hellenicshippingnews.com/suez-canal-containers-aims-to-invest-60m-during-2021/

Bitcoin has become the biggest trending topic for quite some time now, and rightfully so. The cryptocurrency keeps making headlines due to what seems like an everyday market all-time high, countless success stories of early investors becoming wealthy overnight, and its day-by-day adoption by large institutions. But is this new technology worth the hype or is it a bubble waiting to burst and most importantly is it here to stay? What is Bitcoin? To understand this new concept, it is important to start from the beginning. Bitcoin is considered as the first widely adopted Cryptocurrency, created in 2009 by an unknown person or persons whose pseudonym is Satoshi Nakamoto. One of the main characteristics of Bitcoin is the ability to directly send money and receive money without the involvement of a third party such as a bank or a payment processor like PayPal using a system called “peer-to-peer”. In simple terms, the peer-to-peer system works as a web of users that simultaneously validates each bitcoin transaction. This system is also referred to as “the blockchain” which functions as a ledger of all transactions in the bitcoin network. The blockchain is made up of nodes. These nodes are physical computers ran by individuals that make up the Bitcoin system. When these nodes process a transaction, which requires a great deal of computer processing power, they are rewarded with a small fee. The processing of these transactions is called “Bitcoin mining” and is the very process that generates new Bitcoin. Why does Bitcoin hold value? The reason Bitcoin holds value is the same reason regular currencies hold value: it maintains relative value over time and it is able to capture the faith and belief of the people using it. Historically, commodities and precious materials such as cocoa beans and gold were used as payment methods because society viewed those materials as holding stable value. However, because of the unpracticality of these materials in terms of storage and transportation, many societies turned to minting coins made from metals (Gold, Silver, Copper…) that are inherently valuable and are very durable. After some time, these coins were replaced by notes that do not hold the intrinsic value of coins but were still tied to commodities such as gold in such a way that they were exchangeable for a set amount of said commodities. Today, countries moved away from the gold standard and started using Fiat currency. Fiat currency is issued by the government and not tied to any commodity, though the only value they hold is the faith that they will be accepted by individuals and governments. Most societies have determined that fiat currencies are the most durable and the least likely to deteriorate or depreciate. The chart below shows the different traits of money across Gold, Fiat (USD), and Bitcoin: As seen in Fig. 1, Bitcoin does a great job compared to fiat currencies and even holds an upper hand when it comes to decentralization because of the nature of the blockchain system. It is also Smart, in other words, the whole Bitcoin transaction system can be modified or updated in real-time, although this is very hard to do because all the nodes in the blockchain must simultaneously validate the change. Ray Dalio, founder of the world’s largest hedge fund Bridgewater and esteemed economist pointed out the utility of Bitcoin in terms of wealth storage in times of uncertainty within the equity market. In the current economic climate, where governments are looking to depreciate their currencies as the equity markets are booming and bond yields are converging towards 0%, Bitcoin is a reasonable asset to store wealth into, the same as gold or real-estate, as it is not controlled by a government entity and cannot be affected by any incoming government monetary policy. Another valuable characteristic of Bitcoin, which gold lacks, lies in its exchangeability ie. the ability to make purchases with the currency. For example, if any given person wants to start using Bitcoin, all they need to do is download a Bitcoin wallet which is an app that allows you to send and receive Bitcoin. They can then purchase Bitcoins using that same wallet. Then in order to send Bitcoin all they would need to do is scan a QR code of the receiver which will then take them to the wallet, they can then enter the amount of money they want to send to complete the transactions. However, this very quality poses a risk as excess freedom and privacy in value exchange can lead to increased malicious activity such as hacks, fraud, and theft. The current state of Bitcoin In the current market, top investment bank leaders have shown resistance towards Bitcoin saying that it is a bubble waiting to burst and that it would eventually become irrelevant. One of these is Jamie Damion, CEO of JPMorgan Chase, who stated that Bitcoin will be ultimately be shut down by the government when the currency starts being used for malicious intent. He added that, at its core, Bitcoin is not an actual currency and holds no value. This view has been shared by the most successful investor, Warren Buffett, CEO of Berkshire Hathaway, who also referred to the asset as ‘a rat poisoned square’. However, despite the attacks of highly esteemed personalities within the financial industry, cryptocurrency was crowned the top-performing asset class of 2020-21 with an 800% return. Bitcoin saw a surge at the beginning of 2021 and is currently valued at 59,000 USD per coin with over $1 trillion in circulation. This surge was due to the adoption of digital currency by very large companies. One of such companies is MicroStrategy (MSTR: NASDAQ), a publicly-traded business intelligence firm, which made headlines by buying $2.19 Billion worth of Bitcoin, equivalent to 90,895 BTC. In recent news, Elon Musk CEO of Tesla announced that it is now possible to buy a Tesla using Bitcoin. The electric vehicle manufacturer also reported to the SEC that it purchased $1.5 billion of Bitcoin and that the bitcoins it will receive from clients buying its vehicles will not be converted to any other asset and will instead be kept in its original form. Additionally, Morgan Stanley, one of the biggest investment banks in the world, started offering its rich clients exclusive access to three funds that will allow them to own Bitcoin. However, the bank made it clear that this move is solely for clients with a ‘high-risk tolerance’ and who own $2 Million USD minimum in assets with the firm. These moves will encourage other businesses in adopting the digital currency as a form of payment and push it into the mainstream. Overall, it is apparent that Bitcoin has the main characteristics of a viable and reasonable asset to store wealth in. However, it is important to acknowledge that it is a relatively new concept that can and most likely will be subject to government regulations, cyber-attacks, fraud, quantum computing, and other threats that are not yet on the horizon. Citibank stated that Bitcoin could become the form of payment of choice for international trade. Citibank also noted that the future of Bitcoin is still blurred, however, there are many signs leading towards the acceptance of the digital currency by the public. Nigeria, the global leader in Bitcoin Trade Nigeria presents a particular case. Currently, Nigeria holds the position of the largest Bitcoin market by trading volume in Africa, and the second-largest global Bitcoin market behind the USA according to the New York-based cryptocurrency trading platform Paxful, with more than 33% of Nigerians either using or owning Cryptocurrency. This is due to the reliance on the peer-to-peer phone payments method, lack of formal payment processing infrastructure, as well as the severe devaluation of the Naira bringing about tight restrictions on offshore transactions and limited cash withdrawals. Bitcoin has made it possible for Nigerians to bypass the $100 dollars withdrawal limit on the naira debit card. However, in February 2021 Nigeria’s Central Bank issued a letter stating that banks are no longer allowed to facilitate any transactions with companies that deal with cryptocurrency. The reason behind this immediate ban is to prevent the underlying fraud and money laundering that the country has been struggling with which is facilitated by the privacy and lack of regulatory policy on Bitcoin. As it is widely known, Bitcoin transactions are private, do not involve any third party entity, and do not follow a regulatory policy which is one of the pitfalls of the currency that will ultimately need to be addressed if the currency wants to stay relevant and become more mainstream as a currency. Othman Zidane Sources: https://www.investopedia.com/ask/answers/100314/why-do-bitcoins-have-value.asp\ https://www.cnbc.com/2021/03/17/bitcoin-morgan-stanley-is-the-first-big-us-bank-to-offer-wealthy-clients-access-to-bitcoin-funds.html https://www.bridgewater.com/research-and-insights/our-thoughts-on-bitcoin https://edition.cnn.com/2021/03/24/tech/tesla-bitcoin-elon-musk/index.html https://www.investopedia.com/tech/what-will-happen-bitcoin-next-decade/#:~:text=Citi%20noted%20that%20Bitcoin's%20future,the%20digital%20asset%2C%20noted%20Citi. https://www.aljazeera.com/economy/2021/3/25/nigerias-crackdown-on-bitcoin-echoes-global-crypto-conundrum https://www.bbc.com/news/world-africa-56169917 https://www.statista.com/chart/18345/crypto-currency-adoption/ https://bitcoin.org/en/how-it-works#:~:text=The%20block%20chain%20is%20a,actually%20owned%20by%20the%20spender. https://www.dummies.com/personal-finance/brief-history-bitcoin-blockchain/#:~:text=In%20very%20simple%20terms%2C%20the,mining%20for%20the%20cryptocurrency%20Bitcoin. https://www.freshbooks.com/hub/accounting/what-is-a-ledger\ https://www.npr.org/sections/money/2011/04/27/135604828/why-we-left-the-gold-standard

Over the past year, we all noticed more family members, friends, and colleagues adopting gig-work as a lifebuoy to cope with the pandemic’s consequences. The market landscape expanded to reach different professions and sectors, offering both workers and businesses, help to absorb shocks. It is totally reasonable to expect that, since the pandemic impacted all economies, it also had a considerable impact on the supply and demand of Gig Platform’s market. However, the nature of this impact remains subject to debate. A study conducted by Mastercard in 2019 sized the gig economy market at $248.3 billion with a projected annual rate of 17.4%. The market is forecasted to reach $455 billion by the end of 2023. With 40.7 million freelancers on digital platforms across the globe that generate $193 billion in gross volume and $127 billion in disbursements to freelancers. From a demand point of view, analysts expected the COVID-19 pandemic to have two opposing effects on demand for online gigs, depending on the companies’ behavior towards emergency strategies. It can cause a reduction in demand if companies are cutting their use of Gig Work platforms to protect and show more loyalty towards coworkers. And on the other hand, companies might now favor online workers hired through platforms to cut costs. The iLabour project (the first online gig economic indicator, from Oxford internet institute) shows a fluctuation between both hypotheses. In fact, the pandemic affects gigs’ categories differently. But all faced a serious decrease last year (compared to 2019 & 2018, charts bellow), before recovering to previous optimistic levels. These findings indicate that while the demand clearly soared due to a distancing effect, it also strongly disturbed the market’s seasonal pattern. In fact, in the previous years, demand used to slightly drop during the year-end holiday season, and then rises again from February up to May. Since the pandemic, the market experienced stronger volatility, suggesting that many online gig-workers will need urgent financial support to get through these crises. The Online Labour Index (OLI) [caption id="attachment_5581" align="aligncenter" width="553"] The index is tracking all projects posted on the five largest English-language online labour platforms (70% of the market by traffic)[/caption] The demand of online labour 2018-2020 [caption id="attachment_5582" align="aligncenter" width="522"] Source: Online Labour Index.[/caption] Software development and tech gigs are taking the lead: The market’s rebound is mainly due to software development and tech jobs that are currently most in-demand on Gig Work platforms, such as: Blockchain developers, AI engineers … As the US represents the top player in Gig Economy, OLI’s project presented the evolution of its supply and demand during the first months of 2020, to track the pandemic’s impact. The charts below are showcasing the considerable and fast increase of the software segment, especially during the period where all remaining professions were affected. This category’s wages are also making the difference as they ranged during 2019, in Upwork for example, from $31 USD to more than $115 USD per hour. US contribution to the online labor supply and demand by category According to the Online Labour Index, US is leading by far the category with 37.3% of vacancies posted, followed by the UK and Canada (9% and 7%). While Africa is only representing 3.2%, even though digital skills count for 44% of its demand, which highlights the overall small contribution of the continent. The supply of software development and tech gigs is led by Asian countries (75%) with India and Pakistan at the top. Followed by Europe (17%), North America (3%) and Africa (3%). This category only represents 26% of the African offering. Even if Egypt and Kenya are both in the top 15 suppliers of the online platform market, the technology segment account for only 39% and 8% of their offering, compared to 79% in Russia. The findings above suggest that complete opposed outcomes are possible for each country since the future of business is still unstable. In the best-case scenario, the demand would increase and lead to higher revenue and more job security. However, the number of online workers is also increasing, which might lead to critical competition for jobs, employment uncertainty, and lower earnings. One thing for sure, the coronavirus pandemic aggravates the risky nature of online gig work. Besides the income stability issue, COVID-19 is now highlighting the importance of the overall financial health and unemployment protection. Platforms are conducting positive changes to assure workers’ financial health: It goes without saying that the main services required by gig workers are access to loans and insurance, to manage their income and face future unforeseen situations. For this matter, all stakeholders should partner and work together to increase the penetration of financial products and services. Financial institutions, governments, and gig work platforms all have an important role to play in strengthening this market. Some players, mainly in the shared-driving and food delivery market, have been working on this issue, targeting 2 major solutions: Platforms partnering with financial solutions providers: Income protection insurance and access to loans are 2 pillars for gig workers’ financial health. Unfortunately, financial institutions rarely consider lending to this category. The lack of earning traceability is a serious obstacle. Thereby, some platforms are stepping forward to help track the worker’s employment history: Uber signed a partnership with AXA in 2018 for a Partner protection insurance to protect workers from lost earnings. In Southeast Asia, Grab is partnering with insurance company Chubb that offers medical and accident insurance to drivers. Mobymoney, a fintech start-up, is teaming up with FastJobs to provide an interest-free credit line. Careem has partnered with MicroEnsure to facilitate Careem captains’ health insurance in Pakistan IOTalent collaborates with GigaCover that brings income protection insurance solutions designed for freelancers. Platforms offering new integrated financial solutions: GoGet Malaysia is offering savings, insurance and financial management tools on its platform. Grab offers a package of financial services, including micro-credit, personal accident insurance and insurance against critical illness. Uber launched Uber Care in 2018 to provide easy access to micro-loans, life insurance, and family health insurance to drivers. In addition to platforms and financial institutions’ initiatives, many governments are taking the lead to harmonize and regulate the Gig-Work Platform market landscape. The International Labour Organization’s Global Commission on the Future of Work is discussing the implementation of an international governance system for digital labor platforms. And many countries are currently studying the implementation of an online gig worker’s digital ID, to enhance safety and security, and regulate taxation. If all stakeholders put effort into developing this market, will the online gig work become the next norm? References: The iLabour Project – Oxford Internet Institute 2021 Mastercard, “The Global Gig Economy: Capitalizing on a ~$500B Opportunity”, May 2019 Sources: MasterCard, “THE GIG ECONOMY IN EAST AFRICA A gateway to the financial mainstream”, September 2020 Fabian Stephany, Michael Dunn, Steven Sawyer, Vili Lehdonvirta (2020), “Distancing Bonus or Downscaling Loss? The Changing Livelihood of US Online Workers in Times of COVID-19”, Oxford Internet Institute. Cutean, A., Herron, C., Quan, T. (July 2020). Loading: The Future of Work: Worldwide Remote Work Experimentation and the Evolution of the Platform Economy. Information and Communications Technology Council (ICTC). Ottawa, Canada The UN Capital Development Fund, “The Gig Economy and Financial Health A snapshot of Malaysia and China”, December 2020. Techwire Asia, “Grab upgrades its finance stack with micro-loans for consumers, and more”, August 2020 https://iotalents.com/blog/income-protection-for-freelancers/ Uber, Partner Protection Insurance with AXA XL Technologytimes, “Careem Announces Captain Support Initiatives In COVID-19 Pandemic”, April 2020 The Hindu Businesses line “Uber helps driver partners with Rs 35.6 crore micro-loans”, February 2020 SAS, “Top Trends: Why Tax Administrators Are Adopting New Data and Analytics Strategies”, 2020 ILO, G20 Employment Working Group, “Policy responses to new forms of work: International governance of digital labour platforms”, April 2019

With a valuation of around $1 billion at IPO, Jumia’s listing in 2019 in the New York Stock Exchange has confirmed Africa’s first ‘now failed’ unicorn. The term ‘’unicorn’’ was coined in 2013 by Aileen Lee, a Silicon Valley venture capitalist, to describe a privately held, fast-growing startup. In detail, a unicorn refers to a technology non-listed company, in place for less than 10 years with a valuation greater than or equal to $1 billion. Initially, the term has been used to emphasize the rarity of these startups as only.07 percent of venture-backed startups were able to reach that valuation in a decade or less. Yet, amid an increase in the numbers of startups coupled with an influx of investments, the number of unicorns has significantly increased. To give an illustration, while it took more than four years for the number of unicorns to grew to 250, this number has doubled in the past two years. In Europe alone, the number of billion-dollar companies has almost quadrupled since 2014 with a total value of $ 416 bn, almost five the valuation in 2014. In 2020, despite the economic repercussions of Covid-19, a total of 89 companies gained unicorn status globally, many of which operate in the e-commerce and health care sectors. In other words, what was initially a club of 39, now counts more than 500 members. According to CB Insights and as of January 2021, there are 537 unicorns around the world with a total value of $ 1 636.18 bn. The USA and China are home countries for ~ 70% of global unicorns. Now, what about Africa? With a maturing technology and entrepreneurial ecosystem emerging across Africa, investors’ interest in the African tech ecosystem remained strong in 2020, despite the implications of the health crisis of Covid-19. According to the sixth edition of the annual African Tech Startups Funding Report, 2020 released by startup news and research portal Disrupt Africa, 2020 was a record year for investment into the African startup ecosystem. The report points out that a total of 397 African Startups have raised a fund equivalent to US$701.5 million in the same year, attesting to an increase of 42.7 percent over 2019, compared to $334.5 million raised in 2018. Kenya, Nigeria, and South Africa stand out as the main destinations of capital with 89.2% of the total amount of funds invested on the continent and account the vast majority (77%) of the deals concluded. While surpassing the $700 million mark in funding is lauded by many watchers of the African Tech space, this “achievement” is maybe not significant enough to compensate for the fact that in a global context Africa is still lagging behind, in terms of funds received. It is believed that unicorns indicate a venture capital ecosystem that is ripe for investment, with very few African unicorns it is then safe to assume that investors’ confidence in Africa is not yet matured enough to allow them to give an African startup a $1 billion valuation. According to CB Insights, Africa has generated zero unicorn in the past 2 years. In 2018, only three African unicorns have made it to the list. These three unicorns are Nigeria-based Africa Internet Group (Jumia), South Africa- based Promasidor, and South Africa- based Cell-C. Founded in Lagos in 2012, Jumia operates multiple online verticals across Africa. In 2016 the company became the first African startup unicorn, achieving a $1 billion valuation after a funding that included Goldman Sachs, AXA, Rocket Internet, and MTN. In April 2019, the African e-commerce giant became the first African unicorn to list on the New York Stock Exchange (NYSE). On its opening day, the shares have traded at $14.50, valuing the company at $1.1 Bn. Shortly afterward, the shares have peaked at $49.77, valuing the company at nearly $3.8 billion. However, and in light of allegations of fraud and concealed losses, among others, Jumia’s shares sunk hitting an all-time low to the $2 range in the following 12 months of its IPO. This has been said, Jumia serves as a good reminder that unicorn status does not protect a company from a sudden drop in its value nor is a guarantee of the performance of the company. For some African investors and startup owners, the African ecosystem is unparalleled internationally, as it comes with its own complexity and challenges, hence the ambiguity of forcing international success examples on it. They suggest instead letting African startups come up with their own success metrics that would better translate to the African marketplace. As explained by Xavier Helgesen, in markets where there is a venture capital shortage, macroeconomic uncertainty, a lower tolerance for risk, less acceptance of entrepreneurship as a career, or limited enabling infrastructures and policies, the Silicon Valley model fails. He goes on to suggest that instead of African companies striving to become the likes of Silicon Valley unicorns, they should instead focus on raising camels- organizations that can capitalize on the opportunity but also can survive on drought. The same idea has been reiterated by the Senegalese Venture capitalist Marième Diop. Silicon valley’s unicorn IPO model might not be right for African startups as these, face a vastly different macro business environment. Mrs. Diop suggested lowering revenue expectations and have African startups list on local exchanges to raise capital from IPOs. In this way, Africa can count more “gazelles” than unicorns “abroad”. A gazelle at home could be a company valued at $100 million or more and generating revenues of $15 to $50 million, according to Diop. In conclusion, be it unicorns, camels, or gazelles, African startups need to take advantage of the opportunities currently present to them (e.g. the rise in digitization, the increase in investment funds,…) and rewrite the rules to better align with their reality. Again, while African countries can use international benchmarks for inspiration, they should maybe refrain from making them a blueprint for future developments. Nouha Abardazzou - Senior Associate Sources: https://www.cbinsights.com/ https://www.cnbc.com/2020/01/23/era-of-mega-funded-money-losing-unicorns-is-coming-to-an-end.html https://www.forbes.com/sites/korihale/2020/04/23/jumia-africas-failed-unicorn-is-hemorrhaging-millions/?sh=670c187b64e4 https://asia.nikkei.com/Business/Startups/Unicorns-surge-to-500-in-number-as-US-and-China-account-for-70 https://www.boursorama.com/boursoramag/actualites/start-up-les-licornes-francaises-sur-le-devant-de-la-scene-1862f79b14758c16746c95f65adcbeb5 https://ventureburn.com/2019/12/10-reasons-why-2019-was-a-hot-year-for-africas-tech-startup-opinion https://www.howwemadeitinafrica.com/camels-not-unicorns-how-entrepreneurs-in-africa-are-rewriting-the-rules-of-silicon-valley/66953/ https://blog.usejournal.com/top-10-african-startups-to-watch-in-2020-341622c30928 https://outline.com/BftRtGhttps://disrupt-africa.com/2021/01/21/african-tech-startup-funding-passes-700m-in-record-breaking-2020/ https://zoom-eco.net/a-la-une/afrique-les-startups-africaines-ont-leve-7015-millions-usd-en-2020-soit-un-taux-daugmentation-de-427/ https://www.theguardian.com/business/2020/jul/17/african-businesses-black-entrepreneurs-us-investors

The second-largest sector after agriculture in Africa is the fashion and textile industry with an estimated market value of $31 billion in 2020 and growing every year (1). Fast fashion is a marketing and manufacturing model where clothing moves instantly from the runway to retail stores. Fast fashion captures the latest fashion trends and styles and manufactures clothing immediately to satisfy demand, season after season. It is able to do this by optimizing certain aspects of the supply chain to produce designs quickly and inexpensively. Marketing teams then target mainstream consumers, persuading them to buy the latest collections. These items are often set at a low price, making them attractive to a wide base of consumers encouraging them to replace one season’s garments with the next (2). Fast fashion produces around 52 micro seasons instead of the traditional 2 per year, increasing demand at an exponential rate. (12). Examples of fast fashion retailers include H&M, Zara, Uniqlo, Primark, Topshop, and Next that produce massive amounts of clothing very efficiently (3). But what is the fast fashion industry doing in Africa? What opportunities does it bring to the table and what risks does it present to this continent? Fast fashion can contribute positively to the African economy. Within Africa, the entire textile/clothing sector is already the second-largest employer after agriculture (4). In Kenya, data shows that every job in the garment sector generates 5 other auxiliary jobs (4). With shorter shipping routes to European and USA markets, Africa also has an important strategic advantage over Asian manufacturers. In fact, it takes just three weeks for a shipping container to travel from West Africa to Western Europe and a month to travel to the East coast of the United States. Africa also benefits from lower (or comparable) labor costs to Asia and apparel manufacturers in many African countries offer duty-free deals (or reduced tariffs as much as 30% compared to Asia) when entering European, American, and Australian markets (4) giving Africa a competitive edge over its Asian counterparts. Clothing and textiles represent about 7% of world exports, and apparel production is. For instance, Ethiopia is already a destination for apparel manufacturing such as Guess, Levi’s, H&M, which have shifted their production therefrom China (13). According to the Oxford Committee for Famine Relief (OXFAM), if Africa, East Asia, South Asia, and Latin America were each to increase their share of world exports by 1% the resulting growth could lift 128 million people out of poverty (4). The torch of the “world’s low-cost manufacturer”, long-held by China, is set to pass to Africa in the very near future (5). China has its sights set on shifting the focus of its economic system towards creating a significant domestic market with greater consumption capacity. For this reason, it is trying to go beyond a model that hinges on cheap labor. The African economy instead is still growing by 10% annually, an exception in the last decade, making it an attractive destination for foreign investors (5). In this context, Chinese firms are now looking to delocalize their production, without surrendering control of the supply chain, by seeking out, as European and American firms have done before them, low wages and suitable infrastructure (5). In Africa, the potential for attracting these investments is considerable, owing in part to wages being as low as 60-70 dollars per month in countries like Ethiopia (5). The fast fashion industry moves very quickly, and African countries are also interested in attracting this industry as it provides an opportunity for much-needed economic diversification. Countries like Ethiopia are a good example of the possible synergies to be had. There is a great deal of investment flowing into the country because of its lower wages and proper infrastructure, with good access to ports, a young and motivated workforce, and labor market governance that is favorable to investors. The country is also in the same time zone as Europe and is conveniently situated geographically with respect to target markets. Other countries with high potential include Nigeria, Ghana, and Kenya. Nigeria, Africa’s largest oil producer, recently scrapped its textile import ban, driving renewed interest from international fashion and apparel retailers. The country is currently home to leading brands such as Levi’s, Mango, Nike, and Swatch, which have set up stores in the Palms Shopping Mall in Lagos (7). These are all countries where increased macroeconomic stability has been conducive to the influx of capital (5). “Western companies were ignoring the prospects of the continent of Africa, especially with fashion retailers. Some not shipping there at all, others taking 21 to 30 days […]” (6). Yet, that will quickly change as they begin to grasp the opportunity that Africa offers (6). On the other side of this coin is the deleterious environmental impact of this production model. According to statistics published by the United Nations Environment Program and the Ellen MacArthur Foundation, the fashion industry is responsible for 10% of annual global carbon emissions, more than the aviation and shipping sectors combined (8). The industry’s use of water and energy has marked it as one of the planet’s biggest polluters. Climate change is already having a negative impact on food security and public health (9). In addition, Africa faces the unique problem of being the last link of this industry’s value chain: 45% of all donated clothing globally ends up in the hands of for-profit brokers, with 70% of that ending up in Africa (10). Kenya alone, for instance, imported a whopping $133 million worth of worn clothing from Canada, Europe, and China in 2017, practically wiping out their homegrown textile industry (10). As purchasers attempt to resell their items, they are often unaware of what products they are receiving, or even their quality. If the quality is sub-par, the materials get tossed in landfills losing traders lots of money and creating huge piles of trash. This means that developing countries are importing more waste textiles than the cotton they export and are therefore losing major profits– suffocating both their economies and their environments (10). Farmers in Burkina Faso, the largest cotton producer in sub-Saharan Africa, have identified that the cotton they produce seems to only gain real value once it is exported to outside countries, like China, and turned into fabrics, threads, and garments. Those garments are then sold globally (in stores like H&M, Topshop, or Zara) used, donated, and end up back in Africa, only to get thrown away. As calls for corporate consciousness begin to rise, initiatives for change are emerging. Consumers have a greater awareness of issues like sustainability. This has resulted in organizations, like the United Nations, considering negotiations to reform fast fashion’s destructive manufacturing process (10). Indeed, Africa looks like a promising market for fast fashion; however, a new improved system is needed. A version that is better than the current one where the production model is more sustainable and that supports a circular economy rather than a linear one. Reform is needed to save not only the environment, but also the people. Sara Yamama - Research Analyst Sources: https://intpolicydigest.org/2020/11/28/fashioning-with-waste-turning-fast-fashion-into-an-opportunity-in-africa/ https://www.thechicselection.com/fast-fashion-its-environmental-impact https://kitengestore.com/positive-impact-made-measure-fast-fashion/ https://www.fashionafricasourcingtrips.com/about/emerging-market-facts/ https://www.aspeninstitute.it/en/national-interest/article/africa-set-be-new-fast-fashion-factory-interview-maurizio-bussi https://wwd.com/fashion-news/fashion-features/bringing-affordable-fast-fashion-to-africa-1202775707/ https://www.businessoffashion.com/articles/global-markets/global-briefing-could-africa-be-the-next-frontier-for-fashion-retail https://ecowarriorprincess.net/2020/02/second-hand-clothing-threat-africa-textile-industry-not-all-bad/ https://www.fashionatingworld.com/new1-2/african-fast-fashion-may-swamp-ethical-fashion https://un-ruly.com/how-that-zara-top-you-bought-is-hurting-africas-economy/ https://www.unisa.ac.za/sites/corporate/default/Colleges/Agriculture-&-Environmental-Sciences/News-&-events/Articles/Fast-fashion-is-the-new-plastic

The COVID-19 outbreak continues to spread and disrupt lives, businesses, and economies worldwide, which forces organizations and individuals to embrace new practices of social distancing and remote working. While the world is focusing on the health and economic threats posed by the virus, cybercriminals are seizing the opportunity to increase their attacks. Cyberthreats are increasing day by day, affecting both individuals and businesses. With the continuous lockdown policies and social distancing measures, individuals tend to increase the use of the internet and digital devices for their daily tasks, such as shopping, payments, and other transactions that were previously completed offline. For organizations, cyber threats are mainly caused by work from home measures, which sees companies implementing customer-facing networks and employee access technologies for their workforce. Although several cybersecurity efforts were carried out, the organizations’ unpreparedness can still lead to cybersecurity misconfigurations. In some cases, employees might be using their personal computers to work with confidential data, which could also pose a cyber risk to the companies. According to data published by Trend Micro [1], their Smart Protection Network (SPN) detected nearly 9 million Covid-19-related threats from January to June 2020. These threats are mainly originated from emails, URLs, and malicious files. The attacks also tend to target the fear and the constant need for updates on the virus, for instance, sending emails that claim to have the latest statistics related to COVID-19 cases. Another global survey released by the Interpol Bureau [2] has identified four main cyber threats related to the COVID-19 pandemic: 1- Phishing scams, and fraud: with 59% of respondents who stated the significant increase of COVID-19 themed phishing and online frauds that consist of cybercriminals posing as global health authorities with relevant information 2- Malware and ransomware: 36% of respondents noted that malware attacks shifted their targets from small businesses and individuals to government agencies and healthcare organizations 3- Malicious domains: 22% of respondents noticed an influx of newly registered domains that include keywords such as COVID or Corona, claiming to have the latest updates and statistics 4- Fake news: 14% of respondents listed misinformation as a main threat since false information and rumors continue to be shared through social media networks Businesses’ cybersecurity efforts In light of these challenges, companies are improving their cybersecurity efforts to manage their business continuity and avoid significant data breach losses. One of the major technology applications used to achieve this is the Virtual Private Networks (VPNs), which help companies manage their remote workforces’ access to data and information, as well as monitor potential cyber threats and their impacts on the companies’ activities. Cybersecurity is also expected to become an urgent priority for businesses around the world, with a special focus on endpoint security technologies. Thus, leading the global cybersecurity spending to reach $270 billion by 2026. [caption id="attachment_5547" align="aligncenter" width="624"] Figure 1: Global cybersecurity spending forecast in US$ billion [3][/caption] Spending related to external security services purchased Internal spend refers to the compensation of in-house full-time equivalent employees Source: AustCyber report “The global outlook for cybersecurity” based on data provided by Gartner, Australian Bureau of Statistics, Burning Glass, expert interviews; AlphaBeta and McKinsey Analysis Insurance and cyber risk mitigation Cybersecurity measures are not the only way for businesses to mitigate cyber risks. Cyber insurance policies are used by large and small corporations to receive full coverage in case of a cyber breach or attack. Most cyber insurance policies include a broad array of coverages relevant to the current environment. Coverages protect the companies’ network security liability and privacy liability, as well as cover costs related to security response, data recovery and restoration, ransom event, reputational harm, system failures, and other types of repercussions that may cause business interruption. The cyber insurance market, while small compared to more mature lines of business, has grown steadily in recent years. According to Swiss Re, cyber insurance premiums doubled between 2016 and 2019 [4]. The demand pre-COVID-19 was mainly driven by a shift of the business models implemented by SMEs, which focused on increasing their e-commerce and digital capabilities. This digital transformation trend will most likely accelerate post-COVID-19, as companies of all sizes are trying to align with the new market realities. This will also contribute to the growth of the cyber insurance market, which is expecting a growth of 20% to 30% per year on average, to reach $12.3 billion premiums by 2023. [caption id="attachment_5548" align="aligncenter" width="465"] Figure 2: Global cyber insurance premiums in US$ billion [5][/caption] Cyber insurance policies provided to individuals Cyber insurance policies provided to companies (SME and Large corporations) Source: S&P Financial Services forecasts However, investments in cybersecurity technologies and applications remain the main tool used by organizations to mitigate their cyber risks, as cybersecurity spending continue to outpace spending on cyber insurance (as stated in Figure 3). [caption id="attachment_5549" align="aligncenter" width="569"] Figure 3: Global cyber insurance premiums in US$ billion [6][/caption] Source: Marsh and Microsoft report 2019 Global Cyber Risk Perception Survey; based on data from Gartner, Munich Re This trend is likely to continue in the cyber market due to the pandemic’s impact on the cyber insurance prices, which are on the rise as insurers try to limit their risk exposure in order to maintain suitable credit and capital strength and manage their deteriorating loss ratios and overall profitability. While cyber insurance policies can assist companies with costs related to data breaches and cyber-attacks, the preventive nature of the cybersecurity solutions, the expensive insurance premiums, and policy coverage limits (i.e. maximum payouts that companies can receive in case of a claim) are all factors that continue to impact the way organizations choose to allocate their cybersecurity budgets. Intissar Mounaji - Research Associate References: The study presents the data related to cyber threats detected by the Trend Micro Smart Protection Network (SPN) --- Securing the Pandemic-Disrupted Workplace: Trend Micro 2020 Midyear Cybersecurity Report The study presents a global survey conducts from April to May 2020, with data collected from 48 members countries and 4 INTERPOL private partners as part of the INTERPOL Global Cybercrime Survey --- COVID-19 Cybercrime Analysis Report- August 2020 The global outlook for cyber security https://www.swissre.com/reinsurance/property-and-casualty/reinsurance/cyber-reinsurance/reinsurance-a-growth-engine-for-cyber.html Cyber Risk In A New Era: Insurers Can Be Part Of The Solution 2019 Global Cyber Risk Perception Survey Sources: https://www.oliverwyman.com/content/dam/oliver-wyman/v2/publications/2020/apr/risk-journal-vol-9-2020.pdf https://www.mckinsey.com/~/media/McKinsey/Business%20Functions/Risk/Our%20Insights/Cybersecuritys%20dual%20mission%20during%20the%20coronavirus%20crisis/Cybersecuritys-dual-mission-during-the-coronavirus-crisis.pdf https://www.mckinsey.com/business-functions/risk/our-insights/covid-19-crisis-shifts-cybersecurity-priorities-and-budgets

A brief history of SEZ development in the world Special economic zones (SEZs) have been gradually gaining traction in the developing world over the last two decades. While modern SEZ development started decades ago in Europe and Asia, an increasing number of African countries have been developing SEZ policies and building SEZs in collaboration with internal and external players. Special economic zones (SEZs) are generally defined as demarcated geographic areas within a country where the rules of business are different from those used elsewhere in the country. The main differences are usually related to investment conditions, trade and customs, and the regulatory environment. The history of SEZs can be traced to the island of Delos in the Cyclades archipelago. Around 167 BC, Rome gave it “free harbor status” thereby turning it into a toll-free harbor which turned it into a center for Romans operating in Asia Minor. At the beginning of the 20th century, free trade zones were generally established near ports and by 1900, there were 7 free trade zones in Europe and 4 in Asia. In this period, SEZs started incorporating manufacturing plants such as the Cadiz SEZ in Spain which accommodated one of the first Ford Motors plants in Europe. China has been a leading country in terms of SEZ development and has leveraged its comprehensive SEZ policies to promote development. SEZ development in Africa SEZs were first introduced in Africa in 1970 in Mauritius and enacted its EPZ Act in the same year. Other countries including Ghana and Senegal started developing SEZ later in the 1970s. Accelerated development however started in the 1990s as more African governments sought to mimic the development of East Asian countries. [UNCTAD] There are currently over 230 SEZs in Africa and 200 single-enterprise zones. SEZs are present in 38 of the 54 countries in Africa with Kenya having the highest number at 61. Other notable countries are Nigeria with 38 SEZs and Ethiopia with 18 zones. [UNCTAD] [caption id="attachment_5536" align="aligncenter" width="440"] Figure 1: Number of SEZs in African countries, UNCTAD[/caption] African countries mostly focus on manufacturing and exports of low-skill, labor-intensive industries such as garments and textile. Nonetheless, certain countries are focusing on the inclusion of diverse sectors with higher value addition. Morocco for instance aims to integrate high-tech activities and the automotive industry within its SEZs, notably in Tangier’s Automotive City and Kenitra’s Atlantic Free Zone. [caption id="attachment_5537" align="aligncenter" width="696"] Figure 2: Number of SEZs by type in the world, UNCTAD[/caption] In 2013, Rwanda opened its Kigali Special Economic Zone to host several domestic and foreign firms in various sectors. Within three years, the zone was employing 2% of the entire country’s workforce. Unlike most SEZs, the Kigali SEZ does not provide tax incentives for firms operating in the zone. Instead, companies benefit from a strong and streamlined regulatory environment as well as improved infrastructure and trade facilitation. African SEZs have consistently ranked among the top SEZs in the Financial Times’ FDI Intelligence. In 2020, SEZs from Morocco, Mauritius, and Nigeria were included in the list of Global Free Zones of the Year Lessons from China’s experience: What can African countries learn China started developing SEZs in 1978 and currently has over 2,500 zones. Early development was focused on coastal cities (e.g. Shenzhen, Zhuhai, etc.) while later development was focused on the west of the country to promote regional development. China developed a wide range of SEZs including industrial development zones, free trade zones, and export processing zones. The development of SEZs played a significant role in China’s economic rise and are estimated to have accounted for 22% of national GDP, 46% of FDI, 60% of exports, and created over 30 million jobs With its focus set on improving livelihoods and providing job opportunities, China developed tailored SEZ programs for different regions depending on its specificities. For instance, one of China’s key success factors was its early focus on manufacturing and retail industries which absorbed a large unskilled labor force. African countries can benefit from China’s success story. First, by setting SEZ models adjusted to local circumstances instead of replicating existing models. For instance, China developed tailored SEZs that fully benefit from the local workforce, proximity to other manufacturing centers, and access to local markets. Another lesson from China is the long-term planning of SEZs based on quantified data and objectives and ensuring its fit within the country’s long-term development goals. China leveraged SEZs to grow local industries in a constraining environment thus overcoming local constraints such as its labor force’s qualification level, market demand, and other hurdles in its development model. As such, Africa countries need to ensure that SEZs fit within their respective development plans using careful and skilled planning. Throughout the development of its SEZs, China invested immense efforts in building sound infrastructure. The role of adequate and stable power, transportation links, and other infrastructural elements cannot be understated. In a study conducted by the World Bank of six African countries with another four non-African countries, it was found that downtime due to power outages was significantly higher in Africa. While financial hurdles can significantly impede infrastructure development, African nations can benefit from a PPP model to attract more private investors and thus over its hurdles. [caption id="attachment_5538" align="aligncenter" width="705"] Figure 3: Power outages in hours, World Bank[/caption] SEZs need access to a local labor force that is sufficiently skilled for its focus activities. By integrating “smart” incentives linked to the employment and training of its local labor force, Africa can benefit from SEZs to improve livelihoods and provide better outcomes for its working-age population. Another key element is the linkages to local universities and research centers. Through the successful partnership of the local research workforce with foreign investors, African researchers and scientists can benefit from the shared experience and the technology transfer that consequently occurs through the partnership. Morocco’s SEZ experience and lessons learned Morocco’s SEZs have consistently ranked in the top zones in Africa and the World. In 2020, the Tangier Med Zone ranked 2nd world economic zone after Dubai’s Multi Commodities Center in the Financial Times’ “FDI Global Free Zones of the Year 2020”. In order to understand Morocco’s success, we need to look at the history behind the developments of SEZs in the North African country. Morocco first enacted its SEZ law in 1995 which provided various incentives to foreign investors and started and established Tangier Med Special Agency (TMSA), its first dedicated SEZ authority in 2002. The zone was primarily focused on the automotive industry and engage the Moroccan Industry Association for Automotive Producers (AMICA) to focus on training and vocational development. By 2018, the six SEZs in the Tangiers area (which are all managed by TMSA) were hosting over 470 firms, having created 70,000 jobs with a total private industrial investment of USD 3.5bn. In addition, Morocco and China are currently planning a USD 10bn new industry-focused zone called Mohammed VI Tangiers Tech City which is set to create 100,000 jobs. Morocco has shown unwavering commitment towards the creation of high-quality zones instead of a high number of zones. By focusing its efforts on a limited number of SEZs, the Kingdom sought to create a suitable environment to attract full industry ecosystems by targeting large players in key sectors such as PSA and Renault in the automotive sector and Boeing and Bombardier in the aerospace industry. In 2016, Morocco amended the previous 1995 legislation and committed to creating new SEZs in all 12 regions. This new legislation aimed to create sector-oriented zones that interconnectedness between different firms operating the same zone. The new law is part of Morocco’s strategy to strengthen its manufacturing capabilities and is part of the Industrial Acceleration Plan launched in 2014. The impact of SEZs on Morocco’s industrial sector is noticeable as the sector has contributed 25% of its GDP by 2017, compared to an average of 19% between 1985 and 2016. Morocco further aims to increase the share of industry to 30% by 2022 and create an additional 500,000 jobs by 2020. However, SEZ development in Morocco is still in need of further improvement to ensure backward linkages with the local economy which suffers from similar issues found in other African nations. A lack of qualified workforce, limited provisions for local partner companies operating outside the SEZs, and limited options for local imports of finished goods. Another key aspect that needs to be examined is the tax system which may limit interactions between different companies within Morocco’s SEZs. Conclusion SEZs have shown considerable potential in African nations, and while many challenges lay ahead, these zones can play a tremendous role in the development of the African continent. Countries in Africa need to overcome many hurdles for their SEZ development and need strong and long-term strategies to unlock the potential of SEZs in their respective economies. It has already been demonstrated that SEZs can be a key part of industrial development in many nations, and Africa needs to harness the full potential of its SEZs as part of a successful transition to an industrialized and self-reliant continent. Anass Rifaoui - Research Analyst Sources: http://documents1.worldbank.org/curated/en/343901468330977533/pdf/458690WP0Box331s0April200801PUBLIC1.pdf http://www.cn.undp.org/content/dam/china/docs/Publications/UNDP-CH-Comparative%20Study%20on%20SEZs%20in%20Africa%20and%20China%20-%20ENG.pdf https://unctad.org/en/PublicationsLibrary/wir2019_en.pdf https://www.worldbank.org/content/dam/Worldbank/Event/Africa/Investing%20in%20Africa%20Forum/2015/investing-in-africa-forum-special-economic-zones.pdf https://www.econstor.eu/bitstream/10419/206420/1/1681095483.pdf https://www.policycenter.ma/sites/default/files/SEZ%20WEB%20FINAL.PDF https://oxfordbusinessgroup.com/overview/accelerating-growth-focus-clusters-special-economic-zones-and-investment-aeronautics-continue https://www.worldbank.org/content/dam/Worldbank/Event/Africa/Investing%20in%20Africa%20Forum/2015/investing-in-africa-forum-global-experiences-with-special-economic-zones-with-a-focus-on-china-and-africa.pdf https://www.fdiintelligence.com/article/78955

The global neo and challenger bank market is expected to reach $578 billion by 2027, at a compounded annual growth rate (CAGR) of about 46.5% from 2019 to 2027. However, these fintech firms are still flying under the radar, triggering the attention and interest of millions of customers worldwide. So, what are Neo-Banks, and what does the future hold for them? In the wake of the severe 2008 financial crisis, conventional banks, especially in western markets, witnessed a tremendous shock in customer trust, and are now in a constant process of change. This shift in trust has pushed customers to look for other alternatives that can substitute the traditional banks. Taking advantage of the increased internet and smartphone penetration, a new wave of alternative challenger banks emerged. These are what we call today ‘Neo-banks’. As the term suggests, this new form of banking is disrupting the financial services industry in various ways. Neo Banks are alternative challenger banks that offer banking services exclusively online. In other words, these fintech firms do not have a physical presence in brick branches. This means that all neo-bank business is conducted through digital means, such as mobile apps and online platforms. The concept of Neo-bank is new and originated about 5 years ago in the UK, however, they have shown tremendous potential for growth. Some leading banks are already on the right track to scale up. Nubank, the Brazilian digital bank is valued at $10 billion. The company has already raised $820 million throughout its 7 funding rounds and has already attracted 22 million customers in its home country alone. In Europe, the Berlin-based N26 raised $170 million in 2019, at the time it was valued at $3.5 billion. What is the driving force behind the neo-banking wave? The world we live in today creates a perfect environment for these firms to thrive. The following trends are driving their growth. Cashless Payments Trend: Although cash continues to play an important role in payments, emerging innovations are integrating with changing consumer preferences to drive a cashless trend. A prevailing shift toward technology and automation, mobility, and digitization has not ignored the financial services industry. Blockchain Technology Blockchain is being used continuously to decrease the overhead costs associated with authenticity validation. In addition, in areas such as financial reporting, compliance, centralized, and business processes, it will help financial institutions reduce expenses by more than 30 percent. Artificial Intelligence: With about 41 percent of financial companies planning to introduce it in the near future and 20 percent already using its strength, Artificial Intelligence remains a rising FinTech trend that paves the road for more advanced offerings Customers' preference for Mobile banking: For 60 percent of banking clients in the United States, mobile connectivity is one of the most significant features. 88 percent of all banking transactions will be via smartphone by 2022. Neo-Banks customer base keeps widening Neo-Banks have been attracting new customers at a mesmerizing rate. In the UK only, they have almost tripled the number of customers in 2019, going from 7.7 million in 2018 to nearly 20 million in 2019 according to Accenture, recording a growth rate of 150% that outpaces that of traditional banks. According to a report by AT Kearney, Neo-Banks in Europe attracted more than 15 million new customers in the period 2011-2019. Their customer base is expected to reach 85 Million by 2023. Pitchbook, the PE/VC data provider, believes that challenger and neo-banks are major players in the fintech space and have gained millions of customers in recent years. Pitchbook estimates that in 2020, the customer base will reach 60 Million in North America and Europe. They also expect this growth to continue at a CAGR of 25% through 2024, surpassing 145 million customers. Neo-Banks keep attracting VC/PE capital In Q3 2019, Neo banks have recorded an all-time high in Funding. A total of 21 Venture Capital and Private equity financing deals brought these banks around $1.74 billion of capital. In fact, they have raised more than $4 Billion in 2019 only, taking the total capital raised since 2018 to more than $5.5 Billion. As it is the case with most industries in 2020, the capital poured into these companies decreased to just above $1.3 Billion due to the uncertainty brought about by The Coronavirus pandemic. This came as a response to the remarkable business growth of Neo Banks being suddenly halted. Various reasons explain the sudden end to the growth of the market of neo banks. Because of the global lockdown, consumer spending decreased dramatically, as neo banks are mostly used as secondary accounts for unique purposes, they were especially hard hit. In addition, while neo banks are well prepared for a lockdown (being digital and operating remotely), they suffer from conventional banks' problems. However, Neo banks are far from being excluded from the financial sector despite the uphill struggle they are facing due to the crisis. Even conventional banks have gone down the road of digitalization, following the revolution initiated by fintech. In addition, the COVID-19 pandemic has underlined the need for digital banking. It is a likely scenario that the current crisis will push the financially weaker neo-banks to merge or leave, giving stronger banks their place to drive further growth. Challenges facing Neo-Banks It might seem that neo-banks as sailing smoothly towards becoming the new normal. However, they are facing fierce challenges that limit their potential. The following trends are among these challenges. Differentiators are becoming more and more blurred: Neo-Banks when they first appeared, they were selling themselves as the digital alternative to traditional banks, meaning that they are the best at Mobile and App-based banking. However, traditional banks today offer equally good online banking services on top of their physical presence, eating into what once differentiated neo-banks. Big well-established banks are offering Neo-Banking alternatives: Traditional banks have been witnessing the speed at which neo-banks have been scaling up lately, so they decided to lunch their own, making the market more crowded and competition even fiercer for the startups. Their service offerings are limited when compared to their traditional rivals: They do not offer all the services of a traditional bank and are still unable to measure up, not only because of service delivery or regulatory problems but also for lack of capital. Sacrificing profitability to build a large customer base: In their quest to attract more customers, many banks found themselves sacrificing profitability. Attracting customers with market-leading rates, small to no ATM fees, and above-average interest on savings certainly comes at a cost. This is certainly the case with shared economy giant Lyft that has been losing money since its inception. Lyft operates in a 2-sided marketplace, and it is a difficult place to be in, as the company must ensure that both demand (riders) and supply (drivers) are secure. The methods that Lyft uses to balance its marketplace (discounts, deals, and incentives) can be accounted for in two ways: revenue decreases, or increase in sales and marketing costs, and both of these severely impact the bottom line. Neo-Banks still have a tremendous potential to explore in the coming years, the rise in mobile and internet penetrations is to create the right infrastructure for their thriving. The increased use and trust in AI and blockchain will take advantage of that infrastructure to drive the growth of neo banks, and protentional lead to a radical shift to the way we do banking. However, pressure from competition and the well-established banking sector represent serious challenges that need to be navigated cautiously. Othmane Moustahsine - Research Analyst Sources: https://www.finsmes.com/2020/03/what-are-neo-banks-and-how-will-they-shape-the-future-of-finance.html https://thepaypers.com/expert-opinion/the-inevitable-neobank-spring-and-its-drawbacks--780575 https://gomedici.com/neobanks-global-deep-dive https://www.businessinsider.com/revolut-triples-valuation-after-latest-funding-raise-2020-2?r=DE&IR=T https://newsroom.accenture.com/news/uk-neobanks-near-20-million-customers-in-2019-but-customer-and-deposit-growth-rates-slow-according-to-research-from-accenture.htm#:~:text=Accenture's%20Digital%20Banking%20Tracker%20found,banks%20and%201%25%20for%20incumbents. https://gomedici.com/neobanking-2-0-global-deep-dive-2020-report-by-medici https://www.wpp.com/wpp-iq/from-bricks-to-clicks---the-rise-of-the-neobanks https://wup.digital/blog/neobank-threat/ https://blog.prototypr.io/10-ways-neobanks-set-themselves-up-for-success-7c1f8f7118c3 https://www.crowdfundinsider.com/2020/03/158428-global-neobank-and-challenger-bank-market-is-projected-to-surpass-578-billion-by-2027/ https://techcrunch.com/2020/10/02/which-neobanks-will-rise-or-fall/ https://techcrunch.com/2020/03/03/valued-at-10b-nubank-launches-its-nu-credit-card-in-mexico/ https://techcrunch.com/2020/05/05/n26-raises-another-100-million-in-series-d-extension/ https://bfsi.economictimes.indiatimes.com/news/fintech/what-are-neobanks/76128857 https://fincog.nl/blog/18/performance-of-neo-banks-in-times-of-covid-19 https://www.acuitykp.com/blog/can-neobanks-survive-the-covid-19-crisis/

What is globalization and its impact There is no doubt that globalization is a phenomenon that has changed the world as we know it for the better. International cooperation touches all of our day-to-day aspects, including food, transportation, leisure, even information; the world as we know it today would have been very different without this crucial global aspect. Even in times of crisis, the world stands together and acts for the greater good; with one of the most recent examples, the coronavirus vaccine that was discovered and distributed thanks to the international scientific cooperation. However, the alter-globalization movement sees some major flaws in this system, and some important changes need to take place in order to ensure a better application of this process in this interconnected world. Today, we live in a world where access to information, goods, and services are literally at our fingertips; a world in which mobility and trade flows have never been higher. There is no denying that today’s world is one of interconnectivity; where the activities of countries, individuals, and companies are constantly intertwined. With this increasing interconnectivity, comes interdependence; and economic globalization is basically the interdependence of the different parts of the world’s economy as a result of the rapid growth of international trade of goods and services (figure 1), the flow of international capital, and the rapid spread of technologies and knowledge-sharing methods. The expression “the world is a small village” has never been closer to reality. [caption id="attachment_5513" align="aligncenter" width="478"] Figure (1): Evolution of world merchandise trade 1950-2019, WTO[/caption] Since the second world war, the international system was shaped by the then-formed alliances that lasted beyond the conflict. Globalization was seen as the cure for the nationalist movements that fueled World War II. International organizations such as the United Nations (UN), the World Bank, and the International Monetary Fund (IMF) emerged on this new global economic scene, even before the war had ended; followed by supra-national regional entities such as the European Union (EU). The global economy was witnessing the creation of its newest and biggest players – multilateral organizations. However, during the last couple of years, the world has witnessed the rise of movements that are rejecting some aspects that created the foundation of this globalization. The sudden upsurge in populist groups, separatist movements, and nationalist activities clearly indicates that there are some rules and consequences of the globalization game that several groups and countries are rejecting. From that perspective, we can say that globalization is not just a borderless world in which goods, services, mobility, information, and capital are accessible for everyone, everywhere; there is an unjust and an unfair aspect of this era-defining process. Hence comes the following question: how can globalization become a double-edged sword; and is there a better way of coping with it? The price of globalization: who sets the rules? In theory, globalization speculates that the world should be working together on different fronts, to achieve common social, political, and economic goals. Nevertheless, some countries are more influential than others, based on several factors that contribute to their overall status and that create what we may call – for simplicity reasons – a hierarchy between them. Whether they are labeled as first, second, and third world countries, or developed, developing, and underdeveloped countries, the international system is not a system in which all countries have the same weight. International organizations today give specific countries more power than it accords to other ones: take the UN’s Security Council for example, with the veto power solely bestowed on its 5 permanent members. In a world of 193 UN member-states, 5 countries are able to dismiss any decision they deem inadequate. [caption id="attachment_5514" align="aligncenter" width="520"] Figure (2): Number of vetoes used between 1946 till today, UN Library[/caption] Today, people of the world share many things in common thanks to the internet, social media, international travel, and many other platforms. One thing that is also shared is culture, something that never existed before: one international and globalized culture. Kids around the globe would recognize characters such as Mickey Mouse, regardless of their countries of origin, social class, and education. While in theory, this is not a negative point, however, if it comes at a price in which this newly formed global culture replaces indigenous ones, it becomes a cultural threat. Some things that may seem mundane, such as beauty standards and the way of dressing, are affected by the Western understanding of it. That is why anti-globalism activists claim that American television highlights Western notions of beauty and different lifestyles that may not be entirely coherent with local cultures. [caption id="attachment_5515" align="aligncenter" width="577"] Figure (3): International tourist arrival by world region 1950-2018, Our World in Data[/caption] This brings us to another point, which is international travel, a major contributor to the planet’s carbon emissions that produces 8% of global emissions. Similarly, the outsourcing of pollution is on the rise due to globalization, as some countries – mostly developed ones – in their efforts to reduce their CO2 emissions, send their most polluting industries abroad. Britain was able to reduce its domestic emissions within its borders by one-third between 1990 and 2015 but has done so by relocating its energy-intensive industries abroad. Reports estimate that 25 percent of the world’s total CO2 emissions are now being outsourced in this manner[1], particularly since wealthier countries that are supposedly reducing their emissions, such as Japan and Germany, are in fact doubling or tripling their outsourced emissions to China and other developing countries. Therefore, by including the “outsourced” CO2 emissions produced by industries affiliated with developed countries located in poorer countries, it is obvious that their total emissions have not decreased and did in fact increase[2]. This is only possible due to the current global system that creates an international production chain where the most polluting steps of industrial production can be set up in foreign countries that are more in need of international investments. This globalized production chain is also linked to international inequality in the cost of labor. Some countries tend to have cheaper labor than others, which allows companies (usually from high-cost and developed countries) to adopt a low-cost country sourcing strategy, which allows them to have access to a cheaper labor force in other countries (usually low-cost developing countries) Finally, it seems that this globalized system is self-sustained, since the international organizations that created it also enforce the “rules of the game”. In fact, the globalized system of aid and development – whereby multilateral and bilateral donors provide loans and grants for less-developed countries- also impose neo-liberal policies in return for this assistance. Through this quid pro quo process, one could say that rich countries force the governments in the rest of the world to adopt less restrictive economic policies such as liberalizing global trade, decreasing subsidies to local industries, and allowing more space for the private sector to grow. The stability and continuation of the globalized system is therefore ensured by the very existence of international organizations. Conclusion So, what can be done? A simple question that requires a very complicated answer. Ironically, it seems that the best way to cope with the side effects of globalization is through more globalization. It is an undeniable fact that the world is much better thanks to international cooperation on so many fronts that serve the planet as a whole, as mentioned earlier with the coronavirus vaccine. Just like it was with the invention of plastic and the discovery of fossil fuel, the world was mesmerized by this groundbreaking invention, and its thousand uses, but was unaware of its catastrophic side effects on the environment. The timid rise of the alter-globalization movement shows that the world needs to work together, to come up with a fair and just system that integrates countries and individuals, not separate them; an inclusive system in which decisions are collectively made and not imposed. A world in which labor protection, environmental protection, civil liberties, and the protection of indigenous cultures are taken into consideration. The question is, in our lifetime, will we ever see such a system? Sources: Economic Globalization – A Double-Edged Sword, Rethinking Prosperity (link) It’s Not Only Necessary to Develop an Alternative to Globalization — It’s Entirely Possible, Foreign Policy in Focus (link) Globalization and its Alternatives: A View from India, IUCN (link) An alternative view of Globalization 4.0, and how to get there, World Economic Forum (link) Growing Market Offers Huge Potential — but Also Peril : Globalization's Double Edge, New York Times (link) World Trade Organization (link) United Nations (link) Our World in Data (link) The Carbon Loophole in Climate Policy, Daniel Moran, KGM & Associates, Ali Hasanbeigi and Cecilia Springer, Global Efficiency Intelligence, August 2018 (link) Mapped: The world’s largest CO2 importers and exporters, Carbon Brief, 5 July 2017 (link) [1] The Carbon Loophole in Climate Policy, Daniel Moran, KGM & Associates, Ali Hasanbeigi and Cecilia Springer, Global Efficiency Intelligence, August 2018 (link) [2] Mapped: The world’s largest CO2 importers and exporters, Carbon Brief, 5 July 2017 (link)

[caption id="attachment_5481" align="alignright" width="328"] ‘Telesphere Mask’ The first VR headset patented in 1960[/caption] Augmented reality (AR) and Virtual reality (VR) are two emerging technologies, with the first prototypes developed in the 1960s, they are evolving now at an increasingly fast pace to become a daily used technology. In recent years, over 75% of Forbes’ “World’s Most Valuable Brands” have been involved in some form of virtual or augmented reality experience for customers or employees or are themselves innovating and developing these technologies. The investment is expected to increase rapidly in the coming few years, after the Covid-19 pandemic, where AR & VR proved to be useful in many areas such as medical diagnoses and remote learning, among others. [caption id="attachment_5483" align="alignright" width="550"] Panasonic’s VR Ultra HD Eyeglasses released 2020[/caption] Augmented reality (AR) is an interactive, reality-based display environment that takes the capabilities of the computer-generated display, sound, text, and effects to enhance the user's real-world experience such as in the mobile game Pokémon Go and Snapchat’s filters. Whereas Virtual Reality (VR) uses computer technology to create a wholly simulated environment. VR places the user inside an experience with the help of a headset in contrast to AR which maps holograms over real, physical space through the help of eyeglasses. While AR/VR technologies have been around for a while, their use was hampered by the lack of supporting technologies such as fast internet, HD display, and content to display. The increase in penetration of smartphones, connected devices, and the 5G network, opens a new horizon for commercial and scientific applications. [caption id="attachment_5484" align="alignright" width="473"] AR Prototype eyeglasses under development[/caption] The technology was patented in the 1960s, and the first real VR headsets were first introduced by video game companies in the 1990s and took a huge leap in the 2010s with the introduction of HTC (Vive), Sony (PlayStation VR), and Oculus (Rift) – a Facebook company, marking the start of the technology’s commercial use. While VR still holds the larger market share over AR, a survey by Perkins Coie in 2019 on 200 technology leaders showed that 70% of the participants anticipate that the AR market will surpass the VR market in revenues, within 3 – 5 years. Market size Together VR and AR had a global market value of $10 bn in 2018, $19 bn in 2020, and forecasted to reach $31 bn by 2023. The United States has 60% of the total AR/VR businesses in the global market, however, this will soon change. For example, China has been acquiring majority shares in emerging AR/VR companies since 2019. North America’s market share is followed by Western Europe then APAC Regions. The APAC region is set to witness the highest growth forecast. The growth of the VR/AR market is still dependent on the development of complementary technologies such as 5G and hardware required to make AR/VR glasses. Main sectors and Covid-19 effect Integration of different technologies like the Tely360's Ambulance 3rd Eye module, used with the Vuzix Blade, aids in the communication between healthcare personnel working in isolation rooms and physicians outside the room or even in remote places. This system allows the physicians to see and hear what is going on with the patient in the isolation room in real-time. As such, physicians can provide appropriate and timely directions. The sectors [caption id="attachment_5486" align="alignright" width="375"] Anatomy professor using AR to teach her class during the Covid-19 outbreak[/caption] currently investing the most in the AR/VR technologies are Healthcare, Military, Retail, Industrial products, Technology, Logistics, Media & Telecomm, and Gaming. Healthcare is one of the most prominent sectors to benefit from AR, with many applications already on hand and new opportunities are rising because of the Covid-19 situation. Chinese startup “Rokid” is already commercially selling its Glass T1 Thermal glasses, equipped with an infrared sensor and a camera, the glasses allow the wearer to “see” several peoples’ temperatures simultaneously in different colors, such as green (non-alert) and orange (alert). Another example is Vuzix Blade® Smart Glasses a pair of AR glasses developed in Thailand for telehealth, specifically in the care of COVID-19 patients. Furthermore, AR is also used to assist medical professionals by providing highly efficient and interactive training methods that can streamline the process of learning. Innovations from Microsoft’s HoloLens and the HoloAnatomy augmented reality software at Case Western Reserve University are used to help 185 medical students learn from home. Another key capability of AR is the ability to overlay a digital virtual user interface on a physical surface. The user can, select actions by tapping on the virtual screen, use hand gestures or verbal commands to interact with the equipment. The provision of such distant interactions is key to reducing the amount of touching required by physical objects that may be used by numerous people. Most museums and other cultural institutions have made virtual tours of their exhibitions available which allows members of the public to experience them from the safety of their homes. Other sectors investing in AR include Logistics where big players are integrating AR into their process to optimize the logistics planning, process execution, and transportation. DHL has recently tested AR smart glasses with its client Ricoh and reported a 25% increase in performance. In Retail, AR/VR is being developed more to be part of daily life. AR/VR can be used to make the consumer able to see how clothes look on them without physically trying them. More examples of how AR/VR are changing the retail sector is the Microsoft and Volvo partnership, where consumers can configure cars at a dealership using HoloLens and Ikea’s new technology which allows customers to see how furniture will fit into their houses without physically trying them. With a new interest in home entertainment of all kinds, it is a great opportunity for creators of AR/VR systems to promote their products and they are not missing the chance to do so. The gaming industry has been the pioneer in [caption id="attachment_5489" align="alignright" width="320"] Pokémon Go was the first mainstream game to offer an AR experience. It allows users to see characters bouncing around in their own town and reached more than 20 million people per day[/caption] developing AR/VR, video games were the first to introduce commercial VR headsets in the 1990s and Pokémon Go was the first mainstream game to offer an AR experience, marking the real start of AR’s commercial use where more than 20 million people per day used the Pokémon GO app in 2016. Key market players include giants like Apple, Microsoft, Sony, Samsung and Google are expected to introduce some of the big breakthroughs in AR in 2021-2023. Emerging startups such as Immersion, Magic leap, and Daqri are gaining more market share through new technologies and applications they produce Investment Opportunities Major corporations are now attempting to acquire companies that operate in the AR and VR industry. Such acquisitions strengthen their R&D capabilities and market positioning. Recently the biggest investment in AR/VR encompassed the investment of $280 million in “Magic Leap” in April 2019 by “NTT DoCoMo” Japan’s biggest cellphone service provider; raising Magic Leap total raised investment to $2.3 billion total. Apple invested $200 million in Corning International in September 2019, also Niantic's $245 million funding round, tech company Vayyar closing a $109 million Series D round and RealWear’s $80 million investment round. Below is an example of the VR/AR activities by big names Brand VR/AR Sample Activity Apple Won a patent for a VR headset and continuing to develop for commercial use Microsoft Created HoloLens, an augmented reality headset Google Created Google Cardboard, an inexpensive viewer that turns a mobile phone into a VR experience Coca-Cola Created a VR experience for the 2014 World Cup IBM Obtained patents on virtual universes and augmented realities Samsung Created Samsung Gear VR headset Toyota Implemented distracted driver simulation in VR at the New York International Auto Show Facebook Created Oculus VR Headset Disney Investing in Jaunt VR Amazon.com Obtained patents for an AR headset BMW Developing VR goggles to help drivers park by helping them see through the car Intel Created a VR camera Wal-Mart Obtained a patent for virtual reality shopping system Verizon Created a NFL VR experience Honda Created a “Dream Drive” VR simulation SAP Created a VR conferencing event Pepsi Implemented a VR ad campaign at bus stops in London Yehia El Ghandour - Senior Associate Sources: https://www.forbes.com/sites/forbesagencycouncil/2016/08/15/how-virtual-reality-can-revolutionize-digital-marketing/?sh=269d50b45f5e https://www.hypergridbusiness.com/2015/10/75-of-top-brands-have-vr-projects/ https://www.vrs.org.uk/virtual-reality/history.html https://na.panasonic.com/us/news/panasonic-develops-worlds-first-hdr1-capable-uhd-vr-eyeglasses https://www.reuters.com/article/us-health-coronavirus-china-detection-gl/chinese-startup-rokid-sees-opportunity-with-covid-fighting-smart-glasses-idUSKBN22D4TQ https://link.springer.com/chapter/10.1007/978-3-030-60117-1_34 https://www.prnewswire.com/news-releases/vuzix-blade-smart-glasses-now-used-for-covid-19-patient-care-in-thailand-via-tely360s-ambulance-3rd-eye-301035208.html#:~:text=Tely360's%20Ambulance%203rd%20Eye%20module,other%20room%20in%20real%20time. https://thearea.org/covid-19-how-augmented-reality-is-helping-mitigate-business-impact/ https://next.reality.news/news/25-biggest-ar-investments-2019-0214998/ https://www.mordorintelligence.com/industry-reports/augmented-reality-market https://www.fortunebusinessinsights.com/augmented-reality-ar-market-102553 https://9to5mac.com/2019/10/21/apple-ar-headset/ https://www.statista.com/statistics/591181/global-augmented-virtual-reality-market-size/ https://www.gminsights.com/industry-analysis/augmented-reality-ar-market https://www.newgenapps.com/blog/augmented-reality-apps-ar-examples-success/ https://www.bloomberg.com/news/articles/2020-03-11/augmented-reality-startup-magic-leap-is-said-to-explore-a-sale

The real estate market in the United Arab Emirates features some unique attributes compared to its equivalents in the other countries of the region. This is mainly because UAE is a temporary home for a vast number of expats compared to the nationals which in turn affects their preferences and consideration when it comes to choosing a residential place. For example, while it is a common practice for residents of the region to think of buying an apartment as an investment hedge against inflation or as an asset for the future generation, this is not very common in the UAE since expats believe that sooner or later they will leave the country and go back to their home country and also other main factor that the residential supply is not all accessible to buy by foreigners, the property ownership for expats is available in two categories leasehold and freehold in certain regions. These factors affect the demand in the country in general. Even before the pandemic, the oversupply in Dubai & Abu Dhabi has posed a threat to the prices in the real estate sector whether in the residential sector or the office sector. According to a report by Deloitte, average sales prices for residential property in Dubai declined by approximately 7% between Q3 2018 and Q3 2019. Average rents also declined by approximately 9% over the same period, as the average price per square feet for apartments fell from AED 1,178 in 2018 to AED 1,090 as of September 2019. Meanwhile, in Abu Dhabi, there was an average slump of 8.7% over a 12-month period with villa rents falling by 8.4%. Has the sector been affected so far? The oversupply problem in UAE and especially Dubai worsened with the spread of COVID-19. In February 2020, Knight Franck stated that a total of 62,500 residential units are scheduled to be completed this year, which would be the biggest number of new units since 2008. In addition, Moody’s assumed that it is expected the pandemic to further slow home sales and lower rental prices in a market that was still suffering from persistent imbalances. According to real estate and investment management firm JLL, the UAE’s property market continues to be tenant-friendly in Q3 2020. The residential sector recorded an increase in construction activity with around 12,000 units handed over in Dubai and 600 units handed over in Abu Dhabi, JLL expects developers to continue offering a range of incentives and subsidies such as fee waivers, discounts, rent-to-own, as well as partnerships with banks to attract new investors and end-users looking to take advantage of the lower prices. In the UAE, homeowners have become more optimistic on the outlook for residential real estate in the coming 12 months as per the Peninsula sentiment survey. At the end of Q3 2020, 50% of homeowners responding to the survey reported that they expect home prices to be stable or increase in the next 12 months. Sensibly up from the 41% recorded only one trimester before. In particular, 33% of UAE homeowners expressed their belief that home prices will increase in the next 12 months, up from only 11% of respondents in Q2. Trend after the Pandemic: In the unpredictable times of Covid-19, both optimistic and pessimistic outlooks were shared on how pandemic will shape the real estate industry in the UAE. However, both types of projections asserted that modernity and inclusivity will be part of the new trend in the sector. Especially with the crisis due to the excess of offer, taking into account the below insights could help the developers to stand out from the competition: A. Renters/buyers will prioritize mixed-use developments when thinking of renting/buying an apartment Residents are now more prone to choose an apartment in a place where there is a mix of commercial and educational facilities to avoid going to crowded places. B. Renters/buyers will refurbish their tastes when it comes to renting/buying an apartment The pandemic has forced many people to work from their homes, which then need changed from the pre-Covid setup. For example, more and more people would now choose homes that are soundproof or that have a space for exercising. C. Residents will opt for lower density properties Covid-19 brought out the risk that high-density property could have on residents. Hence, it is believed that developers will start considering designs that maintain new distancing standards. D. On a medium- long term, the preference of a well-aired office space will be on the rise According to CBRE, buildings are currently required to comply with a minimum of 20% fresh air intake, while some choose to exceed this requirement by going up to 30%. However, this is bound to change as businesses will prioritize office spaces with good indoor air quality and ventilation. Loay Sherine - Senior Analyst Sources: https://www.constructionweekonline.com/business/265702-lootah-ceo-shares-top-5-trends-to-transform-uae-real-estate-market http://cbre.vo.llnwd.net/grgservices/secure/How%20COVID%20is%20changing%20office%20design.pdf?e=1595837891&h=0608113c7dee3f8d62c0c6cddc611d30 https://www.bayut.com/mybayut/property-ownership-rules-foreigners/ https://www.peninsula-reh.com/wp-content/uploads/2020/11/HomeSentimentSurvey-Q3-2020-FullReport.pdf https://www2.deloitte.com/content/dam/Deloitte/xe/Documents/realestate/me_real-estate-predictions_dubai-2020.pdf https://news.residentialpeople.com/knight-frank-residential-oversupply-in-uae-causes-market-stagnation-1485/ https://english.alarabiya.net/en/business/markets/2020/02/11/Dubai-s-oversupplied-property-sector-to-add-more-new-homes-in-2020 https://www.nasdaq.com/articles/coronavirus-to-exacerbate-dubai-chronic-property-oversupply-moodys-2020-07-20

According to a new report by Novartis Foundation and Microsoft, investment in data and artificial intelligence (AI) will be a key tool for improving health systems during and after the COVID-19 pandemic in Africa. Released on September 9, 2020, the report "Reimagining Global Health through Artificial Intelligence: The Roadmap to AI Maturity"[1] concludes that low-income countries may soon outperform high-income states in the adoption of AI-based health technologies. It also points out that African countries could be the fastest adopters of AI-based health technologies due to the lack of existing systems. However, it also warned that these countries stand to lose the most if governments don’t seize this opportunity and invest more in AI. According to the 2020 Partech report, the health technology sector attracted 189 million dollars to Africa during 2019 which is equivalent to 9.3% of the total amount allocated, all sectors combined, to startups operating in Africa. This amount represents a growth of +969% compared to 2018. Hence, the health technology sector is not only growing but also mobilizes significant financial capital. Strengths driving AI adoption in Africa Technologies such as mobile trading platforms, e-banking, e-commerce and even Blockchain applications have often been adopted faster and more comprehensively in low and middle-income countries than in high-income countries, and health technologies are likely to follow the same trend, the report said. In addition, a major advantage for low-income countries is their exemption from the difficulties now faced by rich countries. Rich countries already have different types of data hosted by systems that are not always able to communicate, whereas they need to be interoperable[2] to be "effectively" used for AI. The opportunity therefore lies in the fact that low-income countries, not yet having these different systems, can once and for all develop a single ecosystem so that all data systems have the same structure and are interoperable. However, there are several constraints and challenges that must be addressed by the African continent in order to take advantage of the emergence of the digital in general and AI in particular in the health system. Pain points hindering AI adoption in Africa The lack of medical personnel is the primary challenge facing the African continent. Currently, sub-Saharan Africa accounts for 12% of the world's population but faces 25% of the world's disease burden, while housing only 3% of the world's health workers. This is expected to worsen with a projected global shortage of health workers estimated at 18 million by 2030. In addition, the lack of data storage infrastructure available to health facilities represents a barrier to the rapid adoption of AI in the health sector. Thus, African governments need to put in place policies that promote data acquisition readiness and investment in AI development infrastructure such as data centers. AI as a driver for rebuilding health systems Many African countries are poorly prepared to deal with a new emerging disease such as Covid-19, in addition to the current burden of infectious diseases and the ever-increasing tide of chronic diseases. AI is therefore coming to rethink archaic health systems by shifting from reactivity to proactivity and then to prediction and even prevention. To successfully implement AI, a whole sustainable ecosystem must be developed to ensure equity and access to healthcare services for all. As healthcare systems rebuild during the pandemic, technological innovation must be at the heart of the agenda. Below are examples of companies leveraging the power of AI in the health sector across several African countries. This shows that the continent is building and developing a strong AI startup ecosystem for the healthcare sector. Nigeria: Nigerian startup Aajoh uses artificial intelligence to help individuals that send a list of their symptoms via text, audio and photographs, to diagnose their medical condition. The business was launched in 2015 and allows personalized medical diagnosis and treatment through predictive analytics. Founded in 2012, Ubenwa developed an AI app that analyses a baby’s cry to give warning signs of asphyxia, which is the third leading killer of infants worldwide. This machine learning tool provides instant diagnosis of birth asphyxia based on 1,400 pre-recorded baby cries that are analyzed by looking at factors such as amplitude and frequency pattern. Ghana: Founded in 2016, Minohealth introduced an innovative Medical Health System to democratize duality healthcare with AI for medical diagnostics, Cloud Medical Records system for hospitals, health ministries and patients, and big data analytics for health. Kenya: AfyaRekod is a digital health data platform that focuses on the patient and allows health facilities to capture, store, have real-time access and mobility of the patients’ health data. Developed as a patient driven platform, the patient maintains the sovereign right of ownership to their health data. The platform leverage AI and various blockchain modules to make insightful data driven decisions that allows doctors to provide better healthcare for patients. Rwanda: Though headquartered in California, Zipline operates in Africa leveraging drowns in order to to deliver blood to transfusion centres in remote areas. The team are delivering fresh blood and medicines to hard-to-reach rural areas across Rwanda daily. Zambia: Founded in 2017, Dawa Clinic is an Artificial Intelligence-based web-mobile platform which is aimed at facilitating remote healthcare service for pregnant women and early mothers. The App works with a self-monitoring kit that empowers mothers to receive remote maternal health. Through the App, mothers are able to monitor parameters like blood pressure, Urinary Tract Infections (UTIs), blood sugar levels, and other pregnancy-related complications. The information is wired remotely to a doctor for early intervention in case of any complications. Tunisia: SPIKE-X is a startup specialized in AI offering intelligent software packages that provide decision support solutions allowing to better understand, predict and influence human decision making of large groups and populations. SPIKE-X is a leader in innovative quality healthcare, e-Health and m-Health, and, Intelligent Security such as Intrusion Detection System, Access Control, Automatic Number Plate Recognition (ANPR) and Retail Analytics. For the healthcare sector, the company’s solutions help in Breast Cancer Detection, Skin Cancer Detection and Alzheimer Disease Classification. Examples of AI use during the COVID-19 era Rwanda: Rwanda probably has the most connected health system in Africa. The country has a virtual consultation service with over two million users, one third of the adult population. In March 2020, the Rwandan government and the private actor Babylon Health, operating in the East African country under the name babyl, entered into a ten-year partnership to give every Rwandan over the age of 12 access to digital health consultations. The consultations are paid for by the Mutuelle de Santé, the government's community health insurance scheme. The new partnership will also see the introduction of a platform for triage and verification of symptoms, powered by AI. Guinea: In Conakry, Tulip Industries, a startup created by Mountaga Keïta and specializing in technological innovation, is another example. Named "Health Scan", the startup has designed this tablet able to detect the symptoms of Coronavirus. The device is equipped with a thermal camera and sensors that measure a patient's body temperature, blood oxygen level and heart rate. According to the designer, Health Scan helps to better target the hottest part of the body and to obtain more reliable data than the thermo flashes commonly used on the forehead. This information is stored in a local database and artificial intelligence comes in to federate this information and try to draw inferences to help doctors better determine if the patient needs respiratory assistance upon arrival at a health center. Kenya: Launched in 2017, Tambua Health arms medical practitioners with an app that helps doctors and health practices spend less time and money diagnosing and treating cardiopulmonary diseases using lung and heart sounds analysis through machine learning. During the covid-19 pandemic, Tambua Health invents a patent-pending technology called T-sense. T-sense generates images of lungs by detecting the vibration of sound as air moves in and out of the lungs. It is able to do this by using sensor arrays placed on the back of the patient. With these sensors, T-sense can generate dynamic images of the lung like this using sound imaging. Using spatial distribution algorithms that have been trained from the company's proprietary database of lung sound images, Tambua's T-sense can detect healthy and unhealthy lungs with a high degree of accuracy. Egypt: Rology is a startup of the AUC Venture Lab (V-Lab), Egypt’s first university-based accelerator. Established in 2017, it is an on-demand teleradiology platform solving the problem of radiologist shortages and high latency in medical reports through artificial intelligence by remotely and instantly matching cases from hospitals with the optimum radiologist. Rology operations follow three main steps: upload, match and report. the hospital uploads the patient’s medical images onto the system. Based on the first auto analysis, Rology then matches the scan with the optimal radiologist, depending on availability and subspecialty. Afterward, the radiologist writes the final diagnostic report and sends it back to the hospital through a quality control process. During the COVID-19 pandemic, Rology helped solving the problem of shortage of radiologists, by proposing a diagnosis of Covid-19. In short, artificial intelligence will help bridge the gap in Africa's health systems. However, its use cannot substitute for the development of effective health infrastructures and the setting up of strict systems and protocols for examination and monitoring. It is also important to keep in mind that secure and privacy-friendly data governance must be part of ensuring a sustainable AI-based infrastructure. Finally, the countries that will fare best will be those that combine a good level of medical infrastructure with innovative technological solutions ! [1] The report "Reimagining Global Health through Artificial Intelligence: The Roadmap to AI Maturity" was authored by the Commission on Digital and AI in Health, created in 2010 by the International Telecommunication Union (ITU) and UNESCO to expand broadband access to accelerate progress towards national and international development goals, and jointly led by the Novartis Foundation and Microsoft. [2] Data interoperability is the ability of systems and services that create, exchange and consume data to have clear, shared expectations for the contents, context and meaning of that data. Safae Laghmari - Senior Research Analyst Sources: https://www.scidev.net/afrique-sub-saharienne/technologie/actualites/l-intelligence-artificielle-dans-le-secteur-de-la-sante-en-afrique-28092020.html http://french.peopledaily.com.cn/Afrique/n3/2020/0914/c96852-9760056.html https://www.broadbandcommission.org/Documents/working-groups/AIinHealth_Report.pdf https://www.agenceecofin.com/homepage/0909-80001-l-adoption-des-technologies-dans-la-sante-pourrait-aider-les-pays-pauvres-a-depasser-les-riches-dans-lacces-aux-soins https://www.chinadaily.com.cn/a/202009/10/WS5f5a1ebba310f55b25a81cdd.html https://www.rfi.fr/fr/podcasts/20200915-l-intelligence-artificielle-service-la-m%C3%A9decine-en-afrique https://www.agenceecofin.com/entreprendre/1609-80257-guinee-mountaga-keita-a-concu-une-tablette-capable-de-detecter-les-symptomes-de-la-covid-19 https://camerounactuel.com/2020/09/09/sante-a-base-de-lintelligence-artificielle-une-chance-pour-les-pays-a-faible-revenu/ https://cio-mag.com/e-sante-guinee-tulip-industry-des-ordinateurs-debout-adaptes-a-lafrique/ https://capecameroun.org/la-tech-africaine-se-mobilise-contre-le-covid-19/ https://auctoday.com/2020/03/31/roll-out-the-radiologists/ https://www.lepoint.fr/afrique/covid-19-l-afrique-sur-la-carte-mondiale-de-l-innovation-23-04-2020-2372639_3826.php https://www.mei.edu/publications/rethinking-egypts-economy https://www.alliance4ai.org/companies/https://clevva.com/press-release/6-artificial-intelligence-startups-africa-look/ https://medium.com/alliance4ai/ai-generation-learnings-from-alliance4ais-first-100-startups-in-africa-acfba0f753d1 https://www.distrelec.de/current/en/engineering/companies-robotics-ai-make-lives-better-africa/ https://www.leconomiste.com/article/1063657-technologies-de-la-sante-le-maroc-leader-et-futur-hub-en-afrique https://www.nydc.gov.zm/tafadzwa-kalisto-munzwa-dawa-clinic-co-founder/ https://www.future.africa/home/tambua-health

The COVID-19 pandemic brought an unprecedented challenge for the global economy. Countries are leveraging all resources available to deploy response measures in order to mitigate the economic, financial, social and health crises caused by the spread of the virus, while at the same time, experimenting with different measures to control its spread and save as many lives as possible. While a lot of attention is, and must be, put in analyzing how governments are reacting today in order to learn how to better react in the face of a similar crisis sometime in the future, the crisis also demands a question: why are some countries responding better than others?. The hard reality is that not all countries are facing the crisis from the same starting point. Developed countries are in a better position to face the different dimensions of the crisis due, to a large extent, to their available fiscal and healthcare resources. No country in the LAC region can afford the increases in public spending and investment carried out by developed countries in response to the pandemic, nor do they have the same access to international financing. Developing regions such as Latin America and the Caribbean (LAC) must face large trade-offs when deciding where to allocate their available resources to respond to the effects of the crisis. Moreover, these tradeoffs are accentuated by the structural social inequality faced across the region. However, these limitations and conditions were not directly caused by the crisis that began at the start of the year, but rather the result of decades of policies that have created economies heavily burdened by social and economic vulnerabilities. These vulnerabilities are a crucial factor when determining the region’s starting point in the face of the pandemic, the extent of the social and economic impacts, and its capacity to respond. Projected impacts on the LAC economy and growth As of January 2020, Latin America and the Caribbean (LAC) had projected GDP growth rates of 1.6% for 2020, and further 2.3% for 2021. However, these projections have drastically changed because of the crisis brought by the coronavirus pandemic. While the containment measures taken by LAC countries are bound to have an impact on their overall GDP growth, the uncertainty of how the pandemic will evolve, and how each country will respond, make estimations a very difficult exercise. The projections from the June 2020 IMF World Economic Outlook indicate that Real GDP growth in Latin American and the Caribbean is estimated at -9.4% in 2020 but will return to a 3.7% growth in 2021. The 2 largest economies in the region, Brazil and Mexico will experience similar trend. These projections are vastly different from the estimations done earlier in April 2020. [caption id="attachment_5426" align="aligncenter" width="607"] Source: IMF World Economic Outlook June 2020.[/caption] These projections consider several key assumptions. For instance, the forecast factors a larger hit to activity due to the lockdowns in the first half of 2020, and a slower recovery in the 2nd half of the year compared to what was estimated during the April 2020 estimations. Productivity will be impacted as surviving businesses focus on improving workplace safety and hygiene standards. Countries struggling to control infection rates will need to extend the lockdown and social distancing measures. On the other hand, countries that have controlled infection rates will not reinstate stringent lockdowns and will rather rely on more targeted measures (i.e. contact tracing, isolation, etc.). The projections also factor in the impact of the fiscal countermeasures implemented so far and anticipated of the rest of the year. The model also assumes that fuel prices are expected to remain broadly unchanged compared to the April 2020 version of the economic outlook, with average petroleum spot prices at $36.20 per barrel in 2020 and $37.50 in 2020, with expectations of an increase up to $46 (25% below the 2019 average). Nonfuel commodity prices are expected to rise faster than what was assumed in the April projections. During October, the IMF released its update with new growth projections, showing that the economic impacts of the pandemic are hard to estimate. The new projections show more positive scenario for the region and its 2 largest economies in 2020, but with slightly lower growth estimates in 2021 for the region and Brazil. We will likely see further changes in these projections as countries enter the year 2021, and actual figures for full-year 2020 become available. [caption id="attachment_5428" align="aligncenter" width="552"] Source: Source: IMF World Economic Outlook October 2020[/caption] Earlier during April 2020, the Interamerican Development Bank (IDB) developed a model depicting 4 shock scenarios for the region, taking into account external factors such as: GDP losses in the US and China, with some recovery towards the end of 2020 and into 2021; asset price shocks and their impact in financial markets and capital flows; and commodity prices for oil, metal and agricultural products. The variables were chosen by the key assumption that the shock from the crisis is external, so no internal impact from the measures taken by the countries was considered for the model. While the quantitative estimations might be outdated when compared to the IMF World Outlook projections, the different variables used for the model give some insight on how the crisis can impact countries and sub-regions differently. For example, low oil prices will have negative impact on major oil exporters such as Mexico, Colombia, Venezuela and Ecuador, while low metal prices will affect exporters such as Chile and Peru. While metal and oil prices do not tend to affect employment or consumption, they do have a large impact in public revenues, output, and investment. On the other hand, the prices on agricultural products affect employment, consumption, and public revenues (i.e. export taxes). Source: IADB As per the IADB projections, the LAC region will lose between 6.3% and 14.4% of its’ GDP during the 2020-22 period. The Southern Cone will be impacted mostly by commodity prices, but the dislocation of financial markets will also have a relevant impact, since countries in the sub-region tend to be financially integrated. For the Andean region, the impact might seem low at sub-regional level, but specific cases might vary per country. Ecuador, as an oil exporter, will be impacted by the low prices and its financing needs, and it cannot use the exchange rate to absorb the shock because its economy is dollarized. A similar case might be observed for Colombia, which is an oil exporter that normally attracts foreign investments to finance current account deficits. Peru, on the other hand, will be impacted by copper prices, but has relatively low debt and good access to capital markets. Mexico is also expected to suffer severe GDP losses, mainly because of its trade dependence with the US, globally integrated value chains and low oil prices. Central American and Caribbean countries can benefit from low oil prices, as they are mostly oil importers, but their GDP losses are mainly caused by the high dependence on the US for tourism revenues and remittances. In 2018, North America accounted for 69% of tourists in the Caribbean. Due to the current and expected travel restrictions, tourism in the Caribbean is expected to contract by 25%. Tourism represents 15.5% of the GDP in the Caribbean region, but the range of dependency varies greatly per country, as tourism expenditures represent 75% of Aruba’s GDP, compared to 4% for Trinidad & Tobago. The impact will also be felt directly in employment and household incomes, as the sector employs 2.4 million people in the Caribbean region. [caption id="attachment_5433" align="aligncenter" width="618"] Source: UN-ECLAC Statistics[/caption] Impact on Trade Moreover, the pandemic will also have an impact on the already weak international trade prospects for the region, additional to decrease impact in commodity prices. The first phase of the US-China agreement in January, on which China pledged to increase its importance from the US by at least $77 billion in 2020, could potentially displace LAC as a trade partner for China in some product categories. It is estimated that the value of LAC’s goods exports will be reduced by at least 10.7% by 2020, due to both a fall of 8.2% in prices and a 2.5% fall in export volumes. [caption id="attachment_5436" align="aligncenter" width="1011"] Source: UN-ECLAC[/caption] Note: The following growth rates are assumed for 2020: 1.0% (world), 1.0% (United States), 0.3% (Japan), 0.5% (United Kingdom), -0.2% (European Union, 27 countries), 3.0% (China) and -1.8% (Latin America and the Caribbean), plus an average reduction of 16% in the region’s commodity export basket. The greatest impact will be felt by the countries of South America, which specialize in the export of commodities, making them more vulnerable to a decrease in prices. In contrast, the value of exports from Central America, the Caribbean and Mexico would decrease less than the regional average due to their links with the US and their lower dependence on commodity exports. However, oil-exporting countries are expected to see the largest decrease in value. The COVID-19 crisis may also have an impact on the region’s export performance because of its effect on imports used to produce exports. Some of the most affected countries will be Mexico and Chile, which receive 7% of their intermediate inputs from China, followed by Colombia and Peru, which import ~ 5% of their intermediate inputs from China. Regional exports to China are expected to fall the most in 2020 (-21.7%), affecting products with linkages in the value chains within China (iron ore, copper ore, zinc, aluminum, soybeans, soybean oil, etc.). The most exposed countries in the region are Argentina, Brazil, Chile and Peru, which are the region’s largest suppliers of such products to China. [caption id="attachment_5437" align="aligncenter" width="981"] Source: UN-ECLAC Statistics[/caption] Note: The following growth rates are assumed for 2020: 1.0% (world), 1.0% (United States), 0.3% (Japan), 0.5% (United Kingdom), -0.2% (European Union, 27 countries), 3.0% (China) and -1.8% (Latin America and the Caribbean), plus an average reduction of 16% in the region’s commodity export basket. Regional exports to the US (-7.1%) and the European Union (-8.9%) are also expected to decrease to a lesser extent. Mexico is the country most exposed to changes in supply and demand conditions in the US, especially in the manufacturing sector. Costa Rica is also highly exposed to economic conditions in the US, as about 10% of its GDP depends on the United States supply and demand. The countries most exposed to changes in supply and demand conditions in the European Union are Chile, Mexico, and Brazil, as around 5% of their GDP depends on the service and manufacturing sectors. Impact on Poverty and Employment Given the region’s economic and social inequalities, the effects of the pandemic will disproportionally affect the poor vulnerable middle-income segments of the population. This will lead to an increase in informal employment and child labor, as the most vulnerable families will have to rely on these for survival. Poverty in the region had already increased during 2014-2018, and the effects of the pandemic are very likely to increase the poverty and extreme poverty rates. According to ECLAC estimations, if the effects of the pandemic lead to a 5% loss of income for the economically active population, the poverty rate can increase by 3.5 percentage points, while extreme poverty is expected to rise by 2.3 percentage points during 2019-2020, compared to an increase of 0.3 and 0.7 percentage points change respectively in the previous year. [caption id="attachment_5438" align="aligncenter" width="597"] Source: UN-ECLAC[/caption] People employed by micro, small or medium-sized enterprises (MSMEs) are a very vulnerable segment. Almost 99% of companies in the LAC region are MSMEs, and these represent the majority of companies in almost all economic sectors. The temporary shutdown measures and restrictions on economic activities will lead to a significant decrease in sales revenues, putting the survival of these companies at risk. The economic impact numerous bankruptcies and closures MSMEs will have large social cost, given that these companies accounted for 61.1% of total employment in the region in 2016. Regional Context LAC governments face significant constraints in terms of their capacity to fight the effects of the pandemic. These constraints are not necessarily new, neither have they been caused by the pandemic. Rather, the pandemic has exhibited the many deficiencies in the institutional capacity of LAC countries due to decades of development policies that were not conductive to create sustainable and resilient economies. The results of this are, to varying extents among countries, economies heavily burdened by dire fiscal spaces, and gaps in access to basic services. Fiscal Space The LAC region presents a weak fiscal situation. No country in the region can afford the increases in spending carried out by developed countries to mitigate the impacts of the crisis. On average, public debt represented 62% of the GDP in 2019, compared to 40% of GDP in 2008. The high levels of debt will limit the response capacities of countries, and these will greatly vary as the levels of debt are very different between them. In 2009, the region was able to respond to the international crisis with an average fiscal expansion of 3% of GDP. At the current debt levels, the response capacity today would be approximately 1.5% of GDP. [caption id="attachment_5439" align="aligncenter" width="567"] Source: IADB & IMF[/caption] Moreover, the region’s capacity to access financing has also been affected by the crisis. According to data from the Emerging Markets Bond Index (EMBI), the cost of borrowing in for LAC countries doubled between January and March 2020. The region pays on average 700 basis points for external credit, but this varies between countries. Countries like Brazil and Chile can still access international credit at higher but “reasonable” rates, while for countries like Argentina and Costa Rica, the costs are so high that this is no longer a viable option. [caption id="attachment_5440" align="aligncenter" width="550"] Source: IADB with data from IMF and Bloomberg[/caption] Supporting Infrastructure: Internet, Healthcare & Social security Digital technologies have enabled a transition to work-from-home and study/learning-from home, reducing the impact on some economic activities and education. Although more than 67% of LAC’s population had access to internet in 2019, there are big differences in terms of access between countries. While +80% of the population has access to internet in countries like Bermuda, Aruba and Chile, this percentage drops below 50% in Peru and as low as 12% in Haiti. This is without considering the sub-national disparities between rural and urban populations, as well as income segments within each country, regarding access to internet. [caption id="attachment_5442" align="aligncenter" width="1043"] Source: World Bank[/caption] As for health services, the capacity of health systems in the region varies greatly between countries. The region’s government spending in health was 2.2% of GDP in 2018, far below the 6% of GDP recommended by the Pan American Health Organization (PAHO). In 2016, out-of-pocket health expenditure by households as a proportion of total current health expenditure in Latin America and the Caribbean (37.6%) was more than double that of the European Union (15.7%), and participation in health insurance plans for employed people aged 15 years and older was only 57.3%. [caption id="attachment_5445" align="aligncenter" width="334"] Source: World Bank[/caption] The LAC region has a serious deficit in hospital beds, including those in in- tensive care units (ICUs), and medical personnel (doctors, nurses, and others). In OECD countries, there are 3.5 doctors and 9.8 nurses per 1,000 inhabitants, whereas the comparable figures for LAC countries are 1.8 doctors and 4.4 nurses. Source: UN-ECLAC Statistics Moreover, health services in the region tend to be inadequate and not entirely accessible. In line with the low spending on healthcare, public services tend to be of varying quality, and private healthcare services are only available for those who can afford them. Furthermore, specialized healthcare services and physicians are mostly concentrated in key urban centers, making their access and affordability challenging for the low-income segments of the population. Social protection systems in LAC will also face several issues, especially for countries with limited fiscal space. While these were already inadequate before the crisis, social protection systems will face several issues affecting their capacity to respond to the pandemic. The region faces high rates of employment informality, with a regional average of more than 50% in 2017, limiting the access to social protection services and benefits. Only a few countries in the region have unemployment benefits. In 2019, only 6 countries (Argentina, Brazil, Chile, Colombia, Ecuador and Uruguay) had employment insurance for formal sector workers. Contributory social protection systems will face very high demands of sick leave benefits by workers, and the tax funded non-contributory social protection programs, which are normally designed to support the ported segments of the population, will need to be extended to cover low income families at risk of falling into poverty. Policy recommendations The pandemic has put countries in a situation on which they face 2 simultaneous crises: a health crisis, and an economic crisis. Given the limited fiscal space and costly access to finance for some countries in the LAC region., the response options are very limited. The link between the health and pandemic impacts will have governments juggle between different key objectives. In the short term, the implementation of lockdowns, people movement restrictions and other social distancing measures are the most effective ways to fight the spread of the virus and control its mortality. However, general lockdowns also increase unemployment, declines in salaries, and increases poverty. Governments do not have the fiscal resources to compensate the sectors affected by the pandemic. Therefore, governments must prioritize resource allocation. Naturally, allocating resources to one sector will reduce the resources available for another. The social context of the region will augment this tension. For instance, many households in the region were already poor before the pandemic, and any decrease in their income will put their survival at risk. On the other hand, households in the vulnerable middle class proportionally suffered the steepest decline on their incomes, so it will not be easy to balance the support given to both segments. At the same time, governments must balance between supporting the sectors most affected by the pandemic (hotels, restaurants, etc.) and the workers of the many other sectors that will also be affected. Typical support measures, such as cash transfers, will not be sustainable for extended periods of time, even in countries with greater fiscal resources. The current social support programs implemented by some countries in the region have limitations due to their design. These typically target segments classified withing structural poverty and are not designed to target vulnerable groups that are going through the transitory poverty caused by the pandemic. While the specific measures will vary per country, according to their available resources, there are several recommendations that can be followed to tackle both crises.: A commensurate fiscal stimulus is needed to support health services and protect incomes and jobs. Countries must guarantee the supply of essential goods, such as medicines, medical equipment, food and energy, as well as universal access to testing and health care services. Health spending must be a priority, especially in countries with limited budgets. During the confinement period, resources must be focused on increasing the response capacity of the health system and expanding testing capacity. Mass targeted testing could be used to control infection rates among vulnerable populations. Focus mass testing efforts in targeted regions and hotpots on which the most vulnerable populations (i.e. those more pressed to go back to work, those most vulnerable or exposed to the virus) are concentrated. Serological tests would be the most efficient for this testing method on the LAC region, given that they are cheaper and do not require complicated technology. Social protection systems need to be strengthened to support vulnerable populations. Countries need to expand non-contributory programs, such as direct cash transfers, unemployment, underemployment, and self-employment benefits aimed at vulnerable population segments. Leverage and adjust already existing programs. Some countries in the region already had cash transfer programs in place before the crisis, which could be expanded and adjusted with new targeting instruments to cover poor and vulnerable population segments. Using alternative sources of data to identify vulnerable households, such as electricity consumption, application of employment benefits, or data from recent household censuses, can be used to identify priority targets. Housing crisis and massive business closures can be avoided by enabling mortgage and rent payment deferrals. Government should also consider deferring payments of basic services such as of water, electricity, and internet bills for low-income people for the duration of the pandemic. Central banks must ensure firms’ liquidity to ensure their operations can be carried out and the stability of the financial system. Central banks should intervene directly to provide the liquidity needed by the private sector. Prevent the collapse of the financial system by extending guarantees and credits to the banking sectors and other businesses whose closure would put financial stability at risk. While this measure will affect resources available for other interventions, it will benefit companies and economic sectors not benefited directly by other policies. Avoid the bankruptcy of businesses and minimize the decline in formal employment. Governments can extend loans and guarantees to businesses to provide liquidity. Temporarily suspend (moratorium) or reduce payments of taxes, mandatory contributions (except health insurance) and other regulations that increase the cost of production. Make the necessary legislative reforms to allow companies to temporarily reduce employment costs without permanent layoffs, such as temporary reduction of working hours and salaries. Immediate support should be provided to workers in MSMEs, low-income workers and those in the informal sector. International cooperation and multilateral organizations should design new technical and financial instruments to support countries facing fiscal pressures. They should also consider offering low-interest loans and debt relief and deferrals to open fiscal space. Multilateral institutions can go beyond financial support and provide technical assistance, by leveraging their areas of expertise and support networks, to help countries drat their response plans and their sequencing over time, and offer support in cross-cutting areas, such as big data and artificial intelligence to facilitate tracing, among other areas. Lift the sanctions on countries that are subject to them so they can have access to food, medical assistance and supplies, and COVID-19 tests. Ensure coordinated management of the response to the crisis. It is imperative that governments create high-level coordination mechanisms, especially given the multi-level government system in some countries, to establish and monitor goals and timeframes, allocate resources, and organize communication about the crisis. Ensure continuous and transparent communication with the general population, private sector, minorities, especially regarding the efficient and effective use of resources to fight the pandemic, to ensure public support and collaboration in the different measures. Conclusions While countries are already fighting the pandemic with using some and other policy measures, no response will be perfect. Governments will most likely have to implement and sustain multiple measures at a given time, by leveraging their available resources, and implement adjustments based on the results over time. The crisis was certainly unpredictable, but as mentioned before, it has exhibited the many deficiencies in the economic and social systems developed by Latin American countries in previous decades. While countries must focus on fighting the pandemic today, once the crisis is over (hopefully soon), countries must look back to the past and rethink their development models to re-commence addressing the challenges that they have been dragging for decades, such as high levels of informality, poverty, untransparent fiscal management, access of basic services and build resilient and sustainable economies for the future. Jesus Cazares - Senior Research Associate Sources: IADB https://publications.iadb.org/publications/english/document/2020_Latin_American_and_Caribbean_Macroeconomic_Report_Policies_to_Fight_the_Pandemic.pdf IADB https://publications.iadb.org/publications/english/document/Public-Policy-to-Tackle-Covid-19-Recommendations-for--Latin-America-and-the-Caribbean.pdf UN-ECLAC https://repositorio.cepal.org/bitstream/handle/11362/45351/1/S2000263_en.pdf UN-ECLAC https://estadisticas.cepal.org/cepalstat/web_cepalstat/estadisticasIndicadores.asp?idioma=i IMF June 2020 Economic Outlook: https://www.imf.org/en/Publications/WEO/Issues/2020/06/24/WEOUpdateJune2020 IMF October 2020 Economic Outlook: https://www.imf.org/en/Publications/WEO/Issues/2020/09/30/world-economic-outlook-october-2020 World Bank https://databank.worldbank.org/home.aspx

With the long-term implications of the global coronavirus pandemic, crisis management is being put under the spotlight on all levels, from households to companies, different institutions, and governments. Amid the crisis, governments began to mobilize their economies on several fronts including closure, economic, and healthcare policies; to mitigate the negative impacts of the pandemic. Zooming in on businesses, we’ve seen through the news, reports, and most importantly regulations how they’ve been impacted differently based on their sectors, as well as size; but can their type of ownership play a role in the effects of COVID-19 on businesses? In this blog we’ll be looking at family vs non-family-owned businesses, shedding light on the differentiating factors at the core of this split that echoes in times of crisis management, allowing us to underline the contrasting coping measures. Interestingly, family-owned businesses have received less media coverage than non-family; while according to the Family Firm Institute, family businesses account for 2/3 of all businesses across countries, generating between 70-90% of global GDP and creating 50-80% of the jobs around the world. Organizational differences between family and non-family businesses First and foremost, the significant and particular influence of family governance represents a distinctive difference between family-owned and non-family businesses that should be considered. Ownership among those families is strongly related to a psychological experience, which results from years of investing in the business’ governance. By integrating the business life into their families, the fate of the employees, customers, and surrounding communities becomes linked to its success. Family governance is associated with a series of values, among which are collectivism, altruism, trust, identification, loyalty, and commitment. Another distinguishing factor between both ownership models is that more often than not family owners admit having a business purpose related to the pursuit of non-financial goals; versus non-family owners who measure their organization’s success through its financial performance. The latter supports another core value at the heart of family businesses which is the valued labor relations. To illustrate this better, in the US, you can find many family businesses with greater employee benefits, than big non-family businesses or unions. For example, the In-N-Out Burger chain offers its part- and full-time employees, benefits that include the 401(k) plan of retirement, paid vacations, dental and vision coverage; which is a rare package in the fast-food industry. Employees are often treated like family and find the needed support on personal matters such as family members’ medical bills or funeral expenses. With this emotional attachment to the firm, families tend to have an observation period towards the long-term future more often than the short-term; showing a commitment to the family legacy and its core values. The main objective is to then secure the survival of the firm and succeeding in the uninterrupted family succession project. This approach is frequently referred to as the zoom in/zoom out approach which focuses on iterating between two parallel time perspectives. Firstly, the zoom-out perspective consisting of 10 to 12 years; then the zoom in perspective where the scope is limited to 6 to 12 months. In adopting this approach, families believe that by getting both horizons right, everything else in between will fall in its place. Conversely, the traditional non-family approach usually adopted is the strategic 5-year planning; which is a time frame that belongs to the period in-between when relating it to the zoom-in/zoom-out strategy. Now that we’ve seen some core differences, how is family vs non-family crisis management affected based on the different business models? How family-owned businesses are managing the COVID-19 crisis effectively? Based on Harvard Business Review’s definition, crisis management is the process of adapting oversight of the enterprise under conditions of extreme uncertainty in order to ensure that all stakeholders are aligned around the firm’s long-term vision, values, expected financial outcomes, and risk management measures. With the COVID-19 pandemic, few studies, mostly qualitative, have been conducted surveying European family businesses, different in size and sectors to evaluate their coping mechanism vis-à-vis the current crisis. All surveyed family-owned companies underlined the extent to which the families are prioritizing governance as a necessary service to get them through this period. In fact, maintaining the solidarity and commitment of family members is as important as the continuity of the business. The latter is as effective as proactive crisis management and effective leadership. Family businesses’ crisis management is centered around 5 main factors that are: safeguarding liquidity, operations, communication, business models, and organizational culture. Under a crisis, maintaining an adequate level of liquidity is one of the main stressors families have to manage, on one side; while the pursuit of their business operation becomes more critical than any other time. To begin with the importance of liquidity, some of the favored measures were reducing profits, including executive compensations and dividends, instead of laying off their employees. Secondly, in regards of safeguarding their operations, some of the measures taken by families were reduced social contacts, closing meeting rooms, cafeteria and spreading awareness amongst their employees. Layoffs were hardly mentioned by the family owners as a measure taken at the beginning of the COVID-19 crisis. In fact, families commonly involve employees in finding alternatives that would reduce the firms fixed costs. The third important factor that is crucial in crisis management is safeguarding the communication with employees, customers, and suppliers, even with social distancing. Studies have shown that family-owned employees have mainly 2 fears: one being the consequences which COVID-19 can have on their friends/families and the second being the inevitable economic impact on the firm, as they fear losing their jobs. Family members, then, dealt with the latter through extensive and proactive communication, for example, a German manufacturing company and an Austrian services company communicated their 700 and 15 employees, respectively via WhatsApp messages; while other European companies relied on FAQs on their websites, communication through email, blogs/podcasts, service hotlines or daily newsletters by their CEO written personally to their employees. On the other hand, the biggest challenge when it came to customers, was keeping a personal communication during a time where digital channels are the only ones that can be used. However, it is worth noting that with COVID-19 the general acceptance of digitization has increased, even among late adopting customers. The fourth factor revolves around the firm’s business models that are challenged in times of crisis like COVID-19, at different levels based on the sector of activity. Some family owners found it more suitable to adapt within the same business model; while others found it unavoidable to consider new ones. For example, a family business in hospitality has lost over 80% of its revenue streams but found an opportunity in the increasing demand for toilet paper and used their unoccupied spaces to sell them and generate revenue. Another case of a clothing company where mask production presented itself as an opportunity and production was changed accordingly. Other companies digitalized their workshops and started to include only digital meetings in their standard price offering, charging an additional cost for an on-site consultation. Finally, in family-run businesses, core values remain intact supporting the organizational resilience by yielding both, stability and direction during times of high uncertainty and volatility; which brings us to the last factor of crisis management that is culture. The pandemic has been creating a strong feeling of solidarity among the different stakeholders including employees and suppliers driven by the idea of facing the crisis together. For instance, many family firms have underlined the manifestation of employees’ commitment seen through an increase in motivation, teamwork, and cohesion. In addition to the latter, an increased acceptance towards digitization has been shown among the older employees, as well as others, such as cooks in restaurants who still took orders by hand. To conclude, the differences at the core of the family-owned businesses, especially when it comes to the owners’ emotional attachment to the firm, as well as the non-financial goals are what stem different reactions and crisis management approaches than non-family owners of companies. We can see through this example the importance of crisis management and how it extends to the core values and culture an entity holds. Farida Rehab - Business Analyst Sources: https://www2.deloitte.com/content/dam/insights/us/articles/r7-12011_long-term-goals-meet-short-term-drive-family-business-survey2019/DI_Long-term-goals-meet-short-term-drive.pdf https://www.familybusinessmagazine.com/opinion-family-business-and-coronavirus-fears https://hbr.org/2020/05/what-family-businesses-need-to-adapt-to-a-crisis https://www.emerald.com/insight/content/doi/10.1108/IJEBR-04-2020-0214/full/pdf?title=the-economics-of-covid-19-initial-empirical-evidence-on-how-family-firms-in-five-european-countries-cope-with-the-corona-crisis https://link.springer.com/content/pdf/10.1007%2F978-3-658-16169-9.pdf https://www.sbs.ox.ac.uk/oxford-answers/covid-19-call-action-family-business https://www.businessinsider.com/in-n-out-employee-pay-2018-1

Eight months after Nigeria recorded its first Covid-19 case on February 27, the country has so far escaped the dire public health predictions made at the onset of the pandemic. As of October 26, 2020, there have been 62,111 confirmed cases and 1,132 deaths in Nigeria. (1,295,541 confirmed cases and 29,191 deaths in all of Africa). Back in March, health policy experts expressed serious concerns on whether African countries could limit the spread of the highly infectious coronavirus. One of the epidemiological models developed in March projected that by the end 2020, there would be an estimated 123 million infections and over 300,000 deaths on the African continent, in a best-case scenario. (1.2 billion infections and 3.3 million deaths in a worst-case scenario). “A mix of socio-ecological factors such as low population density and mobility, hot and humid climate, lower age group, interacting to accentuate their individual effects”, have so far contributed to the relatively low level of infections and deaths recorded in Africa, according to the World Health Organization (WHO). Yet, as countries across the continent have eased lockdown restrictions which were crucial in limiting the spread of the coronavirus, experts have warned that African countries are not completely out of the woods, and must be vigilant to make sure that a second wave of infections does not overwhelm the continent’s weak healthcare systems. So far, while Nigeria has avoided a public health crisis, on the economic front, the pandemic has disrupted lives and caused economic insecurity and hardship for households, affected business activities, and severely impacted the government’s finances. The five charts below illustrate the economic impact of the pandemic. Impact on Livelihoods As the country resorted to a lockdown to curb the spread of the coronavirus, the resulting slowdown in economic activities has taken a hard toll on Nigerian households. Earlier this year, due to restrictions on movement and travel, many of the country’s mostly informal 41.5 million Micro Enterprises (96% of all businesses in the country) which account for more than 80% of total employment, had to either close or scale back operations. The charts below show the impact of the pandemic on employment and income. [caption id="attachment_5400" align="aligncenter" width="589"] Households reporting shocks of job losses[/caption] Source: National Bureau of Statistics (NBS) COVID-19 National Longitudinal Phone Survey Round 3: July 2020; Living Standards Measurement Study (LSMS) Integrated Surveys on Agriculture: General Household Survey Panel 2010/2011, 2012/3013, 2015/2016 and 2018/2019. Note: Round 3 of the Nigeria COVID-19 National Longitudinal Phone Survey (COVID-19 NLPS) 2020 was conducted between July 2 and July 16, 2020. 1,950 households from the baseline survey (Round 1) were contacted and 1,820 households, fully interviewed. According to the NBS, the data are representative at the national level and survey weights were calculated to adjust for non-response and under-coverage. [caption id="attachment_5401" align="aligncenter" width="583"] Change in income by source, compared to August 2019 (% of households and source of income)1[/caption] Numbers do not add up to 100% Source: National Bureau of Statistics (NBS) COVID-19 National Longitudinal Phone Survey Round 4: August 2020. Note: Round 4 of the Nigeria COVID-19 National Longitudinal Phone Survey (COVID-19 NLPS) 2020 was conducted in August 2020. 1,881 households from the baseline (Round 1) were contacted and 1,789 households, fully interviewed. According to the NBS, the data are representative at the national level and survey weights were calculated to adjust for non-response and under-coverage. Food Insecurity Since the pandemic began, the rates of moderate or severe food insecurity among Nigerian households have increased significantly. For most households, reduced incomes due to business closures and job losses, has coincided with an increase in food prices. The Food and Agriculture Organization (FAO) defines food insecurity as a situation that exists when people lack regular access to enough safe and nutritious food for normal growth and development and active and healthy life. This may be due to the unavailability of food and/or lack of resources to obtain food. Severe food insecurity is akin to hunger and defined as when people have run out of food and gone an entire day without eating at times during the year. According to the National Bureau of Statistics (NBS) August 2020 Covid-19 impact monitoring report, 68% of Nigerian households experienced moderate or severe food insecurity in August, down from 76.8% in June and almost double the rate of 37% measured in the NBS Jan/Feb 2019 General Household Panel (GHS) post-harvest survey. The charts below show that almost all households in the country have experienced the shock of the increase in food prices and reveals the disturbing rate of severe food insecurity experienced by households since the pandemic started. [caption id="attachment_5402" align="aligncenter" width="573"] Households experiencing shock of increase in price of major food items consumed[/caption] Source: National Bureau of Statistics (NBS) COVID-19 National Longitudinal Phone Survey Round 3: July 2020; Living Standards Measurement Study (LSMS) Integrated Surveys on Agriculture: General Household Survey Panel 2010/2011, 2012/3013, 2015/2016 and 2018/2019. Note: Round 3 of the Nigeria COVID-19 National Longitudinal Phone Survey (COVID-19 NLPS) 2020 was conducted between July 2 and July 16, 2020. 1,950 households from the baseline survey (Round 1) were contacted and 1,820 households, fully interviewed. According to the NBS, the data are representative at the national level and survey weights were calculated to adjust for non-response and under-coverage. [caption id="attachment_5403" align="aligncenter" width="582"] Households Food Insecurity Experience[/caption] Source: National Bureau of Statistics (NBS) COVID-19 National Longitudinal Phone Survey Round 4: August 2020; Living Standards Measurement Study (LSMS) Integrated Surveys on Agriculture: General Household Survey Panel 2018/2019. Note: Round 4 of the Nigeria COVID-19 National Longitudinal Phone Survey (COVID-19 NLPS) 2020 was conducted in August 2020. 1,881 households from the baseline (Round 1) were contacted and 1,789 households, fully interviewed. According to the NBS, the data are representative at the national level and survey weights were calculated to adjust for non-response and under-coverage. The Federal Government of Nigeria’s (FGN) Revenue Problem have worsened The FGN’s finances has been hit with a double whammy of Covid-19 and low oil prices. The record crash in oil prices and the global spread of the coronavirus earlier this year prompted a downward review of the FGN’s overly ambitious revenue targets for 2020, which will see its fiscal deficit widen further. In its May 2020 Economic report, the Central Bank of Nigeria (CBN) noted: “If the current COVID-19-induced restrictions persists, and oil prices remain low, government revenue is likely to further decline. However, recurrent expenditure is projected to continue to rise, considering the countercyclical fiscal policy measures needed to sustain the economy. Consequently, the overall fiscal balance is expected to deteriorate further, while the Federal Government resorts to new borrowings to finance its increasing obligations.” The Country’s Ministry of Finance echoed a similar message as from the CBN expressing worry about the state of the FGN’s finances noting that “The projected Debt Service/Revenue ratio at 47% (actual for 2019 was 58%) raises some concern about the sustainability of FGN debt. However, it is more indicative that the country is faced with a serious revenue problem rather than a classic debt problem. Efforts must therefore be geared towards tackling the revenue problem so it does not degenerate to a real debt sustainability issue.” The chart below illustrates an increasingly worrying revenue problem for the FGN and shows total recurrent debt expenditure taking up a large chunk of total revenue inflows. [caption id="attachment_5404" align="aligncenter" width="588"] FGN revenue inflows and recurrent dept expenditure[/caption] Source: Budget Office of the Federation, Federal Ministry of Finance. Note: Recurrent Debt Expenditure includes debt service payments and line items such as interest on ways & means and sinking fund to retire maturing loans. Oludayo Abass - Associate Sources: “CBN Economic Report, May 2020”, Central Bank of Nigeria, https://www.cbn.gov.ng/Out/2020/RSD/CBN%20Monthly%20Economic%20Report,%20May%202020.pdf, accessed 27 October 2020 Covid-19 Impact Monitoring, National Bureau of Statistics, July and August 2020 “Covid-19 in Africa: protecting Lives and Economies”, United Nations Economic Commission for Africa, https://www.uneca.org/sites/default/files/PublicationFiles/eca_covid_report_en_rev16april_5web.pdf, accessed 27 October 2020 “Covid-19 Nigeria”, Nigeria Centre for Disease Control, https://covid19.ncdc.gov.ng/, accessed 27 October 2020 “Hunger and food insecurity", Food and Agriculture Organization of the United Nations, http://www.fao.org/hunger/en/#:~:text=A%20person%20is%20food%20insecure,an%20active%20and%20healthy%20life., accessed 27 October 2020 “Social, environmental factors seen behind Africa’s low COVID-19 cases”, World Health Organization, https://www.afro.who.int/news/social-environmental-factors-seen-behind-africas-low-covid-19-cases, accessed 27 October 2020 The Medium-Term Expenditure Framework and Fiscal Strategy Paper (MTEF/FSP) 2021-2023, Budget Office of the Federation, Federal Ministry of Finance, Budget & National Planning Quarterly Budget Implementation Reports 2010-2020, Budget Office of the Federation, Federal Ministry of Finance, Budget & National Planning “WHO Coronavirus Disease (COVID-19) Dashboard”, World Health Organization, https://covid19.who.int/, accessed 27 October 2020

The increase in Cyberattacks incidents is common in times of crises and 2008’s worldwide economic recession is the most recent proof. From Heartland’s biggest credit card scam in history to Virginia’s prescription monitoring hack, the 2008 economic recession has witnessed a considerable increase in breaches and cybercrimes. As recorded by the Financial Fraud Action (UK), online banking fraud was peaking in 2009 at £59.7 million before falling in 2011 to £35.4 million. While it is remarked that history repeats itself, the COVID-19 era is no exception. Today’s reality is dominated by remote work that introduced businesses to a new level of dependency on digital collaboration tools. In this context, while authorities focused their efforts mainly on fighting the spread of the virus and improve their healthcare systems, IT professionals are concerned about assuring the environments’ security during this transition. In fact, based on Fugue’s survey on the state of cloud security published in April 2020, 84% of security professionals are worried that their institution has already faced a breach during the transition. This explains why despite the worldwide decline in job opening, countries such as the US and UK saw a rise in requests for information security roles. In terms of numbers, reported cybercrimes are already registering a steep rise and unprepared tools have experienced some of the world’s biggest breaches. ZOOM, the videotelephony software program, had 500,000 personal URLs and information sold on the dark web. Also, a hacker sold 115M personal data belonging to customers of a Pakistani mobile operator for $2.1M in bitcoin. These are just examples of breaches that can severely affect the public. From the visible side of the iceberg, the Internet Crime Complaint Center of the FBI announced a 300% increase in registered cybercrimes in five months, that jumped from 1,000 to 3,000 complaints per day. Additionally, the US Department of Health and Human Services stated that there have been 132 breaches this year (February to May) which is an equivalent of almost 50% increase compared to last year’s reported cases. Google, from its end, is currently preventing, over 18M COVID-19 related email scams and 240M spam messages on a daily basis. As Trend Micro confirms, malicious spam emails are the most considerable share of cyberattacks (up to 65.7%) and the top countries targeted by these types of hacks from January to March 2020 are mainly European countries with the UK at the top (20.8%), in addition to the United States and India. [caption id="attachment_5363" align="aligncenter" width="460"] Top countries targeted by spam emails connected to Covid-19[/caption] Experts predicted in December 2019 that security spending would experience a growth of 8.7%. However, the pandemic urged Gartner to adapt its estimate to 2.4% growth. Albeit the decline in the expected growth, factors related to the current businesses’ development are in favor of few security market segments such as cloud- and SaaS-based solutions that will still drive the sector on a positive trend. In fact, only Network security equipment and consumer security software are expected to decrease (-12.6% and -0.3%), while a considerable high increase of 33.3% is predicted for Cloud Security. The 2020 market will also experience 7.2% growth for data security, 6.2% for Application security, and 5.8% for both Identity access management and Infrastructure protection. From a cost viewpoint, IBM security’s latest insights reported that 2020 Cyber-attacks’ average total cost of a breach remains slightly at the same level ($3.86M in 2020 for $3.9M in 2019), with major increases targeting the energy (14.1% increase) and healthcare (10.5% increase) sectors. In fact, as countries’ stability is highly depending on the energy and utility industries, these sectors became in the past years a prime target for cyber-attacks encouraged by specific political and economic aims. Concerning the Healthcare sector, ForgeRock’s 2019 Consumer Breach report is showing that the most targeted data types are social security numbers, followed by medical records. These breaches will continue to increase as more COVID-19 tests and treatments are conducted. [caption id="attachment_5367" align="aligncenter" width="642"] Average total cost of a data breach by industry[/caption] [caption id="attachment_5370" align="aligncenter" width="615"] Percent change in average total cost by industry, 2019-2020[/caption] Source: IBM Security, “Cost of Data Breach Report 2020”. What about African countries? The submerged side of the iceberg is mainly hiding the African countries’ situation as the cases are rarely covered. Moreover, their contribution to the cybersecurity market is still considerably low, while the number of incidents, mainly related to personal data security, is rising. Tomiwa Ilori highlighted in his paper published in June 2020 that out of the 54 African countries only 28 proved to have a data protection law including Morocco, Mauritius, Kenya, Uganda, Senegal, Tunisia, South Africa, and Nigeria. [caption id="attachment_5374" align="aligncenter" width="634"] Source: Tomiwa Ilori (April 2020). “Data protection in Africa and the COVID-19 pandemic: Old problems, new challenges, and multistakeholder solutions”, APC. [/caption] The provided snapshot above emphasizes that for African countries, there will only be room for serious discussions about Cybersecurity solutions when the inadequacy of their data collection’s regulation framework will be tackled. Raising the countries to the current Cybersecurity reality requires at first protecting the organizations’ most important asset by enhancing regulation and compliance requirements. To achieve this, data protection laws are only the first step. In this context, access to international instruments to reduce compliance gaps becomes a must. The continent should welcome, and particularly during this crisis, partnership opportunities between the different stakeholders, aiming to elevate their data protection laws to combine them with their cybersecurity strategies. Nada Benslimane - Business Analyst Sources: https://www.ibm.com/security/digital-assets/cost-data-breach-report/#/ https://resources.trendmicro.com/rs/945-CXD-062/images/Trend-Micro-Research-COVID19-Threat-Brief-Summary-27Mar.pdf https://www.gartner.com/en/newsroom/press-releases/2020-06-17-gartner-forecasts-worldwide-security-and-risk-managemhttps://dataprotection.africa/ https://www.fugue.co/press/releases/fugue-survey-finds-widespread-concern-over-cloud-security-risks-during-the-covid-19-crisis https://africaninternetrights.org/sites/default/files/Tomiwa%20Ilori_AfDec_Data%20protection%20in%20Africa%20and%20the%20COVID-19%20pandemic_Final%20paper.pdf https://www.gartner.com/en/human-resources/research/talentneuron/cybersecurity-labor-shortage-and-covid-19 https://www.healthcarefinancenews.com/news/number-cybersecurity-attacks-increase-during-covid-19-crisis https://www.imcgrupo.com/covid-19-news-fbi-reports-300-increase-in-reported-cybercrimes/ https://www.informationisbeautiful.net/visualizations/worlds-biggest-data-breaches-hacks/ https://assets.publishing.service.gov.uk/government/uploads/system/uploads/attachment_data/file/246749/horr75-summary.pdf https://www.power-eng.com/2020/02/12/energy-sector-cybersecurity-is-vulnerable-but-achievable/#gref https://healthitsecurity.com/news/health-sector-most-targeted-by-hackers-breach-costs-rise-to-

The Travel and Tourism Industry In the past decades, tourism has experienced continued growth and became one of the fastest growing economic sectors globally. The sector witnessed a 59% growth over the decade in international tourists’ arrivals from 1.5 billion 2019 compared to 880 million in 2009. Tourism is also a key driver for socio-economic progress, with tourism specific developments in an increasing number of national and international destinations. Globally, the tourism industry contributed to $8.9 trillion to the global GDP in 2019 equaling a contribution of 10.3%. It is also to note that 1 in 10 jobs around the world is in tourism, equaling 330 million jobs. However, the strong historical growth has been halted in 2020 amid the global Covid-19 pandemic. With airplanes on the ground, hotels closed and travel restrictions implemented, travel and tourism became one of the most affected sectors since the very start of the virus spread. The pandemic has cut international tourist arrivals in the first quarter of 2020 to a fraction of what they were a year ago. Closing borders, tourism & travel ban Countries all over the world applied travel restrictions to limit the coronavirus spread. Airport closures, the suspension of incoming and outgoing flights, and nationwide lockdowns are just some of the measures that countries are implementing in an effort to help contain the pandemic. After the spread of the pandemic in the first two quarters of 2020, at least 93 percent of the global population lived in countries with coronavirus-related travel restrictions, with approximately 3 billion people residing in countries enforcing complete border closures to foreigners. The decline of International Tourists during the Pandemic The number of international tourist arrivals has been growing remarkably in the last decade and still sustained growth throughout the last years; in 2017 arrivals reached a total of 1.3 billion globally, 2018 reaching 1.4 billion and 1.5 billion in 2019. In 2020, and with the severe impact of the COVID-19 Pandemic, international tourism went down by 22% in Q1 and by 65% in the first half of 2020 when compared with 2019 figures. In March 2020, the UNWTO proposed 3 scenarios for possible declines in arrivals of 58% to 78% for 2020 depending on the start point of gradual opening of borders and lifting travel restrictions. [caption id="attachment_5343" align="aligncenter" width="446"] 2020 Forecast (Updated)[/caption] [caption id="attachment_5344" align="aligncenter" width="447"] 2020 Forecast[/caption] According to the UNWTO’s March forecast and its September update, the recovery for the industry might be in 2021 and domestic demand is expected to recover faster than international. In May 2020, the majority of the UNWTO tourism experts expect to see signs of recovery by the final quarter of 2020 but mostly in 2021. Covid-19 and Airline Failures The International Air Transport Association (IATA) financial outlook released in June showed that airlines globally are expected to lose $84.3 billion in the year of 2020 for a net profit margin of -20.1%. It also stated that revenues will fall by 50% to $419 billion from $838 billion in 2019. In 2021, losses are expected to be cut to $15.8 billion as revenues rise to $598 billion. IATA’s Director General and CEO, stated that “Financially, 2020 will go down as the worst year in the history of aviation. On average, every day of this year will add $230 million to industry losses. In total that’s a loss of $84.3 billion”. What’s shocking is witnessing how many airlines have failed during the coronavirus pandemic. And even for airlines that are still in business, the situation is severely difficult: e.g. the US carriers have given out $10 billion in vouchers due to the pandemic. Listed below are a few examples of the biggest coronavirus-related airline failures worldwide. - LATAM: To date, Chile’s LATAM is the largest airline to file for U.S. bankruptcy protection in May due to the pandemic. LATAM says it will continue flying as it restructures its debts in bankruptcy court. - Avianca Holdings: The second-largest carrier in South America, Avianca survived the Great Depression - but not coronavirus. The airline filed for Chapter 11 bankruptcy protection in May. Like LATAM, Avianca will continue flying during the restructuring. - Virgin Australia: After almost 20 years of operation, Virgin Australia - the country’s second-biggest airline - filed for voluntary administration, the equivalent of bankruptcy restructuring. It’s the largest airline to collapse in Australian history. - Flybe: The British regional airline Flybe was already struggling before coronavirus and both the UK government and Virgin Atlantic tried to save it. However, the airline entered voluntary administration, similar to bankruptcy, in March. - Miami Air International: After 29 years in service, Miami Air International filed for Chapter 11, then proceeded to cease operations. Hospitality Sector Hit by the Lockdown The lockdown due to the pandemic has affected the tourism industry across the globe, and the hotel sector is among the hardest hit. Global hospitality data company STR compared 2020’s first quarter status to 2019 figures, hotel occupancy rates dropped as much as 96% in Italy, 68% in China, 67% in UK, 59% in USA and 48% in Singapore. There’s no doubt that the hotel industry has witnessed a severe impact by the pandemic and the lockdown status. STR is also comparing U.S. Hospitality statistics between 9th of May 2020 to 11th of May 2019 and reported a sharp decline in global hotel performance indices: - 55.9% decline in occupancy to 30.1% - 42.1% decline in average daily rate (ADR) to $76.35 - 74.4% decline in revenue per available room (RevPAR) to $22.95. Balancing the Return of Tourism Revenues and Safety As of July 2020, the EU opened borders to tourists from 15 different countries leaving the U.S. off the list. Health officials developed a plan to classify accepted countries based on how the country is performing in controlling the coronavirus. A country is considered under control when they have a number close to or below the EU average for new coronavirus cases over the last 14 days and per 100,000 inhabitants. On 15 June, the European Commission launched ‘Re-open EU’, a web platform that contains essential information allowing a safe relaunch of free movement and tourism across Europe. The platform will provide real-time information on borders, available means of transport, travel restrictions, public health, and safety measures. Safe Tourism Enabling tourism once again would require measures ensuring that people are and feel safe towards traveling. Global safety and hygiene stamps are awarded by the World Travel & Tourism Council (WTTC) to countries that are demonstrating their commitment to reopening their tourism sector as they recover from the coronavirus outbreak. The WTTC, a council that represents private-sector travel and tourism, created the Safe Travels Stamp to allow tourists to recognize governments and companies around the world which have adopted health and hygiene global standardized protocols – so consumers can experience ‘Safe Travels’. Eligible entities such as hotels, restaurants, airlines, cruise lines, tour operators, attractions, short term rentals, car rentals, outdoor shopping, transportation and airports, will be able to use the stamp once the health and hygiene protocols, outlined by WTTC, have been implemented. As of September 2020, the ‘Safe Travels’ List included 100 destinations with Saudi Arabia, Spain, Portugal and Mexico among the first destinations to adopt the stamp and the Philippines as 100th destination. The Return of Tourism Globally With lockdowns ending around the world, many countries have started to ease border restrictions and reopen for international tourists. Although many governments are still advising against "nonessential" international travel, a host of popular destinations have eased their Covid-19 border restrictions and are readily welcoming tourists back: - The European Commission has released guidelines for how its Member States can start to ease coronavirus travel restrictions and enable tourism to begin again - The Baltic states are creating a “travel bubble”, allowing citizens to travel freely between them. - New Zealand and Australia have committed to introducing a trans-Tasman "COVID-safe travel zone", as soon as it’s safe to do so - Destinations like Dubai, the Maldives, Egypt, Lebanon, Croatia, Kenya, Tanzania and Jamaica have already opened their doors to foreign visitors again, while Thailand hope to reopen soon While tourism is slowly returning in some destinations, most members of the UNWTO Panel of Tourism Experts expect international tourism to recover only by the second half of 2021, followed by those who expect a rebound in the first part of next year. However, there are still concerns over the lack of reliable information and deteriorating economic environment which are indicated as factors weighing on consumer confidence, especially with the potential new limits on travel as world comes to grips with second Covid-19 wave. The concerns over the “second wave” of coronavirus brought on by returning vacationers are wreaking havoc on the world’s tourism industry. Mohamed Aref - Business Analyst Sources: https://www.unwto.org/global/press-release/2019-01-21/international-tourist-arrivals-reach-14-billion-two-years-ahead-forecasts#:~:text=International%20tourist%20arrivals%20up%206,registered%20in%20the%20global%20economy. https://www.unwto.org/global/press-release/2018-01-15/2017-international-tourism-results-highest-seven-years https://www.unwto.org/news/covid-19-international-tourist-numbers-could-fall-60-80-in-2020 https://www.unwto.org/why-tourism https://www.phocuswire.com/str-global-hotel-data-march-21-coronavirushttps://wttc.org/Research/Economic-Impacthttps://www.hospitalitynet.org/file/152008846.pdf https://www.pewresearch.org/fact-tank/2020/04/01/more-than-nine-in-ten-people-worldwide-live-in-countries-with-travel-restrictions-amid-covid-19/ https://www.nytimes.com/article/coronavirus-travel-restrictions.html https://www.forbes.com/sites/laurabegleybloom/2020/06/27/airlines-coronavirus-travel-bankruptcy/#41587fa05f69https://www.traveldailynews.com/post/coronavirus-aviation-industry-losses-to-top-84-billion-in-2020 https://www.travelstride.com/blog/countries-reopening-for-tourism-updated-listhttps://ec.europa.eu/info/live-work-travel-eu/health/coronavirus-response/travel-and-transportation-during-coronavirus-pandemic_en https://www.travelstride.com/blog/europe-travel-ban-what-you-need-to-know https://www.thenational.ae/uae/health/dubai-given-safe-tourism-stamp-of-approval-amid-global-pandemic-1.1054111 https://www.ttrweekly.com/site/2020/06/turkey-presents-safe-tourism/ https://www.unwto.org/news/international-tourist-numbers-down-65-in-first-half-of-2020-unwto-reports https://wttc.org/COVID-19/Safe-Travels-Global-Protocols-Stamp https://wttc.org/News-Article/WTTC-reveals-Indonesia-Dubai-and-Rwanda-as-latest-recipients-of-WTTC-Safe-Travels-stamp-for-safety-protocols https://wttc.org/News-Article/WTTC-celebrates-as-100-destinations-get-the-Safe-Travels-stamp https://edition.cnn.com/travel/article/global-destinations-reopening-to-tourists/index.html https://www.france24.com/en/20200727-new-limits-on-travel-as-world-comes-to-grips-with-second-covid-19-wave

The energy transition is, as defined by the International Renewable Energy Agency (IRENA), a pathway towards the global energy sector from fossil-based to zero-carbon by the second half of this century. The mining industry plays a focal role in addressing global warming and supporting the global energy transition. Although being a notoriously energy-intensive and high CO2 emitting industry – as of today, the mining sector accounts for approximately 2–11% of total global energy consumption, and 26% of global carbon emissions, green energy generation – being more infrastructure intense, requires much more metals and minerals, and therefore more mining activity. While this paradox comforts the fact that the mining industry is here to stay, it leaves only one way of achieving SDGs 7 (Affordable and Clean Energy), 12 (Sustainable Consumption and Production) and 13 (Action against Climate Change), which is the adoption of climate-smart mining practices, including the integration of renewable energy to power mining operations. Mining for Green Energy Transitioning to a low-carbon energy system has been under way for the past few decades. Renewables’ share of annual power capacity expansion has been steadily increasing to reach, in 2019, over 72% of the new installed capacity. While this evolution is still largely driven in most countries by government regulations and incentives to meet the decarbonization and climate mitigation goals set out in the Paris Agreement, other countries have successfully transitioned past the support schemes (e.g. feed-in-tariffs) to competitive Power Purchasing Agreement auctions, facilitated by the steep fall in renewable energy costs, and growing engagement of energy and oil & gas companies in renewable energy projects. Low-carbon technologies, especially solar photovoltaic, wind and geothermal, are more mineral and metal intensive relative to fossil fuel technologies. To illustrate, for every 1 megawatt (MW) of capacity of solar PV, about 3,000 solar panels are needed. In the case of wind power and electric transportation, each wind turbine contains about 3.5 tons of metal, while 83 kilograms of copper are required for every electric vehicle. Overall, the demand for base and niche minerals stemming from clean energy technologies manufacturing is expected to grow significantly, with anticipated increases of up to nearly 500% by 2050 for certain minerals in relative terms to 2018 production levels. This is particularly the case for those concentrated in energy storage technologies, such as lithium, graphite, and cobalt. These demand prospects suggest promising opportunities in resource-rich countries, thus prompting several governments including Bolivia—home to 1/4 of the world’s lithium resources, Chile, Democratic Republic of Congo, and Western Australia, into taking policy and investment actions to channel and support the development of their respective mining industries, in the global energy transition context. [caption id="attachment_5334" align="aligncenter" width="766"] Figure 1: Projected Annual Mineral Demand Under 2 Degree Scenario Only from Energy Technologies in 2050, Compared to 2018 Production Levels - Source: World Bank Group: The Mineral Intensity of the Clean Energy Transition, 2020[/caption] Deriving geothermal energy from mine water contained in abandoned coal mines is another way the mining industry can contribute towards building a less carbonized future. This option has been extensively studied in recent years and projects are already underway in countries like Australia, where the opportunity is sizeable. The use of the mine water as a geothermal resource inherits most of the environmental benefits of conventional geothermal heat pump applications while also providing more attractive advantages, such as highly efficient exploration and higher-quality geothermal energy. Green Energy for a more Sustainable Mining The total energy expenses are estimated to account for approximately 30% of total cash operating costs for mining companies, with around 32% of the consumed energy in the form of electricity. Because the financial aspect was traditionally a more pressing motive for companies, and considering the rapidly decreasing costs of renewable energy over the last decade, the integration of renewables into mining has been underway for the past several years. This was mostly the case in remote mining locations where electricity costs through the grid are furthermore substantial, as well as in areas that suffered from recurrent power supply disruptions. Recently however, with climate change awareness gaining momentum in the industrial world and renewable energy sources being more cost-competitive than ever, mining companies like Anglo-Australian multinational Rio Tinto, South African Gold Fields or Chilean copper mining company Antofagasta, are expanding the share of renewables powering their operations. Generally, this is achieved either through Power Purchasing Agreements (PPAs) or joint ventures with energy providers, by purchasing renewable energy certificates (RECs) or via the mining company’s own microgrid. Undoubtedly, we’re still a long way from commercially viable 100% renewable energy projects, particularly for non-remote mines. But according to some experts, hybrid solutions with 50% renewable penetration are already achievable, and even represents the better commercial option compared to 100% conventional fossil-based power. Oussama El Baz - Research Analyst Sources: https://www.irena.org/-/media/Files/IRENA/Agency/Publication/2020/Mar/IRENA_RE_Capacity_Highlights_2020.pdf?la=en&hash=B6BDF8C3306D271327729B9F9C9AF5F1274FE30B https://www.angloamerican.com/futuresmart/our-world/environment/mining-with-renewable-energy#:~:text=Renewable%20energy%20is%20an%20affordable,Wind https://www.miningreview.com/energy/why-renewable-energy-makes-economic-sense-to-mining/ https://www.renewableenergyworld.com/2019/10/15/will-the-oil-industry-help-address-climate-change/#gref http://www.bmz.de/rue/includes/downloads/CCSI_2018_-_The_Renewable_Power_of_The_Mine__mr_.pdf https://africanminingmarket.com/mining-the-golden-opportunities-of-the-energy-transition-and-digital-transformation/6058/ http://www.mining.com/global-energy-transition-powers-surge-demand-metals/ http://pubdocs.worldbank.org/en/961711588875536384/Minerals-for-Climate-Action-The-Mineral-Intensity-of-the-Clean-Energy-Transition.pdf https://www.theguardian.com/environment/2019/mar/12/resource-extraction-carbon-emissions-biodiversity-loss#:~:text=Extraction%20and%20primary%20processing%20of,26%25%20of%20global%20carbon%20emissions.&text=All%20the%20sectors%20combined%20together,any%20fuel%20that%20is%20burned https://sci-hub.tw/https://www.researchgate.net/publication/324948020_Large-Scale_Mine_Water_Geothermal_Applications_with_Abandoned_Mines http://ccsi.columbia.edu/files/2020/05/Dont-Throw-Caution-to-the-Wind.pdf https://www.mining-technology.com/features/going-green-renewable-energy-projects-at-mines-around-the-world/ https://www.twobirds.com/~/media/pdfs/expertise/energy-and-utilities/2020/renewables-for-mining-in-africa.pdf?la=en&hash=B3884279D0BD9377CAA7D6B9C0EDBF6A59A5858E Energy and Mines, Issue 23, August 2020

While it is still early to estimate the damage of COVID-19 on economies, economists’ early estimates suggest a big negative short-term impact for countries. It is, without a doubt, the lockdown measures implemented by many countries had put global economies in the disruption. In certain economies, the impact is doubled. GCC countries, for instance, are experiencing dual shock from the pandemic: the economic shutdown and the collapse in global oil prices. The International Monetary Fund (IMF) (1 & 2) latest June report projects the economic outlook for the Middle East and Central Asia region to be negative at -4.7% by the end of 2020 but is expecting it to rebound in 2020 to be 3.3% growth as the economic activity is expected to slowly normalize. This has changed from its initial pre-COVID-19 crisis when the IMF projected a 2.8% increase of real GDP in 2020. Figure 1: Real GDP Growth [caption id="attachment_5308" align="aligncenter" width="808"] Real GDP Growth (Annual % change)[/caption] The Pandemic had also a deep impact on oil prices. GCC countries’ revenues rely mainly on Oil. But this latter has reached an unprecedented price level. According to PWC (3), if Oil prices are sustained at $20 per barrel for the rest of 2020, GCC countries can lose $554 million per day. The stock market in Gulf countries also has witnessed high volatility over the past few months. As figure 2 shows, the daily prices of indices have reached a maximum drop value for all GCC countries starting the beginning of March 2020 and started to recover again slowly. The following are the YTD of GCC indices (as of July 21st): - UAE ADX General: -16.5% - KSA Tadawul All Share: -11.3% - Bahrain All Share: -19.2% - Oman MSM 30: -13.1% - Qatar QE General: -10.6% Figure 2: GCC countries Market indices performance [caption id="attachment_5304" align="aligncenter" width="652"] GCC countries Market indices performance[/caption] The combined effects of these macroeconomic indicators have the wealth management sector in a new delicate environment. As the revenue streams of managers depend heavily on the performance of the equity market, market volatility causes a decline in assets and therefore a decrease in management fees. Moreover, most Sovereign Wealth Funds (SWFs) in GCC are oil-based, which means they depend heavily on prices of oil. However, over the years, wealth management has proven to be robust through crises such as the global financial crisis in 2008 and the European sovereign debt crisis in 2010. According to a BCG study (4), over the last 20 years, personal financial wealth in growth markets which consist of Africa, Asia excluding Japan, Latin America, Eastern Europe, and the Middle East, has sped up to reach 25.3% of global wealth in 2019 vs. 17.3% in 2009 and 9.3% only in 1999. This is due to strong GDP performance and higher rates of individual savings. In the middle East alone, wealth has increased by 7.4% over the past 20 years to reach 4.2 Trillion USD in 2019. As a short-run effect of COVID-19 on wealth managers, wealth will see a decrease in value in 2020 but will rebound after based on 3 scenarios projected by BCG. In the case of a quick economic recovery, Middle Eastern wealth will increase by 5.6% in the next 5 years to hit 5.5 Trillion USD, 4.3% growth in case of slow recovery to 5.2 Trillion USD, and 3.4% under a lasting damage scenario to reach 5 Trillion USD by 2024. Last year’s estimates from BCG suggested that wealth in the Middle East will grow by a CAGR of 6.9% between 2018 and 2023. Figure 3: Forecasted wealth in the Middle East [caption id="attachment_5294" align="aligncenter" width="595"] Forecasted wealth in the Middle East (Trillions USD)[/caption] Another study by Oliver Wyman and Morgan Stanley (5) expects the funds under management in the Middle East & Africa to increase by 6% annually for the next 5 years. Assets of High Net Worth wealth in the region will fall by 5% in the short term before rebounding to 5% by 2024. The report said that the pandemic will have a negative impact on the asset performance because of anticipated bankruptcies and muted executive pays, which will impair the overall net interest income. Overall, the wealth management industry has shown resilience through a historical crisis and is likely to survive the COVID-19 crisis as well. However, wealth managers should think about new ways to serve their clients. They should be vigilant and undertake more reactive approaches to stay competitive in the long run. They will need also to re-examine their operating model and adopt agile ways of working since the rivalry from technological advances will likely intensify. Fadwa Khalil - Senior Associate Sources: https://www.imf.org/en/Publications/WEO/Issues/2020/01/20/weo-update-january2020 https://www.imf.org/~/media/Files/Publications/WEO/2020/Update/June/English/WEOENG202006.ashx?la=en https://www.strategyand.pwc.com/m1/en/covid-19-oil-price-drop-gcc.html https://image-src.bcg.com/Images/BCG-Global-Wealth-2020-Jun-2020_tcm9-251066.pdf https://www.oliverwyman.com/content/dam/oliver-wyman/v2/publications/2020/jun/Global-Wealth-Management-Report-2020.pdf

Amid many economic and political shocks that Egypt has witnessed in the last decade, the real estate sector has proven to be one of the most resilient sectors as it may have slowed down after the first and second revolutions and the devaluation in 2011, 2013 & 2016 respectively, but it did not crash. The real estate sector in Egypt is mainly driven by many factors, amongst which: a strong demand with a supply gap of 3 million residential units in 2020, a growing population of over 100 million people mostly young people, and general drive to buy real estate as either as an investment as hedging against inflation or for their children due to the continuous increase in prices. The Real Estate sector has been on the rise in terms of investments and contribution to GDP as it is a relatively safe investment and the demand is always increasing. This is until the COVID-19 crisis, as the crisis impacted the saving of many middle-class families and led many to lose their jobs which in turn affected their savings and their properties, Coldwell banker claims that real estate properties represent around quarter to third of the Egyptian families’ wealth at middle and high-income classes and even more than that for lower-income classes. Has the sector been affected so far? Despite the current situation that is affecting all the economy and the real estate market, the Egyptian capital Cairo, most sub-sectors remained stable during the first quarter with the office sector in particular that recorded strong performance. Cairo’s office sector has seen a 9% increase in average prime rents on an annual basis despite the unfavorable market conditions, due to the limited supply of high-quality offices. On the residential sector scenario, it remains almost unchanged with limited units delivered in the first quarter, keeping the total residential units at 159,000. A report published by Aqarmap (The largest real estate online marketplace in Egypt) shows that during the crisis of Covid-19 the leading purchase objective of the active buyers are actually first time home buyers, some are newlyweds or simply people who are finally entering the housing market; however, the segment breakdown shows how the objective differs by segment. The buyers assigned to socioeconomic status (A) and (B) who are active during the crisis are mostly buying to upgrade their home. While those in status (C) are mostly buying their first home. While other sectors may have been deeply affected by the crisis, the impact on Real Estate sector has been “manageable” as the CSO of Landmark Sabbour would put it. This could be mainly because the sector is greatly supported by the government. For example, in March 2020, the Central Bank of Egypt has reduced interest rates by 300 basis points setting the lending rate at 10.25 %. A move which experts hailed as great for the industry as a decrease in the lending rate and accordingly in Financing cost will make the sector more attractive for investors as it will likely increase the real estate valuation. How much were the Real Estate developers affected by this? The current market conditions have suffered from the pandemic and caused an increase in downward pressure on operations and sales volumes, resulting in landlords offering rental exemptions to support tenants. This is expected to reflect even further in the second half of this year provided the temporary lockdown of all retail operations and other preventative measures remain active Many experts & real estate developers believe that the residential market will not be very much affected as people still need to buy homes and that the market now is weaker, they would be more encouraged to move on with their plans. However, the real estate sectors that are expected to be hit the hardest are Luxury homes, Retail and F&B and the hospitality sectors In Cairo that has the bigger stock of units in Egypt, merely 135 residential units were delivered in the first quarter of 2020, keeping the total residential stock almost unchanged at 159,000 units as mentioned above. Around 58,000 units are expected to be completed over the remaining 9 months of the year. However, given the current market conditions and a potential slowdown in demand, on the back of negative sentiment and contraction of household incomes, we remain cautious of the timely delivery of projects and can expect these to spill over into 2021/2022. A large amount of future supply currently under construction in East Cairo has put downward pressure on sale prices over the quarter. Meanwhile, the shortage of supply in 6th of October makes it the better performer in Q1 2020. How will the pandemic affect the sector? Digitization: One dimension that COVID-19 certainly accelerated is the pace of digitization in the sector. Given the necessity of keeping a social distance, most real estate companies are now encouraged to rely more on digital solutions including augmented reality (AR), virtual reality (VR), and 360° virtual panoramic tours. For example, Iwan development started to progress its sales digitally by promoting its projects online and using different digital channels to provide payment plan options for clients. In addition, Tabarak developments are encouraging their clients to communicate and pay their installments using digital channels. The interesting part is that, not only the private sector is interested in the digitalization of the sector but the government as well. According to Khaled Abbas, Deputy Minister of Housing, Utilities, and Urban Communities for National Projects, the digital transformation of the sector is “inevitable” which was obvious in the usage of online services for the government’s offering of units and land in the Beit Al Watan project. Healthcare Boom: According to a report by Coldwell Banker that was released in April 2020, the Covid-19 crisis is expected to increase the health awareness of many Egyptians which would lead to an increased demand for healthcare facilities that by role will help in flourishing the sector as a whole. Loay Sherine - Senior Analyst Sources: https://i.aqarmap.com/covid19/Aqarmap-COVID19-Study-Detailed-Summary.pdf https://www.jll-mena.com/content/dam/jll-com/documents/pdf/research/emea/mena/jll-real-estate-market-overview-cairo-q1-2020.pdf https://www.zawya.com/mena/en/business/story/Cairos_real_estate_stable_in_Q1_despite_Covid_challenges_JLL-SNG_173817781/ https://coldwellbanker-eg.com/uploads/Main_Entity_Db_AssetMedia/Coldwell%20Banker%20Commercial%20Advantage-Dealing%20with%20COVID-19%20impact%20on%20the%20Real%20Estate%20Sector-April%202020-2.pdf https://www.savills.sa/insight-and-opinion/news/298327/egypt-s-strong-economic-fundamentals-to-support-speedy-recovery-from-the-covid-19 https://invest-gate.me/features/will-business-move-forward-in-the-time-of-corona-2/ https://wwww.dailynewssegypt.com/2020/05/18/covid-19-to-accelerate-real-estate-company-digitisation-developers/ https://www.arabfinance.com/en/news/details/egypt-economy/516201 Graph: https://coldwellbanker-eg.com/uploads/Main_Entity_Db_AssetMedia/Coldwell%20Banker%20Commercial%20Advantage-Dealing%20with%20COVID-19%20impact%20on%20the%20Real%20Estate%20Sector-April%202020-2.pdf Page 8 https://www.capmas.gov.eg/Admin/Pages%20Files/20199241454accounts.pdf Page 11 https://www.cbe.org.eg/_layouts/15/download.aspx?SourceUrl=%2Fen%2FEconomicResearch%2FPublications%2FEconomicReviewDL%2FEconomic%20Review%20Volumes%20Vol.58%20No%204%202017-2018.pdf Page 98

Conducting an interview with an industry expert in an optimal manner can be a challenging task. This is because it implies getting a maximum of relevant insights from the expert in a one-shot, limited time interview. Interviewing experts is a very proactive process where the interviewer needs to show a strong take-charge attitude. The 8 following tips would be instrumental in conducting a successful BtoB interview: Tip 1: Preparedness Before starting the interview, it is important that the interviewer gets ready for the call by ensuring the following conditions: - To have a quiet room booked beforehand for the interview - To take ~ 10 minutes before the interview to: + Rest and get mentally ready and relaxed to conduct the interview + Get some Drink / food / Bathroom time before the interview to be comfortable to lead it for a whole hour + To have the following items available during the interview: + A phone headset: This is important because using a loudspeaker or holding the phone will be tiring and will not allow the interviewer to properly and effortlessly hear the expert. + A notebook and a pen: It is important to take notes as the expert is answering the questionnaire. This will allow the interviewer to grasp and remember the insights more easily, which will help them to challenge and guide the expert during the interview as well as capture the data more efficiently during the reporting phase. Tip 2: Active Listening The interviewer should listen very intently during the interview to be ready to: - Probe the expert further if his answer either feels incomplete or opens on any unplanned follow-up questions. - Properly challenge the expert on the information he provides in case some of it conflicts with something he has previously said during the interview or even with inputs gathered from other experts relating to the same topic. Tip 3: Managing the Expert - The interviewer should not hesitate to politely but firmly interrupt the expert, if necessary, to bring him back on track if this one strays away from the topic at hand or goes on expanding on irrelevant or unnecessary details or examples. - If the expert strays, he should be reminded of the time constraint and asked to be more concise not to exceed the time budget. Tip 4: Probing The interviewer needs to probe the expert in the following instances: - The expert's answer feels incomplete based on the interviewer’s knowledge of the topic - The expert's answer is qualitative, and the interviewer would like to quantify the input (E.g. asking to quantify the market share of brands or players qualitatively identified as the "Top" ones by the expert.) - If any part of the expert’s answer is unclear for the interviewer Tip 5: Recapping It should be a systematic practice for the interviewer to recap the answers of the expert, especially when: - The answer is not very simple and straightforward - The accent of the expert is not easily understood - The pace of speech of the expert is very slow; it is then worth helping him recap his point or move on to another question once his message becomes clear to the interviewer Tip 6: Efficient Time Allocation - The interviewer should allocate the interview time in accordance with the quality and pertinence of the input shared by the expert. - If an expert is sharing very valuable insights, it would be Ok to allocated 5 - 10 min extra time to his interview, however, if he shares "regular" quality insights, then the interviewer should manage the expert to conduct the interview within the time frame. Tip 7: Follow-ups In case the expert says that he does not have certain information at the time of the interview but that he can source it later: - The interviewer should ask the expert to send the additional information as a follow up via email. - It is also very useful for the interviewer to send the expert a recap email enclosing the points for which he is expected to provide a follow-up and confirming the time frame in which the expert would be able to share the follow-up information. Tip 8: Bailing Out of a Bad Interview In case the expert turns out not knowledgeable enough about the topic of interest: - For the first 10 min of the interview, the interviewer needs to purposefully assess the actual qualifications and knowledge of the experts about the topic at hand. - If during these first 10 mins the interviewer is forming strong doubts on the competency of the expert, he should not hesitate to cut the call short with the expert and report his reserves about him to the expert network to change this expert and avoid having him compensate if he is not fit. Meryem Khaled - Project Lead

A 2019 study shows that we spend on average 6 hours and 42 minutes connected to the internet per day. These estimates do not take into consideration the impact of Covid-19 implied quarantine. We are more and more connected to the internet via our computers, tablets, and smartphones. Internet of Things (IoT) is also connecting smart cars, watches, and other home appliances to the internet, creating more data than ever before. In fact, according to IDC, in 2018, more than 5 billion consumers interact with data every day. By 2025, that number will be 6 billion, generating 63 ZB of unique data. That is 36% of the global Datasphere in 2025, which is expected to total as much as 175 ZB. This surge in data generation can be partially explained by our daily habits. Each day, we send 500 million tweets, 494 billion emails, and 65 billion messages on WhatsApp. We also use several apps that connect to the internet, such as Facebook that generates alone 4 petabytes of data daily. In terms of video streaming, the average Netflix subscriber spends two hours a day on the streaming service. All this data needs to be stored somewhere. Not so long ago, consumers would save most of their files, photos, and videos on their own devices and external hard drives. But the fear of losing cherished memories and hours of hard work drove the need to a more practical storage unit: the cloud. Many today have backups for their WhatsApp conversations and photo galleries to name the least. The trend emerged thanks to more competitive prices and freemium options. Enterprise public cloud revenues will grow 16% from USD 196.7 billion in 2018 to USD 354.6 billion by 2022. The below graph shows that data storage in the cloud will reach almost 50%. In the context of the current COVID-19 epidemic, internet use has reached record highs. Video, Gaming, and Social Sharing comprise over 80% of all internet traffic, wich pushed some companies to limit the quality of their services to accommodate the surge (e.g Netflix). According to the latest report from App Annie, daily time spent in apps on Android devices increased 20% year-over-year in Q1 2020. Facebook also announced an 11% y-o-y increase of daily active users, reaching 1.73 billion for March 2020. Netflix as well announced 15.77 million new paid subscribers globally, more than double the expected 7 million. Omit, this surge is putting unprecedented pressure on network infrastructure. For data centers systems, news of enterprises delaying (Google) or canceling their investments severely impacted initial shipment data. Adjusted spending forecasts are expected data center systems to decline by 9.7% in 2020. However, as remote working continues, public cloud will be a bright spot in the forecast, growing 19% in 2020. Remote working is changing the mix of data being created to a richer set of data that includes video communication and a tangible increase in the consumption of downloaded and streamed video according to IDC. Despite this, the outlook remains more positive for data centers. Based on a Collier survey of Chinese data centers, the consensus among respondents is that the impact of the coronavirus [on data centers] will be felt in the next few years. While 5G, artificial intelligence (AI) and cloud computing are the primary sources of demand for 2020 and beyond. The growing demand for big data is clear evidence for a surge of data centers, and why demand will continue in the years ahead. The survey results indicate that “The coronavirus has changed people's lifestyles, with telecommuting, online education, online video games, video streaming, and e-commerce consumption seeing a rise in demand. The surge in demand for information storage and processing will directly lead to increased demand for data centers.” Sarah Nassiri - Associate Sources HootSuite and We Are Social, Digital 2019 report, Data Age 2025, sponsored by Seagate with data from IDC Global DataSphere, Nov 2018. https://res.cloudinary.com/yumyoshojin/image/upload/v1/pdf/future-data-2019.pdf https://www.gartner.com/en/newsroom/press-releases/2019-11-13-gartner-forecasts-worldwide-public-cloud-revenue-to-grow-17-percent-in-2020 https://www.sandvine.com/press-releases/sandvine-releases-covid-19-global-internet-phenomena-report https://www.appannie.com/en/insights/market-data/weekly-time-spent-in-apps-grows-20-year-over-year-as-people-hunker-down-at-home/ https://investor.fb.com/investor-news/press-release-details/2020/Facebook-Reports-First-Quarter-2020-Results/default.aspx https://www.theguardian.com/media/2020/apr/21/netflix-new-subscribers-covid-19-lockdown https://technology.informa.com/622938/covid-19-impact-on-data-center-compute-2020 https://www.gartner.com/en/newsroom/press-releases/2020-05-13-gartner-says-global-it-spending-to-decline-8-percent-in-2020-due-to-impact-of-covid19 https://www.gartner.com/en/newsroom/press-releases/2020-05-13-gartner-says-global-it-spending-to-decline-8-percent-in-2020-due-to-impact-of-covid19 http://news.colliers.com.cn/files/2020/docs/2019-02-20-Coronavirus-DC-Report-EN.pdf https://variety.com/2019/tv/news/netflix-cindy-holland-subscribers-watch-average-two-hours-day-1203159868/

From being the first two Italian regions with COVID-19 cases, Lombardy and Veneto followed two very different trajectories in the coming months of the pandemic. Lombardy became unfortunately famous for being the most-hit region in Italy, by both numbers of infections and deaths. Veneto instead, managed to contain the infection, and has now very low numbers compared to Lombardy. Both regions have allegedly good regional healthcare systems (better functioning than many other Italian regions and other European countries), so what did Veneto do that Lombardy did not? The Beginning COVID-19 cases in Italy started rising towards the end of February 2020. There were two initial epicenters of the outbreak, one in Codogno, in the province of Lodi in Lombardy, and one in Vo’, in the province of Padua in Veneto. The two towns were put into lockdown in order to contain the virus, but this did not prevent it to expand to other provinces and regions. In the last week of February cases were confirmed in neighboring regions such as Piedmont, Emilia-Romagna and soon the virus reached almost all regions in Italy from north to south. In the coming weeks, Lombardy’s cases started to soar, together with the number of people hospitalized in intensive care and the number of deaths. Ever since, up until today, Lombardy is the most hit region, by the number of infections, intensive care hospitalizations, and casualties. Veneto instead, from being one of the first two epicenters of the virus in Italy, with tens of people being infected in the first days of the epidemic, followed a very different evolution. The numbers today As of May 21, 2020, according to official government data, Lombardy has 85,775 total cumulative cases, with more than 15,600 casualties whereas Veneto has so far 19,030 total cumulative cases and about 1,800 casualties. It is clear that the two regions have very different numbers. There is however a figure for which Lombardy and Veneto have a much similar value: the number of tests carried out. As of today, Lombardy performed a total cumulative of 607.863 tests, whereas Veneto carried out 536.798. Considering that the population of Lombardy is two times that of Veneto, this means that overall, Veneto implemented a test-intensive strategy, while Lombardy did not. [caption id="attachment_5198" align="aligncenter" width="532"] Figure 1 Cumulative positive cases in Lombardy and Veneto, MoH Data, My Elaboration[/caption] Testing Strategies Lombardy As the number of cases began to soar and hospitals’ ICU beds started reaching capacity, the president of the Region, Attilio Fontana, decided to test only people with serious symptoms due to the limited diagnostic capacity of the region. This was backed by the recommendations published by the Ministry of Health on March 9, which read “people with symptoms should be tested”. Up until late April, Lombardy denied testing to people who requested it, unless they had significant symptoms. GP were instructed to do a triage over the phone and if the patient did not have a respiratory crisis or symptoms that would require hospitalization, the doctor would just suggest they’d keep them informed on the evolution of the symptoms. In addition to this, articles from trustworthy newspapers, have recently stated that Lombardy did not test people with symptoms (even serious ones), thus implying that Lombardy’s authorities have been concealing the truth and that they have not actually followed the Ministry of Health guidelines. Veneto When the first patient affected by Covid-19 was identified in Vo’ on February 23, the region supported the proposal of a group of professors and researchers from the University of Padua, to carry out an epidemiological study on the entire population of Vo', testing everyone in the town. The results obtained provided a fundamental input in the medical research on the nature and ways of spreading of the virus, since the study was carried out on a population with statistically significant size. But most importantly, this study produced some crucial information to design a containment strategy more suited to the nature of this new virus. Among the results obtained, the study showed a very high share (45-50 percent) of asymptomatic infected people able to transmit the virus. With this result in mind, Veneto developed the so-called "active surveillance" strategy. The important aspect of this strategy is the planning of the tests: at the first appearance of symptoms (even mild) the patient is tested (together with the people living with her/him). Then a reconstruction of all the people that the patient came in contact with during the previous days is put together, and once these people are identified, they are also tested. Each time a new positive case is found, the procedure is repeated. In this way Veneto proceeds by concentric circles to identify the potential carriers of the virus- even if asymptomatic- with a higher probability. [caption id="attachment_5199" align="aligncenter" width="621"] Figure 2: COVID tests carried out by region from February 24 to May 14 (per 100,000 people). Data from MoH, my elaboration.[/caption] Conclusions Veneto: A winning Strategy: The two regions opted for two opposite testing strategy: Lombardy tested only the symptomatic patients (with already advanced symptoms), while Veneto proceeded to test symptomatic AND asymptomatic people, by mapping the contacts of the infected individuals. Veneto seems to have followed an approach more similar to Germany and South Korea. These are two countries that have managed to limit both the number of new cases and deaths, by recognizing the importance of testing asymptomatic patients. Scientific opinion leveraged: While Lombardy (allegedly) followed the guidelines of the Ministry of Health, based on the WHO recommendations, the region of Veneto, from the very beginning of the crisis, resorted to a team of scientists and epidemiologists to build a strategy that would best suit the situation. Does this mean that the MoH recommendations are flawed? Or being recommendations, they should be contextualized and tweaked based on the specific needs and capabilities of each region? Public debate and Lombardy’s defense: In the last few weeks a public debate started in Italy on whether Lombardy should be held accountable for the mismanaging of the crisis. The region’s authorities argued that the lack of testing resources and of laboratories forced them to reduce the number of tests and limit them to urgent cases only. They also point at the latest Ministry of Health recommendations from April 4, in which there is a list of people that should be tested in order of priority (in case there is a limited capacity of tests and a state of necessity), in this list, asymptomatic people figure only if they are healthcare staff. However, the same document states also that “if the diagnostic capacities are not sufficient, it is allowed to further expand the number of additional laboratories identified by the Regions and coordinated by the regional reference laboratories, considering the possibility of using mobile labs or drive-in clinics”. Has Lombardy taken advantage of this last point? Lombardy’s mismanagement, are there causes rooted in the regional healthcare policy? It is still early and rather difficult to assess to what extent Lombardy’s failure was inevitable or if it was the result of flawed and possibly completely wrong decisions of its authorities. However, as a recent review of an Italian newspaper suggests, Lombardy’s healthcare system malfunctioning could be attributed to Lombardy’s healthcare policies over the last decades, which highly incentivized the private sector. Nowadays about half of the region’s HC structures are private. Private structures in Lombardy over the years have specialized in profitable services, such as surgical operations and specialists’ visits, while emergency services- being less profitable- were not developed and left to public structures. As a result of this, even though private health care weighs about half of the entire Lombard healthcare system, it has just over a quarter of the intensive care unit beds in the region. Moving forward in the analysis, this aspect should be taken into consideration in order to understand what could have been done better, especially in the face of future emergency situations. Is the testing strategy the ultimate culprit? It is still unclear the extent to which Lombardy’s testing strategy contributed to its high numbers of cases and deaths. This article aimed at comparing two regions that have many similarities, such as healthcare system advancement, favorable economic conditions, and developed technology. With this in mind, since the two regions’ approaches varied substantially in terms of testing strategy, it is fair to attribute some degree of importance to this, while the research continues to assess responsibilities in order to avoid further mistakes in the future. Pietro Morabito - Senior Analyst Sources https://www.fnopi.it/wp-content/uploads/2020/03/Circolare_9_marzo_2020.pdf http://www.trovanorme.salute.gov.it/norme/renderNormsanPdf?anno=2020&codLeg=73799&parte=1%20&serie=null https://www.ilpost.it/2020/05/04/pandemia-coronavirus-lombardia/ https://www.ilpost.it/2020/04/23/tamponi-andrea-crisanti/ http://www.salute.gov.it/portale/nuovocoronavirus/dettaglioContenutiNuovoCoronavirus.jsp?area=nuovoCoronavirus&id=5351&lingua=italiano&menu=vuoto https://www.startmag.it/mondo/covid-19-lombardia-veneto/

Environmental Social and Governance (ESG) investing has taken the center stage in finance. Investors have been increasingly pouring money into ESG funds, and asset managers have taken notice and responded to this trend by embracing ESG factors within their strategies to attract more inflows, balancing ESG requirements with traditional risk and reward considerations. Despite a lack of legal requirements from policy makers, stakeholders, both individual and institutional, have been seeking greater clarity regarding the impact of their contributions. They are keen to understand not only “if” asset managers are committing to ESG, but proactively asking questions about managers’ stewardship approach. With the current increased interest in ESG, it is important to understand what is ESG investing and what are the gaps in regulations that govern ESG stewardship and reporting? [caption id="attachment_5144" align="aligncenter" width="687"] Asset management firms manage funds for individuals and institutions by making investment decisions on their behalf while considering their unique circumstances, risk appetite and preferences[/caption] ESG stands for Environmental Social and Governance and refers to the three key factors when measuring the sustainability and ethical impact of an investment. Environmental factors include climate change, greenhouse gas emission, waste, pollution etc. Social include human rights, labor practices, talent management, product safety and data security. Governance refers to a set of rules or principles defining rights, responsibilities, and expectations between different stakeholders in the governance of corporations like board diversity, executive pay, and business ethics. The year 2019 has been a memorable one for ESG investments as it saw a significant jump in sustainable fund flows. In the US, for instance, investors poured a record $21 billion into socially responsible investment funds, almost quadrupling the rate of inflows in 2018. In Europe, sustainable fund flows reached €120 billion in 2019, nearly triple the previous year’s amount which stood at €44.8 billion. [caption id="attachment_5156" align="aligncenter" width="626"] European sustainable fund inflows (€ billion)[/caption] To illustrate ESG’s rising popularity among investors, Legal & General Investment Management “LGIM”, the UK’s largest asset manager with £ 1.2 trillion under management*, has more than doubled its business in 2019 due to its excellent ESG track record. The company’s assets under managements were boosted by a £37 billion mandate from the Government Pension Investment Fund of Japan, the world’s largest retirement scheme (more than $1.5 trillion in assets*) and a vocal advocate of responsible investing. LGIM’s CEO Nigel Wilson stated: “ESG is really contributing to our success... the brand is travelling very well.” While the degree to which asset managers have embraced this responsibility varies widely, we see growing evidence that some are taking this role seriously and using their influence to encourage greater sustainability. For instance, in 2019, BlackRock, the biggest money management firm in the world with more than $7 trillion under management*, announced its intention to start divesting from companies that get more than 25% of their revenue from coal production by mid-2020. (* figures are as at 31st December 2020) [caption id="attachment_5158" align="aligncenter" width="628"] A growing number of asset managers have voluntarily signed and embraced the United Nation’s Principles for Responsible Investment “UN PRI”[/caption] On much of this, the investment industry has been running ahead of the regulator, meeting market demands for a greater focus on ESG. However, the market has not been able to agree on common definitions, resulting in fragmentation. Ultimately, regulators will need to intervene. Investors are sending strong signals that they are unsatisfied with asset managers ESG criteria and disclosures. For instance, big names such as Morgan Stanley and Vanguard have been denounced for their “sin” stocks. Morgan Stanley Global Brands Fund had 6.83% in Philip Morris, its third largest holding, compared to 0.29% in the benchmark. The allocation comes despite the fact that the investment policy explicitly states the fund incorporates ESG considerations into its approach. The Vanguard SRI European Stock Fund did not have any tobacco exposure but was also criticized for its 5.7% allocated to alcohol, gaming and defense stocks. When questioned about their ESG criteria, some asset manager respond that they want to maintain a “seat at the table” with companies that do not score well on ESG metrics, that ESG does not equal ethical investment, or that their specific methodology does not reject a given product. Some investors might question such approaches, but from managers’ point of view, they carry potential for gains, both environmentally and financially. A Vanguard spokesperson said: “There are different flavors to socially responsible investing. Investors should look closely at a fund’s methodology and exclusion policy to ensure it matches their beliefs.” In their current form, ESG policies seem to be lacking two core elements: first, a universal consensus on what constitutes an ESG investment and a way for asset managers to assess ESG compliance in their portfolio; and second, reporting on ESG is still non-coercive and even if it were, without a proper framework, these policies remain inefficient. To demonstrate the ineffectiveness of current regulations, we turn to the EU, leaders in ESG regulations, to get an idea of current world standing in ESG policies. [caption id="attachment_5161" align="aligncenter" width="700"] Europe has been leading the race in sustainable finance regulation. The progress on the matter started immediately after COP 21.[/caption] In terms of ESG compliance, the EU has been working on creating ESG and climate change standards by deploying a Technical Expert Group on sustainable finance (TEG). However, most guidelines are still voluntary, non-legislative and unbinding for now. The current proposals include: - An EU green bond standard: The TEG proposed that the Commission creates a voluntary, non-legislative EU Green Bond Standard to enhance the effectiveness, transparency, comparability and credibility of the green bond market and to encourage the market participants to issue and invest in EU green bonds. In 2019, the TEG published a report on EU Green Bond Standard. - EU taxonomy: On June 2019, the TEG published a report on EU Taxonomy that sets out the basis for a future EU taxonomy in legislation. However, this report only tackles the climate change area of ESG. - Benchmark: The TEG has been working on recommending minimum technical requirements for the methodologies of the “EU Climate Transition” and “EU Paris-aligned” benchmarks, with the objective to address the risk of greenwashing (greenwashing refers to marketing that portrays an organization’s financial products, activities or policies as producing positive environmental outcomes when it is not the case). As part of its mandate, the TEG also worked on recommending the alignment with the Paris agreement and ESG disclosure requirements, including a standard format to be used to report such elements. Nonregulatory bodies have also been looking for solutions to help companies audit green conformity and provide companies with step by step instructions , such as the UN PRI. Signatories of the UN PRI recognize the potential impact of ESG issues on the performance of investment portfolios, they acknowledge that in order to be effective fiduciaries, they must integrate these factors into their investment analysis, seek appropriate disclosures, and incorporate ESG issues into their ownership and voting practices. As per ESG reporting, it is also still voluntary in most EU countries except for France which has made it mandatory for asset managers and institutional investors to report on how ESG are incorporated in their investment and risk-management processes with specific mention on climate change considerations (Article 173 of French Law on energy transition for green growth), and the Netherlands, where pension plans are required to disclose in their annual report if ESG criteria are incorporated. Reporting guidelines were only published recently in 2019 by the TEG and they provide non-binding advice to help disclose climate change mitigation investments and activities. In order to express their frustration, 631 institutional investors with more than $ 37 trillion in assets organized the largest ever joint call for climate change to governments during the 2019 COP 25 in Madrid. These investors wrote and signed a petition reiterating their full support for the Paris agreement and urging all governments to implement the actions that are needed to achieve the goals of the Agreement, with the utmost urgency. To conclude, it has become clear that regulations that govern ESG are still insufficient. The introduction of such regulations will be beneficial threefold: First for investors as they deserve more transparency, second for asset managers to simplify the current disclosure standards that are both confusing and expensive for them and to renew their trust with their clients, and third and most importantly for the greater good of society and the planet. Afaf Zarkik - Senior Analyst at Infomineo Sources: A sea of voices, Evolving asset management regulation report, KPMG, June 2019, https://assets.kpmg/content/dam/kpmg/xx/pdf/2019/06/a-sea-of-voices-eamr2019.pdf Action Plan on Sustainable Growth”, European Commission, August 3rd, 2018 https://eur-lex.europa.eu/legal-content/EN/TXT/PDF/?uri=CELEX:52018DC0097&from=EN Climate action in Financial institutions, https://www.mainstreamingclimate.org/initiative/ Climate change and Green finance: summary of responses and next steps, FCA , October 2019, https://www.fca.org.uk/publication/feedback/fs19-6.pdf ESG Investing 2.0: Moving Toward Common Disclosure standards, State Street, February 2020, https://www.statestreet.com/content/dam/statestreet/documents/Articles/1369%20ESG%20Metric%20and%20Reporting%20Standards.pdf ESG: Understanding the issues, the perspectives and the path forward, PWC, February 2019, https://www.pwc.com/us/en/services/assets/pwc-esg-divide-investors-corporates.pdf EU technical exert group on Sustainable finance, report on climate related disclosures, January 2019, https://ec.europa.eu/info/sites/info/files/business_economy_euro/banking_and_finance/documents/190110-sustainable-finance-teg-report-climate-related-disclosures_en.pdf EU technical exert group on Sustainable finance, Report on EU green bond standard, June 2019, https://ec.europa.eu/info/sites/info/files/business_economy_euro/banking_and_finance/documents/190618-sustainable-finance-teg-report-green-bond-standard_en.pdf EU technical exert group on Sustainable finance, Report on EU green bond standard – summary , June 2019, https://ec.europa.eu/info/sites/info/files/business_economy_euro/banking_and_finance/documents/190618-sustainable-finance-teg-report-overview-green-bond-standard_en.pdf EU technical exert group on Sustainable finance, Taxonomy technical report, June 2019, https://ec.europa.eu/info/sites/info/files/business_economy_euro/banking_and_finance/documents/190618-sustainable-finance-teg-report-taxonomy_en.pdf European Commission, Technical expert group on sustainable finance (TEG), https://ec.europa.eu/info/publications/sustainable-finance-technical-expert-group_en Europeans make record investments in sustainable funds, Chris Flood, Financial Times, January 2020, https://www.ft.com/content/c2952357-c28b-4662-a393-c6586640404f FCA urged to take action as investment industry shamed for greenwashing, Portfolio Adviser, November 4th 2019, https://portfolio-adviser.com/fca-urged-to-take-action-as-investment-industry-shamed-for-greenwashing/ Guidelines on certain aspects of the MiFID II suitability requirements, European Securities and Markets Authority (ESMA), May 2019, https://www.esma.europa.eu/system/files_force/library/esma35-43-869 _fr_on_guidelines_on_suitability.pdf?download=1 Investment Stewardship and the asset manager of the future, Legal & General Investment Management America, March 2020, https://www.lgima.com/landg-assets/lgima/insights/esg/esg-stewardship-and-the-asset-managers-of-the-future.pdf Monstrous run for responsible stocks stokes fears of a bubble, Financial Times, Temple-West, P., February 20, 2020. New business surges at Legal & General Investment Management, Financial Times, March 4th 2020 Regulating the growth of ESG Investing, A look at the landscape of ESG regulation around the world, across three main areas, Morningstar, June 3rd, 2019 https://www.morningstar.com/blog/2019/06/03/esg-regulation.html The Evolving Approaches to Regulating ESG Investing, Morningstar, June 3rd 2019 The Pension Protection Fund (Pensionable Service) and Occupational Pension Schemes (Investment and Disclosure) (Amendment and Modification) Regulations 2018, October 1st 2019, http://www.legislation.gov.uk/uksi/2018/988/regulation/4/made The Pension Protection Fund (Pensionable Service) and Occupational Pension Schemes (Investment and Disclosure) (Amendment and Modification) Regulations 2018 full PDF, made 10th September 2018 http://www.legislation.gov.uk/uksi/2018/988/made/data.pdf US Forum for sustainable and Responsible Investments, https://www.ussif.org/index.asp

Home to more than 700 million low-income citizens, Africa is considered a major market for micro-financial offerings, including microinsurance. According to the 2018 Landscape of Microinsurance in Africa study conducted by the Micro Insurance Network, only 2% of Africa’s low-income population is currently served by microinsurers. Microinsurance at its core is a type of insurance offering designed for affordability and inclusivity. This means that microinsurance only targets low-income clients, who cannot access mainstream insurance services or equivalent government programs. Despite operating with the same revenue and business model as traditional insurance providers, microinsurance companies serve these marginalized populations by offering suitable coverages for specific types of risks in exchange for low premiums. To better understand the microinsurance dynamics and progress in Africa, there needs to be a focus on two key elements. The first is the emergence of microinsurance and the type of products marketed in Africa, which will help categorize and explain the recent sector growth in the continent. The second point is the innovation in distribution channels, which highlights the type of efforts and initiatives made by microinsurance stakeholders to increase their profitability. Microinsurance in Africa: Context of emergence As a division of microfinance, microinsurance began to appear in the African market as a form of charity which was part of global financial aid programs introduced by international organizations. Other market players also started to offer cheap insurance policies to a specific type of clientele. These players include private insurers, mutual insurance companies and funds, microfinance institutions, NGOs, governments or semi-public bodies, etc. Two key main factors drew some of these players to the microinsurance market in Africa. First, the great success that microfinance practices had in Africa, in addition to a relatively low competition level compared to the traditional insurance market. Second, there was a significant insurance gap that needed tailored products to answer certain types of risks that were not covered by traditional insurance offerings. This led microinsurance programs to focus on the following types of products: -Credit life and life insurance, which respectively represent 26.2% and 15.1% of the total premium collected in 2017, are considered as the original microinsurance products developed in Africa. The domination of life and credit life insurance is due to the profitability that the products offer to the stakeholders as well as the flexibility of distribution of these products, that are often bundled with health and accident insurance policies. -Funeral insurance products, account for 17.4% of the total premium collected in 2017 in Africa, and are particularly successful in Southern African countries, including Zambia, Namibia, South Africa, Malawi, and Zimbabwe. These policies can also be offered as part of a life insurance policy. -Health insurance is another forefront microinsurance product which represents 25.5% of the total premiums collected. The product has been positively expanding in the African market over the past few years, and is provided through two main branches, either by supporting public coverage schemes or by directly offering complementary health products, such as hospital cash and health value-added coverages. -Crop and livestock insurance’s percentage of total premiums collected in 2017 stood at 4.9%. The product maintains its steady growth as one of the major microinsurance products, often supported by government schemes. These schemes not only support the vulnerable population that needs micro agriculture insurance, but also help the private insurers face the higher claims ratios and costs structures caused by the distribution difficulties and climate challenges. Innovative distribution channels for a more profitable microinsurance market Microinsurance distribution channels in Africa are highly reliant on partnership models. 68% of microinsurance companies in Africa distribute their products using brokerage and agency channels. And 22% of companies partner with microfinance institutions to either directly sell the individual microinsurance policies or bundle them with other micro-financial products. Proportion of microinsurance providers making use of each distribution channel type in 2017 [caption id="attachment_5115" align="aligncenter" width="678"] Source: Recreated using data from the Landscape of Microinsurance in Africa 2018 report published by the Microinsurance Network in 2019 [/caption] In recent years, microinsurance has become an attractive segment for multiple insurance providers due to the high demand and overall potential profitability of the products. Consequently, this rush towards the market has led more stakeholders to launch new microinsurance products. In addition to the rise in competition, micro insurers face another type of challenge related to policy costs. As previously defined, the microinsurance business model is based on low-premium policies. This pricing constraint has an impact on the policy costs that are not proportional to the policy value or type. In order words, micro insurers have to offer low-premium policies while taking into consideration the high costs of the underwriting and distribution processes. To deal with this issue, microinsurance providers are gradually increasing the use of digital technologies and platforms in their processes. Moreover, microinsurers are also finding great value in Mobile Network Operator (MNO) partnerships that allow them to facilitate the distribution of the products while reaching new clients based in rural areas. For instance in Ghana, Tigo began offering a life insurance product that is bundled with the customers’ monthly cell phone subscriptions. The offering was developed in partnership with Bima, a Swedish company specializing in mobile insurance, Vanguard Life Assurance, a local insurer, and MicroEnsure, a specialist insurance provider. The basic insurance scheme allows customers to access free of charge life insurance for themselves and one family member. The insurance coverage also depends on how much airtime customers use in a month. In case customers want to upgrade their coverage, they can pay an extra monthly premium, which gives them additional life coverage for them and their families. Partnerships with mobile money operators have also emerged as a new way for microinsurance companies to digitalize steps in the insurance value chain which include premium collection and claims payments. A major example of this is the microinsurance offering provided by telecommunications provider Safaricom and their leading mobile money solution M-Pesa. Safaricom established partnerships with several micro-insurers such as UAP Insurance, Britak, MicroEnsure, and GA Insurance. The microinsurance products offered include weather index insurance designed to insure and disbursement maize and wheat farmers, personal accident, life, disability, and health insurance products. Through these partnerships, microinsurance carriers can directly receive premium payments from the policyholders using M-PESA’s mobile money transfer service. In addition, policies management, monitoring, and adjustment processes are completed through FrontlineSMS and PaymentView, which are the integrated open-source software programs. Technology-based integrations in the microinsurance experience seem to be a real opportunity for microinsurance providers to grow their business and reach more customers. According to a study from Cenfri, 277 unique digital platforms are operating in Ghana, Kenya, Nigeria, Rwanda, South Africa, Tanzania, and Uganda. And 20 of these platforms already integrate insurance products in their offerings. Lastly, there is no doubt that microinsurance is a promising sector experiencing drastic growth across its operations as well as its innovation processes. And while costs constraints remain a major challenge for micro insurers, recent initiatives showcase the efforts undertaken by stakeholders to increase the reach and viability of micro-insurance as a standalone and profitable sub-sector. Intissar Mounaji - Senior Analyst at Infomineo Sources : https://microinsurancenetwork.org/sites/default/files/Landscape%20of%20Microinsurance%20in%20Africa%202018_LR.pdf https://assets.kpmg/content/dam/kpmg/za/pdf/2017/08/microinsurance-in-africa.pdf https://www.gsma.com/mobilefordevelopment/wp-content/uploads/2012/07/MMU_m-insurance-Paper_Interactive-Final.pdf http://www.impactinsurance.org/sites/default/files/MP26%20v3.pdf

"Power to X" in few words "Power to X" or "PtX" is a technology that consists in transforming electricity into another energy vector. This "X-vector" could be heat (Power to Heat) to meet industrial needs or to supply heating networks. It could also be a synthesis gas (Power to Gas) such as hydrogen for mobility purposes, or methane which can itself be injected into the gas network for industrial, heating, or mobility needs. "Power to X": What opportunities exist for Morocco? Thanks to its strategic geographical position and exceptional wind and solar energy potential, Morocco could capture a significant share of Power to X demand, estimated at 2- 4% of global demand in 2030. This was the most prominent result of the two studies carried out simultaneously by the three German Fraunhofer Institutes in 2018 that aim to explore the economic and ecological impact of Power to X on Morocco. In this regard, a workshop about Power to X technology and its opportunities in Morocco was organized on February 11, 2019 within the framework of the Moroccan-German Energy Partnership (PAREMA). The purpose of the workshop was to showcase the results of these studies that reveal to which extent this technology will constitute an opportunity for renewable energy in Morocco as a local industry with high export potential given the country's objective of reaching 52% of the renewable energy mix by 2030. However, according to Prof. Wolfgang Eichhammer project coordinator from Fraunhofer ISI, investing in technologies substituting fossil energy sources but involving other environmental risks such as increasing the consumption of land, water and resources have to be assessed very carefully and linked to sustainability criteria. In this respect, Morocco could become an exporter of carbon-neutral energy sources and make a major contribution to achieving the Paris Climate Agreement target if and only if it is able to deal with the risks associated with PtX. To this end, the Minister of Energy, Mines and Sustainable Development announced the establishment of a national task force supported by a consortium of public and private actors as well as the elaboration of an in-depth study to prepare the PtX roadmap for Morocco. Hydrogen & Ammonia: main development focus by 2030 The Research Institute for Solar Energy and Renewable Energies (IRESEN) has announced recently that Morocco will become a carbon-neutral energy exporter by 2030 through the launch of construction works for a dedicated platform for green hydrogen and ammonia starting January 2020. This infrastructure, with an investment amounting MAD 150 million, results from a partnership between IRESEN, via Green Energy Park, and both OCP and the Mohammed VI Polytechnic University on the Moroccan side, as well as Fraunhofer institutes on the German side. The platform will be dedicated to the R&D demonstration of Power to X technologies, with a diversified research program on hydrogen applications in the production of high added value green molecules such as ammonia and methanol. It is worth pointing out that this technology is complementary to renewable energies and will help to reduce carbon emissions while creating a strong opportunity for economic and social development through exports due to the current lack of profitability of conventional electricity exports given the sharp drop in renewable energy costs compared to electricity transmission. In addition, beyond the existing infrastructures, in particular, the Maghreb-Europe Gas Pipeline and the port infrastructure, capable of playing the role of a liquid fuel export platform, economic relationship with the European Union are constantly strengthening. In Europe, Germany which is the Kingdom's privileged partner in renewable energy sector, intends to replace its fossil fuel (coal) and nuclear energy needs starting from 2022 until 2038 by importing clean energy, in accordance with its environmental commitments. According to Badr IKKEN the General Director of IRESEN, this situation represents an important opportunity for countries like Morocco, capable of producing clean fuels, particularly green molecules such as hydrogen and green derivatives. Fertilizer industry: a good illustration of the economic opportunity for Morocco Together with hydrogen, green ammonia represents a promising economic opportunity to satisfy not only the needs of its local fertilizer industry but also those of the international market in the long term. Indeed, the Kingdom is highly dependent on imported ammonia as an input for phosphorus-based fertilizers from Ukraine, Trinidad & Tobago, and the USA. Replacing these imports with green ammonia may, therefore, strengthen local fertilizer manufacture. In terms of capacity, about 3 GW will be needed to produce 1 Mt of green ammonia, which corresponds to Morocco's current imports. A domestic production of ammonia would represent, for Morocco, not only an opportunity for independence but also an opportunity to diversify its traditional markets. Furthermore, the export of clean ammonia can reduce greenhouse emissions by ~95% making it beneficial for both exporting and importing countries. National task force to present a study on the development of PtX roadmap In April 2020, a study on the development of the roadmap was presented at the 3rd meeting of the National Power-to-x task force. According to the study, the draft roadmap should propose: - Short-term actions that aim to reduce costs along the entire production and operating value chain through the establishment of a dedicated industrial cluster to deal with the development of an infrastructure master plan. The actions also aim to ensure technology transfer through capacity building and the development of local content and to create the right conditions for the export of P2X products. - Medium-term actions through the development of a storage plan for the electricity sector and the establishment of an appropriate regulatory framework for the use of Power-to-x in transport. - Long-term actions through the development of a regulatory and commercial framework to extend Power-to-x technologies to heat production. It was also recommended that three working groups be set up. The first should be tasked with translating the roadmap into a portfolio of concrete, pilot and deployment projects for Power-to-x technologies. The second group will be responsible for developing an appropriate approach to develop exports of green molecules, in order to seize the opportunities offered in Morocco and which are already reflected in the interest expressed by the Kingdom's European partners. While the third group will be responsible for further strengthening research and development in the various fields related to Power-to-x. World "Power to X" Summit 2020: a showcase of the Moroccan leadership Organized by IRESEN, the first edition of the World Power-to-X Summit is a conference gathering policymakers, industry leaders, research experts, and worldwide innovators to discuss the PtX technology and its uses in producing renewable electricity, green molecules and feedstock, CO2 recycling.... This two-day conference was planned to take place in Marrakech from June 10 to June 12, 2020, however, with the current circumstances due to the COVID-19 pandemic, a rescheduling might take place. Safae Laghmari - Senior Analyst at Infomineo References: Ait Almouh, H. (2019). "Power To X: Quel intérêt pour le Maroc?", lavieeco.com, March 12, available at: https://www.lavieeco.com/economie/energie/power-to-x-pour-le-maroc-quel-interet-pour-le-maroc/ Benmalek, S. (2019). " Énergies propres : le modèle marocain intéresse l’Allemagne, selon Rabbah", lematin.ma, December 10, available at: https://lematin.ma/journal/2019/energies-propres-mode-marocain-interesse-lallemagne-selon-rabbah/327813.html Bladi.net (2019). "Énergies Renouvelables : les ambitions du Maroc à l’horizon 2030", bladi.net, December 2, available at: https://www.bladi.net/energies-renouvelables-maroc,62055.html Challenge.ma (2019). " Le Maroc bientôt exportateur de pétrole… vert", challenge.ma, November 30, available at: https://www.challenge.ma/petrole-vert-le-maroc-bientot-exportateur-124529/ Fédération de l'Energie (2020). "World Power to X summit 2020 du 10 au 12 Juin à Marrakech", fedenerg.ma, available at: http://www.fedenerg.ma/evenement/world-power-to-x-summit-2020-du-10-au-12-juin-a-marrakech/ Finances News Hebdo (2019). "Les grandes ambitions du Maroc sur le marché de l’hydrogène à l’horizon 2030", fnh.ma, December 9, available at: https://fnh.ma/article/developpement-durable/les-grandes-ambitions-du-maroc-sur-le-marche-de-l-hydrogene-a-l-horizon-2030 Fraunhofer - ISI, (2019). "Carbon-neutral energy from power-to-X: Economic opportunity and ecological limitations for Morocco", isi.fraunhofer.de, September 2019, available at: https://www.isi.fraunhofer.de/en/presse/2019/presseinfo-24-klimaneutrale-energie-aus-power-to-x-marokko.html H2 Today (2019). "Le Maroc veut se lancer aussi dans l’hydrogène", hydrogentoday.info, August 27, available at: https://hydrogentoday.info/news/5678 IRESEN (2019). "Terms of reference: Expert Mission for Assistance in a Study on 2050 Power-To-X Roadmap for Morocco", iresen.org, October 8, available at: http://www.iresen.org/Site_Iresen/wp-content/uploads/2019/10/ToR_ConsultMar_PtX-Road-Map-2050-Morocco_FV.pdf La Quotidienne (2019). "Le Maroc se met à la technologie «Power-to-X»", laquotidienne.ma, February 13, available at: https://www.laquotidienne.ma/article/developpement_durable%20/le-maroc-se-met-a-la-technologie-power-to-x Libération (2019). "Le Maroc pourrait devenir un exportateur de pétrole vert avant 2030", libe.ma, December 3, available at: https://www.libe.ma/Le-Maroc-pourrait-devenir-un-exportateur-de-petrole-vert-avant-2030_a113744.html MAP Ecology (2019). "«Power-to-X»: une commission nationale verra le jour", mapecology.ma, February 13, available at: http://mapecology.ma/actualites/power-to-x/ Media 24 (2019). "Energies renouvelables: le Maroc prépare sa feuille de route "Power to X", media24.com, February 13, available at: https://www.medias24.com/power-to-x-maroc-energie-145.html Media 24 (2019). "Le Maroc, exportateur de pétrole vert avant 2030", media24.com, November 30, available at: https://www.medias24.com/le-maroc-exportateur-de-petrole-vert-avant-2030-5925.html Ministry of Energy, Mines and Environment (2019). "« Power to X», Hydrogène et ammoniac verts: Quelles opportunités et priorités pour le Maroc?", mem.gov.ma, February 11, available at: https://www.mem.gov.ma/Pages/CommuniquesDePresse.aspx?CommnuniqueDePresse-89.aspx Morocco Travel Blog (2020). "World Power-to-X Summit 2020 Comes To Marrakech", moroccotravelblog.com, January 7, available at: https://moroccotravelblog.com/scalia_news/world-power-to-x-summit-2020-comes-to-marrakech/ www.energypartnership.ma (The Moroccan-German Energy Partnership - PAREMA website) https://industries.ma/la-feuille-de-route-nationale-pour-les-technologies-ptx-au-centre-dune-reunion-a-rabat/ https://leseco.ma/power-to-x-une-feuille-de-route-nationale-en-reflexion/

Being a key growth engine of the luxury sector worldwide, China remains one of the main luxury markets globally with consumers accounting for 33% of the global luxury goods spending in 2018 with predictions to reach 46% by 2025 (more than Americans, Europeans, SE Asians and the Japanese combined). Additionally, experts estimate that half of the purchases will be made domestically, driven by a series of moves introduced by the Chinese government including lowering import duties and taxes on luxury goods. Despite the domination of the store-based retail channel in the luxury goods market in China, e-commerce is continuing to disrupt the luxury retail sector through digital platforms, integral mobile apps (Wechat), facial recognition and AI. The penetration rate of e-commerce for luxury products is growing at a fast pace and estimated to reach 13% by 2021 from 5% in 2016. Considering this, luxury players have been questioning on what is the best channel to invest in: Brick & Mortar stores? e-commerce? or perhaps investing in both for a perfect omnichannel customer journey. In the online retail context, Fashion luxury brands have been trying different operating models: brand owned channels, Mainstream B2C channels and Luxury verticals. The chart below² shows how major luxury players are active in brand owned channels, while the participation in marketplaces and e-commerce websites remains low in China: Globally and in China, luxury brands moved from a wholesale model to an e-concession model to increase the online penetration. In this model, brands control pricing, assortment and the supply chain whereas marketplaces offer platform infrastructure, tools (product management, secure payment system, etc.) and the customer database. In addition, this model allows a better strategy integration rather than making brands inventory available via the site. In China, major luxury brands partnered with the biggest e-tailers and e-marketplaces (JD.com and T-Mall) on online flagship stores and mobile apps to expand their online footprint: - The Italian fashion house Prada Group has formed a partnership with JD.com for an authorized flagship store on its platform. The deal that was set in June 2019 featuring Prada’s fall/winter collection. - Back in 2015, Tag Heuer, a Swiss Luxury watch brand has also announced an exclusive e-commerce partnership to include the establishment of TAG Heuer's first China online flagship store on JD.com's marketplace platform. - Tapestry, the house of modern luxury accessories and lifestyle brands: Coach New York, Kate Spade New York and Stuart Weitzman announced a strategic partnership with T-mall (Alibaba Group) in adopting the Flagship Store 2.0 which provides the brands with powerful tools to feature customized content, and offer a rich shopping experiences for customers. - Aside from Tapestry, more than 150 brands with products ranging from apparel and beauty items to watches and luxury cars (Alexander McQueen, Chanel, Bottega Veneta, Cartier, Burberry, etc.) are listed in the T-mall Luxury pavilion that was launched in 2017. - Not only brands, but European Luxury e-tailers such as Net A Porter are also capturing the rising wave of the flagship store integration by Chinese marketplaces: Yoox Net-A-Porter signed with Alibaba a joint venture (JV) deal in 2018 to bring its platform to Chinese consumers. Under the deal, Net-A-Porter and Mr Porter launched mobile apps, as well as flagship stores on Tmall Luxury Pavilion. In Europe, Burberry and Gucci approached luxury retailers Farfetch and MatchesFashion for unique e-commerce collaborations: - British luxury label Burberry was the first brand Farfetch partnered with on this basis: For the first time, technology developed by Burberry has been integrated to the Farfetch API – the platform’s operating system - allowing the brand’s entire global inventory to be available through an ecommerce platform. Burberry has since said it’s extremely happy with the results. - Gucci which seeks to boost sales and margins, is also looking to turn more of its collaborations with 3P and multi-brand retailers such as Matchesfashion.com into online concessions, where it controls everything from the product collection and selection to their presentation. Since Chinese consumers are eager for superior and premium experiences as well as innovative solutions, brands and retailers could think of personalized services that add a value to the e-shoppers experience such as Virtual try-on services, matching suggestions performed by AI, 24-hour white-glove dispatch, and distinctive shopping bags. Saad Ibenbrahim – Senior Associate at Infomineo Sources: The Future of Luxury: A Look into Tomorrow to Understand Today – Bain & Company – January 2019 China Luxury Report 2019 – Mckinsey & Company Vogue Business – November 2018 Fashion Network – April 2019 JD.com Blog – June 2019 This Is Money – June 2019 JD.com Press Release – September 2015 CPP Luxury – November 2019 Alizila – January 2020 The drum – October 2018 Farfetch Press release – February 2018 Businesswire – September 2019 China’s next retail disruption: End to end value chain digitization – PWC - 2018

Today, thanks to digital technology, Africa is the second largest banking market in the world in terms of growth and profitability according to a study conducted by the international consulting firm McKinsey and published in February 2018. While in most parts of the world, the banking sector is facing poor performance and sluggish growth, the African banking sector is in stark contrast as it is growing rapidly and is profitable at twice the global average. McKinsey reveals, in this context, that the number of Africans with bank accounts has increased from 170 million in 2012 to nearly 300 million in 2017. This figure is expected to reach 450 million over the next five years. The sector's revenues on a continental scale are expected to increase from $86 billion in 2017 to $129 billion in 2022. However, this performance is not fairly reflected at the level of the various regions and countries of the continent. Indeed, only five African countries (South Africa, Nigeria, Egypt, Angola and Morocco) currently account for 68% of the continent's total banking revenues. Hence the emergence of new innovative business models to overcome the many challenges facing the retail banking sector in Africa, particularly the low rate of bank-access, the massive use of cash and the weakness of branch networks and ATMs. While traditional banks are still not widely adopted by the population, Africa is increasingly relying on digital and mobile offers. The very low number of branches, at 5 branches per 100,000 inhabitants in Africa compared to 13 per 100,000 inhabitants in emerging Asian countries, partly explains the explosion of the digital banking phenomenon. Indeed, the volume of such transactions increased by 13% per year on the continent between 2014 and 2016, thanks to improved availability, reliability and security of electronic channels. This has made Africa the second fastest growing market in the world for electronic payments after Asia-Pacific. Moreover, about 40% of Africans now prefer to use digital channels for banking transactions. The Birth of The Digital Banks in Africa Previously, the evolution of an African bank was noted in relation to the number of its opened branches that was observed in Morocco for example with an average of 50 openings per year. These banks mainly managed cash, and their administration was traditional. The digital revolution began with the introduction of mobile banking by telecom operators such as Safaricom in Kenya, a subsidiary of the British group Vodafone, via its M-Pesa system, which quickly overtook the banks. In a world that had until then been very poorly banked, with an average banking rate of 5 to 15% in African countries, except Maghreb region and South Africa, mobile telecom operators have been able to use their proximity to customers and capitalize on mobile terminals, whether with basic phones called "Feature phones" using the USSD protocol or smart phones, to offer a wide range of mobile banking services. The uses of mobile money have evolved, moving from transactional operations (cash in and cash out, bill payments, salary payments, bank to mobile transfers, etc.) to advanced financial services involving an entire ecosystem (insurance, microfinance, etc.) and supported by an increasingly developed digitalization. In 2018, there were approximately 346 million mobile money accounts registered in Africa compared to 120 million bank accounts. M-PESA & Orange Money: Examples of Mobile Banking Success Stories Since its introduction in 2007, M-Pesa has fundamentally transformed Kenya's increasingly digital economy, with fast, secure and traceable transactions. A study by the Massachusetts Institute of Technology estimates that 2% of Kenyans have risen out of poverty thanks to mobile micro-credits. According to Safaricom, the platform has generated up to 2017 some 860,000 jobs, about $1 billion in economic activity (€925 million) and contributes to 6.5% of Kenya's GDP. Another example of remittances by telecom operators that has prompted African banks to review their sense of innovation to win new customers is Orange Money. Ten years after the deployment of its offer in French-speaking Africa, the service has 38.7 million customers in 17 countries and 13 million monthly users. In 2017, it generated €26 billion of transaction values. In Burkina Faso, this amounted to €5.2 billion in 2016, almost half of the country's GDP. Even better, Orange Money generated revenue of €241 million in 2017, representing 5% of Orange's revenue in Africa and the Middle East. In some countries, this service represents between 10% to 15% of the operator's revenue, as in Côte d'Ivoire, where Orange Money has 6 million subscribers, which represents more than half of the local market. As a result, some twenty leading banks on a continental scale have started the process of digital transformation, enabling all "traditional" banking services to be dematerialized (i.e. consultation, transfers, downloading bank statements, ordering checkbooks or online savings management) but also to propose new innovative services. This dematerialization has a triple objective: to facilitate customer procedures, win new customers and reduce banks' management costs. Mobile Telecom Operators and FinTech: From Competitors to Partners In parallel, the rise of fintech has disrupted the institutional banking market for several years. FinTech, new innovative players, are imposing a new form of competition on banks in a market where competition is already high. Indeed, banks already face mobile telecom operators and companies specialized in money transfer and payment. These competitors now have a significant market share through their innovative mobile money transfer and mobile payment solutions. This predominant position would not have been possible without the important work of raising awareness and educating people, especially those with limited bank access, who are aware of the advantages of dematerialized money compared to a traditional bank account. Faced with the innovations of operators and new players, and in a context of a booming market, traditional banks must adapt to remain competitive. As a result, new partnerships have been established between banks and telecom operators on one side and fintech on the other side to provide mobile/online financial services to their customers while benefiting from a lower cost than the bank branch network. This is the example of M-Shwari in Kenya, a mobile lending application developed through a partnership between the Commercial Bank of Africa and Safaricom. The platform provides 80,000 consumer loans per month with only 1.9% of non-performing loans in its portfolio. Another option is to enter into a partnership with Fintech such as Jumo, which brings together data and algorithms to enable its partners, such as Barclays Africa and Old Mutual, to provide 50,000 loans per day, or Société Générale, which has called on TagPay, the world leader in digital security, to design its digital process. Digital banking: What about Morocco? Several years after the launch of the M-Pesa application, the digital fever has seized the banking groups, which are multiplying their investments to catch up in the field of mobile payment and online financial services. In Morocco, for example, and like its Maghreb neighbors, where central banks' regulations are more restrictive, banks have become aware of the importance of digital technology in ensuring the sustainability of their activities. In 2016, BMCE Bank launched Morocco's first online banking site "BMCE DIRECT" and two years later, the bank has launched its digital think tank and its mobile payment solution DabaPay as part of its digital transformation program. In 2016, "L'Banka Lik", the mobile bank of the Attijariwafa Bank group, was also launched. In 2018, "L'Banka lik" was able to capture nearly 7 million connections per month, positioning the group as the leader in this field with 31% of market share. In partnership with ScreenDy, CIH Bank organized its first Hackaton (28 and 29 January 2017) as part of its "CIH Open Innovation" program, aiming at developing innovative mobile applications to reinvent the bank's business. In May 2018, the bank launched its mobile payment solution Wepay. In 2019, CIH partnered with CFG Bank for instant interbank transfer. The bank hopes to have the concept generalized to all banks by the end of the year. Recently, Inwi launched its mobile payment solution, called "inwi money", on September 3, 2019, and became the first telecom operator in Morocco to offer this type of solution to the public after obtaining approval from Bank Al-Maghrib, the country's central bank to create its perfectly autonomous payment institution. Like the existing solutions already unveiled by other operators, inwi money will allow each holder of a mobile phone, regardless of his telecom operator, to have a mobile wallet, attached to his phone number. The customer can now fund or withdraw money from his wallet in the points of sale approved by the telephone operator, or through other means such as bank transfer. Digital banking: The Solution for Africa's Financial Inclusion The enthusiasm for digital banking solutions in sub-Saharan Africa is making the region a source of inspiration for the rest of the world. In this region, the low level of banking coverage associated with the rise of mobile phones has created a powerful leverage effect, while in Europe or other developed regions, the market is mature, and the population is largely banked. The banking offer is denser and more qualitative, with extensive banking networks that do not give operators the same opportunities to replace banks. The development of 3G and the explosion in the number of smartphones users in Africa (smartphone adoption is expected to increase to 463 million by 2020, or 167 million more than at the end of 2016 - according to GSMA) are opening new opportunities and democratizing access to banking services. End customers in Africa do not have the same apprehensions as European customers about banking and are much less conservative about banking products. In terms of disruptive innovation, the weight of the systems installed is an obstacle that is always difficult for banks to overcome. The absence of existing systems in Africa frees it from these constraints and allows it to carry out its financial inclusion projects. It is taking a technological leap forward by deploying digital banking to serve these new populations. Therefore, digital banking is the solution to traditional banking that makes it possible to overcome the shortcomings in banking infrastructures and thus accelerate financial inclusion in Africa! Safae Laghmari – Research analyst at Infomineo References: https://www.forbesafrica.com/interview/2018/11/28/why-digital-banking-is-unique-in-africa/ https://www.bearingpoint.com/fr-ma/notre-succes/publications/le-digital-banking-en-afrique/ https://afrique.latribune.fr/think-tank/2018-11-05/le-digital-banking-en-afrique-tribune-796331.html http://innovafrica.net/banque-digitale-lafrique-subsaharienne-terre-dinvention-de-la-banque-du-futur-auteurs/# https://lematin.ma/journal/2019/digitalisation-enjeux-decisifs-banques-2019/311209.html https://mck.co/338QIq1 https://banque.meilleurtaux.com/ouvrir-un-compte-bancaire/actualites/2017-juin/banques-africaines-pleine-evolution-grace-a-digitalisation.html https://www.ovh.sn/news/articles/al206.afrique-tagpay-invente-banque-du-futur https://afrique.latribune.fr/finances/2018-04-12/mobile-banking-ecobank-et-mtn-scellent-un-partenariat-strategique-en-afrique-775080.html https://www.bankobserver-wavestone.com/le-mobile-banking-en-afrique-une-source-dinspiration-pour-les-marches-europeens/ https://www.jeuneafrique.com/mag/589438/economie/mobile-banking-orange-money-sur-tous-les-fronts/ https://www.jeuneafrique.com/mag/489420/economie/bancarisation-la-rentabilite-ne-se-mesure-pas-a-court-terme/ https://www.jeuneafrique.com/mag/421063/economie/mobile-banking-success-story-nommee-m-pesa/ https://www.jeuneafrique.com/mag/589451/economie/le-mobile-money-en-chiffres/ http://leboursier.ma/Actus/3940/2019/02/23/Services-bancaires-la-revolution-Ahmed-Rahhou.html https://lnt.ma/evenement-premiere-edition-cih-open-innovation-hackathon-experience-humaine-unique-partie-1/ http://www.leboursier.ma/Actus/1777/2018/05/11/CIH-Bank-lance-officiellement-sa-solution-de-paiement-mobile-WEPAY.html https://www.huffpostmaghreb.com/entry/cih-bank-veut-revolutionner-les-services-bancaires-via-son-application-mobile_mg_5c73afc4e4b03cfdaa577a08 https://www.challenge.ma/bmce-bank-lance-le-think-tank-digital-95893/ http://fr.le360.ma/economie/paiement-mobile-bmce-bank-lance-la-solution-dabapay-167124 https://www.medias24.com/inwi-lance-sa-solution-de-paiement-mobile-inwi-money-4160.html https://www.medias24.com/MAROC/ECONOMIE/ENTREPRISES/169227-Coup-d-envoi-de-L-Bankalik-la-banque-mobile-d-Attijariwafa-Bank.html http://fr.le360.ma/economie/banque-digitale-attijariwafa-bank-revendique-plus-de-30-de-parts-de-marche-186402

In southern Morocco, on the edge of the Saharan desert, sits one of the world’s most remarkable engineering projects: the Noor Power Plant. This is the second largest solar plant in the world with a total capacity of 510MW and an area that dwarfs the nearby city of Ouarzazate. However, its staggering size is not the only thing setting this power plant apart. Unlike most solar projects which use photovoltaic (PV) technology, the Noor Power Plant employs Concentrated Solar Power (CSP). While PV exploits the chemical and physical properties of photons hitting a solar cell (see photovoltaic effect), CSP exploits the thermodynamic properties of the sun. In simplified terms, a CSP plant has mirrors concentrating sunlight on a thermal receiver (normally molten salts) heating it up to 150–350 °C. The heat trapped in this fluid is then used to generate steam to drive a turbine connected to a generator, much like any other thermoelectric plant. This process is fundamentally different from a PV installation where the solar panel itself is the generating element. This difference has a crucial impact on the point of dispatchability. Without investing in additional battery storage assets, a PV facility can only dispatch electricity as it’s being produced. This is a huge drawback since it means that a PV system must usually be integrated by an alternative source of dispatchable energy to cover non-productive hours (nighttime, cloudy weather, etc…) or invest in expensive storage solutions (usually l-ion batteries). R&D has made strides in electricity storage techniques, but these remain a costly solution for utility scale projects. [caption id="attachment_4983" align="aligncenter" width="577"] Solar Power Explained[/caption] Instead, a CSP system can intrinsically store potential energy as heat in the working fluid for hours allowing producers to choose the time and amount of energy to dispatch even when the sun isn’t shining. This means that it does not need to be integrated by other power sources and does not require expensive electricity storage solutions. The storage capabilities have been rapidly improving just over the past few years too. Taking the Noor Power Plant as an example, Phase 1 (commissioned in 2016 ) has a storage capacity of 3 hours while Phase 2 and 3, which came online only 2 years later, can store energy for 7 hours. Despite this significant advantage CSP only accounts for less than 2% of all solar power projects. Why is this? The main factor has to do with space. CSP requires approximately twice as much acreage as PV to produce the same energy. In addition this area must be contiguous since the mirrors must reflect on a single heat receiver. Adding to this direct cost are the costs associated with construction in vast, barren, flat and hot places, i.e. deserts. Projects in these remote locations require construction of ancillary infrastructure such as longer roads, transmission lines, facilities, and transportation. This translates in higher capital expenditures for CSP. While the space requirement and associated costs are intrinsic to the technology, another cost factor are the installation costs which are still significantly higher than PV due to the relatively low developer experience and limited supply chain. Yet, these are already declining due to the slow but constant commissioning of new projects. In fact, 2018 saw a 26% drop in the global weighted average Levelized Cost of Electricity (LCOE) over 2017. CSP’s LCOE in 2018 was 0.185 USD/kWh, significantly higher than PV’s 0.085 USD/kWh. This is also still above the fossil fuel cost range (0.05-0.17 USD/kWh). Notwithstanding, current auction and PPA data suggests that by 2020 CSP will offer electricity in the USD 0.06 to US 0.10/kWh range. Dropping costs and dispatchability are bound to significantly accelerate the adoption of this technology worldwide. However, it may be wrong to view CSP and PV as competitors. As illustrated earlier, these are two fundamentally different technologies. It is the opinion of this analyst that CSP is better tailored for large utility scale projects while PV is better suited for distributed energy production and smaller capacities (rooftops, parking lots, self-consumption, etc…). CSP may be better understood as a direct competitor of other dispatchable thermoelectric energy producers such as gas and coal plants. Afterall renewable technologies should supplant fossil fuels not each other. This certainly appears to be the idea of the Moroccan Renewable Energy Agency (MASEN) which aims to blow the historical achievements set by the Noor plant out of the water with the Midelt project which integrates CSP and PV to produce 800MW in order to meet its 2020 target of 2000MW solar capacity. Over 2,000 years have passed since Archimedes used sun-mirrors to burn Roman ships to break the siege of Syracuse, it appears that we may have to rely on the same idea to get ourselves out of an even bigger mess yet again. Lorenzo W. Bruscagli - Associate at Infomineo References: RE PROJECTS MAP PV or Concentrated Solar Power, which solar power technology will you choose?, HelioSCP, August 8 2017 Renewable Power Generation Costs in 2018, IRENA MASEN Launches Noor Midelt II Solar Farm Tender Process, Morocco World News, July 10 2019

The US-China Trade War has seen two of the world’s largest economies battle each other through increased tariffs, political speeches and propaganda. While the presence of both countries in international cooperation forums, such as the G-20 summit should imply that there is hope for a quick “cease fire”, the current scenario points at a long, and more importantly, costly war. Economists estimate that the expansion of tariffs in US-China trade, and a consecutive fall in financial markets, could represent a decline of the world’s GDP by 0.6% ($600 billion) in 2021. Even though Africa is not a direct target in the US-China Trade War, the continent is already being affected by its impacts. U.S. tariffs have contributed to drops in commodity prices, local currencies, and major stock exchanges across Africa, shaking investor confidence in the continent. Moreover, the expected slowdown in the Chinese economy will also hinder the exports and government revenues of many economies across the African continent. However, in this scenario where the world’s largest economies are colliding, there are still opportunities for Africa to reap some benefits. More importantly, despite recent initiatives such as the Continental Free Trade Area (CFTA), the impacts of the trade war have exposed many pending tasks for Africa in terms of economic development. These pending tasks are not only preventing the economies of the continent from reaping further benefits from the Trade War, but also hindering their long-term prospects for economic growth and development. The Threat of the Trade War The African Development Bank estimates that the trade tensions could cause a 2.5% reduction in GDP in resource-intensive African countries and a 1.9% reduction for oil exporters by 2021. In some African economies, the fall of commodity prices has affected export values and revenue generation for some governments. This is especially important for countries and governments that rely on the exports of a small set of commodities with non-African partners, including China. Moreover, weak manufacturing sectors, infrastructure gaps, domestic instability and unsustainable economic policies have hindered the economic diversification of many countries in Africa, making them extremely vulnerable to falls of commodity export volumes and prices. Source: CSIS with data from IMF and the African Development Bank.[/caption] The International Monetary Fund (IMF) lowered African growth projections from 3.3% to 3.1% for 2019 due to rising trade tensions, Brexit and slow growth in China, and warned that the trade war could cause a 1.5% drop in Africa’s GDP growth by 2021. A decrease in demand from China could also reduce annual imports from Africa by $75.26. China is Africa’s top trading partner and represented 12% of total African exports during the past 5 years, with raw material representing most of the total exports from Africa to China during the period. While the reliance on China does not seem very large at continental level, some African countries are heavily dependent on China for their exports. Source: Own elaboration with data from ITC Trademap.[/caption] Some of the most developed economies in the continent, such as Nigeria and Morocco have a relatively diversified trade balance in terms of partners, and China does not weight heavily on their export activity. However, countries such as Sierra Leone, Congo and Angola depend on China for half of their exports, with South Sudan being a more extreme case relying on China for almost 100% of its exports. Source: Own elaboration with data from ITC Trademap.[/caption] While some sources point that the trade war might bring new commercial opportunities for many countries, African economies and businesses are not well positioned to obtain great benefits in this scenario. Even though manufacturing companies are relocating their operations outside of China to avoid US tariffs, other regions with more developed manufacturing sectors and more integrated supply chains, such as Latin America and Asia, are better positioned to reap the benefits and attract these investments. South Africa is probably the only economy in the continent with the capacity to obtain some benefits out of the trade war in this scenario, despite reports of Chinese entities approaching other countries such as Nigeria and Ethiopia. Opportunities Despite the daring scenario for many African economies, there are still opportunities to gain some benefits out of the dispute between the US and China. During late 2018, China started to seek further trade integration with Africa. At the Forum on China-Africa Cooperation, both parties adopted a joint statement and a three-year action plan, looking forward to deepening cooperation in various fields, including boosting trade, nurturing the African industry and reinforcing security. China increased its imports of crude oil from Angola and other countries in order to compensate for the decline in import of natural gas from the US. During 2017, ~40% of China’s crude oil imports came from the Middle East and ~20% from Africa. As China seeks to reduce its reliance on the Middle East and the US, China’s proportion of crude oil imports from Africa could increase up to 30%. Additionally, in order to secure deals on crude oil in Africa, China will continue to invest in the continent through FDI, which cumulatively surpasses $40 billion, and increased offerings of loans and grants, such as the $60 billion financing offered during September 2018. This is in line with recent trends in infrastructure funding in the continent, with China representing 16% of the total infrastructure funding commitments to Africa during 2013-2017. Source: Own elaboration with data from the Infrastructure Consortium for Africa (ICA)[/caption] Meanwhile, the continent-as-a-whole is already taking significant steps towards self-reliance and economic diversification. The entry in force of the Africa Continental Free Trade Area (CFTA) earlier this year is a great initiative to boost intra-African trade, economic diversification within the region, and put African countries in a better position to attract investments. The CFTA will provide a framework that will allow investors to enter a market of 1.3 billion people and a combined GDP of $2.2 trillion. The CFTA transition phase alone has the potential to generate welfare gains of $16.1 billion and increase intra-African trade by 33%. Earlier during August 2019, the Southern African Development Community (SADC) signed a protocol on industry aimed at promoting harmonized industrial development policies and strategies in the region and move economies further away from exports of raw materials. Pending tasks: infrastructure gaps and the need for better regulation The trade war has exhibited not only Africa’s level of dependency on China, but more importantly, the many internal weaknesses in the African economy in general. Continental trade agreements and industrial development policies are beneficial, but only to the extent to which African economies can materialize and spread their benefits. Although the African continent shows recent signs of progress towards economic development, diversification and integration, this needs to be supported by addressing the continent’s infrastructure gap and improvement of the business environment to facilitate the entrance into the formal economy in order to ensure that the benefits of economic growth are materialized and spread, and further contribute to the economic transformation of the continent. Despite the reported increase in funding, the continent still has an infrastructure gap of $130-170 billion per year, and an annual financing gap of $68-108 billion. This gap includes continent-wide needs such electrification, access to water and sanitation, information and communication technology coverage, as well as transport infrastructure. The current quality and high costs of infrastructure services in the continent constrains productivity by up to 40% each year and reduces Africa’s annual GDP by 2%. In terms of quality of the business and investment climate, a key factor to assess the ease of entering the formal economy, Africa stands below the world average, as shown by the regulatory performance of North and Sub-Saharan Africa during the past 4 years. Moreover, there are huge disparities among African countries in terms of their regulatory performance; some of the continent’s top performers are well above the world and regional average, while others are still below these thresholds. [caption id="attachment_4952" align="alignnone" width="1162"] Source: Own elaboration with data from World Bank Doing Business database.[/caption] [caption id="attachment_4951" align="alignnone" width="1121"] Source: Own elaboration with data from the World Bank-Doing Business database.[/caption] While external events have an important impact on Africa’s development, the continent is still being hindered by internal struggles. Even in a scenario without a trade war, there would still be plenty to talk about regarding Africa’s development challenges, opportunities, and the substantial progress observed across the continent in recent years. One thing is certain: recent events such as the Trade War and the Brexit indicate that it is no longer “business as usual” for Africa and the developing world as “our country first” policies in developed countries are now changing the status quo of the world economy. Jesus Cazares - Senior Research Associate at Infomineo Sources: Center for Strategic & International Studies – CSIS: https://www.csis.org/analysis/innocent-bystanders-why-us-china-trade-war-hurts-african-economies Bloomberg: https://www.bloomberg.com/graphics/2019-us-china-trade-war-economic-fallout/ Nikkei Asian Review: https://asia.nikkei.com/Economy/Trade-war/China-turns-to-Africa-to-mitigate-impact-of-US-trade-war World Bank – Doing Business: https://www.doingbusiness.org/ African Union: https://au.int/en/pressreleases/20190531/afcfta-one-year-later-road-travelled-and-road-towards-launch-operational ORD – Observer Research Foundation: https://www.orfonline.org/expert-speak/42580-what-does-global-trade-war-mean-africa/ DW: https://www.dw.com/en/can-africa-benefit-from-us-china-trade-spat/a-49389296 UNCTAD: https://unctad.org/en/pages/PublicationWebflyer.aspx?publicationid=2463 The Citizen: https://www.thecitizen.co.tz/news/1840340-5240736-9alqgg/index.html TRALAC – Trade Law Center: https://www.tralac.org/news/article/12934-regional-industry-protocol-on-the-cards-for-sadc.html Thomson Reuters: https://www.reuters.com/article/us-china-africa/chinas-xi-offers-another-60-billion-to-africa-but-says-no-to-vanity-projects-idUSKCN1LJ0C4 African Development Bank: https://www.afdb.org/fileadmin/uploads/afdb/Documents/Publications/2018AEO/African_Economic_Outlook_2018_-_EN_Chapter3.pdf Brink News: https://www.brinknews.com/africa-has-a-100-billion-infrastructure-problem-whats-missing/ Morocco World News: https://www.moroccoworldnews.com/2019/08/280034/nigeria-morocco-gas-pipeline-ecowas/ ICA – The Infrastructure Consortium for Africa https://www.icafrica.org/fileadmin/documents/Annual_Reports/IFT2017.pdf Qatar Ministry of Transport and Communications: http://www.motc.gov.qa/en/news-events/news/mwani-qatar-investing-somalia%E2%80%99s-hobyo-port The Africa Report: https://www.theafricareport.com/15263/us-china-trade-war-opens-a-market-for-african-rare-earth-suppliers/

It is obvious that Africa needs technological innovations to jump a generation and catch up with other countries. The continent can indeed turn the lack of infrastructure from a disadvantage into an asset. It offers a blank playground to test and validate new concepts such as mobile payment, which has quickly gained ground, as it remains the major mean of payment for a wide majority of Africans. With the Internet of Things (IoT) and Artificial Intelligence (AI), low banking rates and booming mobile services, blockchain technology represents a real opportunity for Africa. In fact, beyond crypto-currency (virtual currency not guaranteed by the central bank such as Bitcoin), the blockchain consists of a decentralized and non-falsifiable register, allowing transactions to be validated almost instantly and without a central control unit. Called a trust machine, the blockchain technology will provide the confidence that the continent still lacks today and will contribute to its development by streamlining its financial circuit. In addition to its "secure" and "transparent" nature, the attractiveness of the blockchain lies in the diversity of its applications, including agriculture, public administration, finance etc. This disruptive technology, which first appeared in 2008 in the aftermath of the global financial crisis, can be used in all areas where a trusted intermediary is required. Although it is difficult at the moment to assess the long-term effects of the use of blockchain, the paradigm shift that this technology induces will impact many areas. Emerging countries, particularly in Africa, are an exceptional field of exploration. In the next session, we will present some examples of the use of this technology in a number of African countries. Tunisia: Since 2017, the Central Bank of Tunisia has been seeking innovative decashing solutions to stem the culture of cash transactions that hinders banking development and promotes illegal trade. Tunisian institutions became a driving force in the use of blockchain technology. Thus, the National Post office, in collaboration with DigitUS (Tunisian startup specialized in crypto-finance) and Monetas (Swiss software company) offers DigiCash, a virtual portfolio that allows the user to send and receive money, pay bills, etc. This is an example of a successful public private partnership that helped Tunisia become the first country in the world to issue its national currency via an application that operates through blockchain. Ghana: In Ghana, until recently, the majority of landowners was unregistered and did not hold property ownership titles. Thanks to Bitland, a startup specializing in blockchain technology, it has become possible to register lands and real property rights and store information in a transparent, public and secure manner. In the Kumasi metropolitan region of southern Ghana, Bitland registered land titles in a public blockchain for 28 communities. The startup now hopes to expand its project to a national or even continental scale in order to eradicate corruption and unlock billions in fixed capital for infrastructure development. Kenya: Headquartered in Nairobi, Kenya, BitHub Africa is a blockchain accelerator company founded in December 2015 to boost the development of blockchain solutions in Africa through providing consulting services to organizations interested in deploying blockchain solutions across Africa and Middle East and hosting training developers for this purpose. The company aims to play a significant role in helping the country to reach its Vision 2030 goals and become a world leader in adopting the blockchain technology. In fact, BitHub Africa is working with local regulators to foster Kenya’s blockchain-related technology policies and actively promote regulatory policies that are conducive to ICO (Initial Coin Offering) and crypto-currencies. South Africa: In South Africa, the Blockchain Academy in Cape Town offers training in crypto-currencies and blockchain technology to local entrepreneurs and startups. Established in 2015, the academy’s main focus is on capacity building in the digital currencies and blockchain technology industry by providing specialized training and consulting services in Africa and Middle East. Besides, the South African Reserve Bank has chosen to experiment an accounting system based on Ethereum for bank transfers. The principle of the Ethereum blockchain allows decentralized applications to have a database, without a centralized server, which lists all transactions and exchanges in a secure way. Tanzania: In 2018, the Tanzanian government had weeded out thousands of “ghost workers” in the public sector through the implementation of the blockchain technology. This audit work has been beneficial to the State allowing the government to achieve substantial savings. In fact, the Tanzanian state lost no less than 430 billion Tanzanian shillings every month in the payment of fictitious wages. This means that the equivalent of 195 million dollars can now be distributed properly, which will undoubtedly have a positive social impact on the country. Ethiopia: Ethiopia is the fifth largest coffee producer in the world. 95% of the country's coffee is produced in small rural farms, which suffer from a lack of organization. This situation increases their vulnerability to pressure from intermediaries who are not always reliable. The lack of traceability does not provide buyers with information on the supply chain of agricultural products. To overcome this lack of organization, the Ethiopian government has signed a memorandum of understanding with the Hong Kong-based blockchain company IOHK. This partnership aims to explore new possibilities for the use of blockchain in the agricultural sector. Thus, all the steps of the process are recorded in an eBook that serves as an online agricultural register where users can trace data on the origin and process of the production. After presenting some key illustrations of the use of the blockchain technology in different African countries, we will focus in the following on the current situation of the use of blockchain in Morocco before discussing the challenges facing the implementation of blockchain solutions in Africa. Blockchain in Morocco: Where does the Kingdom stand today? While Bitcoin was quickly banned in Morocco, the technology behind it (the blockchain) is at the heart of many concerns both in the public and the private sectors. Morocco is indeed at the awareness stage of the great potential of this technology. Aware of the great potential of this technology, Morocco has recently launched an initiative that is led by the National Telecommunications Regulatory Agency (ANRT) through its "Soft Center" R&D unit. In 2018, ANRT has also set up a think tank on the subject comprising the Soft Centre, the Sayarh and Menjra Cabinet, Numa Casablanca (current "Impact Lab" which is a Moroccan start-up working on improving the start-up ecosystem in Morocco) and Adalia School of Business (Digital Training and Innovation School). The final goal of the reflection is to create a national blockchain, as part of an Open Innovation approach, aiming to facilitate the creation and deployment of fintech services and smart contracts for individuals and startups. For stakeholders, the establishment of this technological infrastructure will foster the emergence of a national IT industry. In addition to this project, another important initiative is expected to be launched in the Dakhla region in 2019. The project is about the installation of a 900 MW wind farm, equipped with a datacenter for mining to produce clean energy that will be used for running servers for the blockchain. Brookstone Partners, a US private equity fund is behind this initiative with a budget allocation up to $3 billion over a period of 5 years. Blockchain in Africa: What are the challenges for Blockchain solutions? Energy consumption: The most important challenge to the adoption of the blockchain is energy. The mining activity to validate transactions and register them is particularly energy-intensive. For example, the blockchain of the bitcoin would today consume between 300 MW and 10 GW, or more or less the electricity consumption of Ireland (3 GW). The bitcoin blockchain alone would consume 100 times the power used by all of Google's servers that is difficult to ensure given the energy situation in Africa. In fact, according to the 2018 World Energy Outlook issued by International Energy Agency (IEA), the population without access to electricity remains at 600 million in sub-Saharan Africa, totaling 57% of population with 15 countries in the region having access rates below 25%. Hence, technological developments, particularly those related to blockchain, could overcome this challenge. This is the case for micro-grids, local networks where both residents and companies are consumers and producers of renewable energy. Technological issue: In addition to the energy challenge, the blockchain also faces technical challenges. It is about the complexity of this tool and its data processing capacity, which is quite limited. For example, the bitcoin blockchain can process 600,000 to 700,000 transactions per day, far behind the 2000 transactions per second processed by the VISA transaction network. Moreover, some risks are related to the network security and resilience of the system against potential cyber attacks as well as protection of data privacy even though the probability of its occurrence is low given the complexity of the blockchain technology. Regulation: Finally, and in order to ensure a better deployment of this technology, African governments must commit themselves to defining a legal and regulatory framework that remains not formalized so far in most of the countries. In this respect, we can mention the experience of Estonia, which has made great progress in this area and remains a very good example from which Africa can draw lessons. Blockchain technology: Way to achieve "leapfrogging" for Africa Last but not least, the introduction of blockchain technology is not an epiphenomenon. It is a technology with real transformative potential that is of interest to many African countries. From this point of view, the blockchain can help countries to overcome technological transitions and enable the continent to achieve another "leapfrogging”, similar to what has happened with mobile phones. However, it is necessary to overcome the challenges related to blockchain technology in order to turn it into the driver of the next digital revolution in Africa! Safae Laghmari – Research Analyst Sources : https://newconomy.media/news/africa-adopting-blockchain-to-weed-out-ghost-workers/ https://www.challenge.ma/blockchain-le-maroc-entre-dans-la-course-102794/ https://financenews.press.ma/article/bourse-finances/blockchain-le-maroc-va-se-doter-d-une-plateforme-nationale https://www.usine-digitale.fr/article/la-blockchain-un-formidable-levier-de-developpement-pour-l-afrique.N710619 https://afrique.latribune.fr/think-tank/tribunes/2018-04-09/les-premiers-pas-concrets-de-la-blockchain-en-afrique-774614.html https://www.jeuneafrique.com/mag/645909/economie/tunisie-la-blockchain-un-levier-de-croissance/ https://cio-mag.com/afrique-la-blockchain-est-elle-une-reelle-innovation-de-rupture-pour-les-gouvernements/ https://www.afrikatech.com/fr/divers/technologie-blockchain-afrique/ http://blockchainacademy.co.za/ https://cryptoafrica.com/blockchain-has-great-potential-in-the-african-market/ https://btcmanager.com/blockchain-accelerator-bithub-africa-launches-in-kenya/?q=/blockchain-accelerator-bithub-africa-launches-in-kenya/& https://www.cryptokemet.com/ghana-bitland-cadastre-blockchain/ https://www.uneca.org/sites/default/files/images/blockchain_technology_in_africa_draft_report_19-nov-2017-final_edited.pdf https://telquel.ma/2018/03/05/nouvelles-tendances-blockchain_1582809/?utm_source=tq&utm_medium=normal_post https://www.medias24.com/MAROC/ECONOMIE/ENTREPRISES/184873-Un-investissement-americain-a-Dakhla-eoliennes-900-MW-d-electricite-et-blockchain.html https://qz.com/africa/1447621/africa-electrification-rate-slowest-globally/ https://www.iea.org/newsroom/news/2018/october/population-without-access-to-electricity-falls-below-1 billion.html?utm_source=newsletter&utm_medium=email&utm_campaign=newsletter_axiosgenerate&stream=top https://www.ccn.com/bitcoin-100-times-powerful-google https://medium.com/coinmonks/blockchain-scaling-30c9e1b7db1b https://maroc-diplomatique.net/numa-casablanca-reprend-sa-marque/

This is part two of our African Agriculture series – where we explore successes, failures, and the way forward for African Agriculture policies. The dangers of a cash-crop first policy – The case of Ivory Coast As a continent rich with natural resources, Africa has a long and complex history with the cultivation and exploitation of cash-crops as a source of income. Many African countries rely heavily on cash-crops to boost their exports and generate foreign currency. It is estimated that cash-crops constitute over 50% of Africa’s total agricultural exports. Accompanying the increase in global demand for some of Africa’s major agricultural commodities in the late 1970s (such as cocoa, coffee, oil palm, tree nuts, and rubber), multiple agriculture dependent countries -particularly in East and West Africa- increased their efforts to boost the production of cash-crops and incentivized their farmers to switch from food-crops to cash-crops, with the promise of improved revenues. Côte d’Ivoire’s experience with a cash-crop first policy is a prime example of how such policies, despite their well-intentioned objectives, can have a nefarious impact on rural development and small farmer poverty alleviation. In fact, small Ivorian cocoa farmers have been grappling with heightened food insecurity and a dire financial situation as recently as the 2016-2017 period. Prior to the cash-crop first policy, Côte d’Ivoire’s main agricultural policies were instead aimed at increasing food production to satisfy the needs of its growing population. One of the most successful policies from this era was the rice support program in the 1970s, which helped boost rice production within the country and allowed Côte d’Ivoire to reach high levels of food self-sufficiency. Rice proved to be a good fit for the country’s small farmers given to its ability to grow well in the local climate (both local and foreign varieties), as well as produce multiple harvest with high yields throughout the year. Rice also played a dual role, as it provided sustenance to the farmer and his family, while at the same time generating some income for its sale. Despite the early successes of the rice development strategy, Côte d’Ivoire began incentivizing its small farmers to adopt cash-crops to boost revenues. As a country with a long history of cocoa cultivation, Cocoa beans stood out as the cash-crop of choice for many small farmers. At the turn of the 1980s, an economically ailing Côte d’Ivoire decided to completely abandon the policy of self sufficiency in terms of food production, particularly relating to rice production, and focus on expanding the production of Cocoa. This new positioning was mainly motivated by a desire to boost the country’s exports and curb a growing budget deficit. Additionally, the policy shift was built on the assumption that the country will be able to import its food from abroad with the substantial revenues generated by Cocoa exports. [caption id="attachment_4906" align="aligncenter" width="652"] Harvested area of Cocoa vs Rice[/caption] The conversion proved successful, with many small farmers switching to cocoa cultivation, and Côte d’Ivoire soon became the world’s biggest Cocoa producing country. [caption id="attachment_4905" align="aligncenter" width="609"] Rice imports as % of local consumption[/caption] While at first glance the new cash-crop first policy might appear as a net improvement for Côte d’Ivoire and its small farmers, particularly during the years of high cocoa prices, it soon proved to be highly damaging to small farmer’s livelihood and severely deteriorated food security across rural areas. Small farmers who previously cultivated local rice varieties, which were able to generate high yields without the need for large land holdings or the heavy use of modern agricultural techniques, were faced with difficult to grow cocoa trees, which required high levels of care and inputs to produce acceptable yields. Farmers were also used to be harvesting rice multiple times during the years (2 to 4 times), while cocoa beans mostly produce a single harvest per year. Farmers and their families, who formerly relied on rice to feed themselves and generate extra revenues from its sale to the state, became fully dependent on the production of Cocoa and its sale on the international markets for their livelihood. Moreover, the lack of a clear route to market for small farmers and their reliance on a long chain of intermediaries along the value chain, with multiple levels of aggregators and wholesalers, started impacting the sector. In fact, small farmers were only receiving a fragment of the selling price in the global market. These low levels of revenues reduced small farmers’ ability to feed themselves and their families, while at the same time preventing them from investing in the land to improve yields. In effect, the cash-crop first policy had a limited positive impact on small farmers revenues, while it completely stripped them from any possibility of self-subsistence. Even worse, during price crash periods (even small drops in price can have a large impact), small farmers are stuck with a commodity they can’t eat, and face extremely long waiting periods to receive their compensation from the government[1]. The problem became so severe in 2015, that many farmers had difficulties feeding themselves due to the non-payment by the purchasing authority. [caption id="attachment_4907" align="aligncenter" width="999"] International Cocoa prices SDR /tonne[/caption] While the state and the many layers of intermediaries largely profited from the periods of high cocoa prices on the international market, these financial benefits rarely made their way down to the small farmers on the ground. The cash-crops first policy has largely shown its limits in the Ivorian case, particularly given the fact that the implementation was largely inadequate. The lack of support for small farmers after their switch and the emergence of a complex chain of intermediaries (due to poor infrastructure and the lack of easy market access in rural areas), limited small farmer’s ability to profit from periods of high international prices, while at the same time exposing them to the full extents of price fluctuations. The Ivorian example showcases the need to strike a balance between the cultivation of cash-crops and food-crops in Africa, as both have a complementary role to play in the development of a healthy agricultural sector. Due to the inherent price fluctuations of commodities, cash crops are unable to provide farmers with sufficient security to sustain a decent livelihood, at least not on their own. While safety net policies can play a large role in alleviating some of these issues, the Ivorian case[2] proves that countries with limited financial resources to expend will be unable to honor their commitments to farmers during periods of crashing prices. Lastly, a cash-crops fist policy can only be successful when small farmers are able to effectively reach the market on their own or by forming strong cooperatives, otherwise intermediaries will be the ones profiting from these market imperfections. Côte d’Ivoire learned these lessons the hard way, as the country has been slowly recovering from the difficulties of the 2015-2017 period. As a response to these difficulties, the country has been slowly bringing back its rice production policies and even announced plans to curb cocoa production levels in the coming years. If successfully implemented, this new shift in policy could help the country reach a new balance, where the need to generate export revenues and the necessity to feed its population with local production can coexist. [1] All Cocoa beans in Côte d’Ivoire are bought by a government owned purchasing authority, which sets the buying price yearly [2] The set yearly buying price plays the role of a safety net in CI, as it guarantees a minimum revenue to the farmer Ibrahim Zaaimi – Research Associate Sources : Analysis; Analysis; Press; Press; Paper; Analysis

With a growing understanding of the impact Artificial Intelligence (AI) is likely to have on customer relations and sales, retailers across the world are exponentially investing in AI with an estimated global annual spending reaching around 7,3 billion dollars by 2022. Artificial intelligence has become a future strategic imperative for retailers. Through enabling process automation, customers’ experience personalization and demand prediction, artificial intelligence can increase overall revenue and productivity. According to Business Insider projections, AI is to increase profitability in retail and wholesale by nearly 60% by 2035. Quick to spot the potential, retailers in the GCC are eying AI and are making considerable strides to push towards embracing technology to enhance retail experience. Three notable examples of large, GCC based, retail groups accelerating AI deployment are the following: Majid Al Futtaim (MAF): Majid Al Futtaim is an Emirati holding company that operates in 15 countries across the Middle East, Africa and Asia. According to its CEO, Alain Bejjani, digitization is a crucial component of the company. Some components of the digitization strategy of MAF are the following: + Build a data-driven knowledge through heavily investing on Data Analytics. Mainly the company is planning to develop “the Majid Al Futtaim Golden Customer Record” by collecting customer and transaction data from its various business units namely Carrefour, Vox and WI-FI, this is in the aim to turn the vast amounts of collected data into results in real time. + Enhance the company’s advanced analytics capabilities through recruiting data engineers and scientists that will integrate the company’s various departments and also launching MAF’s own School of Analytics and Technology that will offer curriculum for nearly 40.000 employees. The curriculum is said to include everyone in the company from the CEOs to frontline workers. + Explore new technologies by partnering with LA based technology company I.am, that will provide MAF with its Omega platform which is an AI powered conversational and contextual voice assistant that delivers deep cross domain knowledge for a smooth customer experience. Al Shaya: Al Shaya is an international retail franchise operator based in Kuwait; it handles around 90 consumer retail brands across the MENA region, Russia, Turkey and Europe. Last year, and as part of a wider transformation plan to enhance operational efficiency and assist ongoing growth and innovation, Al Shaya has agreed on a multiyear partnership with Manthan, a leading provider of AI- augmented advanced analytics. This partnership is to enable Al Shaya to streamline its current businesses by building an enterprise data lake from numerous data sources including back-end systems, customer engagement platforms, HR systems, finance and logistics, in the aim to act as an analytics hub. Overall, Manthan will provide Al Shaya with complete end to end analytics coverage enabling insight-based decision making across the breadth of its portfolio. Landmark Group- Home center: Landmark Group is a Dubai based conglomerate that operates mainly in the MENA region and South east Asia. Earlier this year, the group’s home retailer brand Home Center has started operation in its first fully automated National Distribution Centre in Sudair (Saudi Authority for Industrial Cities and Technology Zones- Modon). The facility is the first fully functional automated Distribution Centre of its kind in Saudi Arabia that operates state of the art AGVs (Automated Guided Vehicles) in conjunction with automated conveyor systems. The warehouse accommodates autonomous driverless vehicles that will help in streamlining processes, and further strengthen Home Centre’s position as the leading home-grown retailer in the region. Beside these three leading retail groups, more and more retailers across the GCC are getting serious about exploring what Artificial intelligence can offer. Based on 2018 Global Consumer Executive of Mind Survey, 40% of UAE- based CEOs in the retail industry plan to use AI in the next two years to enhance store experience. However, despite all the current hype around AI, it is an overlooked reality that to achieve AI’s transformative potential, companies need mature data practices as well as AI expertise. Also, it is primordial to ensure individual privacy which requires from companies to put proper data handling policies to ensure anonymity. Accordingly, it may be regarded as certain that the future of artificial intelligence in GCC retail sector is in a seamless correlation with how realistic retailers are in regard with their preparedness to deploy Artificial Intelligence. Nouha Abardazzou, Senior Analyst Sources: https://www.capgemini.com/research/building-the-retail-superstar-how-unleashing-ai-across-functions-offers-a-multi-billion-dollar-opportunity/ https://www.businessinsider.fr/us/the-future-of-retail-ai-2018-8 https://www.majidalfuttaim.com/en/who-we-are/vision-values https://www.arabianbusiness.com/business/389221-majid-al-futtaim-ceo-plots-path-to-21st-century-retail https://www.arabianbusiness.com/technology/411823-dubai-retail-giant-inks-deal-with-williams-us-tech-firm https://www.alshaya.com/en/about-us/ https://www.manthan.com/about-manthan/pressreleases/212-manthan/1214-manthan-signs-multiyear-partnership-with-alshaya-for-enterprise-wide-analytics http://www.landmarkgroup.com/int/en/home https://www.thehindubusinessline.com/info-tech/manthan-alshaya-deal-for-enterprise-wide-analytics/article25030756.ece http://www.arabnews.com/node/1455521/corporate-news https://www.zawya.com/uae/en/press-releases/story/UAE_retailers_will_increasingly_use_AI_and_VR_technology_to_enhance_retail_store_experience_KPMG-ZAWYA20180814093620/ https://docs.google.com/document/d/1IIc88UDvlA7cAsEQatwvaeh0OmkO_JpKnWLgHWQKG7M/edit

This is part one of our African Agriculture series – where we explore successes, failures, and the way forward for African Agriculture policies. The dangers of land reform policies – The case of Ethiopia Land reforms have been a thorny issue in Africa since the independence periods. Many countries, including South Africa and Nigeria, are still trying to navigate the complex matter of land rights, land reorganization, and the proper way to distribute agricultural land based on historic and socio-economic considerations. Ethiopia stands out as a stark reminder of how land reform policies can go awry, and lead to increased vulnerability among small-scale rural farmers. Despite its immense agricultural potential, with large stretches of arable land (4th largest in Africa in terms of arable land with over 151 190 km²), the country has been consistently suffering from bouts of famine and dire food insecurity. Ethiopia’s agricultural difficulties can be linked to multiple elements, including poor rural infrastructure, weak farmer support, and a lack of modern agricultural equipment, but many of the sector’s structural problems can be traced back to the poor land reform policies implemented in the 1970s. The Marxist military government ruling Ethiopia from 1974 until 1987 launched a complete overhaul of the country’s land system once it reached power, proclaiming the end of land ownership and transforming all agricultural land into government owned land. This new transformation was accompanied in 1975 with the proclamation of the “land to the tiller” policy in matters of agricultural land. Under this new policy, farmers and peasants who originally tended the land were given the right of use for agricultural purposes, but no ownership rights were given (selling, mortgaging, leasing, leaving land to descendants). Moreover, land and plot distribution/redistribution were common during this period, as rural population increased and demand for land-use skyrocketed. [caption id="attachment_4879" align="aligncenter" width="652"] Figure 1: Rural population in Ethiopia[/caption] The system in place stripped away any economic incentive to develop the land, as farmers were under the constant fear of land redistribution and reorganization. This insecurity in tenure (or simply the feeling of insecurity) created a self-perpetuating vicious cycle, where farmers were incentivized to exploit the land they were assigned as much as possible, without investing any personal resources on improving it. The “land to the tiller” system also led to the fragmentation of agricultural land, as farms were handed out to any rural farmer able to exploit it. Farms sizes shrunk rapidly under the new land distribution system, with small farms (which constitute more than 75% of the country’s agricultural land) averaging less than 0.8 hectares per farm. In addition, land dependency rates started climbing as more people had to rely on agricultural land for their livelihood. [caption id="attachment_4880" align="aligncenter" width="614"] Figure 2: Agricultural Population[1] per hectare of Arable land[/caption] This new reality created socio-economic conditions that are conducive to heightened poverty levels among farmers, increased vulnerability to environmental shocks, and a generalized situation of precarity. The dire state of Ethiopia’s agricultural sector was exposed when the country experienced one of the worse bouts of famine in its history in 1984[2], which highlighted the fact that large parts of Ethiopia’s rural population were one drought away from starvation. Moreover, land stress and over-exploitation also became more prominent under the new land administration system, as poor farmers were left with no choice but to exploit their assigned plot of land to the highest levels (no use of land rest periods or crop rotation techniques). While the full extent of land degradation is very hard to measure, recent estimates suggest that over 85% of Ethiopia’s agricultural land is considered “moderately to severely degraded”. The legacy of Ethiopia’s land reform policies in the 1970s can still be felt today across the country’s agricultural sector. High Farmer poverty levels, recurring localized food shortages, and land degradation stand as reminders of how poor policy-making in the agricultural sector can have lasting effects on rural development and poverty alleviation. Despite some improvements -introduced by the 1995 constitution- to the status of farmers and their relationship with the land, all agricultural land remains under state ownership to this day. Ibrahim Zaaimi – Research Associate Sources : R Paper; R Paper; Article; FAO; Book Chapter Analysis; Report; Analysis; Press; Press; Paper; Analysis [1] The agricultural population is defined as the number of people depending on land and farming for their livelihood (farmers and their families, agricultural workers and their families) [2] Political repression and food aid blockade heightened the impact of the droughts and shortages

Ranked as the 5th among developing countries for future potential growth, the retail sector of the UAE keeps expanding beyond expectations. Despite recent signs of saturation, Dubai was still expected to add around 717,000 sqm of new retail space in 2018, while more 467,000 were expected to be added in Abu Dhabi. The overall market was estimated to be worth around USD 55 billion, with up to 16% of annual growth forecasted for the next years, surely benefiting from the Expo 2020 effect. [caption id="attachment_4854" align="alignright" width="384"] Retail market value (USD mn)[/caption] The sector is evolving. From one side, it is adapting to external stimulation such as the recent introduction of the VAT, that has led retailers to increase the value offered to shoppers. From the other side, the sector is innovating from within, given the increasing relevance of online shopping, direct selling and home shopping (6.5% of total market in 2023, from 4.2% in 2018). The Emirates are indeed considered a shopping destination by international tourists, and their spending patterns are quite higher than the average tourist (USD 1,671 against USD 1,105 on average). [caption id="attachment_4855" align="alignright" width="267"] Foreign tourists spending (USD per tourist)[/caption] The country welcomed more than 21 million tourists in 2018 and this number is expected to grow up to 33.5 million by 2028. The expected amount spent by these tourists will exceed USD 55 billion, which will be a conspicuous boost for retail, among other side sectors especially given the traveler propensity to purchase and consume Luxury goods. Many sectors are benefiting and boosting at the same time this general growth, establishing a virtuous circle that serves the entire economy of the country. Among them, the sales of Health & Beauty products almost doubled in the period between 2012 and 2019, when they overall value of product sold is expected to exceed USD 6 billion. With the 46% of market held by the top 6 players, the sector in not particularly concentrated. However, the big pharmacy chains have the lion’s share of this market, with the top 3 retailers recording double digit yearly growth in the last five years. [caption id="attachment_4867" align="alignright" width="895"] Health and beauty - Retail market value (USD mn)[/caption] The sector is regularly attracting further investors, such as O Boticario, the Brazilian retail chain specialized in cosmetic, skin care and fragrances, that recently invested in the country. In parallel, long-lasting players still have to innovate to match the continuously evolving customer demands, replacing non-performing brands with other that match the current client trends. A 2017 survey shows how 43% of customers are spending more than USD 135 on skin care every month, and the spending is forecasted to grow further. While large and expanding figures do attract players from everywhere in the world, success in this market is far for being granted To be able to differentiate their offer from competition, cosmetics and skin care operators need to accurately channel their investments and to establish a bilateral communication with more and more educated customers. [caption id="attachment_4868" align="alignright" width="1198"] Top 3 health & beauty retailer sales (USD mn)[/caption] For instance, most famous international brands leverage brand reputation and already well-known quality, still need to invest millions on product advertisement, press engagement and new social media (ex. by collaborating with Instagram influencers). On another hand, more niche brands need to focus on specific customer segments, engaging them through demo or through a network of doctors able to appreciate and recommend the products to their patients. A deep understanding of the market mechanisms becomes then a must-have to successfully compete in a very promising and dynamic market. Sources: Euromonitor International A.T. Kearney - The 2017 Global Retail Development Index Journal of Cosmetics, Dermatological Sciences and Applications, 2017 Ardent report, 2016: http://www.ardentadvisory.com/files/GCC-Retail-Sector-Report.pdf Press: https://www.khaleejtimes.com/business/local/uae-retail-evolves-from-bricks-to-clicks Press: https://www.khaleejtimes.com/business/retail/uae-retail-sector-continues-to-grow- Antonio Pilogallo – Research Manager at INFOMINEO

In the last two decades, China has become the most important economic interlocutor of the African continent, through a number of both public and private initiatives across trade, investments, financing and cooperation. To have an idea of the scale of the Chinese wave, we can have a look at the most recent figures. In the list of main investors in Africa by FDI stock, China is placed only at the 4th position. However, the recent trend does not leave room to interpretation: while the top 3 countries investment remained pretty much unchanged in the period 2011-2016, China’s FDI assets in the continent grew at an impressive +150% rate. [caption id="attachment_4817" align="alignright" width="966"] Top 10 investor economies in Africa, by FDI stock (USD billion)[/caption] China is also the economy that by far announced the largest amount of greenfield projects in Africa in 2016, with over USD 36 billion, being only second to Italy last year. [caption id="attachment_4818" align="alignright" width="560"] Announced greenfield FDI projects (USD billion)[/caption] In addition, Afro-Chinese trade has been growing at ~20% per year, almost for the last two decades. Finally, it is important to note that these figures do not necessarily take into account the Chinese capital flowing through Hong Kong, where many Chinese giants have their holding company, through tax havens such as the Cayman Islands or the British Virgin Islands, or through other less transparent channels. The size and the pace of the phenomenon has provoked different reactions, ranging from an absolute consent for the pragmatism and, above all, the capital that was brought to Africa, to the fear for a quite fluid but rampant operation of neocolonialism. Chinese activities on the African continent are often perceived as a monolithic, state-coordinated investment whose reins are directly in the hands of the Chinese Communist Party – but this is only one side of the story. Reality shows that Chinese operations in Africa, whether public or private, are carried out according to a multitude of modus operandi. 1 - The Belt and Road Initiative Launched by the PRC Government in 2013, the BRI has recently been defined by the Chinese vice-minister for foreign affairs as an “effort to build a more fair and equitable international order and to reform the global economic governance structure”, and as a response to the trend of rising protectionism, unilateralism bullying and anti-globalization. In more practical terms, the BRI consists of a gigantic scheme to finance and build infrastructure, ventures and other business initiatives across ~20 are Africans countries, among the 87+ countries worldwide involved till today. The total estimated value of all the deals announced within this initiative since the launch is USD 1.12 trillion, of which a large proportion is earmarked for projects on the African continent, especially in areas such as: transportation, power & energy, but also in shipping, minerals & mining, manufacturing, petrochemical, real estate, telecommunications, and agriculture. South Africa and Ethiopia are among the countries that are most benefiting from BRI related investments. [caption id="attachment_4819" align="alignleft" width="866"] BRI countries and projects, as for official announcements(figures in USD billion)[/caption] [caption id="attachment_4820" align="alignnone" width="689"] BRI countries and projects, as for official announcements(figures in USD billion)[/caption] Despite the fact that the boundaries of the BRI are quite fluid, several mega-projects are considered part of it, including the USD 3.5 billion International Free Trade Zone to be realized in Djibouti, the Mombasa-Nairobi standard gauge railway in Kenya, the Addis Ababa-Djibouti railway and the recently inaugurated cross-sea bridge in the Maputo bay, and many other much needed infrastructures. However, the BRI is no charity, nor is it a multilateral mechanism like the United Nation or the World Bank: each country deals individually with China, negotiating the financial schemes, establishing the project conditions and deciding how the infrastructure will be managed and by who. Projects are mostly carried by state-owned companies (State Grid Corporation, CNPC, Sinopec and CRCC are among the most the top 10, but the list also includes private giants such as Alibaba and Huawei) and financed by state-funded banks, such as the Exim Bank of China and the China Development Bank. Obviously, the BRI is not the only way in which the Chinese government is leading the interaction with the African continent. As of today, 53 African countries have established diplomatic and cooperation relationships with China and the African Union, also through the participation to the yearly Forum on China-Africa Cooperation. Moreover, Chinese leaders personally visit African countries with a certain regularity, which is a form of diplomacy carrying not only a symbolic weight. For instance, the Chinese foreign minister makes an annual visit to the continent at the beginning of each year and over the last ten years government leadership made 79 visits to 43 different countries, with quite a preference for South Africa (7) and Tanzania (4). 2 - Private investments Chinese investment in Africa is more market-oriented than is commonly thought. [caption id="attachment_4821" align="alignright" width="300"] Chinese firms in Africa[/caption] Around 10,000 Chinese firms are currently estimated to operate in the African territory, 90% of which are privately owned and operating in several sectors of which they already handle relevant shares: · 12% of Africa industrial production · 50% of Africa internationally contracted infrastructure construction. In most cases, Chinese private operators prefer long-term investments rather than trading or contracting, and have their focus on serving African markets rather than exporting their products. This strategy led a third of them to reach profit margins higher than 20% and their consolidated revenues, that are currently estimated at USD 180 billion, are expected to range between 250 and 440 USD billion by 2025. An aggressive price strategy is often the key for success: in some cases, these firms lowered their prices for existing products and services by 40% and remained profitable through the introduction of an improved technology or by getting efficiencies of scale. Private investments from China into African markets come to seize business opportunities with a simple profit-oriented logic and can get so competitive that not even smugglers can make it against them. For instance, the Lee Group that produces, among other products, 1.2 million flip-flops per day, and sell them for around 1 USD a pair, keeping a ~100% market share across Nigeria and West Africa. 3 - Industrial Zones Halfway between public initiative and private investment there is the creation of industrial zones, often starting with the state leadership negotiating spaces, fiscal incentives and other conditions and getting local government authorization and support. A public company will then plan and develop the industrial zone, promoting the created opportunity among other Chinese private investors. To this extent, by the end of 2016 Chinese enterprises had built 56 economic and trade zones in more than 20 countries along the Belt and Road routes, with an accumulated investment of over USD 18.5 billion. China Merchants Group, a state-owned USD 90 billion industrial conglomerate, is believed to be the government tool to unlock foreign markets by exporting its model of industrial zone development. It is not surprising that the company's international trajectory is very evocative of the BRI itself. [caption id="attachment_4822" align="alignright" width="300"] CMG international operations[/caption] This model was the one applied for the Great Stone project, an industrial park designed to bring together some USD 30 billion of Chinese investments in Belarus. It is likely that CMG will apply the same model to the above-mentioned Free Trade Zone in Djibouti and the one linked to the Bagamoyo port in Tanzania, being this a strategy very much welcomed by local governments and labor markets. However, the State initiative is not the only driver that leads to the development of Chinese industrial zones. In Africa, besides the 7 industrial zone approved by the Chinese Ministry of Commerce in Ethiopia, Algeria, Egypt, Mauritius, Nigeria (2) and Zambia, private investors have established further zones in Botswana, Guinea, Nigeria again and South Africa, directly dealing with local governments since the year 2000. 4 - Foreign debt From 2000 to 2017 the Chinese Government, banks and contractors extended USD 143 billion worth of loans to African governments and state-owned enterprises. Whether or not these loans are value for money or just a flow of money from the Chinese government to Chinese companies via Africa remains a matter of debate. [caption id="attachment_4825" align="aligncenter" width="1007"] Chinese loans to African countries (2000-2017)[/caption] The nature of loans is much varied. Some of them qualify as official development aid, but others are export credits, suppliers’ credit, commercial loans, etc. These amounts are not current debt figures, since many countries have been paying back their debts promptly and substantially along the years. However, doubts are raised about the ability of many countries to sustain relatively large debts. This is the case of Kenya, whose bilateral debt is currently 72% owned by China, or Djibouti and Maldives, whose total debt is estimated to reach respectively around 90% and 65% of the country’s GDP, once the Belt & Road Initiative will be completed. 5 - Military presence At the time when the US and the European countries are adopting isolationist policies, Beijing is making power moves in Africa, projecting China as the leader of the developing world, in solidarity with developing nations through the fight against terrorism, piracy and natural disasters. Of course, the desire of safeguarding Chinese workers and Chinese-funded projects on the continent is likely playing a role in the government’s efforts as well. The military presence in Africa has been fortified in different ways. Primarily, by establishing its first overseas military base in Djibouti. Secondarily, by taking a more active role at the United Nations, becoming the major contributor of peacekeepers and one of the largest contributors of troops. Tertiarily, by providing logistical and defense support, technology, equipment, personnel, strategic advice and weapons, as announced at the first ever China-Africa Defense and Security Forum. 6 - Soft power Chinese initiatives to increase influence in the African continent include also some other forms of soft power that may or may not be part of a unique comprehensive strategy. Chinese Yuan as a reserve currency From one side, the government push to internationalize its currency is part of the strategy to promote trade and investments. From the other side, most African countries have loans or grants from China and for them it would make economic sense to repay in Chinese Yuan. For these reasons, African central bank leaders are currently discussing whether to hold the Yuan as part of their foreign reserves. This discussion is currently held by 14 nations in Eastern and Southern Africa, including Angola, Botswana, Burundi, Kenya, Lesotho, Malawi, Mozambique, Namibia, Rwanda, Swaziland, Tanzania, Uganda, Zambia and Zimbabwe. Diplomatic boost and tourism Africa is becoming more and more an appealing destination for Chinese tourists and especially countries such Morocco, Tunisia, South Africa, Namibia, Madagascar and Tanzania are increasingly attracting visitors from the PRC. This is also a result of some government-led initiatives, such as a diplomatic boost leading to relaxed visa rules for Chinese citizens (for example, with South Africa) or other initiatives like the “I Go Kenya – I Go China” program, creating incentives for travel, shopping and leisure to tourists visiting the two nations. Education and know-how transfer Education and the transfer of technological know-how are increasingly part of the country soft power efforts in the continent, with a growing offer of training contents targeting young Africans. As of 2018, there were more than 20 Chinese-run agricultural training centers and 48 Chinese language schools, the Confucius Institutes, across African countries. China is already the top destination for African students from English-speaking countries and, besides this, the government will offer +10,000 scholarships for Africans officials to study in China over the next 10 years. Training and knowledge transfer are usually a formal part of business initiatives as well. For instance, within the Ethiopia-Djibouti railway project, whose hard infrastructure was inaugurated earlier this year, the Chinese counterpart agreed to assist in the training and knowledge transfer throughout the whole period in which the management of the infrastructure itself will pass from the hands of Chinese companies to those of the local joint venture. What do Africans think about this? Many voices have been raised by the Western world, expressing more or less sincere concerns about the possibility of an ongoing neo-colonialism. However, based on the results of a 2014/5 survey among 54,000 citizens in 36 African countries, China’s growing presence in the continent wins largely positive consent. Almost two-thirds (63%) of Africans say that China’s influence is somewhat or very positive, and the most important factors contributing to a positive image of the country are its infrastructure development, its business investments and the cost of its products in the local market. Despite the fact that United States is still the most popular model for national development (cited by 30% of respondents), China stands at the 2nd place continent-wide (24%), and its popularity matches or even takes the lead in several countries such as Cameroon (48%), Sudan, Mozambique, Mali (36%), Tanzania (35%), and Zambia (32%), and Egypt (29%). [caption id="attachment_4826" align="aligncenter" width="983"] Perception about China’s economic and political influence and factors contributing to a positive image[/caption] Generally speaking, Africans recognize the importance of China’s economic activities in their homeland: across 35 countries, 69% of respondents say these activities have some or a lot of influence on the economy they live in. Finally, a McKinsey extensive field survey shows how this perception is shared by almost all senior business and government leaders interviewed, that acknowledge how the Africa-China opportunity is larger than those presented by any other foreign partner, including Brazil, the European Union, India, the UK and the United States. Antonio Pilogallo, Team Lead at Infomineo Sources: Financial Times: https://www.ft.com/content/e7e81928-7f57-11e8-bc55-50daf11b720d Financial Times: https://www.ft.com/content/7699d13a-806a-11e8-af48-190d103e32a4 Financial Times: https://www.ft.com/content/3c437b42-c6f8-11e8-ba8f-ee390057b8c9 UNCTAD: https://unctad.org/en/PublicationsLibrary/wir2018_en.pdf Afrobarometer: http://afrobarometer.org/sites/default/files/publications/Dispatches/ab_r6_dispatchno122_perceptions_of_china_in_africa1.pdf McKinsey: https://www.mckinsey.com/featured-insights/middle-east-and-africa/the-closest-look-yet-at-chinese-economic-engagement-in-africa Quartz Africa: https://qz.com/africa/1335418/chinese-leaders-visit-africa-more-often-than-you-think-and-not-always-the-places-you-expect/ Quartz Africa: https://qz.com/africa/1324618/china-is-kenyas-largest-creditor-with-72-of-total-bilateral-debt/ Quartz Africa: https://qz.com/africa/1323666/china-and-djibouti-have-launched-africas-biggest-free-trade-zone/ Quartz Africa: https://qz.com/africa/1310072/china-in-nigerias-economy-from-huawei-to-small-businesses/ Quartz Africa: https://qz.com/africa/1297093/china-will-host-the-china-africa-defense-forum/ Quartz Africa: https://qz.com/africa/1291372/chinas-yuan-gets-support-from-africa-central-banks-to-replace-us-dollar-reserve/ Quartz Africa: https://qz.com/africa/1283192/chinas-tourism-to-africa-is-growing-as-visa-rules-are-relaxed/ Quartz Africa: https://qz.com/africa/661331/south-africa-is-targeting-chinese-and-indian-tourists-after-relaxing-its-visa-rules/ Quartz Africa: https://qz.com/africa/1030978/china-is-training-africas-next-generation-of-aviation-and-transport-officials/ Quartz Africa: https://qz.com/africa/1351749/chinas-confucius-institutes-in-africa-spread-mandarin-culture/ https://eng.yidaiyilu.gov.cn/jcsj/dsjkydyl/40513.htm https://www.focac.org/eng/ltjj_3/ltffcy/ https://www.sciencedirect.com/science/article/pii/S0016718517303056 http://www.xinhuanet.com/english/2018-05/29/c_137213337.htm http://www.sais-cari.org/data-chinese-loans-and-aid-to-africa https://www.cnbcafrica.com/news/international/2018/06/27/why-china-is-increasing-its-military-presence-in-africa/ http://en.sasac.gov.cn/2018/08/30/c_380.htm
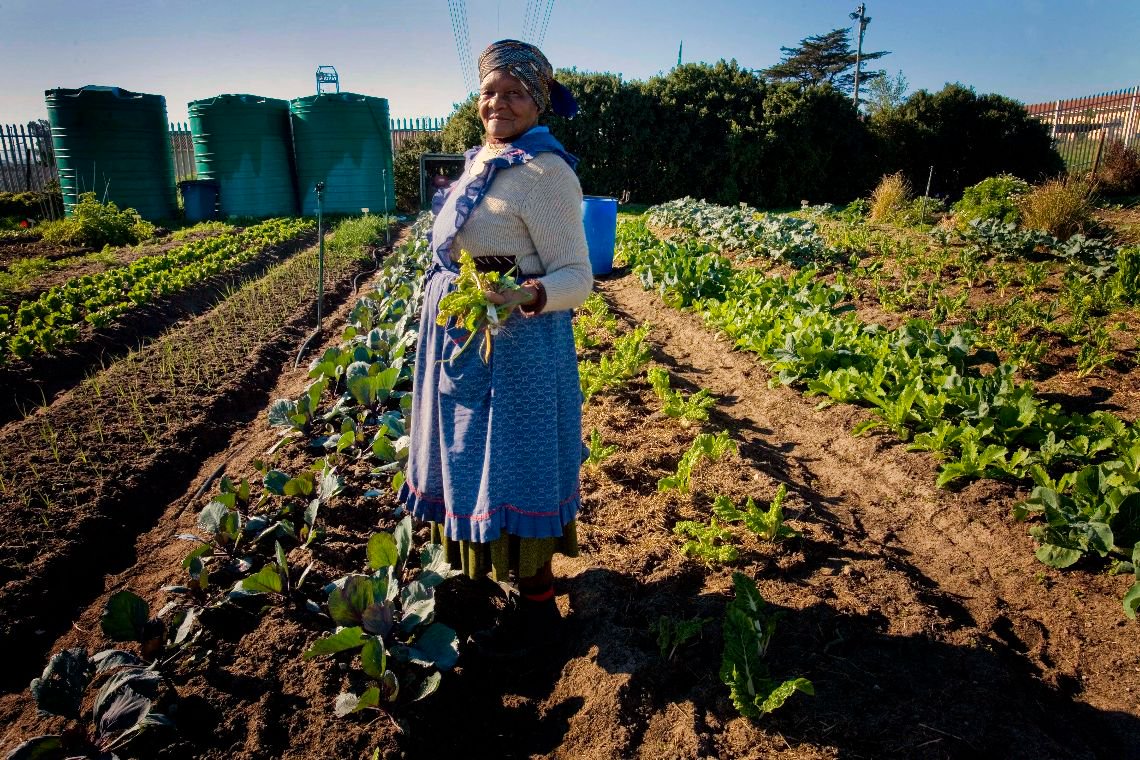
Africa has more than 202 million hectares of uncultivated land, equivalent to almost half of the world’s usable uncultivated land. Despite this, Africa suffers from the highest poverty rate in the world with nearly 47.5% of the population living below the poverty line of US$1.25 a day (as of 2008). Poor resource management and improper governance of land have been the main hindrance to unleashing the potential of the agricultural land in Africa. Recently, this untapped fortune attracted the attention of many international and African organizations. The World Bank report on “Securing Africa’s Land for Shared Prosperity” highlights many opportunities that Africa can make use of to achieve sustainable growth and eradicate poverty through scale-up programs and policy reforms. Such reforms are entitled to increase land productivity, boost food security and ensure inclusive economic growth. The World Bank suggests a 10-step scaling up program to enhance land reform in Africa based on lessons learned from countries like Brazil, Argentina, Indonesia, and China. “Land governance is a proven pathway to achieving transformational change and impact that will help secure Africa’s future for the benefit of all its families,” says Jamal Saghir, World Bank Director for Sustainable Development in Africa[1]. The program builds on previous experience and adds customized solutions to address specific challenges in African countries, among which are the following: Poor documentation that leads to land grabs by investors Corruption and incompetent administration of land Lack of expertise and need for capacity management To overcome those challenges, and to ensure the reforms serve the purpose of sustainable growth, the steps suggested by the World Bank program include[2]: Securing tenancy rights over individual and public lands Redistribution of land possession, to include the poor and deprived majority Improve land governance: enhance transparency, power decentralization, develop information systems and databases to ensure proper documentation and better mapping of lands Adopt technology innovation to enhance efficiency Capacity building: providing training and knowledge transfer facilities for better administration of land Reforms of planning to ensure efficient use of the available agricultural capacity Empower the rule of law to guarantee farmers rights and resolve disputes Implementing these reforms would enable Africa to make use of its land resources to attract investments and achieve higher returns, which will lead to more growth and less poverty in the region[3]. Nigeria and South Africa have started their way through land reforms and below are lessons learned from each. Nigeria Land Reform Nigeria is the country with the highest population in Africa, 151 million representing 250 ethnic groups as of 2008. Nigeria’s agricultural sector is one of the major sectors contributing to the economy as it creates jobs for more than 50% of the rural population. The country’s total land area is estimated to be more than 910 thousand square kilometers of which almost 80% is usable for cultivating crops and livestock production[4]. 80% of the Nigerian rural population are farmers, however, the percentage of land used from the total land is only 33%. Limited public investment (less than 2% of government expenditures), corruption, need for land law reforms were among the main reasons behind the inefficient use of land in Nigeria[5]. Since land ownership is a major determinant in the use of land for agricultural purposes, the Nigerian government published the Land Use Act of 1978 to ensure land is accessible to all farmers in a fair distribution system. However, many reforms are yet to be implemented in the Act to ensure that it achieves its objectives. Building trust between government and people, and educating the public about the laws, procedures, and reforms are inevitable actions that the Nigerian government needs to consider to enable the country to achieve its mission to be one of the 20 largest economies in the world by 2020[6]. South Africa Land Reform The need for land reform in South Africa has never been more crucial. The country has witnessed inequality in land ownership between the black majority and the white minority for ages. Reforms tried to address this challenge since 1994, but till 2011 reforms could only help in transferring 6.27 million hectares to the white minority, which is equivalent to 7.2% of the land already owned by the white in 1994[7]. This progress is too slow, and South Africa needs to fasten the pace of reforms implementation. The case of South Africa makes it clear that reforms that do not target small-farmer needs will not be so effective in achieving sustainable growth. To ensure successful implementation, the government should involve civil society and provide enough support to farmers. Lately, many international organizations are trying to induce land reforms in South Africa to benefit from the country agriculture resources. Conservation South Africa (CSA) is working closely with governmental agencies to enhance farming practices to maximize productivity and achieve food security within the nation[8]. Hend Behery, Senior Associate at Infomineo Sources [1] http://www.worldbank.org/en/region/afr/publication/securing-africas-land-for-shared-prosperity [2] http://www.focusonland.com/download/532c7dd2f0275/ [3]https://openknowledge.worldbank.org/bitstream/handle/10986/13837/780850PUB0EPI00LIC00pubdate05024013.pdf?sequence=1&isAllowed=y [4] https://usaidlandtenure.net/wp-content/uploads/2016/09/USAID_Land_Tenure_Nigeria_Profile.pdf [5] http://www.hrpub.org/download/20171030/UJAR4-10410070.pdf [6] http://siteresources.worldbank.org/EXTARD/Resources/336681-1236436879081/5893311-1271205116054/mabogunje.pdf [7]https://openknowledge.worldbank.org/bitstream/handle/10986/13837/780850PUB0EPI00LIC00pubdate05024013.pdf?sequence=1&isAllowed=y [8] https://www.conservation.org/global/ci_south_africa/our-initiatives/food-security-land-reform/Pages/food-security-land-reform.aspx

Winds of change have been blowing impetuously in some Sub-Saharan African (SSA) countries in the last months. Although change is always quite welcome when it comes during a gloomy period, it often goes hand-in-hand with a degree of uncertainty that requires action to be measured and possibly mitigated. The low period of discussion started in 2015, when Sub-Saharan Africa growth began to dip below the world average for the first time since 2000. It reached its gloomiest point in 2016, with a GDP growth rate of +1.4% -- the lowest in 22 years. For 2018, the IMF forecasts an encouraging +3.4% growth rate, but the Fund also says that to effectively catch up the rest of the world, the SSA will have to wait until 2020. [caption id="attachment_4426" align="aligncenter" width="790"] GDP growth rates – constant prices[/caption] Normally, mid-sized economies can ensure (or at least protect) growth as long as enlightened investments in infrastructure, innovation and expansion of the internal consumption can be guaranteed. In other cases, the sole recent recovery of commodity prices seems like such a fragile driver for the future, as it has been in the past. Structural reforms to the economy and governance have been long awaited, but a decisive shock may have finally have occurred. Angola Last September Angola elected its new president after 38 years under Jose Eduardo Dos Santos. But the real end of the dynasty seemed to be the decision of Joao Lourenço, Angola’s new president, by removing Eduardo’s daughter and son from the guidance of two pillars in the local economy. Respectively this included, Sonangol, the national oil company, and a 5 billion USD sovereign wealth fund. Lourenço has seemed very determined to fight corruption, make Angola more attractive to foreign investors (i.e. by removing obligations of Angolan business ownership) and dismantle some previously existing mechanisms that kept two-thirds of Angolans under the poverty line despite the oil boom. Zimbabwe The newly elected President of Zimbabwe, Emmerson Mnangagwa, recently asked its people for their patience. After 37 years of dictatorship under Robert Mugabe, the current president is trying to take appropriate actions to bring the country back on track. Internally, he’s not only fighting corruption by arresting several high-profile figures on allegations of bribery, but also introducing social welfare measures such as free medical care for children and the elderly as well as a temporary reduction in fuel prices. Externally, he has reached agreements with South Africa to upgrade the shared railway network and with China to expand Harare airport’s capacity. He is also actively looking for partnerships and investors to revive the Zimbabwean economy through further deals with Belarus, Russia and, again, China. South Africa Elected last February, the new president, Cyril Ramaphosa, has promised to secure a total of USD 100 billion US dollars of investment for the country and, more importantly, stop the opaque misconduct of state-run firms and make clean governance a priority. Taking over the inheritance of 9 years under Jacob Zuma, whom recently appeared in court to face 16 corruption charges, means finding a delicate balance between the required rupture with the past and the current need for governability. Corruption has undermined public confidence within state institutions and, given South Africa’s economic significance within SSA, Ramaphosa has not only South African eyes on him. Mozambique The unpredictable death (by natural causes) of Afonso Dhlakama, leader of the historical opposition party for over 40 years, casts shadows on the continuation of the peace treaties with the ruling party. This conflict has dragged on since when Mozambique became independent and, in the opinion of many, has been a brake on the social and economic development of the country. With presidential elections scheduled for next October, the attitude toward peace and democracy of those who will succeed Dhlakama has kept everyone on hold. Truth is that Renamo, the recently orphaned party, gained momentum in the 2014 general election and kept it in recent by-election in the Nampula province. Moreover, in five months the electorate could finally express its opinion on the scandal over the giant debt incurred during the 2013 Guebuza administration and unveiled only in the last parliamentary term. [caption id="attachment_4427" align="aligncenter" width="781"] GDP growth rates – constant prices[/caption] Apart from legitimate skepticism and subjective political orientations, these vicissitudes will surely have an impact both on regional and individual country scenarios. Ultimately, companies and investors will be called to analyze and re-assess their business operations, based on where the wind blows. Antonio Pilogallo, Senior Associate at Infomineo Sources https://www.reuters.com/article/us-china-zimbabwe/chinas-xi-tells-zimbabwe-president-they-should-write-new-chapter-in-ties-idUSKCN1HA1LF https://www.aljazeera.com/news/2018/03/zimbabwe-president-emmerson-mnangagwa-100-days-office-180305114311581.html https://www.economist.com/news/middle-east-and-africa/21742130-just-he-was-about-agree-peace-deal-warlord-drops-dead-will-afonso https://www.economist.com/news/middle-east-and-africa/21741577-how-far-will-he-go-fighting-corruption-angolas-new-president-jo-o https://www.economist.com/news/middle-east-and-africa/21742135-risks-remain-africas-economies-are-turning-corner https://www.economist.com/news/middle-east-and-africa/21742135-risks-remain-africas-economies-are-turning-corner https://www.nytimes.com/2018/02/26/world/africa/south-africa-ramaphosa-cabinet.html https://www.theguardian.com/world/2018/feb/14/who-is-cyril-ramaphosa-south-africa-president http://allafrica.com/stories/201805150081.html World Economic Outlook Database, April 2018
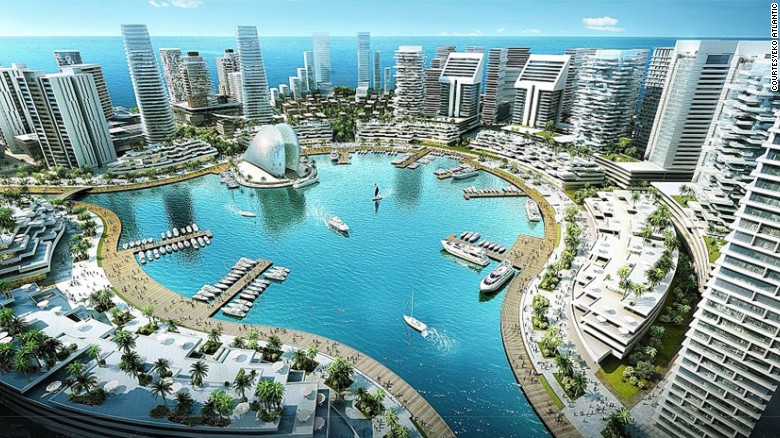
Africa is undergoing impressive urban growth. The continent who was alongside with Asia one of the least urbanized in the world back in 2014, is now demonstrating fast urbanization rates[1] and is envisioned to reach a 2.4 billion population within the next decades favoring cities over rural areas[2]. By 2030, it is expected that 6 of the world’s 41 megacities will be African, the cities being Cairo, Lagos and Kinshasa joined by Johannesburg, Luanda and Dar es Salaam[3]. The urbanization process has undoubtedly the power to transform the global economy, however, it also comes with a set of challenges such as the need for mobility and access to urban service, the access to clean water and sanitation, public health and safety issues as well as policy-related matters.[4] Hence, the urbanization process can spur development only if initiatives are taken on to cope with the structural challenges that urbanization generates; and efforts are pursued to create inclusive, safe and sustainable cities as awaited by the UN Sustainable Development Goals. [5] In the light of these challenges, questions about the continent’s readiness for the so-called third revolution[6] emerge with an important interrogation being: How will Africa deal with the booming urbanization process? Eko Atlantic, Nigeria - Nigeria's ambitious multi-billion dollar project that aims to transform Lagos, the country's most populated city. As the 2016-2025 decade is promising to be the decade of the continent’s development through technology, Smart cities are presented by policymakers as the solution to the rapid urbanization growth. According to the International Telecommunication Union, a Smart city is “an innovative city that uses ICTs [information and communication technologies] and other means to improve quality of life, efficiency of urban operation and services and competitiveness”.[7] African policymakers are very much aware of the role of technology in spurring the development of urban cities. Incentives proving the importance of the matter include the Casablanca Smart city expo, the launch of the Nigerian Smart Cities Initiative aiming to encourage ICT’s integration in the country’s urban infrastructure and the Smart Africa blueprint initiative[8]. The blueprint launched in Rwanda in 2013, addressed to African city leaders and officials, lays down the principles for Smart city platforms and advises on the effective strategies and challenges to face the continent’s booming urbanization. A large set of successful initiatives inspired by the blueprint were put in place, using ICT to foster the development of Smart cities around the continent. EParking Solutions in Nairobi or online e-government services portal like “irembo” in Rwanda are examples of urbanization-led innovations.[9] Moreover, Smart cities are blooming all around the continent as illustrated by Eko Atlantic in Lagos, Nigeria; Hope and King City in Ghana; Vision City in Kigali, Rwanda[10]; Kenya's new tech hub Konza technology city and Waterfall city in South Africa. Overall, the development of Smart cities in Africa benefits from the African experience in matters such as limited legacy drawbacks (costs associated with the maintenance of infrastructure in place), youthful consumer population, a dominant entrepreneurial culture, connectivity facilities and policymakers efforts in positioning ICT as an enabler.[11] While for some these ambitious Smart cities urban projects have the potential to reshape Africa’s urban future, it is argued for others that these developments are nothing else than a utopia.[12] What should be highlighted here is no matter how “smart” the efforts or the “cities” are, the focus should be emphasized on the responsibility held by policymakers in planning for the change. As H.E. President Paul Kagame goes in the Smart Africa summit “we have to think ahead. It is up to us to plan adequately for urban expansion by anticipating the higher standard of public services, housing, liveability, and economic opportunity that our citizens expect and deserve. […] technology is not a panacea, and it does not run on auto-pilot. To get the cities we want, we must always keep the people we serve at the center of our efforts. Technology alone cannot do that for us.”[13] Hinde Adjar, Infomineo. [1] https://esa.un.org/unpd/wup/publications/files/wup2014-highlights.pdf [2] https://www.bearingpoint.com/en/our-success/thought-leadership/smart-cities-the-key-to-africas-third-revolution/ [3] https://issafrica.org/iss-today/africas-future-is-urban [4] http://www.mitec.gov.rw/fileadmin/Documents/Strategy/SMART_AFRICA_Sustainable-Cities_A_Blueprint_for_Africa.pdf.pdf [5] https://issafrica.org/research/papers/african-urban-futures [6] https://www.bearingpoint.com/en/our-success/thought-leadership/smart-cities-the-key-to-africas-third-revolution/ [7] https://www.itu.int/en/ITU-T/focusgroups/ssc/Pages/default.aspx [8] https://edition.cnn.com/2017/12/12/africa/africa-new-smart-cities/index.html [9] http://smartcityhub.com/governance-economy/africa-smart-city-blueprint-africas-time-is-now/ [10] https://edition.cnn.com/2017/12/12/africa/africa-new-smart-cities/index.html & http://edition.cnn.com/2013/05/30/business/africa-new-cities-konza-eko/index.html [11] https://www2.deloitte.com/content/dam/Deloitte/za/Documents/risk/ZA_SMARTCITIESA4(VIEW)_020615.pdf [12] http://edition.cnn.com/2013/05/30/business/africa-new-cities-konza-eko/index.html [13] http://www.mitec.gov.rw/fileadmin/Documents/Strategy/SMART_AFRICA_Sustainable-Cities_A_Blueprint_for_Africa.pdf.pdf

Highlights from this year’s Organizing for Growth Report For over 25 years the American Fortune magazine publishes an annual list of the top Global 500 companies ranked by revenue. The companies that made the list in 2017 generated a combined revenue of 27.7 trillion USD -- roughly 37% of global GDP --, earned profits of 1.5 trillion USD, and employed 67 million people. ((Fortune. “Global 500.” http://fortune.com/global500/ (last accessed: April 4, 2018).))Fortune’s list is not only “global” in the sense that it represents businesses from 34 different countries, but also because many of them are offering their respective goods and services across the globe. Infomineo’s third annual review of the Global 500 attempts to provide information concerning the corporate structure of companies on the list. The objective of the study is to understand how major global corporations are conducting business in the Middle East and Africa and what are the most favorite destinations for foreign entities to set up a regional headquarter (RHQ)((Defined by a cluster of management level positions within a certain location that indicate a decision-making responsibility regarding wide-ranging strategic decision concerning the Middle East, Africa, or the entire MEA region.)) or a sub-regional headquarter (SRHQ).((SRHQs have limited decision making responsibilities confined to specific areas such as marketing or human resources.)) Dubai, the city upon a hill Dubai and Johannesburg are once again the top destinations for foreign entities when it comes to the number of regional headquarters. Dubai is hosting 155 regional and sub-regional headquarters that are overseeing business activity in either the Middle East or the entire MEA region. The most attractive city in Africa remains Johannesburg, which has a combined 29 regional headquarters.((28 regional headquarters covering Africa, and 1 covering the entire MEA region.)) Additionally, 46 companies decided to oversee their southern African business activities out of South Africa’s biggest city. On the other side of the continent, Casablanca is once again the most attractive hub to cover North Africa, whereas companies with a lot of business in east Africa prefer to set up their regional presence in Nairobi. While Lagos remains the most desirable hub for entire west Africa, Abidjan is gaining momentum as a sub-regional headquarter overseeing francophone Africa. Europe, a bridge to the MEA region On a company’s way to the MEA region, Europe seems to play an important bridge function. As of 2017, a total of 63 companies are overseeing their MEA operations from Europe. In most of these cases, companies from either Asia or North America are setting up regional headquarters in Europe to cover the geographical area called EMEA – Europe, Middle East, and Africa. London remains the most desirable hub for foreign entities in Europe with 26 regional headquarters. The British capital seems to be particularly attractive to U.S. companies((out of the 26 companies with an EMEA RHQ in London, 12 are American)) and to financial institutions ((Out of the 26 companies with an EMEA RHQ in London, 12 are from the financial services sector)). Even though some financial institutions such as JPMorgan Chase, Bank of America, and Goldman Sachs, have already announced that they are expanding their offices in Frankfurt and Paris,((Keohance, David. “Goldman Sachs confirms Frankfurt and Paris hubs after Brexit.” Financial Times. November 20, 2017. Jones, Huw. “Paris neck-and-neck with Frankfurt in Brexit Race.” Reuters. February 18,2018.)) it is too early to estimate the possible impact the U.K.’s departure from the European Union might have on London’s attractiveness. Chinese companies maintain centralized decision centers Looking at the country of origin of the companies reveals one of the most remarkable insights in this year’s Global 500 review. Chinese companies, despite vast business interests in MEA, are the least likely to have a regional or sub-regional headquarter in the region. Even as corporations are setting up small, local branch offices, the centralized decision center remains in the main headquarter in China. Only 15 percent of Chinese companies have a dedicated regional headquarter for the Middle East or Africa, compared to 49 percent for the U.S. and 55% for Japan. Number of companies by country of origin with MEA focused headquarters [caption id="attachment_4380" align="aligncenter" width="580"] Note: Number of companies totals 501, as Unilever was listed as an Anglo-Dutch company on the Global 500 list[/caption] Tech companies on the rise Facebook, Alibaba, or Tencent are not only prominent newcomers on Fortune’s 2017 list but a vivid illustration of the global rise of technology companies in the 21st century. With now 44 companies on the Global 500, technology became the third biggest sector on the list behind financial services and energy. Tech companies are simultaneously increasing their revenues globally and expanding their presence regionally. In 2017, 33 companies in the technology sector had a dedicated RHQ covering the MEA region, compared to 22 companies the previous year. Kevin Matthees, Associate at Infomineo.

Saudi Arabia’s Vision 2030, an economic diversification plan championed by the country’s young crown prince, Mohamed bin Salman, has been designed to reduce the country’s dependence on oil. The plan has been presented as simple; large investments in the private sector spur economic growth, create jobs and provide a new opening for the government to collect revenues. Generating jobs for aspiring young Saudi graduates is crucial in a country where nearly half of the population is under the age of 24. [note] According to the CIA World Factbook, 44.67 percent of Saudi Arabia’s 28.57 million people is under the age of 24. https://www.cia.gov/library/publications/the-world-factbook/geos/print_sa.html [/note] Furthermore, focusing on decreasing the Kingdom’s vulnerability to oil price volatility seems equally important considering that 50 percent of the country’s budget is financed through oil revenues. [note] Feteha, Ahmed. 2017. “Key Figures in Saudi Arabia’s 2018 Budget, 2017 Fiscal Data.” Bloomberg Markets. December 19. https://www.bloomberg.com/news/articles/2017-12-19/key-figures-in-saudi-arabia-s-2018-budget-2017-fiscal-data [/note] Newspapers are frequently reporting on the vision; however, their articles seldom address potential hurdles the kingdom might encounter along the way. By anticipating potential complications and pointing them out, analysts could contribute to assisting the vision’s success. The following paragraphs discuss three questions that might impede the private sector growth envisioned in Vision 2030. How to decrease the salary gap? It will be difficult to attract young Saudi graduates to the private sector if the government is unable to decrease the salary gap. According to the Financial Times, employees in the public sector earn 150%, on average, more as compared to their peers in the private sector. [note] England, Andrea and Heba Saleh. 2018. “How the Middle East is sowing seeds of a second Arab spring.” In Financial Times. March 5. https://www.ft.com/content/a6229844-1ad3-11e8-aaca-4574d7dabfb6 [/note] The salary gap started to widen in 2011, when uprisings challenged Arab leaders all over the Middle East and North Africa. It remains unclear which options the Saudi government has to address this imbalance. Setting a high minimum wage for private sector jobs might discourage investors and entrepreneurs, crucial players in establishing a vibrant private sector. The Saudi government may have to stop raising public sector salaries to allow the private sector to catch up. The difficulty of this proposition was in full display in early 2018 when Saudi civil servants not only saw their annual pay raise restored, but were granted a monthly allowance of 1,000 riyals (250 USD) to cope with rising living expenses. [note] Shahine, Alaa, and Vivian Nereim. 2018. “Royal Handouts Cheer Saudis But Show Struggle to Revamp Economy.” Bloomberg Politics. January 6. https://www.bloomberg.com/news/articles/2018-01-06/saudis-get-extra-pay-after-price-surge-sparked-public-complaints [/note] As Gregory Gause points out in his recent Foreign Affairs article, the move was a response to “public distress about the increased price of water, electricity, and gasoline and the imposition of the five percent VAT.” [note] Gause III, Gregory F. 2018. “Fresh Prince. The Schemes and Dreams of Saudi Arabi’s Next King.” Foreign Affairs. March 19. https://www.foreignaffairs.com/articles/middle-east/2018-03-19/fresh-prince [/note] [caption id="attachment_4344" align="aligncenter" width="758"] Source: Ministry of Labor and Social Development. 2016. “Saudi Arabia Labor Market Report 2016.”p.13[/caption] Will an oversupply of potential candidates prevent private sector pay from rising? Attempts to decrease the public-sector workforce at a time when more young Saudis are entering the labor market, might prevent private sector salaries from rising rapidly. In total, there will be three major factors that will put downward pressure on private sector pay. Firstly, the cohort of young Saudi graduates that are entering the workforce is growing, increasing the supply of candidates for companies to choose from. Secondly, the public sector, currently employing two thirds of Saudi nationals, is trying to decrease its employee numbers; meaning that even as older Saudis retire the government will hire less young Saudis to replace them. This again puts pressure on the private sector, as it has to absorb a higher share of job seekers. And finally, the number of people competing for jobs might increase even further depending on how many women will try to enter the labor market. Allowing women to drive and improved workplace environments to accommodate their needs will encourage more women to apply for jobs and might very well increase their participation rate in the workforce above the 30% goal set by Vision 2030. [note] In 2015 women participation rate in the workforce in Saudi Arabia was 21.8 percent. https://data.worldbank.org/indicator/SL.TLF.TOTL.FE.ZS?locations=SA [/note] This last aspect not only applies to young Saudis, but to women across all age groups that were previously unable to take up jobs due to a lack of mobility. [caption id="attachment_4345" align="aligncenter" width="406"] Source: World Bank Development Indicators[/caption] Will young Saudis accept private sector jobs? Changing the perception among young Saudi nationals regarding work in the private sector will be challenging. In their 2016 Labor Market Report, the Ministry of Labor and Social Development pointed out that “Saudi nationals continue to view public-sector work as more prestigious than private employment.” [note] Ministry of Labor and Social Development in the Kingdom of Saudi Arabia. 2016. “Saudi Arabia Labor Market Report 2016.” 3rd edition. P. 13. https://irp-cdn.multiscreensite.com/ff00f1f0/files/uploaded/G20%20Labor%20Market%20Report%202016%20-%20Final%20-%20Low%20res.pdf [/note] As long as the private sector is unable to offer competitive salaries, this perception might be hard to change. “Many Saudis view small and medium-sized enterprises (SMEs) as unattractive” the report continues, due to “lacking professionalism in their working conditions and practices”. [note] Ibid. P. 13 https://irp-cdn.multiscreensite.com/ff00f1f0/files/uploaded/G20%20Labor%20Market%20Report%202016%20-%20Final%20-%20Low%20res.pdf [/note] Another thing SMEs lack is name recognition. In a society, where social standing has far-reaching implications, including finding a marital partner, the issue of prestige can’t be taken lightly. As the number of Saudis graduating with a college degree is increasing, so are their expectations about their future workplace. Having had access to better educational institutions than their parents, young Saudis expect to do better than previous generations. According to the CIA World Factbook, 44.67 percent of Saudi Arabia’s 28.57 million people is under the age of 24. https://www.cia.gov/library/publications/the-world-factbook/geos/print_sa.html Feteha, Ahmed. 2017. “Key Figures in Saudi Arabia’s 2018 Budget, 2017 Fiscal Data.” Bloomberg Markets. December 19. https://www.bloomberg.com/news/articles/2017-12-19/key-figures-in-saudi-arabia-s-2018-budget-2017-fiscal-data England, Andrea and Heba Saleh. 2018. “How the Middle East is sowing seeds of a second Arab spring.” In Financial Times. March 5. https://www.ft.com/content/a6229844-1ad3-11e8-aaca-4574d7dabfb6 Shahine, Alaa, and Vivian Nereim. 2018. “Royal Handouts Cheer Saudis But Show Struggle to Revamp Economy.” Bloomberg Politics. January 6. https://www.bloomberg.com/news/articles/2018-01-06/saudis-get-extra-pay-after-price-surge-sparked-public-complaints Gause III, Gregory F. 2018. “Fresh Prince. The Schemes and Dreams of Saudi Arabi’s Next King.” Foreign Affairs. March 19. https://www.foreignaffairs.com/articles/middle-east/2018-03-19/fresh-prince In 2015 women participation rate in the workforce in Saudi Arabia was 21.8 percent. https://data.worldbank.org/indicator/SL.TLF.TOTL.FE.ZS?locations=SA Ministry of Labor and Social Development in the Kingdom of Saudi Arabia. 2016. “Saudi Arabia Labor Market Report 2016.” 3rd edition. P. 13. https://irp-cdn.multiscreensite.com/ff00f1f0/files/uploaded/G20%20Labor%20Market%20Report%202016%20-%20Final%20-%20Low%20res.pdf Ibid. P. 13 https://irp-cdn.multiscreensite.com/ff00f1f0/files/uploaded/G20%20Labor%20Market%20Report%202016%20-%20Final%20-%20Low%20res.pdf

Since the global financial crisis of 2007-2008, inflation has been on the watch in most economies. Its importance has been amplified as countries, investors and non-investors must understand inflation and its causes due to the fact that it can affect the price you pay of everything, from your daily cup of coffee to a share of common stock. [caption id="attachment_4327" align="aligncenter" width="900"] Africa and the Middle East region have been facing some of the highest inflation rates in 2017[/caption] What is inflation? Inflation occurs when prices rise, and a currency becomes worth less than it was before. When a country’s currency loses value, its exchange rate weakens compared to others directly affecting its purchasing power both within the country and in international trade. High inflation can be caused by an increased demand for goods in conjunction with a lack of supply. Basic economic theory tells us that when more people want the same good, its price increases. Inflation can also be triggered when the value of your currency decreases. This can be caused by governments increasing the total money supply (sometimes known as printing too much money) or by a devaluation in a net importer country. As prices increase, if wages don’t keep up, workers lose their purchasing power ultimately reducing their standard of living. If inflation becomes too high, especially for an extended period, it can create major repercussions on the econometric-social structure of a nation, eliminating the middle class. [2] In a perfect storm of economic disaster, a nation might significantly face both factors at the same time. This would lead to a monetary phenomenon known as hyperinflation. Hyperinflation In 1956, Phillip Cagan, an economist working at America’s National Bureau of Economic Research, described hyperinflation as a period in which prices rise by more than 50% per month; often resulting in a revolution, war or political transition. The first recorded episode of such happening occurred between 1795 and 1796, in revolutionary France. [3] As of 2017, African and Middle Eastern countries tend to have the highest average inflation rates across the world; 7 out of the highest 10 inflation rates were from countries located on the African continent and the Middle East region. South Sudan is the highest inflation in the region with 111.4% annual inflation, then the Democratic Republic of the Congo (50%), Libya (35%), Egypt (29.7%), Angola (23.3%), Yemen (23%) and Sudan (21%). [4] Reasons of high inflation in those regions can be summed up in the following points: Global food prices falling Africa has always been called the food basket of the world since many of its economies have a high dependence on exporting raw materials and food. On the other hand, food prices (according to the US dollar)have been steadily falling since 2011 and are well below the crises levels found in 2007 and 2008. A lack of foreign currency in these nations caused inflation through the unmet need for currencies to import. Droughts In the 2015 and 2016 harvesting seasons, southern and eastern Africa faced one of the worst droughts seen in 50 years, severely cutting the supply of food and triggering inflation in their respective countries. Wars and conflicts Wars in countries such as Syria, Libya, Yemen, South Sudan and Nigeria, have created devastating effects on these respective countries. Massive currency depreciation makes the country’s exports cheaper for their neighboring countries to import, diminishing the local supply nationwide.[5] Poor government execution The central bank is the main institution combating inflation. In an attempt to minimize the business cycle volatility and fluctuations, there are a few methods used to target inflation. Tactics used when attempting to stabilize the currency - Increasing interest rates - Increasing reserve requirements - Calling in debts that are owed to the government However, poor government executions paired with bad economic conditions have lead governments to seek safe haven in short-sighted actions; affecting inflation in return for having monetary liquidity. For instance, Uganda, Zimbabwe and Somalia have been overprinting money to cover their debt causing huge currency devaluation. In late July of 2008, a Zimbabwean dollar was worth 688 trillion times less than it was in August 2006 after printing so much money to fund budget deficits which propelled inflation rates to skyrocket. Since 2009, Zimbabwean currency has no value and most transactions today are conducted in U.S. dollars or South African Rand.[6] South Sudan In the past year, economic performance has continued to deteriorate in South of Sudan because of the civil war, the sharp fall in oil production, the collapse of global oil prices, unemployment and a decline in agriculture production. This has meant that the government is unable to raise the resources required to finance peace-related costs. [caption id="attachment_4328" align="alignright" width="1024"] The South Sudanese pound is the official currency of the Republic of South Sudan. It is subdivided into 100 piasters.[/caption] Food insecurity and hyperinflation remain challenging. A famine was declared in February 2017 [7]. The annual Consumer Price Index (CPI) increased in the Juba and Wau regions, by 143% and 109% respectively, from September 2016 to September 2017 [8]. The Bank of South Sudan was overprinting money to cover the deficits associated with wardriving inflation to peak at 550% in September 2016. As a direct cause of inflation, when printing money slowed in recent months, inflation decelerated to 102% on September 2017. Congo The Democratic Republic of the Congo (DRC), the largest country in Francophone Africa, is still recovering from a series of conflicts that occurred in the 1990s causing a lasting economic and social tumble. [caption id="attachment_4330" align="aligncenter" width="800"] The franc is the currency of the Democratic Republic of the Congo. It is subdivided into 100 centimes.[/caption] A decline in prices and a decreasing global demand for raw materials exported by the country, (particularly copper and cobalt; which account for 80% of its export revenue) caused the GDP growth to fall to its lowest since 2001 to 2.4% in 2016. This shock affected the external accounts and caused the Congolese franc to drop by 31% against the dollar in 2016; fueling inflation to 24%. [9] Persistently low commodity prices and high government deficits in 2017, exacerbated the franc hitting inflation to 50%. Adding further pressure on inflation, in August 2017 the government banned imports of carbonated drinks, cement, iron and sugar. Headline inflation increased from 67.5% year-on-year in July to 70.8% year-on-year in August. [10] With the government doubling its base interest rate, recovery of commodity prices and the mining output; Congo’s central bank expects inflation in 2018 to fall to about 28%. Zimbabwe 2008... and again in 2017 In 2008, Zimbabwe suffered one of the most interesting, which happened to be the second most severe, episodes of hyperinflation in recorded history. Zimbabwe’s annual inflation rate, which peaked in November 2008, reached 89.7 sextillions (10^23) %. At this point, prices were doubling every 24.7 hours. [caption id="attachment_4331" align="alignright" width="813"] Zimbabwe's Hyperinflation as of June 2016[/caption] At the peak of Zimbabwe’s hyperinflation episode in November 2008, Zimbabweans refused to use the Zimbabwe dollar. The government gave up and decided to dollarize the economy and accept the US dollar as the unit of account for government finance. In January 2009, Zimbabweans were allowed to use the US dollar, the euro, and the South African Rand. However, teachers and civil servants were still being paid in Zimbabwean dollars & prices in shops and restaurants were still in Zimbabwean dollars. The black market thrived in this period, with hyperinflation, anyone who held a Zimbabwean dollar struggled to change it immediately or else would lose all of what they had. Again in 2016, the central bank printed so-called bond notes, in which they said carry a value equal to the dollars, surging the money supply up 36% in 2017. The notes were sold on the underground market. The Zimbabwe National Statistical Agency (Zimstat) said this means prices, as measured by the all of the items included in the consumer price index (CPI), increased by an average of 3.52% in the 12 months leading up to January 2018. [11] Shahd Ezzat, Business Research Analyst at Infomineo. [1] https://www.thebalance.com/what-causes-a-high-rate-of-inflation-357608 [2] https://www.forbes.com/sites/mikepatton/2014/05/09/the-three-countries-with-the-highest-inflation/#7ef155fe172e [3] https://www.economist.com/blogs/economist-explains/2018/02/economist-explains-5 [4]IMF Database [5] https://www.africaresearchinstitute.org/newsite/blog/silent-crisis-food-price-inflation-africa/ [6] https://www.thebalance.com/what-causes-a-high-rate-of-inflation-357608 [7] http://blogs.worldbank.org/africacan/taming-the-tides-of-high-inflation-in-south-sudan [8] http://www.africabusinessradio.com/2018/01/conflict-and-hyperinflation-in-south-sudan-causes-and-solutions/ [9] http://www.worldbank.org/en/country/drc/overview [10] https://home.kpmg.com/content/dam/kpmg/za/pdf/2017/12/DRC-2017H2.pdf [11] https://www.herald.co.zw/annual-inflation-rate-up-352-percent/
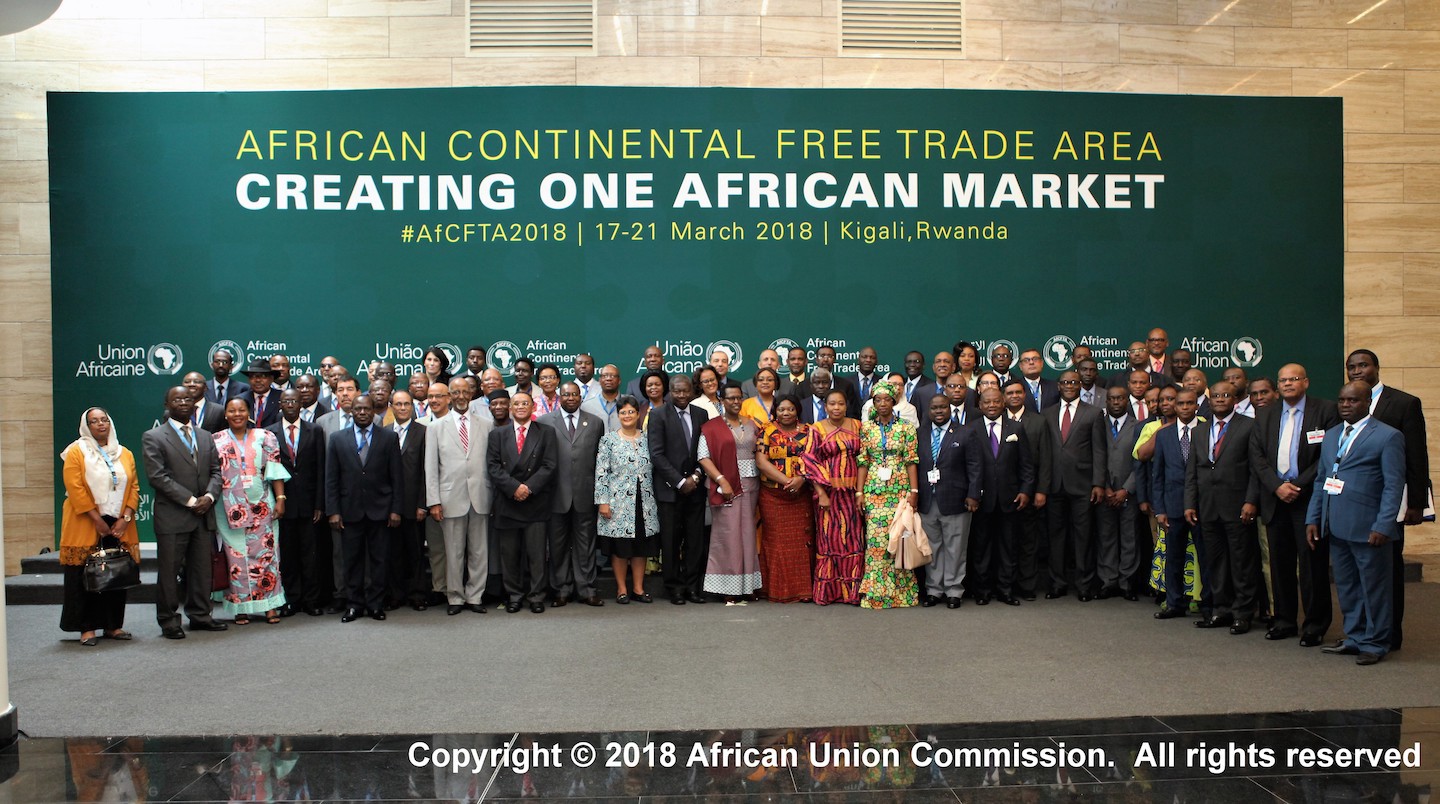
African leaders from 44 African nations gathered at the African Union Summit from March 17th to 21st 2018 in Kigali, Rwanda, and signed the Continental Free Trade Area (AfCFTA) treaty to create the world’s largest single market. The agreement will be the largest trade agreement in history since the creation of the World Trade Organization. (1) The pact aims to boost intra-African trade by making Africa a single market of 1.2 billion people and a cumulative GDP over $3.4 trillion. The UN Economic Commission for Africa (UNECA) estimates that the implementation of the agreement could increase intra-African trade by 52% by 2022 (compared with trade levels in 2010) and double the share of intra-African trade (currently around 13% of Africa’s exports) by the start of the next decade. (2) (8) Among the AU member states that did not sign the pact are the continent’s two largest economies - Nigeria and South Africa. Botswana, Lesotho, Namibia, Zambia, Burundi, Eritrea, Benin, Sierra Leone and Guinea Bissau are the other member countries which did not sign the pact. (1) (3) (4) Under the CFTA, governments commit to removing tariffs on 90% of goods produced within the continent. The next step for the governments is to ratify the CFTA in their countries within the next 6 months. (1) Objectives of the Continental Free Trade Area Establish a single continental market for goods and services, with free movement of business professionals and investments, accelerating the establishment of the Continental Customs Union and the African customs union. (5) Expand intra-African trade through better harmonization and coordination of trade liberalization and facilitation across Regional Economic Communities (RECs) and across Africa.(5) Resolve the challenges of multiple and overlapping memberships and expedite the integration processes.(5) Enhance competitiveness at the industry and enterprise level by exploiting opportunities for scale production, continental market access and better reallocation of resources. (5) Potential Benefits & Relevant Implications According to a research paper published by the United Nations Conference on Trade and Development (UNCTAD) in February 2018, the CFTA offers many opportunities for sustainable development and economic growth in the African economies. However, not all countries will benefit to the same extent, and the gain of welfare benefits also implicates relevant costs and commitments. (6) Most of the benefits of further trade integration (i.e. welfare benefits from lower import prices, production efficiency and increase in outputs, higher value-added jobs and exports, technological specialization, etc.) will materialize in the long term, while most of the associated costs of adjustment and integration (i.e. loss in trade tariff revenue, local SME’s vanishing in front of stronger competition, adjusting unemployment, required investment in infrastructure, political and regulatory reforms, etc.) will be incurred in the short term. (6) Using the Global Trade Analysis Project (GTAP) computable general equilibrium (CGE) model, UNCTAD has estimated the quantitative effects of the CFTA according to 2 long-term scenarios: a full Free Trade Agreement (FTA) and Special Product Categorization (SPC). (6) A full Free Trade Agreement (FTA) eliminating all tariffs in the CFTA could generate welfare gains of US$ 16.1 billion, at the cost of US$ 4.1 billion in trade revenue losses (representing 9.1% of current tariff revenues). GDP and employment are expected to grow by 0.97% and 1.17% respectively. Intra-African trade growth is estimated at 33% and the continent's trade deficit is expected to drop by 50.9%. (6) Special Product Categorization (SPC) permanently exempts sensitive products from liberalization. In a scenario in which the sector with the highest current tariff revenue would be exempted from liberalization, UNCTAD simulations estimate a welfare gain of US$ 10.7 billion in the long term. Tariff revenue losses are expected at US$ 3.2 billion (representing 7.2% of current tariff revenues). GDP and employment growth are expected to grow by 0.66% and 0.82% respectively. Intra-African trade is expected to grow by 24%, while, Africa's trade deficit only shrinks by 3.8%. (6) UNCTAD also estimates the employment effect of the agreement by sub-sector (Figure 4). The agriculture sector is extremely relevant for the African economies since it employed about 53% of the continent’s labor force in 2016. Governments are worried about possible adverse impacts of the CFTA on the agriculture sector's economic growth, which would massively affect employment across the continent. Even though the largest employment growth rates are found in manufacturing and services sectors, agriculture sub-sectors are also expected to grow (see Figure 4).(6) Costs & Commitments Despite the many benefits this agreement will render, not all the countries are expected to benefit equally from the free trade agreement. While expected average GDP growth is around 1%, some countries are expected to grow over 3%, while some others are expected to contract (Figure 5). Figure 6 shows that, under the SPC scenario, fewer countries suffer tariff revenue losses above 20% compared to the full FTA scenario. (6) It is vital that African countries commit to continue improving their institutional capacities to efficiently tax and redistribute the gains from the CFTA. This includes integrating and harmonizing regulatory measures, eliminating non-tariff barriers to trade and investment, and facilitating the entry into the formal economy. (6) (8) Another key factor to fully exploit the potential benefits of the CFTA is infrastructure. Addressing Africa’s physical infrastructure gap will require $93 billion per year worth of public and private investment. (8) Even though African exports to the world are undiversified and mostly composed of raw materials, Intra-Africa exports (exports between African countries) contain more value-added products. (7) Manufactured goods represented 43% of intra-Africa exports during 2012-2016, while only representing 20% of exports to the rest of the world. Medium and high technology manufactures represented 25.4% of intra-African trade in 2015, but only accounted for 14.1% of Africa’s exports to developed countries and 13.7% of the continent’s exports to the world (Figure 2). (6) (8) As such, countries with large manufacturing bases and enabling physical and industrial infrastructure, such as South Africa, Kenya, Egypt, Morocco, and Ethiopia are in a better position to gain the expected benefits of the CFTA. (7) Agriculture will also benefit from the creation of a more viable African marketplace for food. Enhanced trade in agricultural products will also promote agro-processing and further sectoral linkages with manufacturing. (8) Even though the CFTA is a great step forward towards economic integration, there is still a long road ahead. African governments must commit to keep working so that the gains from the CFTA are distributed as fairly as possible, making sure no one is left behind, and ensuring that the CFTA becomes a catalyst for sustainable economic development for the continent as a whole. (8) Jesús Cazares, Analyst at Infomineo. Sources https://www.businessdailyafrica.com/news/Africa-leaders-ink-largest-free-market-treaty/539546-4351888-ubv411z/index.html https://www.aljazeera.com/news/2018/03/african-continental-free-trade-area-afcfta-180317191954318.html https://edition.cnn.com/2018/03/22/africa/african-trade-agreement-world/index.html https://www.reuters.com/article/us-africa-trade/nigeria-keen-to-ensure-africa-trade-bloc-good-for-itself-president-idUSKBN1GX29V https://au.int/en/ti/cfta/about http://unctad.org/en/PublicationsLibrary/ser-rp-2017d15_en.pdf https://www.moodys.com/research/Moodys-African-free-trade-deal-could-improve-regions-credit-profiles--PR_381153 https://www.weforum.org/agenda/2016/05/this-african-trade-deal-could-improve-lives-across-the-whole-continent/

Additive manufacturing, or 3D printing, is a truly disrupting phenomenon whose market, technologies, knowledge, and field of applications are witnessing an exponential growth along the last 10 years. Counted among the main technologies leading the 4th Industrial Revolution, Additive Manufacturing is currently transforming industrial production: At a company level, in the sense of redesigning the entire production line rather than just in terms of machinery replacement, At a macro level, altering the whole supply chain and the distribution of competitive advantages among it. Additive manufacturing - Timeline The high technological content of this revolution could make one believe that this is an exclusive prerogative of western economies or developed countries. Instead, reality shows a remarkable dynamism within this field in geographical areas such as the Middle East and some African countries, where the game-changing rule of additive manufacturing represents an opportunity to quickly climb the international competitiveness rankings. Middle East Additive manufacturing is experiencing notable growth in the Middle East, where many countries are willing to seize the opportunities arising from the recent technological developments and gain a leading edge in the field. As an indicator for this region, the sales of 3D printing materials are forecasted to exceed USD 550 million by 2025, growing at a CAGR of 16.7%. Israel is expected to witness the highest growth rates of the region (CAGR 20.4%), but the UAE will absorb the biggest share of these materials.[1] UAE leaders publicly disclosed their strategic will of turning the Emirates into a worldwide recognized hub dedicated to 3D technology. Some figures are already attracting the main players from all over the world: 25% of buildings in Dubai to be based on 3D printing technologies by 2030, AED 1.7 billion (USD 460+ million) value for the 3D printed medical products by 2025 AED 2.8 billion (USD 760+ million) value for the 3D printed consumer products, like household items, jewelry, games, optics, etc, by 2025[2]. In the Middle East, the appealing opportunities refer to all levels of the value chain, with many operators actively involved. Middle East - 3D printing value chain (not exhaustive) Countries such as KSA and Qatar are quite active in this field, where several initiatives took place from an R&D standpoint to a direct industrial application point of view. However, UAE maintains the greatest growth potential within the region, particularly in the aerospace sector, dental industry and academic environments[3]. The run for leadership is reflected by the achievements that the Emirates already reached in this field, including being: The first country in the Middle East to use 3D printing technology for medical purposes[4]. The first country in the world to have the first fully 3D printed office building[5]. Africa The number of 3D printing purchases in Africa was expected to rise by 23% through 2017[6], a figure that might not be particularly significative, given the current technology base of the continent. However, when it comes to modern technologies, the general opinion is that Africa is three to four years behind first world nations, at most. Increasing the country competitiveness by transitioning to high-value manufacturing is one of the goals that some African economies are pursuing by attracting and developing capabilities in 3D printing technology. While this adoption is part of a deliberate strategy in the case of South Africa, other initiatives are also arising in many countries. South Africa Already actively engaged in additive manufacturing, in South Africa the Department of Science and Technology elaborated in 2016 the official strategy to address the future market opportunities and position the country as a global competitor in this field. The strategy represented the attempt to capitalize and optimize the development of this industry, showed by the growth in the number of 3D machines from 268 in 2011 to 3,500 by the end of 2015[7]. The South African government is also directly backing up specific projects. An example is Aeroswift, a collaboration between aviation manufacturing solutions provider Aerosud and the South African Council for Scientific and Industrial Research (CSIR), to build the world’s largest and fastest additive manufacturing system, to 3D print titanium aircraft parts from powder[8]. Currently, the country hosts 49 business operators that provide services in this field, including consulting and design service providers, material suppliers, technology suppliers and 3D printers[9]. Jewellery, tooling, and prototyping are the current main application areas, but many sectors are included in the government strategy: aerospace and military, medical and dental, traditional manufacturing (tooling, casting, refurbishment), automotive, materials development (titanium), and so on. Other Countries With its Industrial Acceleration Plan, the Kingdom of Morocco attracted the investments of Thales Group, who identified this country to be its global center of expertise for 3D printing and inaugurated its Industrial Competence Centre to develop and print complex metal parts for the aerospace sector[10]. General Electric, through its GE Garage program, opened permanent “garages” in Algeria and Nigeria, to provide skills training programs in advanced manufacturing technologies and support innovative local entrepreneurship. The garage in Lagos already delivered Elephab, a technological start-up initiative to prototype and 3D print locally replacement parts for various industries, that already received attention (and funding) from US venture capital funds[11] [12]. In Togo, an inventor realized the first 3D printer created entirely from recycled electronic waste, with the purpose of printing small objects like medical prostheses[13]. In Kenya, the African Centre for Technology Studies and the Kenyatta University are partnering for creating a center of 3D printing excellence[14]. Finally, Egypt, Tanzania, and other countries are observing a growing interest for this technology, with their most brilliant mind exploring its applications in a way that, if well-coordinated and backed, could significantly boost the competitiveness of their industrial sector. Antonio Pilogallo, Senior Associate at Infomineo. Sources: [1] https://www.futuremarketinsights.com/reports/middle-east-3d-printing-materials-market [2] https://3dprint.com/131629/uae-3d-printed-homes/ [3] https://www.mideastplast.com/news/dubai-a-promising-market-for-3d-printing/ [4] https://3dprint.com/111017/al-qassimi-hospital-3d-models/ [5] https://3dprint.com/126426/3d-printed-museum-office/ [6] http://uacciap.org/3d-printing-africas-way-lead-new-industrial-revolution-2/ [7] http://www.rapdasa.org/wp-content/uploads/2017/02/South-African-Additive-Manufacturing-Strategy.pdf [8] https://3dprint.com/166672/south-africa-aeroswift-project/ [9] http://www.rapdasa.org/members/ [10] http://www.mcinet.gov.ma/en/content/thales-launches-global-centre-expertise-morocco-specializing-metal-additive-manufacturing [11] http://www.3ders.org/articles/20161123-ge-opens-lagos-garage-new-home-for-nigerian-3d-printing-innovation.html [12] https://www.3ders.org/articles/20171004-nigerian-startup-elephab-aims-to-increase-local-manufacturing-with-3d-printing.html [13] http://observers.france24.com/en/20161110-togolese-invent-3d-printer-waste [14] https://3dprintingindustry.com/news/3d-printing-matters-africa-80862/

Outsourcing was not identified as a business strategy until 1989 and since then it has become a very common practice in many businesses. Typically, companies consider an outsourcing strategy for their support functions that are out of the company’s areas of expertise. Many of Infomineo's prospective clients that require ongoing access to research come to us asking about the cost-benefit of outsourcing their research to a specialized research provider versus developing or growing their in-house research capability. And while the answer usually depends on a specific business and their needs, below is a list of the top seven benefits that one gets when outsourcing their research function. Access to Talent and Capabilities Getting access to talent and research capabilities without needing to recruit or train individuals for the role is the most important driver for outsourcing research. In fact, relying on research providers gives access to new talent pools with local expertise such as language, technical know-how, and culture, as well as new resources. Strategic Benefit Business flexibility is a factor that is commonly taken into consideration as well. Outsourcing research enables companies to focus on core activities while they farm out non-core services that specialist companies can do better, allowing them to be all in on their competitive advantages. Risk-sharing Another benefit of outsourcing research is risk-sharing. Since both the company and the research provider will be accountable for the output delivered to the final client, it’s in the research provider’s best interest to deliver the highest level of research quality. Running Business 24X7 Offshore outsourcing to a country with a different time zone, gives the added advantage of making full use of a 24-hour day. Outsourcing partners can take over and continue work even after in-house employees go home. They can complete critical tasks and send it back for review the next morning. Staffing Flexibility Hiring full-time researchers can be very costly, especially if research needs are fluctuating. In this case, it is best to have a contract with a research provider, where the company can add and reduce research capacity according to its needs in different periods. Saving on Infrastructure and Technology Investing in infrastructure and subscribing to premium databases is very expensive, partnering with research provider divides these costs over several clients, giving each client exactly what they need at the fraction of the cost. Cost Savings Cutting down on costs is one of the major drivers behind companies leaning towards outsourcing research. By using lower cost platforms and leveraging their scale, outsourcers can generate savings while still making a margin. Yahia El Ghandour and Francisco Arenos, Researchers at Infomineo.

Back in 2009, I began working on a first assignment as a consultant in Morocco. For the past 8 years, I have not left the region, working in countries as diverse as Morocco, Egypt, Nigeria, Kenya, South Africa, Saudi Arabia and the United Arab Emirates. From many discussions with business people in the region only one point came up as a common issue across all countries: The ability to hire, train, manage and retain talented personnel. In many countries hiring and retaining talent is a major challenge given the scarcity of trained professionals, wage inflation, and heavy regulations on employing locals (like Saudization programs) or specific categories of population (like BEE in South Africa), resulting in high costs for the best resources and strong staff turnover due to opportunistic behaviour. Therefore, there is a strong incentive to focus these scarce and valuable resources where they make the most difference. Consulting - The value and limitations of the model As a complement to hiring, many companies and governments rely heavily on consulting, which is a thriving business in the region. As a former consultant, I am convinced of the high value of consultants to drive change, by bringing exceptional analytical skills, the ability to align organizations with best global practices and to put them under pressure to change. However, I have seen some misuse of consulting. For example, some clients said that an increased awareness about research services allowed them to better use consulting services, either by having a first data cut done to refine the priorities or when closing a project with a consulting firm and then rolling out the analyses with a research firm. Outsourcing to Regional Specialists - An effective way to access talent Through learning about the region and through travel I realised that, on one hand, there were large pockets of talent in countries where the demand for talent was not very large, like Egypt, Morocco or Kenya, resulting in high unemployment rates even for graduates, while on the other hand, there were countries where demand was far in excess of supply, like in Saudi Arabia or Nigeria, where both costs and staff turnover were high. I also realized that in these countries where the supply of talent was large there was a lack of managerial skills, making it very difficult for companies to tap into that talent pool. By starting and developing Infomineo, a company offering an outsourcing solution to the Middle East and Africa, we are trying to solve these issues. - We hire from the largest untapped talent pools in the region (Egypt, Morocco, Kenya), essentially creating an opportunity for organizations to access qualified professionals without the need to directly invest in those markets. - We train them to work with global standards of effectiveness, quality, and communication. By working with all the leading consultancies and 45 of the Fortune 500 companies we have been able to synthesize their best practices into an extremely effective inception program (one of our latest hires was qualified to start doing research for a major consultancy in 4 weeks while it takes 8 to 12 weeks to get to the same point with their internal training). The majority of our management team is composed of former consultants from McKinsey, BCG, Bain, A.T. Kearney, PWC etc, who disseminate their professional standards into the team. - We manage our teams as per global standards, with clearly set career tracks, training programs, or international mobility, giving them opportunities to grow at Infomineo with no ceiling to their careers. As a result, our staff turnover rate is very healthy for the countries in which we operate and the level of seniority of our staff, at 20% per annum (a majority of which are leaving during their trial period). - We offer our clients a retainer relationship model i.e. we guarantee permanent support with a high level of quality, without any disruptions to the service (we have backup team members, we are ISO certified which includes a continuity plan etc). Finally, because we are at scale, leverage low to medium cost platforms and operate in a lean manner, we are able to offer our services at a lower cost than if our clients were to develop the service themselves. Martin Tronquit, Managing Partner, Infomineo

Research Outsourcing Need-Assessment Process Outsourcing has emerged as a common approach to cutting down internal costs and driving core business growth by delegating non-core organizational activities to external partners who can handle them more effectively and efficiently. However, despite it's proven ability to lower costs and streamline internal processes, a large number of companies remain hesitant of outsourcing as an alternative to doing things themselves. According to Infomineo, among the main reasons why companies are reluctant to delegate non-core activities to external partners is because of their uncertainty of which tasks are best outsourced and because they are uncomfortable with the change it may cause on existing work processes. When taking a look at the case of outsourcing research and knowledge activities, companies also fear that the quality of work conducted by outsourcing partners would not be at par with local work. Before outsourcing research and knowledge capabilities, organizations need to start off by considering their internal environment and how an outsourcing partner would fit in. Organizations should also take note of the risks that might be faced and how they can be avoided by finding the best-fit research provider and establishing a well-organized outsourcing implementation process. A. Consider your organizational setting and assess the potential of an outsourcing relationship. An internal assessment of the creation, retainment or outsourcing of research capabilities is a key step in the decision process. As an organization, you will have to evaluate the position of research as part of your activities to decide whether it is a key element that ought to be realized in-house or if creating a long-term relationship with a research provider would provide higher benefits for the organization. B. Assess the level of risk that would be created through outsourcing research capabilities. The second factor to consider in the decision-making process is whether there would be a risk in establishing a relationship with a research provider for your organization. Your organization would have to evaluate the degree of control that it would be ready to hand over to an external partner and how it affects internal knowledge. Factors to take into consideration are the level of sensitivity of the information that the outsourcing provider would be exposed to and the level of involvement your organization would want to have with the outsourcing activities. C. Evaluate the outsourcing implementation process and assess its alignment with your organization’s goals and objectives. To establish an effective relationship with a research provider, your organization should make sure the outsourcing process aligns with its existing long-term goals and objectives. The assessment takes into consideration the level of importance research has within your organization. A strong part of establishing an effective implementation process includes addressing the type of relationship you wish to have with your outsourcing partner (long-term, short-term, dedicated, or need-based) and establishing effective methods to monitor the provider’s activity and assess their performance relative to your organizations set standards. D. Evaluate the outsourcing provider's fit towards your organization's research needs. Defining the goals you would like to achieve through an outsourcing relationship and listing the key challenges your organization fears to face will provide you with a criterion to evaluate outsourcing partners available on the market. Your evaluation will be based on how well-equipped the outsourcing partner is with addressing, managing and closing your gaps of concern. Questions to be considered Is research a part of my organization’s core competencies or peripheral activities? Do we have an in-house research expertise? If yes, do we have enough workload to develop or expand the existing research capability? If no, how much would it cost to create one? Does my organization need access to research on a short-term or long-term scheme? Is outsourcing cost-effective compared to in-house research services? Does loss of control through outsourcing affect the organization? Do internal stakeholders need to be part of the research process or are they result driven? Is it personal or sensitive data that is subject to legal protections? What is the reputational risk if there is some sort of breach? What are the business consequences if the services have an unexpected interruption? Can the goals for the outsourcing relationship clearly be defined? Are the goals for outsourcing in line with your organization's long-term goal? Can the outcome of the relationship be objectively measured? How would my organization be impacted if the goals and objectives of the relationship are not achieved? Has your organization had previous relationships with the provider? Does the provider procure added value to your organization? Does the provider have access to the right research databases and tools? Does the provider have access to the right knowledge and expertise? Is the provider working across the industries and regions that relate to my research needs?

If you do data research, you need to read this article! In my previous life, I was a consultant. I was focused on strategy work and therefore relied heavily on data to come up with fact-based recommendations for my clients. As a consultant, I also had first-hand exposure to the shift of companies run from a « follow the leader » approach to a « show me the facts » culture. I began looking in detail at how data research was conducted in corporations and consultancies and discovered many options executives were using to get data. Doing the research themselves was the most common strategy. My estimate is that any executive or consultant spends 20 to 30% of their time looking for data. While this might be beneficial as it allows a « first hand » grasp of the data there are several issues. First, research requires specialized skills such as the mastering of certain databases, Boolean search, or of interview techniques, which most executives lack. Second, research requires a great deal of time and focus, meaning either research is rushed or it is done when no other tasks are more urgent i.e. during the night. As a consultant, I did a lot of my research myself and was a poor researcher, killing my work-life balance for only average results. Today most companies still have most or all their research done by the same people who will use the data. I find it quite striking that many companies don’t have any research function or one limited to managing access to databases, as a legacy to a library function. It is also surprising that most of the big four companies, who try to compete for strategy consulting with the likes of McKinsey, BCG, and Bain, believe it is still useful training for their junior consultants to conduct the research entirely on their own, without even properly training them to do so. Only a few companies have developed proper research organizations. These companies have in most cases transformed their library function into a research function and have created awareness in their teams that the research function could execute research and not only provide access to sources. Their executives and consultants still execute research at 5-15% of their time but focus on time-critical research or on research that directly helps them understand the topic on which they are working. In these companies the research team is usually fairly large and specialized, often offering a combination of localized industry-focused resources and offshore generalist resources. Through this setup, these companies are able to develop a competitive edge through a stronger access to information and a good ability to disseminate knowledge, and are able to focus their resources on what they do best (procurement people on negotiation, not research, consultants on analysis, not research, salespeople on selling, not on data gathering…). However, developing this competitive edge does not come easy. I have seen many examples of companies failing to set-up their research organizations. The main reasons were An underestimation of the effort and time needed to set up the function: Writing job description, defining a career plan, hiring, training, subscribing to databases all require a large time investment from senior management, and take time (in our experience a minimum of 1 year is needed until the research team starts delivering) An underestimation of the cost. To the net salaries of the researchers one needs to add team management, support function time, office space and other facilities, and databases (a minimum of 200KUSD is needed for the basic databases), all this in a structurally high-cost structure. When companies assess their costs they generally conclude that the cost to deliver one hour of research is between 90 and 150€ in onshore locations and 50 to 80€ in offshore locations Errors in recruitment. Doing business research requires skills in secondary and primary research, data analysis, project management and a complete skill set in management (finance, marketing etc). I have seen many companies hiring either librarians or specialists of field research who, although a good addition to a research team, generally don’t have the full skill set required Since I established Infomineo, a company specialized in providing a research service, I have grown even more convinced of the value of outsourcing research services either as a complement to an internal team, which is then able to focus on the most value-added tasks, or as an alternative to setting up a research team from scratch. In fact, an outsourcing company focuses on one core skill set (in this case, research), benefits from scale effects and is capable of operating in a lean and cost-effective manner eventually addressing the challenges outlined above. It offers a turnkey research solution. A team can usually start in 2 weeks, takes less than 2 months to be fully up to speed (time to align with client) and guarantees a continuity of service through a retainer agreement in which the client subscribes to research capacity, meaning the service is guaranteed even if analysts fall sick, underperform or leave. Since it has scale and operates in a cost-effective way an outsourcer can offer, despite making a margin, a price (around 50€ an hour) which is lower than the full cost of delivering internally By its focus on research, an outsourcer will be able to hire and train their staff from scratch, providing them with the exact skill set needed to be excellent research analysts As to choosing a partner one needs to make sure that the researcher will adopt a consultative approach, challenging the client at two levels: Understanding the point the client wants to make and proposing alternatives if an easier to get or higher quality set of data could answer the question; Proposing the most effective research approach, including if it goes against the initial thinking of the client. Martin Tronquit, Managing Partner, Infomineo

PwC South Africa released the seventh edition of its annual Africa oil and gas review, reporting on the activity and developments of the industry on the continent. The review outlines the main challenges faced by the oil & gas businesses, identifies hurdles to their growth, analyses the companies’ strategic focus in overcoming those challenges, and provides recommendations on how to achieve sustainable growth. The insights are based on the results of primary research conducted by research service provider Infomineo, totalizing 79 responses from international oil companies, national oil companies, oilfield service providers, independent oil companies and other industry stakeholders, across 11 countries[1] over the continent. The top five challenges faced by oil & gas businesses in Africa remain almost unchanged from previous years. For the fourth consecutive year, uncertain regulatory frameworks are seen as the most important challenge facing the industry; showing the persistent difficulties in designing effective regulations. Corruption moved from third to second place this year raising doubts about the effectiveness of the already implemented anti-corruption programs. Financing costs emerged as the third most pressing challenge in this year’s survey. According to the review, this is probably due to the overall regional issues and uncertainties prevalent in the continent (political issues, economic crises…), pushing financial institutions to wary of when funding projects that seem destined to bite off more than they can chew. Foreign currency volatility has also been an important challenge, especially for countries like Nigeria whose currency lost about a third of its value against the dollar in 2016. Finally, the taxation requirements’ uplift in the ranking is due to the move of the other challenges but makes it clear that heavy taxation becomes a burden for oil & gas companies. Another important concern addressed in the review are the hurdles to businesses’ growth. The survey emphasizes obstacles such as low investment in the development of capabilities (factories and others), a weak or incoherent strategy, weak leadership, and a strategy that is not reflected in the day-to-day business as highlighted by many of the survey respondents. Indeed, strategies are very often not precisely defined which is problematic. According to the survey, 75% of the participants mentioned that they have reviewed their Africa strategy in the last three years to confirm its adequacy. However, they also admitted that there are persistent incoherencies with the execution of the day-to-day business. Facing all these challenges, companies are focusing on a specific set of strategic improvements. The survey results show that oil & gas companies in Africa focus mainly on operational excellence, restructuring or creating new organizational designs, capital expenditure and expansion, regulatory and environmental compliance, and technology infrastructures. Moreover, the survey results point out that for a strategic growth, African oil & gas businesses should focus on repositioning their portfolios and focus on the upcoming sustainability trends by pursuing more low-carbon activities than what is currently the case (these activities are considered to be less harmful to the environment than the current prevalent oil & gas extractions). A way to achieve this portfolio repositioning is throughout the development mergers and acquisitions deals and partnerships. These particular adjustments are inspired by the changes either anticipated or experienced by the businesses in their competitive environments. The most expressed ones being the move to alternative fuels, the regulation’s impact, cost reductions, and technology-driven disruptions. Operating in a competitive environment, oil & gas companies are looking to achieve a sustainable growth. The use of disruptive technology is undoubtedly helping regarding that. Survey respondents stated that they implemented digital solutions (22%) and drones (4%) in their processes to surpass their competitors. However, the rise of new technology in the oil & gas industry led to the rise of new threats in the realm of cybersecurity. According to John Chambers, former CEO of Cisco Systems, “There are two types of companies: those that have been hacked, and those who don’t know they have been hacked.” Initiatives should thus be led to warrant the African oil & gas businesses’ security. The Africa oil and gas review describes the landscape of the industry in Africa and addresses the challenges faced and strategies implemented by businesses all over the continent. Given the gathered insights, PwC recommends oil & gas businesses to improve the current state of their industry, by not only focusing on catching up with the rest of the world; but by ‘learning to leapfrog’, using disruptive technologies and spearheading innovations to surpass the specific challenges of the African continent and to propel the industry’s and their businesses’ growth. Hinde Adjar, Analyst at Infomineo [1] Nigeria, SA, Ivory Coast, Gabon, Tanzania, Ghana, Uganda, Mozambique, Kenya, Chad, and Cameroon

Knowledge and research functions are crucial within a consulting business model and with their growing footprint internationally, strategy consulting firms are placing much thought into how they are organizing these function within their organization. In response to the high demand for quality research, knowledge and research functions are taking on more of an analytical role within a consulting organization. The tasks that knowledge and research professionals are performing are transitioning from a closed library model into a more open value-added research model. In parallel to this transition, consulting organizations are opting to disperse their research and knowledge teams globally by investing in offshore and research centers. These trends are based on Infomineo’s most recent benchmark on research and knowledge support in strategy consulting firms, including seven of the biggest strategy consulting firms, namely McKinsey & Company, The Boston Consulting Group, Booz Allen Hamilton, Bain & Company, A.T. Kearney, Oliver Wyman and Roland Berger. The report revealed that McKinsey is placing the highest level of investment in their research and knowledge (R&K) support function, with roughly 1,605 R&K professionals supporting the organization, with a ratio of 10.8 R&K professionals to every 100 consultants. BCG holds the second highest ratio of 5.3 R&K professionals to every 100 consultants with 549 personnel in R&K roles. The other four consultancies benchmarked have a ratio that ranges from 2.3-4 R&K professionals to every 100 consultants. As the level of investment in research and knowledge functions increases, consultancies are choosing to increase their R&K coverage globally by investing in offshore locations. McKinsey ranks highest in terms of the level of offshore research clusters with 46% of their R&K function located in offshore locations, mainly in four knowledge centers distributed in USA, India, Poland and Costa Rica. Oliver Wyman is a close second, with 41% of their R&K function located in offshore locations. On the other hand, Roland Berger and Booz Allen choose to locate their R&K support functions within their central offices, with only 14% and 5% respectively located in offshore locations. "Leading organizations structure their research functions through three tiers - onshore operations, offshore operations and use of outsourcing partners. This offshoring and outsourcing strategy allows them to benefit from scale effects, leveraging lower cost and more specialized resources." - Martin Tronquit, Managing Partner, Infomineo. The benchmark highlights another interesting phenomenon regarding the type of profiles these R&K support functions consist of. Based on the LinkedIn profiles reviewed for the purpose of this benchmark, there are generally two types of profiles within R&K functions - librarians and analysts. Librarians typically hold degrees in linguistics, history, and journalism while analysts have backgrounds in subjects that are more business orientated such as management, business administration, and economics. Past experience and current tasks performed are also different with analysts holding responsibilities that require more analytical skills and spending less time in gathering and organizing data. Based on the benchmark findings and feedback from consultants, consulting firms seem to be shifting the roles of their R&K functions from hiring librarian profiles to hiring analysts. This trend was noticed in all the benchmarked consultancies although some still have a considerable percentage of librarians in their R&K teams. Bain and Oliver Wyman currently hold the highest level of librarian profiles within the R&K functions with an average of 22% of librarians in their R&K teams. Yahia El Ghandour, Associate at Infomineo.
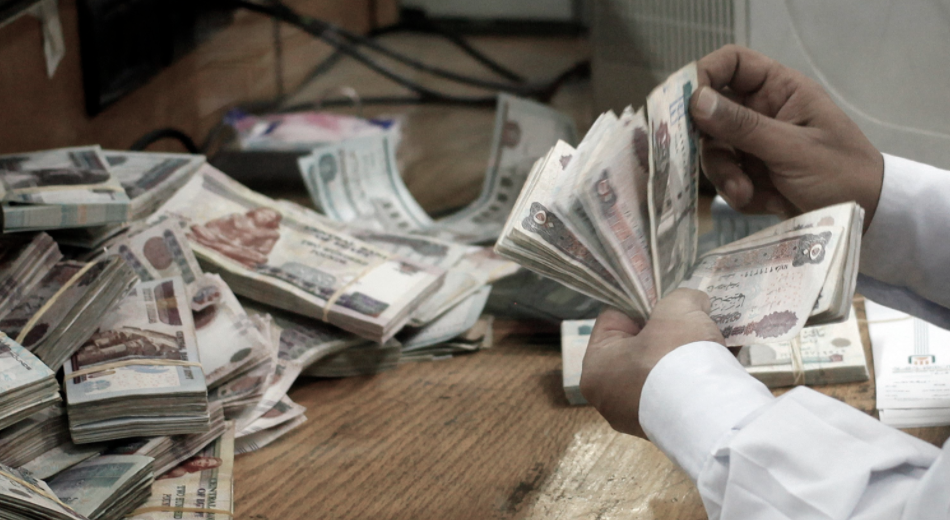
Over one year ago, on November 3rd, 2016, the Central Bank of Egypt floated the Egyptian pound in an attempt to stabilize the economy which had been set back by a shortage of foreign currency inflows and political instability. Among the key goals behind the floatation was to meet one of the key demands of the IMF to secure a $12bn loan, boost external competitiveness through a weaker currency, encourage foreign investors back to the country through a more transparent economy and to end the currency black market which was trading at double the price set by the CBE at the time of floatation [1] [2]. To assess whether the goals behind the floatation have proved to be successful this past year, we must look back to the situation that led to the decision. The government had attempted to float the pound several times prior to the 2016 floatation. In 2003, the government partially floated the pound to decrease in value against USD from EGP 3.85 to EGP 6.86 while being traded at EGP 7 to USD in the black market. The floatation decision in 2003 resulted in an increase in exports from $7.1bnin the 2001-2 Fiscal Year, to $10.4bn in 2003-4. Inflation increased from 2.9% in January 2003 to 17.3% in December 2004. Based on a 2007 World Bank study on the impact of the devaluation of the pound between 2000 and 2005, there was a decline in the consumption of Egyptian families to an average rate of 7.4 percent, leading to a 5.1 percent increase in the number of poor families, from 16.7 percent to 21.8 percent [3] [4]. Sources of Foreign Currency to Egypt in 2014 and 2015 In 2011, the Egyptian economy, still recovering from the 2008 world financial crisis, was also hit by political instability that also contributed to the decrease of foreign currencies inflows [1]. [visualizer id="3914"] Exports Exports, which is one of the main sources of foreign currency, decreased from $26.3bn and $31.5bn in 2010 and 2011 to $21.9bn and $22.5bn in 2015 and 2016 [5]. Remittances Lower oil prices and the fall in economic growth in the Gulf also indirectly had a negative impact on the Egyptian economy since many companies were laying off employees, of which many were Egyptians. This resulted in a drop in total remittances into Egypt of about 15% year-over-year in May 2016 [1] [2]. Tourism The tourism sector, a major source of foreign currencies before the 2011 revolution, was severely hit after a sequence of terrorist attacks in Egypt. The biggest hit was on October 31, 2015, when the Russian Airbus A321 was hit over Sinai peninsula shortly after takeoff from Sharm El-Sheikh killing the 224 passengers on board resulting in several countries suspending their tourism inflows to Egypt [6]. Suez Canal Fees Suez Canal, the fastest shipping route between Europe and Asia and one of Egypt’s main sources of foreign currency was not an exception to the slowdown that faced the other sources of foreign currencies. Despite the completion of the ambitious $8.2bn parallel canal in August 2015 with a goal to increase revenues to $13.4bn in 2023 from $5.5bn in 2014, revenues have been decreasing since the opening of the new canal affected by a slowdown in the global economy. Annual revenue of the canal totaled to $5.2bn in 2015 and declined by 3.2% to $5bn in 2016. In July 2017, canal revenue reached $2.9bn. Based on these figures, the $13.4bn revenue goal by 2023 is highly unlikely [7] [8] [9]. Foreign Direct Investments Before the floatation decision on November 2016, the government tried several economic reforms which proved to have temporary effects because they did not tackle the main problems but rather reduced the severity of their effects. During the months that preceded the floatation, the CBE put a cap on the amount of dollars businesses or individuals can withdraw to ease the pressure on bank reserves. The cap included a maximum of $1,000 for travelers providing valid visa and flight tickets, $3,500 per month for travelers using their credit cards abroad and $50,000 to $250,000 for businesses to cover basic imports, given that banks had the right to determine the amount based on the necessity of the imported goods [10] [11] [12]. This step had several impacts on the economy and society. First, it reduced the pressure on bank foreign reserves as banks already had unmet commercial demand for dollars estimated at around $8bn to $10bn by the time of devaluation but it also flourished the currency black market where individuals and businesses resorted to cover their dollar needs that banks could not provide [1]. While this step was seen by many as one of the main reasons behind the expansion of the black market, this step led prices to increase gradually in the months that preceded the devaluation because most businesses priced their products according to the value of dollars they import with, which was mostly obtained through the black market as 90 percent of imported consumer goods were already being paid for at black market currency rates in the months before the devaluation [13]. EGP to USD Exchange Rates (2010-2017) By that time, the devaluation prices were already adjusted/adjusting to the price of the black market which was around the same price after the devaluation. So, at the floatation period, prices increased but not by the same value the pound depreciated. Single reform proved inefficient in the past so parallel to the floatation decision, the Egyptian government took several measures to ensure the success of its wider economic reform program. CBE hiked interest rates by 300 basis points to limit the inflation that's likely to follow the weaker currency [1]. Agreed reforms with the IMF include increasing the government’s income from tax sources via the implementation of the Value Added Tax (VAT) and introducing a law to speed up the resolution of tax disputes and settlements, and in view of a different structure of progressive salary tax rates [2]. Central Bank of Egypt Interest Rates (2009 - 2017) The government also began to restructure its subsidy program. A five-year energy subsidy reform program began in 2014 aiming at stopping energy subsidies by 2019. Electricity prices increased by 25-40% depending on usage in August 2016 [2] [10]. In July 2017, Electricity prices increased again by 15-42% for domestic use and by 29-46% for the commercial Sector [14]. Fuel prices increased 2 times since floatation [15]. The government is moving into a cash-based subsidy system, where the less fortunate get their subsidies in cash, rather than subsidizing food commodities and fuel for all [2]. In addition, an infrastructure intensive works policy were launched such as the construction of a new $45bn administrative capital [16], the construction of the third metro line in Cairo, the expansion of the port of Sokhna and the renovation of the rail and road network, which offers numerous investment opportunities to foreign companies [2]. A new investment law was also passed to attract more foreign investors. According to the new law, investors have the right to finance the project from abroad in foreign currency and are entitled to derive profits, transfer profits abroad, or liquidate the project and transfer the output of liquidation abroad [17]. Foreign employees of investment companies have the right to transfer their compensation abroad. Investors can also recoup half of what they pay to acquire land for industrial projects if production begins within two years and have a 50% tax discount on investments made in underdeveloped areas [18]. Post-Devaluation Right after the devaluation decision, the Egyptian stocks soared, with the country's main stock index, the EGX30, rising by about 8% [1]. In less than a week, EGX30 hit a five-year high. Foreign investors and institutions, including Gulf-based investors, were on the buying side, only local investors were sellers. This was a quick and strong sign of a renewed confidence that international and regional investors have in Egypt’s economy [2]. Egypt's Inflation Rates (2011-2017) Corporate executives claimed they will be able to make investment decisions based on a transparent, predictable currency market run by banks, rather than an opaque black market in dollars that swung wildly amid profiteering and speculation. “Before, I used to say we were moving in the dark. We couldn’t see because the situation was so blurred. Now at least we have the lights turned on,” Hani Berzi, chairman of Edita Food Industries [13]. Furthermore, the CBE approved commercial banks to sell USD to clients looking to repatriate profits. Whilst the effect of this decision on the stock market was optimistic, businesses with M&A transactions in the pipeline have been in a better situation as a foreign investor who was not willing to bring money into the country with no guarantee of getting their profits out, are now more comfortable investing in Egypt [2]. Egypt's Foreign Reserves (2011-2017) On the other hand, a percentage of Egypt’s population moved below the poverty line overnight following the EGP floatation [2], the devaluation ate into the incomes of many Egyptians, seeing their savings divided by half overnight. Among the middle classes, travel abroad has become harder, students saving to study overseas, and luxury goods became unaffordable for many. “We are now calling it Black Thursday,” one Egyptian said referring to the devaluation day [13]. One Year Later One year after the floatation, “Egypt is in a better place than last year,” says Chris Jarvis, the IMF mission chief for Egypt. “I think they have already taken the most difficult steps on the macroeconomic level and what remains is to continue [with the reforms]. But it doesn’t involve a lot of big adjustments, certainly not over the next few months.” As foreign inflows have increased, and remittances have picked up, foreign reserves have increased from $19bn in October 2016 to $32bn at the end of November 2017 [19]. According to the Global Competitive Index 2017-2018, Egypt is the most-improved country in the Middle East and North Africa compared to the previous year ranking. Egypt ranked 100 out of 137 in GCI 2017-2018 compared to 115 out of 138 in GCI 2016-2017 [20]. However, for Egyptian businessmen, the resolution of one problem has triggered a new set of challenges: soaring inflation and rising borrowing costs. These issues are causing some companies to put their expansion plans on hold. Firms that have foreign currency debt have been left exposed after the pound lost half its value after its flotation. Manufacturers who rely on imported inputs have seen their working capital fall by as much as half. Inflation running at around 30 percent has also hit the buying power of customers. “People are borrowing for working capital, but the risk does not justify a long-term capital investment. You have to be making sustainable profits in the order of 30 to 35% in order to take loans at 22 to 24%,” Omar al-Shenety, Managing Director of Multiples Group, a private equity firm and investment bank [19]. Egypt has become a more affordable destination than before, as a travel or investment destination, both should lead to an inflow of foreign currency and Foreign Direct Investment (FDI) into the market and increased economic activities. However, there is a time lag, as investors will only start coming once they feel that the USD: EGP rate has reached stability and that the speculation/high volatility periods are unlikely to occur again. The country is now well positioned to compete in global markets. Egypt's exports should continue increasing as it is now able to offer a more competitively priced product amidst global competition. There is good potential for local manufacturers to seize the opportunity of the current high cost of imports, by offering competitive, and more affordable locally produced products. Companies can now benefit from the free float as forex losses will now be recognized by the tax authority [2]. The low cost of labor is creating jobs, especially for young people with digital technology and foreign language skills. Customer service giant Teleperformance, which fields calls for corporates like Expedia and Vodafone, has shifted jobs from Greece to Cairo, where wages are as much as 60% less than in Europe. Uber’s general manager in Egypt said “Things are moving in the right direction. In less than two years we have hired 50,000 drivers. Necessary changes that should have happened years ago are finally happening. This is the time to put the perfect platform in place and lay the groundwork for future growth in Egypt” [21]. The IMF foresees a series of improvements in the coming years. For starters, real GDP is likely to increase from EGP 1,995bn in 2017 to EGP 2,607bn in 2022. Real GDP per capita is likely to increase from EGP 21,628 in 2017 to EGP 25,218. The total investments as a percentage of GDP are likely to increase from 15.6% in 2017 to 20.1% in 2022. Inflation is likely to decrease from 23.5% in 2017 to 7% in 2022. Unemployment rates are likely to decrease from 12.2% in 2017 to 5.3% in 2022. Government revenues are likely to increase from EGP 748bn in 2017 to EGP 1,678bn in 2022. All these metrics are positive forecasts for the future of Egypt. However, the question that remains is will these macro improvements enrich the lives of Egyptians? Will wage inflation be able to catch up with the price inflation anytime soon? For that, only time will tell. Ahmed Khalil and Yahia El Ghandour, Associates at Infomineo. Sources: [1] Egypt just massively devalued its currency — here's what happens next [2] The EGP Devaluation: A new beginning [3] A look at the last time Egypt floated the pound in 2003 [4] The Welfare Effects of a Large Depreciation: The Case of Egypt 2000-2005 [5] Trade Map [6] CHRONOLOGY OF ATTACKS on TOURIST TARGETS IN EGYPT: a DETAILED HISTORY from 1992 to the PRESENT. [7] Egypt's Suez Canal revenues 'driven down by slowing global economy' [8] New Suez Canal income slowly sinking [9] Egypt's Suez Canal revenues jump to $446.3 million in July: Reuters calculations [10] Al-Arabia [11] Al Youm 7 [12] Al Badel [13] Egypt to face pain before gain after massive currency devaluation [14] BBC Arabic [15] The Fuel Prices [16] Egypt plans to build new administrative capital east of Cairo [17] Egypt enacts new investment law to promote foreign investments [18] Egypt's New Investment Law: Opening Egypt for Business [19] Financial Times [20] The Global Competitiveness Report 2017–2018 [21] Like a phoenix, Egypt economy is rising from ashes [22] IMF

Digitalization, a term commonly confused with digitization, is currently a burgeoning phenomenon and the rise of the fourth industrial revolution has a lot to do with that. According to Gartner’s IT Glossary, digitalization is the use of digital technologies to change a business model and provide new revenue and value-producing opportunities [1], whereas, digitization is the process of changing from analog to digital form. It is undeniable that it is the time of an unquestionably global digitalization trend, and Africa has not escaped from it. The African economy has been booming since the early 2000s with a growth that counts on the impact of the most recent industrial revolution to foster digital innovations such as cloud computing and data analysis technologies [2]. This time, Africa is about to benefit from the technological revolution’s opportunities to pursue its development by driving inclusive prosperity [3]. The digitalization opportunity for Africa “If governments and the private sector continue to build the right foundations, the Internet could transform sectors as diverse as agriculture, retail, and healthcare— and contribute as much as $300 billion a year to Africa’s GDP by 2025” (McKinsey Global Institute’s (MGI) “Lions go digital” report)[4]. This statement makes it clear the digitalization process in Africa, if boosted by internet use, could impact African countries and their GDPs as it previously did with BRICS (a contribution that went up to 10%), with potential impacts on areas such as financial services, education, health, retail, agriculture, and government [5]. The digitalization of financial services will allow for the financial inclusion of a large majority of populations who do not hold bank accounts and will ultimately bridge people in remote areas with financial and banking services. In regard to education, better content for students and better training for teachers will be provided if affordable tablets and e-books are leveraged. In terms of the health sector, the use of the internet will reduce the time and costs to access health services and contribute to providing a better-quality service. Regarding the retail sector, the use of e-commerce will allow Africa’s growing middle class to have access to new consuming experiences through more choices with better quality. Moreover, it will provide SMEs and entrepreneurs with access to a larger customer circle. In agriculture, the outputs will be more efficient with internet bringing specialized and needed information for farmers such as data about the weather, about crops and others. Finally, for governments, allowing access to information and improving transparency are two of the benefits internet can bring; and this will undoubtedly impact societies. Victoria A. Espinel, President and CEO of BSA, The Software Alliance, and co-chair of the Global Future Council on the Digital Economy and Society, ensures that there are clear benefits from the digitalization of economies. In an interview with the World Economic Forum for the Annual Meeting of the Global Future Councils in 2016, she assures that the digital trend that is benefitting from the use of mobile data, could help in tracking dangerous diseases like malaria, or reducing fuel emissions with the development of new and more efficient cars for example [6]. The Digital Focus Points needed for Africa Africa is undoubtedly benefiting from digitalization but where does it stand in the digitalized world and what tools should be leveraged to make the changes and the future positive impact possible? According to the African Digital Maturity report, the level of digital maturity is different from one African country to another (Siemens 2017) [7]. The report showcases the assessment of the digital maturity of several African countries, highlighting valuable insights on the state of digitalization in the continent. Countries were classified as emerging, developing, established and advanced in their level of digitalization, and the analysis revealed several important facts. The first being that Africa is a diverse continent, hosting countries with different markets and disparate economies. Each country has specific patterns and levels of digital readiness or literacy. The report also highlights that disruption can be a means of development for Africa. While disruptive technologies are disturbing the occidental business models, they also spur African development. Governments should take the initiative to leverage past experiences in order to benefit from synergies between the processes of large mature organizations and the smaller digitally-oriented ones in order to improve the African digital framework. The success of digital mostly depends on the fertility of the macro-environment since several macroeconomic factors impact the ability to adopt digital. Another important matter for the African digitalization process is globalization. Businesses should be conducted according to both local and global considerations. This means that they should adapt to the local specificities and challenges of each of the African countries. Finally, raising awareness on the true definition of the concept of digitalization is to be carried out. Several African companies defined digitalization differently because of the prevalent confusion around the notion. As mentioned in the beginning of the article, there is a difference between digitization and digitalization. Understanding the differences between the two notions is important in leading the way to a better digital adoption in the continent. Indeed, assessing and understanding one’s digital abilities is a necessity to implement transformative solutions that will lead to effective digital transformation. The hype around the digital era is, therefore, a reason and this revolution will surely contribute to noticeable and necessary changes. However, several factors should be leveraged to make these changes a reality. Besides, the continent’s specificities should be kept in mind for a digitalized future that will positively impact not only targeted stakeholders but all the different ones involved all over the continent [8]. Hinde Adjar, Analyst at Infomineo. Sources [1] http://www.gartner.com/it-glossary/ [2] https://talent2africa.com/en/5-advantages-of-digitalization-in-africa/ [3] McKinsey Global Institute’s (MGI) “Lions go digital” report [4] McKinsey Global Institute’s (MGI) “Lions go digital” report [5] McKinsey Global Institute’s (MGI) “Lions go digital” report [6] https://www.weforum.org/agenda/2016/11/the-digital-economy-what-is-it-and-how-will-it-transform-our-lives/ [7] https://www.scribd.com/document/356460304/Digitalization-Maturity-Report-2017 [8] https://www.scribd.com/document/356460304/Digitalization-Maturity-Report-2017

Experiences from Oman’s Miraah power plant Over the last decade, due to its maturing oil fields and limited reserves, Oman's domestic crude oil production relied heavily on Enhanced Oil Recovery (EOR) methods. Just as in Oman, most of the global oil production comes from mature or maturing fields with an average recovery factor of around 30 to 35 percent. Since 50 to 70 percent of the oil hasn't been recovered, maturing oil reservoirs possess enormous potential. In previous years, production through the three main EOR methods, thermal recovery, gas injection, and chemical injection, was about 3 million barrels per day (b/d) or 3.5 percent of the world crude oil production per day (Gregory, Omom, and Greil 2014: 16). Of these 3 million b/d, 66 percent were produced through thermal recovery (Kokal and Al-Kaabi 2010: 1). In general, the process of recovering oil is broken down into three different phases: primary, secondary, and tertiary recovery. Source: Gregory, Omom, and Greil 2014: 14 Primary and secondary recovery are considered conventional recovery and target the mobile oil in the reservoir, whereas tertiary recovery targets immobile oil which cannot be recovered due to capillary and vicious forces. Tertiary oil recovery, referred to as EOR, relates to the injection of gases, steam, oxygen, air, polymer solutions, gels, surfactant-polymer-formations, alkaline-surfactant-polymer formations, or microorganism formations into the reservoir, as these fluids reduce the viscosity and thereby enhance the flow of oil (Gregory, Omom, and Greil 2014: 14). While steam injection is the preferred EOR method, especially for heavy crude[1] with a high viscosity, there are different ways of how to produce the necessary steam. In the conventional steam injection method, natural gas is burned to produce steam from boiling water. The Concentrating Solar Power (CSP) technology merely replaces natural gas with solar power. Petroleum Development Oman (PDO)[2], the major exploration company in the Sultanate, was fighting declining oil output from its maturing reservoirs with the enhanced usage of steam injection produced with natural gas. However, it became gradually more difficult for the country to satisfy the growing domestic demand, driven by the need for gas in generating power and the development of other industries (Sergie and Dipaola 2015). To limit the quantity of imported gas, the Omani government together with its partners, Shell and Total, decided to invest $600 million in the construction of the Miraah - Arabic for a mirror - solar power plant. Located at the Amal West oil field in the southern part of Oman, the 1,021 MW solar-thermal facility could save up to 5.6 trillion btu, enough to provide 209 000 Omanis, 5 percent of the country’s population, with electricity (Kantchev 2015; Kramer 2017). Steam generated from the CSP technology has the same quality and temperature as the one generated from gas and resembles a perfect substitute. The solar technology used at the Miraah power plant does not use solar panels but large, curved mirrors which automatically track the sun throughout the day, concentrate the sunlight on a pipe filled with water, bring it to boil, and thereby produce high-pressure steam. Upon the successful completion of a 7-MW pilot project in 2013, the company GlassPoint started construction on the Miraah plant in 2015 (Renewable Now 2017). The American company pioneered an enclosed trough system which is particularly suited to transport the CSP technology from the arid region of southern California to the desert environment of the Arabian Peninsula. Setting up the solar mirrors inside a greenhouse results in three major advantages: reducing costs, achieving high energy density, and protecting sensitive technology. To avoid soaring custom project costs, GlassPoint builds its solar fields in glasshouse blocks using a series of standardized steps, where the majority of the system is comprised of prefabricated components that can be easily assembled onsite. Routinized constructions steps not only improve the speed of deployment, but by doing so also drive down the costs of construction. This point was validated on November 1st, 2017, when PDO and GlassPoint announced that the first out of 36 blocks that constitute the solar plant was completed on time and on budget (PDO 2017). Standardized construction measures as well as the availability to fall back on lower-cost material thanks to the protection offered by the glasshouse, drastically decreases the production costs. Furthermore, the straight surface of the greenhouse positively affects operating costs as it allows for easy cleaning by a robotic system, compared to a slightly more complicated cleaning process for the curved mirrors. Source: Operating CSP in Desert Conditions, Glasspoint The second advantage of the enclosed troughs is that the glasshouse blocks provide high energy density as 93 percent of the land area can be covered with mirrors. Since the materials used in an enclosed trough can be low-cost, it is more cost-efficient to pack the collectors tightly together into a smaller space (GlassPoint 2017: Standard Block). The additional energy generated during peak sun hours, when the sun is high in the sky, far exceed any losses from shading caused by neighboring mirrors during the low sun hours. Achieving high energy density is crucial for EOR applications because steam needs to be produced close to the oil field so that it travels the shortest distance. Without the protection offered by the glasshouse, sand and dust storms, common phenomena in the deserts of the Middle East, would decrease the efficiency of the mirrors through soiling. Because the glasshouse has a height of 6 meters above the ground, soiling rates are 50 percent less compared to objects that are merely 1 meter above the ground (GlassPoint 2017: Sealed from Dust). The glasshouse also prevents damages to the mirrors and other delicate components of the system caused by sand, wind, and humidity. The Miraah solar plant could produce up to 80 percent of the steam that is needed for the EOR (Power Technology). This would allow Oman to free up natural gas currently utilized for EOR and use it in other parts of its economy. Furthermore, substituting natural gas with solar steam would remove the largest and most volatile cost of thermal EOR: the price of gas. Even though a certain amount of gas would still be required to maintain steam injection at night, CSP has the potential to drive down the quantity of natural gas needed in producing steam. With a stabilized oil price in the range of $55 to $65 and an increasing demand for the use of natural gas in other parts the economy, the capital-intensive investment needed for CSP is becoming more attractive. Yet, the spread of the technology will also depend on the success of and insights from the Miraah power plant. As GlassPoint continues construction on time and on budget, national and international oil companies trying to increase the recovery rate of maturing fields might consider substituting natural gas for solar energy. [1] The viscosity resembles a particular attribute that defines the quality of crude oil and is expressed in API (American Petroleum Institute) gravity. An API of 40 and higher resembles low viscosity and stands for high-quality crude oil. Due to its increased mobility (fluidity), reservoirs containing light crude reach a higher recovery factor at a lower average cost, while at the same time light crude reaches higher prices on the world market as it requires a lower quantity of energy during the refinement process. Heavy crude on the other side, with an API below 20, is very thick and therefore immobile. Contrary to light crude, recovery costs for heavy crude are higher and the prices exporters obtain on the world market significantly lower as more energy is required for refinement. Thermal EOR methods for heavy crude become economically justifiable once the oil price reaches a certain level. [2] Owned to 60 percent by the Omani government, 34 percent Shell, 4 percent Total, and 2 percent PATEX. Kevin Matthees, Senior Analyst at Infomineo. References GlassPoint. 2017. “Sealed from dust.” Technology. https://www.glasspoint.com/technology/sealed-from-dust/. ---. 2017. “Standard Block.” Technology. https://www.glasspoint.com/technology/standard-block/. Gregory, Mark, David Omom, and Pierre-Alexandre Greil. 2014. “Solar Enhanced oil recovery. An in-country value assessment for Oman.” Ernst&Young. January. http://www.ey.com/Publication/vwLUAssets/EY-Solar-enhanced-oil-recovery-in-Oman-January-2014/$FILE/EY-Solar-enhanced-oil-recovery-in-Oman-January-2014.pdf. Kantchev, Georgi. 2015. “Oman to Build Giant Solar Plant to Extract Oil” Washington Post, 8 July. Kokal, Sunil and Abdulaziz Al-Kaabi. 2010. “Enhanced oil recovery: challenges and opportunities.” EXPEC Advanced Research Centre. Saudi Aramco. http://www.world-petroleum.org/docs/docs/publications/2010yearbook/P64-69_Kokal-Al_Kaabi.pdf. Kramer, Susan. 2017. “Solar EOR a Big Win for GlassPoint.” SolarPACES. July 3. http://www.solarpaces.org/glasspoint-solar-eor-miraah-start-august/. Petroleum Development Oman. 2017. “Miraah Solar Plant Delivers First Steam to Amal West Oilfield.” Press Release. November 1. http://www.pdo.co.om/en/news/press-releases/Pages/Miraah%20Solar%20Plant%20Delivers%20First%20Steam%20to%20Amal%20West%20Oilfield.aspx. Power Technology. Unknown. “Mirah Solar Thermal Project.” http://www.power-technology.com/projects/miraah-solar-thermal-project/. Renewables Now. 2017. “Miraah solar thermal plantin Oman delivers 1st steam for EOR.” November1. https://renewablesnow.com/news/miraah-solar-thermal-plant-in-oman-delivers-1st-steam-for-eor-589407/. Sergie, Mohammed, and Anthony Dipaola. 2015. “Oman said to consider LNG imports as domestic gas use surges.” Bloomberg. August 30. https://www.bloomberg.com/news/articles/2015-08-30/oman-said-to-consider-importing-lng-as-domestic-gas-use-surges. https://www.glasspoint.com/technology/integration/ https://www.glasspoint.com/technology/sealed-from-dust/
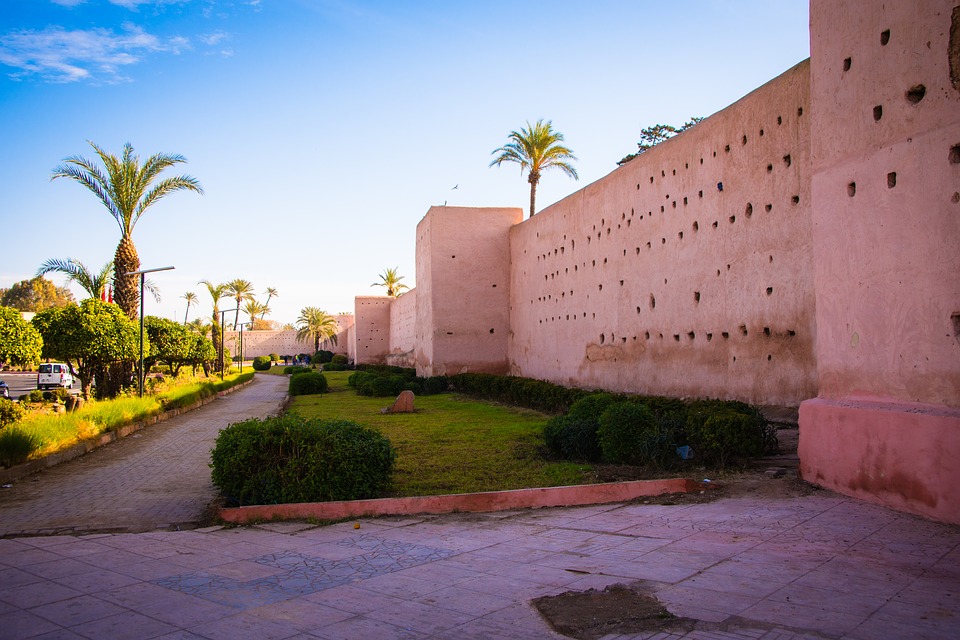
Travel and Tourism Growth in Northern Africa Sharing the same Mediterranean coast, ethnic cultural and linguistic identity, the North African region - comprising of Morocco, Egypt, Libya, Tunisia, Algeria, and Sudan, - have been experiencing novel growth dynamics in the field of travel and tourism. Half of the North African region, namely Egypt, Libya, and Tunisia, have been greatly affected by political instability and their repercussions. Along with this, the oil price crisis in the Middle East led to a slow down in a number of projects intended to spur tourism in the countries. However, despite these complications, North Africa is forecasted to be a major touristic destination in comparison to other regions in the Middle East and Africa. The above-mentioned countries are seeking new real-estate investments and infrastructure developments in the hospitality and tourism sector reaching an average of USD 2.3bn in 2016 compared to the world average USD 4.4bn. In Egypt, travel and tourism investments have reached USD 4.6bn accounting for 11.9% of total investment. It is forecasted to grow on average of 6.4% reaching USD 9.3bn in the next ten years. Morocco has reported a value of USD 4.1bn for its travel and tourism investments followed by Tunisia USD 0.8bn and Sudan USD 0.4bn, according to the World Travel & Tourism Council 2017 Report. In addition to this, the North African region saw an increase of 5.4% in hotel occupancy. Morocco promises the most prospective future in the North African region with the increased tourist demand which is positively correlated to growth in the real estate and hospitality sectors. It is the top performing country in the North African region and third in Africa. Based on the Travel and Tourism Competitiveness Index in 2017, Morocco is ranking 65, followed by Egypt at 74, Tunisia at 87, and Algeria at 118 out of 136. They aim to be one of the top 20 world tourist destinations by 2020. In 2016, Morocco had contributed to 8.1% of travel and tourism’s direct to GDP followed by Tunisia 6.6%, Egypt 3.2%, and Sudan 2.5%. Cumulatively, the North Africa region is contributing about 4.4% of Travel & Tourism’s Direct to GDP. However, Libya doesn’t depend on Tourism & Travel as a revenue generation tool for the country. As employment is considered to be another indicator that assesses the level of growth in tourism, Egypt, Morocco, and Tunisia have seen a growth in the job market in the fields of Travel and Tourism. For the year 2016, Morocco was the leader in terms of job creation reporting 819K, followed by Egypt 773K, Tunisia 206.4 K, and Sudan 192.8K. Recently, the United Nations World Tourism Organization (UNWTO) 2017 report stated that Egypt is the world’s second-fastest growing touristic destination. Around 8 million international tourists have entered Egypt in between January - July 2017 accounting for a 24.8% growth in the number of international arrivals. Egypt further aims to attract 12.49 million international tourists by 2027, considering the fact that it reached 14.7m in 2010. Nonetheless, Tunisia is also having a comeback with an increase of 33.5% for the first half of the year. Both countries have managed to get out of the Terror threat list made by the foreign office after their recent turbulence. When taking a look at the number of arrivals driven by international tourism, Libya is the least touristic destination within the region along with Sudan and Algeria. Morocco, Egypt, and Tunisia have been evolving over the years but the numbers are within the range of 5.3M-10.M. Samia El Khodary, Analyst at Infomineo Sources: https://qz.com/1054498/nigerias-arik-troubles-sees-travel-numbers-drop-as-tunisia-egypt-and-morocco-recover-as-travel-destinations/ https://www.verdict.co.uk/emerging-tourist-destinations/ https://dailynewsegypt.com/2017/08/08/egypt-worlds-second-fastest-growing-tourist-destination-2017unwto/ https://themaghrebtimes.com/04/07/morocco-1st-tourism-destination-in-north-africa-wef-2017-report/ http://pitt.libguides.com/c.php?g=12378&p=65815 https://www.wttc.org/-/media/files/reports/economic-impact-research/countries-2017/egypt2017.pdf https://www.afdb.org/fileadmin/uploads/afdb/Documents/Publications/Africa_Tourism_Monitor_2016.pdf http://unctad.org/en/PublicationsLibrary/aldcafrica2017_en.pdf https://www.thebig5constructnorthafrica.com/en/industry-media/blog/the-impact-of-the-tourism-industry-on-north-africas-infrastructure-development/ https://traveltradedaily.com/africa-indian-ocean-news/item/2032-egypt-ranks-among-fastest-growing-for-tourism http://www3.weforum.org/docs/WEF_TTCR_2017_web_0401.pdf http://cf.cdn.unwto.org/sites/all/files/pdf/tourism_africa_tool_development1.compressed_0_0.pdf

Can Africa feed the world? Africa’s agriculture sector has been growing at a steady pace and might turn the continent into an economic power. Africa might be able to feed itself and the world if it keeps putting a focus on enhancing efficiency in using its resources. The focus on agriculture emerged from the willingness of African policymakers to capitalize on their strengths to achieve economic growth. Following this line of thinking, as part of the first declaration of the Comprehensive Africa Agriculture Development Program (CAADP) for agricultural transformation, wealth creation, food security and nutrition, economic growth and prosperity made during the African Union Summit in 2003, African leaders committed to allocate 10% of the budgets to agriculture [1]. The past decade has been witnessing economic growth in African regions that endorsed the CAADP, with a 160% increase in agricultural output [2]. The upward trend in the sector uncovers the potential of agricultural investments in Africa in promoting growth and decreasing poverty levels, whereas, agriculture represents 30% of Sub-Saharan Africa’s GDP and more than 40% in export volumes [3]. African governments, business leaders, and global decision-makers are putting more efforts into funding the agribusiness in the region. Several measures are being placed together to reduce the obstacles for growth in the region, calling for creating common grounds to combat climate change, land degradation and desertification [4]. Moreover, investments in the continent have been booming in the past year. Rising to a total of $2.3 billion, with over $500 million in new private-sector investments in 2015 [5]. Being the land of the richest resources, Africa has naturally been attracting investors because of the large scale of unexploited resources in the continent. Only 7% of the 39 million hectares of land suitable for irrigation is currently irrigated [6], while the continent holds 60% of the world’s uncultivated arable lands, which leaves an incredible opportunity for investors willing to capitalize on agriculture [2]. Although Africa has promising prospects in agriculture, there are multiple challenges to overcome to achieve a leading position in the agricultural sector. It is true that investments in food production and capitalization on resources are a key measure, but African countries must focus on creating quality and branding Africa’s agriculture by following international standards and create quality reforms, a challenge that South Africa overcame by becoming a leader in product quality [7]. In addition, there is a greater need for knowledge and funding and investments in infrastructure that go in line with agricultural growth as production growth would lead to an increasing need for transportation networks and links to other countries in the world. Agriculture can drive Africa to rise as an economic power. The continent has the potential to feed the 10 billion world population projected in 30 years. Alongside global leaders, African government ought to put the focus on agriculture at the top of their agenda, to enhancing their food production and quality capabilities. Sofia Hazim, Analyst at Infomineo Sources [1] http://www.monitor.co.ug/Magazines/Farming/African-countries-agriculture-production/689860-3379910-wgisl0/index.html [2] https://qz.com/736626/african-farmers-say-they-can-feed-the-world-and-we-might-soon-need-them-to/ [3] https://www.theguardian.com/global-development/poverty-matters/2011/jul/27/africa-potential-to-feed-world [4] https://thewire.in/148694/africa-land-fertility-degraded/ [5] https://www.thisdaylive.com/index.php/2016/05/18/investments-in-agriculture-in-africa-rises-to-2-3bn/ [6] https://www.cnbcafrica.com/news/southern-africa/2015/08/13/africa-agriculture-investment/ [7] https://www.weforum.org/agenda/2016/09/africa-could-feed-the-world-if-it-overcomes-these-challenges

Each episode MEA Pulse brings you on a journey to learn about the Middle East and Africa regional economy and business trends with a featured country pertinent to the topic. Hosting Ismail Berrada from Infomineo's Casablanca office, MEA Pulse Episode 4 is a discussion on the current state of Morocco's automotive sector and the factors that have contributed to foreign investment within the sector. Tune in to gain more insights on who the key investors in Morocco are and who they are serving, as well as how the government is working to encourage development within the sector. https://soundcloud.com/user-961934619/automotive-sector-in-morocco Tip for Our Podcast Audiences Cut to the chase by clicking on the MEA Pulse icons in the comment section to listen directly to the section that you are most interested in, or you can simply click on any of the following sections. Ismail's self-introduction Morocco's development in the sector Key players within the sector What automotive components is Morocco producing? How is the Moroccan government driving growth in the sector? What factors makes Morocco an attractive region for investment? Is Morocco an attractive region for non-European investors? What is the current state of the Moroccan automotive sector? Is there a risk that OEMs might shift to other regions to base their manufacturing? Can Morocco's performance in the aeronautic sector be compared with its performance in the automotive sector? Become a MEA Pulse Follower! To keep up with future episodes, don't forget to follow MEA Pulse on Soundcloud!

“Broadband can radically change the socio-economic prospects for the region and contribute to higher growth and shared prosperity.” - Carlo Maria Rossotto, World Bank ICT Regional Coordinator in the MENA region[1]. The majority of African countries have certainly been lagging behind in the economic development path. Public opinion usually agrees that this underdevelopment is due to reasons such as bureaucracy, illiteracy, and others. However, in the 21st century, a new variable was added to the development formula and it is often overlooked. Research about the relationship between economic development and internet speeds started to be noted in the beginning of the 2000s. A research conducted in 2011 by Ericsson and others concluded that “doubling the broadband speed for an economy increases GDP by 0.3%”[2]. Not only that, but it also claimed that additional growth can be yielded by additional doublings of speeds. Moreover, a report released by the World Bank and IFC claimed that there is a GDP increase of 1.3% for every 10% increase in high-speed internet connections[3]. "Broadband has the power to spur economic growth by creating efficiency for society, businesses and consumers. It opens up possibilities for more advanced online services, smarter utility services, telecommuting and telepresence." - Johan Wibergh, Head of Business Unit Networks, Ericsson. Researchers have many explanations as to link economic growth to higher internet speeds. For example, it was proved that the shift from slow dial-up connections to broadband had a positive effect on productivity and efficiency[4]. It can lead to expand businesses and services, empower local economies, and social inclusion. All these factors contribute to boosting the competitiveness of the economy. Internet speeds in Africa are very poor compared to the rest of the world. Data shows that 17 of the 30 countries with the slowest internet connections are located in Africa, 7 are in Asia, 6 in South America and 1 in Oceania. None of the top 30 countries are in Africa. To further identify the depth of this issue, a research conducted by Cable.co.uk showed that it takes about 18.5 hours to download a 7.5 GB file in Malawi, 14 hours in Egypt, and 18 minutes in Singapore (fastest internet in the world)[5]. The most promising African country when it comes to internet speed is Kenya. It has the fastest internet connections compared to its African neighbors with an average connection speed of 12.2 Mbps, having an impressive YoY change of 67% in 2017[6]. Not only that, but Kenya’s total available bandwidth jumped from 2028 Gbps end of 2016 to 2906 beginning of 2017, with a % change of 43.28%[7]. These impressive developments come as a result of implementing the National Broadband Strategy for Kenya (NBS) as part of Kenya’s Vision 2030 program, contributing to Kenya’s goal of becoming a knowledge-based economy by the year 2030. NBS aims to reach “broadband connectivity that is always on, and that delivers a minimum of 5 mbps to homes and businesses for high speed access to voice, data, video and application”[8]. It has 5 focus areas which are [9]: Infrastructure, Connectivity and Devices Content, Applications and Innovations Capacity Building and Awareness Policy, Legal and Regulatory Environment Financing and Investment "The strategy has enabled the government to roll out the National Optic Fibre Broadband Infrastructure that has linked all the counties to the Internet by fibre cable. Fibre cable ground installation and provision of 4G network coverage has contributed to the high speeds and efficiency in connectivity," - Joseph Mucheru, the Kenya's Cabinet Secretary in the Ministry of Information[10] This strategy has proved successful with extinguished growth in both start-up and e-commerce segments in Kenya[11], spurring massive economic and social benefits. Currently, Nairobi is considered as East Africa’s most vibrant technology hub and Kenya is internationally recognized as a pioneer in the mobile banking field (M-Pesa), boosting access to finance and financial inclusion for Kenyan citizens[12]. All in all, the Kenyan experience demonstrated that investment in internet speeds and penetration has many positive spillover effects on various aspects of the economy. Sahar ElDeeb, Analyst at Infomineo Sources [1] http://www.worldbank.org/en/news/press-release/2014/02/06/access-to-high-speed-internet-key-to-job-creation-social-inclusion-arab-world [2] https://www.ericsson.com/en/press-releases/2011/9/new-study-quantifies-the-impact-of-broadband-speed-on-gdp [3] http://www.infodev.org/articles/high-speed-internet-drives-economic-growth [4] https://www.itu.int/ITU-D/treg/broadband/ITU-BB-Reports_Impact-of-Broadband-on-the-Economy.pdf [5] https://www.cable.co.uk/media-centre/release/New-Worldwide-Broadband-Speed-League-Unveiled-UK-Ranks-31 [6] https://www.akamai.com/us/en/multimedia/documents/state-of-the-internet/q1-2017-state-of-the-internet-connectivity-report.pdf [7] http://www.ca.go.ke/images/downloads/STATISTICS/SECTOR%20STATISTICS%20REPORT%20Q3%20FY%202016-2017.pdf [8] http://www.ca.go.ke/images//downloads/PUBLICATIONS/NATIONAL%20BROADBAND%20STRATEGY/National%20Broadband%20Strategy.pdf [9] http://www.ca.go.ke/images//downloads/PUBLICATIONS/NATIONAL%20BROADBAND%20STRATEGY/National%20Broadband%20Strategy.pdf [10] http://allafrica.com/stories/201704050037.html [11] https://www.oxfordbusinessgroup.com/overview/expanding-usage-internet-penetration-growing-country-aims-maintain-its-status-technology-centre [12] https://www2.deloitte.com/content/dam/Deloitte/ke/Documents/tax/Economic%20Outlook%202016%20KE.pdf

Artificial Intelligence (AI) was first coined in 1956 by the scientist John McCarthy at Dartmouth College. [1] Nearly 60 years later, it is now enjoying a major resurgence thanks to the exponential increases in computing power, the development of more sophisticated algorithms and the vast availability of data. [2] The convergence of these technological developments has fueled AI’s rapid progress, making it the center of attention for technology investment [3]. Today the hype around the AI is at its peak and many believe that we stand at the edge of a technological revolution. It is argued that today’s transformations are not merely a continuity of the Third Industrial Revolution but rather the start of a Fourth Industrial Revolution which is characterized by a fusion of technologies that blur the lines between the physical, digital and biological worlds [4]. AI’s unprecedented growth and impressive advancements are not limited to specific geographies but rather have an impact on all continents, Africa included. However, many African countries are still battling with issues related to the first, second and third industrial revolutions such as electricity, mechanization of production and automation [5]. Therefore, questions about Africa’s preparedness for the fourth industrial revolution are being raised: Is Africa catching up with the continual advancement in technology? From cheap abundant labor to natural resources, Africa’s current strengths seem not to match with the fundamental needs of the fourth industrial revolution that consist mainly of colossal investment capital, research and development (R&D) and highly-skilled talent [6]. However, the ongoing industrial revolution represents an opportunity, if used well, that will enable Africa to become a main player in the world economy [7]. Africa is embracing technology in a way that sets it apart from other continents, according to a report by PwC. [8] Across the continent, many sectors have been empowered by an early adoption of technology. Instances include agriculture and healthcare sectors. Agriculture: With agriculture being the largest employer in Africa, innovative technology is increasingly important to modernize the sector and improve the livelihood of a large farming community. In this regard, different technology innovations have been developed. ECX e-Trade Platform: In 2015, The Ethiopia Commodity Exchange (ECX) has teamed up with IBM and IBM Business Partner Wavetec, to build a coffee-traceability solution based on state-of- the -art analytic, mobile and Internet of Things (IoT) technology. Today, the IoT solution tracks coffee through all stages of the supply chain. The full traceability helps firms in the coffee business obtain Fairtrade and organic certification for their products. Additionally, Ethiopian farmers are more ready to compete on the coffee market. These factors are helping the nation improve its exports. The ECX is currently using the solution to track about five million bags of coffee and it plans to extend the solution to support five million farmers. Next, the organization plans to expand the solution to other commodities produced in Ethiopia, such as sesame and haricot beans. [9] Aeroview Platform: Aeroview is a platform developed by the Cape Town based start-up “Aerobotics”. The platform uses AI, satellites and drones to assist farmers and help them optimize the yield through analyzing processed maps to identify problem areas in crops. [10] The Aeroview is available worldwide and it has users in South Africa, Australia, New Zealand, Australia, Malawi, Zimbabwe and Mozambique. Thanks to Aerobotics’ technology, sugar farmers in South Africa can now intervene early to prevent up to 20% of crop failures via the system’s analytics, which harnesses the infra-red imagery to map regions and individual crop rows of stressed plants. [11] In general, the growing mobile connectivity in Africa has helped providing channels to communicate information to farmers about their livestock, crops and the latest market prices. Healthcare: African countries are aware of the necessity of technology in improving the performance of healthcare. In fact, some parts of Africa have already started integrating artificial intelligence in their healthcare systems. Some examples are as follow: SOPHiA: Medical institutions in Morocco, Cameroon and South Africa have integrated SOPHiA artificial intelligence for clinical genomics into their clinical workflow to improve patients’ care. SOPHiA would enable hospitals to analyze genomic data to identify disease-causing mutations in patients’ genomic profiles and decide on the most effective care. [12] Drones: Rwanda has adopted the world’s first national drone delivery network for medical aid, which is used to deliver blood to patients in remote areas. The California based Robotics company “Zipline” is working directly with Rwanda’s National Center for Blood Transfusion to make 50 to 150 deliveries a day of blood to 21 transfusing facilities in the western part of the country [11]. Rwanda has formalized drone regulations and is currently building a drone airport that is scheduled to be completed in 2020. [13] Scanning Platform: An optical accessory that fits onto Android smartphones is now used by healthcare professional, in six African countries, to examine women for early signs of cervical cancer. The device is being enhanced by the integration of artificial intelligence to guide the healthcare professional through the diagnostic process. [14] Technology has been key to Africa’s development in recent years. From providing accessible information on market prices, weather, health and good farming practices; technology is improving the quality of life for people in Africa. Today, Africa presents a hotbed for innovation and entrepreneurship that is not constrained by legacy systems. This is an opportunity that should be seized by policy makers and businesses to develop their own distinctive technology model with the objective to bring to mainstream use all of the emerging technologies such as robotics, 3D printing, AI and the Internet of Things (IoT). Nouha Abardazzou, Analyst at Infomineo. References: [1] http://www.independent.co.uk/news/obituaries/john-mccarthy-computer-scientist-known-as-the-father-of-ai-6255307.html [2] https://www.lesechos.fr/01/05/2017/lesechos.fr/0212028250638_oui--le-futur-echappe-a-l-intelligence-artificielle.htm [3] https://www.wired.com/insights/2015/03/ai-resurgence-now/ [4] https://www.weforum.org/agenda/2016/01/the-fourth-industrial-revolution-what-it-means-and-how-to-respond/ [5] https://www.businesslive.co.za/bd/opinion/2017-08-03-digital-revolution-challenges-and-opportunities-for-african-cities/ [6] https://www.pwc.com/gx/en/issues/high-growth-markets/assets/disrupting-africa-riding-the-wave-of-the-digital-revolution.pdf [7] http://afrique.latribune.fr/think-tank/editos/2017-05-22/pourquoi-l-afrique-est-prete-pour-la-4eme-revolution-industrielle-719145.html [8] https://www.weforum.org/press/2016/05/africa-embraces-the-fourth-industrial-revolution/ [9] http://ecc.ibm.com/case-study/us-en/ECCF-IMC14990USEN [10] https://clevva.com/pressrelease/6-artificial-intelligence-startups-africa-look/ [11] http://www.sablenetwork.com/inspirations/advancements-achievements/south-african-data- drone-innovation-primed-for-global-export [12] http://ehealthnews.co.za/african-hospitals-sophia/ [13] https://www.forbes.com/sites/tarahaelle/2016/04/12/there-will-be-blood-drone-deliveries-in-africa-could-transform-healthcare/#2b91029c30b2 [14] https://www.theverge.com/2016/10/13/13267868/zipline-drone-delivery-rwanda-blood-launch [15] https://spectrum.ieee.org/biomedical/devices/ai-medicine-comes-to-africas-rural-clinics

Each episode MEA Pulse brings you on a journey to learn about the Middle East and Africa regional economy and business trends with a featured country pertinent to the topic. Hosting Antonio Pilogallo from Infomineo's Casablanca office, MEA Pulse Episode 3 is a discussion on the current state of Mozambique and the strategies that are currently in place to promote economical growth and development within the country. Tune in to gain more insights on what sectors are attracting foreign investors and what are the ongoing development projects within the country. https://soundcloud.com/user-961934619/podcast-on-mozambique/s-qJfd8 Tip for Our Podcast Audiences Cut to the chase by clicking on the MEA Pulse icons in the comment section to listen directly to the section that you are most interested in, or you can simply click on any of the following sections. Antonio's self-introduction Overview on the country The economy and main industries The Foreign investment Environment The Economic Development Prospects The Entrepreneurial Environment Business Research and Access to Information Become a MEA Pulse Follower! To keep up with future episodes, don't forget to follow MEA Pulse on Soundcloud!

Over the course of history, humans have been trading goods and services using different means. All these means have something in common - the agreement of their value, and thus their use in operations. One example of an ancient form of human exchange was witnessed in Micronesia where they used an exchange method called the ‘yap’ which were massive ray stones. These ray stones were so big that people were unable to move them, however they were still being used as a means of exchange just by knowing who was the owner of which part of the ray stone. The idea behind this is simply that ray stones or any other exchange mean does not have any intrinsic value apart from the fact that people came to an agreement of their value. Cryptocurrencies could be interpreted as the digital version of the ‘yap’ ray stones. Just like internet has changed the way we communicate in modern day, cryptocurrencies are about to change is a modern, digital means of exchange with an agreed upon value. Cryptocurrencies are digital currencies that are not ruled or governed by any institution. They are designed to be used outside of the intermediary rule that is applied today by financial and governmental institutions. It introduces a very independent, yet very secure system. According to the Coinmarketcap, as of August 2017, there were 843 currencies, where Bitcoin, Ethereum, Ripple, Bitcoin Cash and Litecoin remain the best ones mainly based on their value in USD and their circulating supply. Bitcoin alone has on average daily transactions of 288,953 which is the equivalent of 150 million USD. In addition to that, it is important to mention that Bitcoins are released through a process of mining. In the cryptocurrencies system, accounts given to the users are similar to simple blank sheets of paper. In these sheets, every user has to write down any transaction they were part of. What is special about this system is that any transaction written by any user appears in every other users’ sheet. This essentially gives any user the access to transactions happening in the whole system. The only difference is that the users are connected through a computer code network rather than paper sheets. The rationale behind this system of sharing everyone’s transactions is having everybody else confirm their ownership of coins following the basic and historical exchange system rule. The list of all the transactions is called the blockchain system. This blockchain technology works like a database in which all the transactions are stored, and that automatically performs calculations right after any transaction to update the users’ account and show each users’ balance. Cryptocurrencies are growing in popularity and increasingly been used in African nations. According to an article written by Rainer Michael Preiss, an Adjunct Researcher at NTU_SBF Center for African Studies, digital currencies, primarily bitcoin are increasingly taking roots in countries like South Africa, Ghana, Kenya, Botswana, Zimbabwe and Nigeria. Various factors make Africa a potential platform for a successful blockchain economy yet one of the main possible reasons for its growing popularity would be that Africa has a need for an alternative to its local fiat money mainly due to its lack of reliability and accessibility. Bitcoin and cryptocurrency systems in general suggest not only a better alternative to fill these existing gaps but also an opportunity for the population to control their wealth and enhance transparency, giving birth to a new era of stronger social justice in Africa. This innovative means of trade is about to update the way humans exchange and perform transactions. It suggests a practical and transparent way of doing so. These advantages are simplifying the process of trading and could potentially solve certain social and financial issues faced within societies. Tareq Amhoud, Analyst at Infomineo. Sources: https://coinmarketcap.com/ https://www.howwemadeitinafrica.com/cryptocurrency-great-african-opportunity/59402/

The African Route A Vision Economics have forever known an alchemy-like effect to an equation comprised of resources, gates to the world and logistical facilities. Application of such combination can be seen as early as the Silk Road or as recently as the Trans-European railway network. The impact of such complementary factors is usually the intensification of trade and capital gain. So, imagine a pathway which connects the Nile Valley’s wealth to the diamond rich African Heart; a track bringing together the Gold of the South with the Ancient Ports to the North or the Ivory gates of the West and the Indian Ocean Coast. Such an ambitious network connecting the world’s demand and shortage to the African supply and surplus, and vice-versa, could create a climacteric junction in the history of global economy. This vision, as poetic as it can be, could become a reality and it has been in fact sought. The Cape to Cairo Railway During the colonial era, the British Empire had managed to stretch its arms across the African continent. Seeking opportunity in such circumstances, Cecil Rhodes, a British businessman and politician had a vision of a railway that would connect edges of the Garden of Eden we call Africa. The project was named Rhodes Colossus, in reference to Greek titan statue (Phan, 2012). The main aim of the project was to facilitate the movement of the precious minerals, as well as provide a land supply line. However, due to delays caused by colonial skirmish, economic constraints and the death of Cecil, the railway construction failed, leaving some functional yet not fully linked railways (Talbot, 2015). Surely, times have changed since the conception of this African scale project. So, in order for such a scale project to take place, a feasibility test needs to be undertaken, bearing in mind the diverse range of contemporary factors, opportunities and challenges. Feasibility In terms of economies, it’s clearly visible that over the past 15 years, most African countries had experienced economic growth rates of around 5% per year. However, African states are not amongst the ranks of nations orienting their growth on competitive manufactured products but rather natural resources and domestic market growths (Zamfir, 2016). The question of “why have a trans-regional railway in Africa?” is answered by the African economic atmosphere and the opportunities an infrastructure project connecting land locked minerals to ports would bring the critical mining industry. Given the world’s constant need for African minerals and the ever-expanding global manufacturing and logistics, rapidly moving more amounts of material out of their source and nearer to demand could further improve the competitiveness of exporters. This makes the infrastructure improvement sought by both the private and public sector, as evidence suggests that African regions with longer transport corridors attract higher density of trade (African Economic Outlook, 2017). And on the contrary to how this seems to miss diversification elements developing nations might aspire, better infrastructure could facilitate future industrial projects. Regional scale railways would allow for new manufacturing possibilities owing to the speed with which minerals would travel from source to processing or manufacturing plants (Ott, 2014). A demonstration of the railway speed can be found in the new Chinese funded Standard Gauge train in Kenya. Nonetheless, there is a difference in reasons behind constructing a trans-regional railway in the East or the West and another in connecting East to West. This difference can be divided into purpose and impact. For example, the purpose behind constructing a regional railway connecting Eastern Africa would mainly be connecting the East into a fast shipping system and networking the landlocked areas with the ports that would act as trade hubs. Its impact would be further development of the Eastern African trade with other regions at a geographical marine proximity - Asia in this case. The impact of such a railway would be a surge in African-Asian trade if conducted in the East and African-Western trade if conducted with proximity to the Western shores. On the other hand, a railway connecting East to West would also be aimed at African-African trade as it is inefficient to assume that such a railway would be mainly aimed for international trade. For example, if a container ship is to move from Shanghai to Lagos, it would take 21 days on the shortest maritime route with the average cargo ship speed of 20 knots. While if such a trip was made through unloading in Mombasa and then moving by a railway to Lagos at a speed of 100 km/h, it would take no less than 15 days - assuming the most direct way between both cities can be made into a railway and excluding factors such as transit delays that could be in weeks. This can add expenses and risks to the shipping process which makes it less reasonable to use the railway for intercontinental trade, but rather African-African trade. A railway connecting Egyptian ports to South Africa also faces critical issues when approaching it for intercontinental trade. While it might in fact save time and present an eco-friendly solution to move European cargo by land across the continents poles, it remains less safe than a maritime route given the various organizational, security and legal challenges that might arise. Nonetheless, the impact of such a railway could initially be an improvement to the lagging African-African trade thwarted by the need of an improved infrastructure (Joel Ng And Densua Mumford, 2017). Governments have in fact realized the significance of such a route, which translated into the African Tripartite Free Trade Area agreement denoted to as the “Cape-to-Cairo” free trade zone. The agreement signed in Egypt encompasses nations equating about 60% of African GDP, 1 trillion dollars’ worth markets and 600 million citizens. However, the trade still faces many challenges, one of which is infrastructure (BBC, 2015). After realizing the compatibility of trans-scale railway projects with African internal and external needs, the question of funding is brought to one’s mind. Such scale projects are costly and their payoff is more visible in the long term, making it more feasible to conduct by multiple economies. This brings about the question of “How could such project be funded?” Given the positive outlook on China in Africa and the growing Chinese investment in Africa, it would be reasonable to seek Chinese funding and loans in order to move on with projects that are perhaps the next step in regionalizing African economies. Another factor pointing towards China is the Chinese institutionalization of infrastructure funds through the Asian Infrastructure Investment Bank (AIIB) which might have led the African Bank Chief to express his interest in future cooperation with the AIIB (Reuters, 2015). Moreover, since 2000, China has in fact supported inter-city railway projects in Africa with $9.9 bn worth of aids (Morlin-Yron, 2017). In Mauritania, for example, China provided the state with 70% funds, equating to US$686 mn, in 2008 to create a 430-km long railway connecting coastal Nouakchott to landlocked phosphate sources (Xinhua Agnecy, 2008). Another recent example is the $4 billion Nairobi to Mombasa railway, 90% of which is funded by the Chinese Export Import Bank (David Pilling & Emily Feng, 2017). The project comes in light of Chinese investment in a $13 billion East African railway network being built by the state-owned China Road and Bridge Corporation. The “Lamu Port Southern Sudan-Ethiopia Transport Corridor” railways are designed to connect Mobasa, Nairobi, Juba, Kampala, Kigali, Bujumbura and other East African cities. This is expected to have an impact on the African-Asian exports, imports, investment, trade and even tourism. Chinese investment is also a funding possibility, where China Railway Materials Commercial Corporation has invested £167 mn in African Minerals Limited in return for stocks. The funds were in turn used to support infrastructure projects needed by the industry (African Minerals, 2010). However, with different regional considerations of proximities and trade interests put in place, Chinese funding my not necessarily always be the answer. Nonetheless, it remains one of the most visible answers to the question. All in all, the trend suggests that regional sized projects are very feasible as some are in fact underway. The current outlook seems to favor trans-regional railways as they present themselves being the more profitable and favorable option, while trans-continental projects are less likely to take place due to the lack of cooperation among different African regions and weakness of African production of goods. Nonetheless, the impact of the ongoing projects will be more visible in the future, and the intensification of trade that happens due to it will certainly set new business grounds worthy of research. Ahmed Soliman, Business Translator at Infomineo. Infomineo is a business research provider, with a focus on Africa and the Middle East. By performing primary and secondary research, Infomineo provides its clients, which include the majority of the leading global management consulting firms and several Fortune Global 500 companies, with high quality data that leads to decision making success. For more information please contact info@infomineo.com or visit www.infomineo.com. References African Economic Outlook. (2017). Trade policies and regional integration in Africa. http://www.africaneconomicoutlook.org/en/outlook: AfDB. African Minerals. (2010). Definitive agreements signed with China Railway Materials Commercial Corporation to develop Tonkolili Iron Ore Project. http://www.african-minerals.com/media/press-releases/definitive-agreements-signed-china-railway-materials-commercial-corporation. BBC. (2015). Africa creates TFTA - Cape to Cairo free-trade zone. http://www.bbc.com/news/world-africa-33076917. David Pilling & Emily Feng. (2017). Kenya’s $4bn railway gains traction from Chinese policy ambitions. https://www.ft.com/content/d0fd50ee-1549-11e7-80f4-13e067d5072c: Financial Times. Economic Community Of West Africa States. (n.d.). Transport. http://ecoslate.github.io/transport/index.htm. Joel Ng And Densua Mumford. (2017). The TFTA and intra-regional trade in Africa. https://www.howwemadeitinafrica.com/tfta-intra-regional-trade-africa/: How we made it in Africa. Morlin-Yron, S. (2017). All aboard! The Chinese-funded railways linking East Africa. http://edition.cnn.com/2016/11/21/africa/chinese-funded-railways-in-africa/: CNN. Ott, S. (2014). End of the line for 'Lunatic Express?' Kenya begins multi-billion dollar railway. http://edition.cnn.com/2014/01/06/business/end-of-the-line-kenya-railway/: CNN. Phan, S. (2012 ). Cecil Rhodes: The Man Who Expanded an Empire. Teacher Created Materials. Reuters. (2015). Africa bank chief wants to work with China-led AIIB. http://uk.reuters.com/article/uk-asia-aiib-africa-idUKKBN0N520T20150414. Talbot, F. A. (2015 ). The Railway Conquest of the World. Amberley Publishing Limited. Xinhua Agnecy. (2008). China Exim Bank to finance railway project in Mauritania. http://www.chinadaily.com.cn/bizchina/2008-01/23/content_6417458.htm. Zamfir, I. (2016). Africa's Economic Growth: Taking off or slowing down? European Parliamentary Research Service.

Each episode MEA Pulse brings you on a journey to learn about the Middle East and Africa regional economy and business trends with a featured country pertinent to the topic. Hosting Erickson Oduya from Infomineo's Nairobi office, MEA Pulse Episode 3 is a discussion on the rapidly transforming country that foresees many evolving opportunities in investment, business research, and opportunities/challenges as SMEs. Significant forces such as technology adoption and infrastructure developments are facilitating the developing economy. Click play on the Soundcloud player, featuring Infomineo's MEA Pulse Podcast, to gain more insights on how the Kenyan investment environment is evolving, and how Small and Medium Enterprises (SME) can profit from the emerging opportunities. https://soundcloud.com/user-961934619/kenyans-investment-environment Tip for Our Podcast Audiences Cut to the chase by clicking on the MEA Pulse icons in the comment section to listen directly to the section that you are most interested in, or you can simply click on any of the following sections. Erickson's self-introduction Key Forces that are driving the Kenyan Economy Import/Export and Major Trading Partners The Evolving Investment Environment Technology Adoption and How It Affects Other Industrial Sectors Business Research in Kenya The Developing Infrastructure and the According Micro Outlook Conducting Business in Kenya as SMEs Become a MEA Pulse Follower! To keep up with future episodes, don't forget to follow MEA Pulse on Soundcloud! Kenya Country Profile Interested in learning more about Kenya? Download our Kenya country profile for more insights on the country's economy.

Establish an Empowering Healthcare System In April 2016, Saudi Arabia presented its vision for a “vibrant society, a thriving economy and an ambitious nation.” The Kingdom wants its citizens to live longer – from now expected 74 years to 80 years. It wants to “optimize and better utilize hospitals and healthcare centers, and enhance the quality of preventive and therapeutic health care services.” It wants to promote preventive care and reduce infectious diseases, and encourage citizen’s use of primary care. Doctors are to be given better training. The public sector is to focus on planning, regulatory and supervisory duties. Public corporations are to provide healthcare, enhance its quality and compete. Private medical insurance is being developed. Privatization is on the horizon. The agenda is long and ambitious. This reflects the complexity of the Kingdom‘s current health care challenges. Its healthcare expenditure is rising to more than $B 40 by 2020, with $B 5.5 required for non-communicable diseases while oil revenues have dropped sharply. Hospital beds and doctor quotas still rank below global levels after years of investment. Public healthcare for nationals and the private system for expats operate separately, with little synergies and efficiencies. The Ministry of Health and other government institutions are financing institution, legislator, operator and controller in one. Corporatization is the “empowerment” cited in Vision 2030 to address systemic and operational issues. The Ministry of Health will limit its role to regulator and supervisor. Hospitals and clinics will be transferred into a network of public companies that compete against each other and against the private sector. While this move might seem mostly conceptual, it actually represents a seismic shift in philosophy. The relinquishing of operational control at the central government level and the streamlining of traditionally abundant services have the potential to send ripple waves across every cog and wheel of healthcare in the biggest market in MENA. This is where fact ends and speculation begins. The timeline for corporatization is still firming up. The degree of autonomy and the budget process of the future public corporations remain open for now. However, the necessary increases in efficiency and quality would mandate a few likely effects: National health standards, KPIs and value measurements. The possibility of private operators for public facilities. More efficient use of hospital beds and shorter hospital stays. The eventual shift of treatment from hospitals into more primary care settings. Regionalization of healthcare structures into regional hub-and-spoke systems. The possible fragmentation of centralized tenders. Eventually, privatization. Already, the government has identified more than 30 opportunities for public-private partnerships. It has initiated first public dialogues with providers and suppliers. In the next steps of the reform, the change in governance will need to be broken down into operational decisions. Private providers, life sciences and medical technology companies, academia and service specialists have the opportunity to shape and support the evolution of the Kingdom’s health care system now – by generating data, making treatment more avaulable across the Kingdom, providing higher quality services, developing value-based approaches and market access models, offering expertise, reviewing their growth models and operations and in myriad other ways. Claudia Palme, Managing Director, 55east Consulting c.palme@55east.com Tel: +971503968598

Since the 2011 uprising, Tunisia has been facing many economic and social challenges. As a result, the government has initiated a series of reforms, particularly on the taxation front. However, the reforms have failed to meet local needs and expectations. In May 2013, the Ministry of Finance and Economy launched an in-depth fiscal reform program, in cooperation with both national and international organizations. By then, the diagnosis of the fiscal system has established a series of weaknesses[1]: Inadequate local taxation system to promote regional development Ineffective administrative procedures: heavy and complex administrative procedures both for the administration and the taxpayer Prevalence of tax evasion Given the diagnosis, the program determined its objectives, including: Simplify and modernize the fiscal system Ensure tax fairness Promote decentralization and local taxation system development Establish a transparent fiscal system and fight tax evasion [caption id="attachment_2185" align="aligncenter" width="715"] Figure1: Fiscal freedom index, in %, 2016 (Source: Heritage Foundation)[/caption] According to the Heritage Foundation [2], Tunisia’s fiscal freedom score (calculated based on tax burden) was 74% (mostly free) in 2016, following behind the MENA average, the world average and that of some other neighboring countries, such as Romania, Egypt, Algeria and Turkey. For instance, in a bid to absorb the immediate economic aftershocks of the revolution, the interim government increased public sector employment by 26% between 2010 and 2013 [3], worsening Tunisia's fiscal situation and leading to a drop in the fiscal freedom index in 2013 (shown below): [caption id="attachment_2186" align="aligncenter" width="500"] Figure 2: Evolution of the fiscal freedom index in Tunisia, 2008-2016 (source: Heritage Foundation)[/caption] Thus, the authorities have initiated several reforms to improve fiscal transparency and modernize public financial management. The government established in early 2015 also presented an opportunity to accelerate the reform agenda in this area. Tax Administration Modernization As part of the 2014 tax administration plan that aims to establish a unified tax administration and to strengthen monitoring capabilities, some measures have been taken to strengthen tax audits and improve collection. In addition, national tax consultations with stakeholders were held in November 2014 and the consolidation of tax laws and codes into a single code was approved in October 2014 to improve transparency [4]. Development of a Macro-econometric Forecasting Model The authorities launched the development of a macro-econometric forecasting model to improve their fiscal projections, with the support from the European Union. The model developed by the ministry of Finance was approved in 2015 and is currently in the test phase. It is “based on the interaction between different macroeconomic variables (GDP, price of oil, and dollar-dinar exchange rate), and other exogenous variables (international trade, consumption, and the civil service wage bill) to predict the principal fiscal aggregates, such as the revenue and public expenditures provided in the government budget” [5]. With the assistance from the European Union and the cooperation of MDCI’s Directorate General of Forecasting (DGI), a project is currently in the planning process to formulate a quarterly macro-fiscal model. 2017: Adoption of the new fiscal bill on tax incentives for investment by the parliament members [6] The finance minister Lamia Zribi stated that: “The tax incentive system costs the State nearly 1000 million dinars a year, while investment represents only 25% of the GDP" [7]. The cost-to-investment ratio reflects the weaknesses of the current fiscal system. On February 1st, 2017, parliament members have passed the new bill for fiscal incentivization, with the objective of streamlining and simplifying the tax incentives system to encourage investment and promote regional development, exports and fisheries. Incentives for investment in non-coastal regions to boost regional development The bill will allow firms located in the interior regions (non-coastal regions) to fully deduct income and profits from investments in regional development zones during the first 5 years of their operational entry into the first priority group of the regional development zones, and also during the first 10 years for the second priority group of the regional development zones. The bill may also help alleviate the tax burden on businesses located in lagging regions, even after the end of the special period of total deduction of income and profits from operations. Deduction of the tax burden for fully exporting companies Another objective of this new law is to boost exports. The new law draft will allow exporting companies to fully deduct the reinvested income from the tax base without requiring the minimum taxation until 31 December 2025. The new law draft will also allow investors subscribing to their capital to fully deduct the reinvested earnings and profits, with only minimum taxation. Tax incentives for priority sectors To encourage investors to contribute to companies operating in priority sectors, such as information and communication technologies (ICT), the automotive and aeronautical components industry and the pharmaceutical industries, the bill suggests allowing investors to deduct all income and profits reinvested in their capital subscription from the income tax base or corporation tax. These new companies will benefit from the deduction of their profits or operating income in the first four years of activity by 100%, 75%, 50%, and 25%. Conclusion While the Tunisian government has been prioritising fiscal reforms, progress on the structural reform agenda, as well as amendments to the investment and tax codes, have been slow to materialise. The government ought to spur reforms to facilitate regional development, attract more investment and finance its budget. Indeed, the fiscal reform would help prevent fraud and increase the tax revenues needed to finance the budget without increasing indebtedness. References: (1) Ministère de l’Economie et des Finances (2) Heritage Foundation website (3) European Parliament: Tunisia Economic Situation 2016 (4) 2016 IMF Tunisia Fiscal Transparency report (5) EBRD Tunisia Transition report 2015-2016 (6) Web manager center magazine, other local press releases sources (7) Agence Tunis Afrique Presse Blog author Rihab Zaatour is an analyst at Infomineo. Learn more about Rihab.

Rawiah Abdallah, General Manager at Infomineo Egypt, was invited to Dubai TV to discusses the rising interest of Fortune 500 companies in the Middle East, based on an Infomineo study that assessed how Fortune 500 companies were organizing themselves in the Middle East and Africa. Access the full complementary study and get details on our findings!

Investing in the MEA Region Global Fortune 500 companies are establishing a stronger footprint in the MEA region in response to a growing middle class and a shifting economy. This Infomineo study aims to: Analyze the regional footprint of Fortune 500 companies in Africa and the Middle East Identify trends for settlement Highlight popular settlement destinations Download our full report, case studies and infographic to learn more!
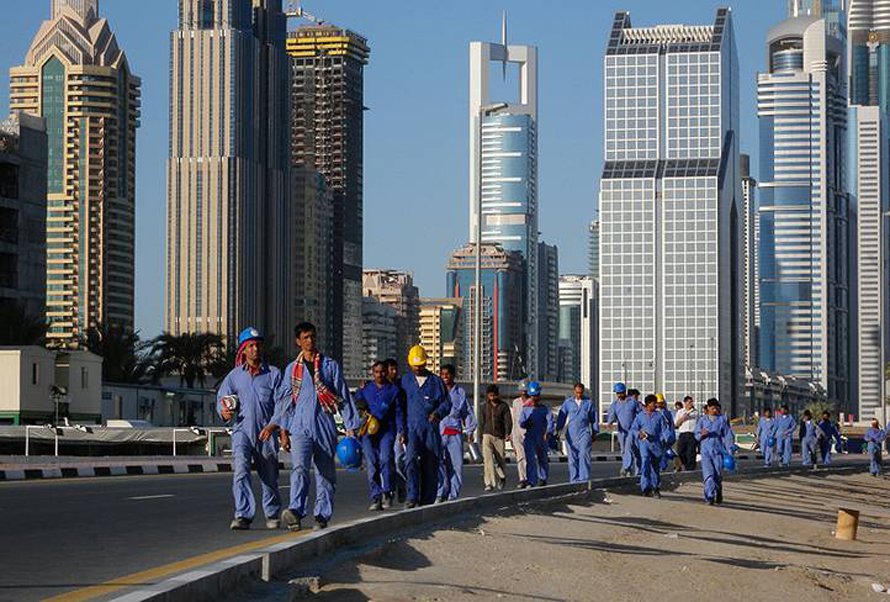
The economic exploitation of less developed countries to benefit richer economies was a key component of colonialism. As this practice began to be seen as unjust, under the pressure of growing humanitarian movements, rich countries started providing financial aid to their colonies, for the purpose of building local infrastructures and pursuing economic development and welfare. Foreign support continued even after the colonies gained their independence, with the main intent of allowing these nations an opportunity to catch up with developed economies[1]. This declared purpose may lead to the mistaken deduction that developing economies are recording positive economic inflows, but this is not the case. Some data In 2012, the “global South” received a total of $1.3 tn, in the form of foreign aid, investments and income from abroad. In the same year, some $3.3 tn flowed out of it. Net Resource Transfers (NRT) for all developing countries have been mostly large and negative since the early 1980s, indicating sustained and significant outflows from the developing world. When all the net outflows since 1980 are considered, the overall amount drained out adds up to $16.3 tn. Among the main components of these large outflows are interest payments and repatriated income on foreign investment. However, the biggest component of this leak is related to Illicit Financial Flows (IFF), a form of capital flight mainly due to illicit practices hidden in the web of international trade[3]: Trade misinvoicing on goods, a practice executed by corporations – both foreign and domestic – by reporting false prices on their trade invoices in order to spirit money out of developing countries directly into tax havens and secrecy jurisdictions. Same invoice-faking on goods, a way for multinational companies to shifting profits illegally between their own subsidiaries, by mutually faking trade invoice prices on both sides. The overall weight of this practice on international trade is estimated to be about $700 billion per year. Illegal practices in trade in services. Over the period between 2005 and 2014, IFFs likely accounted for between about 14% and 24%of total developing country trade, implying sizeable social costs falling on the governments and citizens of those countries. Particularly, outflows accounted for 4.6% to 7.2% of total global South trade[5]. FOCUS ON SUB-SAHARAN AFRICA Those financial dynamics are particularly relevant in Sub-Saharan Africa.Illicit financial outflows from SSA, meant as a percentage of total trade with advanced countries only, ranged from 5.3% to 9.9% of total trade in 2014, a ratio higher than any other geographic region studied[6]. This ratio remains higher even when averaged over 2005-2014 period. Illicit Financial outflows as a % of total trade with developing countries, (2005-2014 average) Also relevant, SSA’s assets held in tax havens grew at an annualized rate of over 20% from 2005 to 2011, a faster rate than that of any other region either developed or developing. Today, there are around 165,000 high net-worth individuals living in the region and owning combined holdings of $860 billion in offshore tax heavens. Finally, available data show how Sub-Saharan Africa is being drained of resources by the rest of the world, losing far more each year than it is receiving: while about $161.6 billion flows into the continent each year, in the form of loans, foreign investment and aid, some $202.9 billion are taken out. The result is that the region suffers a net loss of $41.3 billion a year[7]. Raymond Baker, founder and president of the Global Financial Integrity organization, defined the combination of illicit financial flows and offshore tax havens as the greater driver of inequality within developing countries[8]. However, this inequality is not always due to illegal practices. For example, in January 2014, fourteen African countries were still paying to France a “colonial debt”, a duty legalized through post-colonial agreements and meant as a tax for the infrastructures and the other benefits those countries got from French colonization[9]. The aid practice itself is often mishandled. The rate established by the OECD for development aid is 0.7% of the country gross national income. However, while the UK met this target in 2013[10], other countries like Australia (0.22%) or Italy (0.16%) are far from reaching their required contribution. Moreover, it is estimated that around 80% of this budgeted amount is used for financing the aid structures or gets lost due to the so-called “volatility”, a euphemism meaning corruption and unavailability to lower the operator’s life standards[11]. With aid budget already under pressure, the negative effects of bad management may be making it even more difficult for aid programs to achieve their goals. Conclusion Total net resource outflows from developing to developed countries accounts to about $3tn per year, that is approximately 24 times more than the global aid budget. This means that for every $1 of aid received, developing countries lose $24 in net outflows. Even if this ratio could be overestimated due to raised methodology concerns[12], therein components must be recognized as real phenomena. The noble and complex intent of getting a real economic vamp for developing countries should not be pursued only through foreign aid, especially when mismanaged. Instead, rich countries should genuinely support the global South in fighting illegal trade practices and corruption, backing institutional reforms to enabling real investments, enhancing tax collection, enforcing anti-bribery rules and improving natural resources governance. Antonio Pilogallo, Associate at Infomineo [1] http://www.abc.net.au/radionational/programs/rearvision/the-history-of-foreign-aid/5162100 [2] http://www.gfintegrity.org/press-release/new-report-on-unrecorded-capital-flight-finds-developing-countries-are-net-creditors-to-the-rest-of-the-world/ [3] https://www.theguardian.com/global-development-professionals-network/2017/jan/14/aid-in-reverse-how-poor-countries-develop-rich-countries?CMP=fb_gu [4] http://www.gfintegrity.org/issue/trade-misinvoicing/ [5] http://www.gfintegrity.org/wp-content/uploads/2017/05/GFI-IFF-Report-2017_final.pdf [6] http://www.gfintegrity.org/report/illicit-financial-flows-to-and-from-developing-countries-2005-2014/ [7] http://www.globaljustice.org.uk/sites/default/files/files/resources/honest_accounts_2017_web_final.pdf [8] http://www.gfintegrity.org/press-release/new-report-on-unrecorded-capital-flight-finds-developing-countries-are-net-creditors-to-the-rest-of-the-world/ [9] http://www.theafricancourier.de/opinion-analysis/neo-colonialism-in-africa-the-illusion-of-freedom/ [10] https://www.theguardian.com/global-development/2014/apr/03/uk-meets-foreign-aid-target [11] http://www.lastampa.it/2017/01/30/italia/cronache/il-business-della-carit-ottanta-euro-su-bruciati-in-stipendi-e-corruzione-aoM2FE3qkBwSmP7VRwVO5K/pagina.html [12] https://www.theguardian.com/global-development-professionals-network/2017/jan/18/its-not-aid-in-reverse-illicit-financial-flows-are-more-complicated-than-that

Is a wind of economic patriotism blowing in the Senegalese telecom sector? In February 2017, the Luxembourg-based telecom company Millicom announced the signature of an agreement for the disposal of its subsidiary Tigo Senegal which is the second telecom operator in the West-African country. This operation is considered as particularly worth noting since the acquirer of Millicom’s business is the Senegalese money transfer company, Wari. The latter was created in 2008 and records between 600 and 700 million transactions per year valued at 4 billion euros [1]. The value of the deal between Millicom and Wari is estimated at $129 million (XOF80 billion). Perceived by most of the observers as a sign of economic patriotism, this acquisition of Milicom’s subsidiary in Senegal by the Senegalese businessman Kabirou Mbodj has marked the Senegalese business environment during the past few weeks. Apart from the patriotic enthusiasm, this operation obviously has several strategic implications both for Wari and Millicom. From Millicom’s perspective, the Marketing Director of Tigo Senegal argues that the Tigo sale is part of Millicom’s strategy to gradually dispose its African operations and focus more on its investments in Latin America where its business is more profitable. Millicom operates globally within 13 countries across Latin America (8 countries of presence) and Africa (5 countries covered: Chad, Ghana, Rwanda, Tanzania, and Senegal). In 2016, 14% of the company’s revenue was generated from its operations in Africa [2]. Before the sale of Tigo Senegal, Millicom divested its operations in DRC to its competitor, Orange in April 2016. For the money-transfer company Wari, this acquisition is strategic on several levels: The provision of the money transfer service is directly linked to the use of telecom technologies and services (SIM cards, USSD codes generation) which are generally under the monopoly of the telco operators. With the purchase of Tigo, Wari will have access to the telecom infrastructure and can truly compete with one of its main “challengers”, Orange Money. Wari will also benefit from the “most valuable asset” of Tigo which is its telecom license whose validity has been validated till 2028 by the Senegalese government. The market share of Wari in the money transfer market could also be increased by leveraging Tigo’s customer base (3.9 million as of December 2016). The effect of economic patriotism shown by some Senegalese citizens can also help Wari gain additional market shares on both the money market and telecom front. Indeed, this operation is worth noting in the Senegalese business environment but it will also be interesting to observe the transition and consolidation phases of both Wari and Tigo Senegal. Behind the patriotic enthusiasm, the Senegalese customers’ prime concern is to have a better quality of service at competitive prices. The combination of these elements will help to constitute a solid basis for sustainable economic development. Sources [1] https://www.wari.com/fr/a-propos/a-propos-de-wari [2] http://www.millicom.com/media/8404750/millicom-overview-strategy-2016.pdf http://www.aps.sn/actualites/article/sonatel-71-milliards-d-investissement-en-2016 https://www.tigo.sn/espace-presse/millicom-a-signe-un-accord-avec-wari-pour-la-cession-de-sa-filiale-au-senegal ________________________________________________________________________________________________ Fatou Ndiaye, Associate at Infomineo. Infomineo is a business research provider, with a focus on Africa and the Middle East. By performing primary and secondary research, Infomineo provides its clients, which include the majority of the leading global management consulting firms and several Fortune Global 500 companies, with high-quality data that leads to decision making a success. For more information please contact info@infomineo.com.

Each episode MEA Pulse brings you on a journey to learn about the Middle East and Africa regional economy and business trends with a featured country pertinent to the topic. Hosting Soji Akinelye from the Infomineo's Lagos office, MEA Pulse Episode 1 dives into the transitioning Nigerian economy, the success stories of private investments, as well as the data accessibility for business research in the country. Tip for those who are running around the clock: Cut to the chase by clicking on the MEA Pulse icons in the comment section to listen directly to the section that you are most interested in, or you can simply click on any of the following sections. Introduction to the Nigerian Economy The Slow Down of the Economy Government's Diversification Efforts Investment Success Stories Foreign Investors in Nigeria Doing Business in Nigeria Data Accessibility in Nigeria Become a MEA Pulse Follower! To keep up with future episodes, don't forget to follow MEA Pulse on Soundcloud! Nigeria Country Profile Interested in learning more about Nigeria? Download our Nigeria country profile for more insights on the country's economy.

For many decades, the African hospitality market has been exclusively reserved to private investors, of which the majority are hotel chains and property companies. Looking at the market today, it appears that the Sub-Saharan African hospitality sector, excluding South Africa, is now rising as a key investment opportunity for both international hotel chains and institutional investors such as private equity firms. With the tourism sector being a key target for most African governments, hospitality investments are strongly supported by public authorities who offer incentives to attract the world’s largest brands, making the continent the new battleground of major international hotel groups. According to EY’s Africa Attractiveness Survey, the African hotel and tourism sector was forecasted to grow by almost 17%, with accommodation demand increasing from the business travelers connecting to big African cities and many other African commercial capitals, as a reflection of strong economic growth. As the continent remains attractive to investors for business, trade and capital investment, it leads to an increasing demand for accommodation and hospitality products. The hospitality sector is developing at a fast pace with large investments planned in sub-Saharan Africa. It has shown a 29% average yearly growth rate between 2012 and 2016 in terms of room capacity, according to W Hospitality Group 2016 survey. At the end of 2016, hotel developments are planned for 35 of the 49 sub-Saharan African countries, with western Africa absorbing 45% of the capacity of rooms planned, followed by Southern Africa with 26% and Eastern African capturing 24% of the planned rooms. The offer covers all hotel’s segmentation, with an emphasis on 4-star hotels, mainly targeting business travelers and tourists with specific requirements when visiting Africa. In terms of the number of investments, they are largely focused on the southern region of the continent, with South Africa absorbing the highest amount of investments. Kenya attracts the highest amount of hotel investments in the east Africa region, followed by Uganda, as the countries are offering diverse opportunities for tourism development and therefore large capacity of absorbing hospitality investments. West Africa is also a key target for several investors, with Nigeria on top of priority, followed by Cote d’Ivoire and Ghana. Both countries are very attractive due to the rise of their business travelers, as their economies keep prospering. Historic segment investors like international hotel groups are actively taking advantage of the market opportunities. They all plan several openings and hotel extensions, with some looking to increase their footprint on the continent through hotel acquisitions in main countries and local development offices to support their strategies: AccorHotels has set up partnerships with strong investors to conquer the African hospitality market and aims to increase its sub-Saharan Africa network to 15,000 rooms in 100 hotels over the next five years. Carlson Rezidor, with 30 hotels comprised of 6,300 rooms under development across the continent, has set up a hospitality fund, Afrinord Hotel Investments, with Nordic institutions to support its growth on the continent. Marriott International announced in 2014 its plan to expand its African presence to 150 properties in 17 national markets by 2020. Its acquisition of Protea, a 116-hotel group spanning seven African nations, for USD 200 million, marks a key step in its strategy. The American group Hilton, with 39 hotels in 17 African countries, intend to double its presence to 80 hotels by 2020 with new openings and extensions in Ghana, Kenya and Nigeria. Even if international hotel chains seem to be the leading active players on the field, the local groups are not in marge. Mangalis Hotel Group, the new African hotel chain is investing USD 340 million to build 15 hotels in west and central Africa through 3 brands (Noom, Yaas and Seen) with a total of 2,200 rooms and suites. Azalaï Hotels who has footprints in several west African countries, with a capacity of 1,000 rooms, intends to grow above 1,600 rooms in terms of capacity after this fundraising. At the beginning of this year, AfricInvest announced an injection of EUR 17.3 million in Azalaï Hotels capital, to support the hotel group development across Africa through capacity extension and service improvement. Beside the hotel groups, institutional investors are also showing interest to the hospitality and tourism sector. Gradually increasing their exposure on the segment, investment funds see the African hospitality sector as a golden egg, and show their enthusiasm for the segment by mainly investing through equity vehicles. Their investments target both greenfield and brownfield projects in all geographies. These funds targeting African hospitality markets are largely funded by development institutions around the world, helping local tourism sectors take off and raise the economy. As other institutional investors, African sovereign wealth funds are looking to hospitality, as the segment is considered as a relatively safe investment sector. The Libyan Investment Authority (LIA), the Libyan sovereign wealth fund, has been actively investing in hotels in Africa through its subsidiary LAICO, Libyan African Investment Company. The fund owns hotel chain Laico Hotels & Resorts, which also owns the Ensemble Hotel Holdings group, proprietor of the high-prestige Michelangelo Hotel in Johannesburg. Laico Hotels & Resorts has 10 properties of 4-star and 5-star hotels with over 2,200 rooms through 2 brands: Laico and Ledger. Most of its acquisitions were targeting three-star to five-star hotels and are managed by international operators. In 2008, LAICO established a joint venture, called LAICO Hotels Management Company, with Tunisia Travel Service (TTS), a Tunisian company involved in the hospitality sector through hotel management, airlines and ground transportation. LIA is similarly followed by Angola’s Fundo Soberano de Angola (FSDEA), which is starting investments in hotel and commercial infrastructure in sub-Saharan Africa. The fund is expected to invest in 50 sub-Saharan African hotels over three years, including in Angola. This is thanks to allocation of USD 500 million in equity capital to a hotel development fund for Africa, as it has earmarked the tourism space as a particularly potent area. FSDEA’s hotel fund will focus on three-star to five-star hotels in sub-Saharan African capitals and other commercial centers, targeting business travelers rather than tourists for their currently returns. The fund will target existing hotels changing ownership or those still under development. Funds from Mozambique, Nigeria and Ghana are all intending to follow their peers and to exploit the recent rises in tourism to Africa. The new dynamism on the African hospitality sector proves that investment opportunities on the continent are diverse for all types of investors. All it takes is to be more alert to rising opportunities and growing sectors. Gaicha Saddy, Senior Associate at Infomineo. Sources: Agence Ecofin, AfricInvest investira 17,3 millions d’euros pour soutenir le développement du groupe Azalaï Hotels (January 2017) http://www.agenceecofin.com/investissement/0601-43579-africinvest-investira-17-3-millions-deuros-pour-soutenir-le-developpement-du-groupe-azalai-hotels Jeune Afrique, Hôtellerie : Hilton entend doubler sa présence africaine (October 2016) http://www.jeuneafrique.com/362631/economie/hilton-entend-doubler-presence-dici-4-ans-afrique/ W Hospitality Group, Hotel Chain Development Pipelines in Africa 2016 (May 2016) http://w-hospitalitygroup.com/newwhg/wp-content/uploads/2016/05/W-Hospitality-Group-Hotel-Chain-Development-Pipeline-in-Africa-2016-1.pdf EY’s attractiveness survey, Africa 2015, Making choices (2015) http://www.ey.com/Publication/vwLUAssets/EY-africa-attractiveness-survey-2015-making-choices/$FILE/EY-africa-attractiveness-survey-2015-making-choices.pdf JLL, Hotel Investment Outlook 2015, Hotels & Hospitality Group (January 2015) http://www.jll.com/Research/JLL%20Hotel%20Investment%20Outlook%202015.pdf African Union, Invest In Africa 2015 (2015) http://www.un.org/en/africa/osaa/pdf/pubs/2015investinafrica.pdf Bloomberg, Angola Sovereign Wealth Fund Starts Hotel, Infrastructure Pools (April 2014) https://www.bloomberg.com/news/articles/2014-04-23/angola-sovereign-wealth-fund-starts-hotel-infrastructure-pools African Development Bank, Africa’s Quest for Development: Can Sovereign Wealth Funds help? (December 2011) https://www.afdb.org/fileadmin/uploads/afdb/Documents/Publications/WPS%20No%20142%20Africas%20Quest%20for%20Development%20%20Can%20Sovereign%20Wealth%20Funds%20help%20AS.pdf Companies websites

Revenue receipts from oil will be just as important to driving Nigeria’s economy in the medium term as they were in the last decade. An estimated 70% of government revenues and around 90% of the country’s foreign exchange earnings come from oil sales. However, Nigeria is currently experiencing the effects of its over-dependence on oil and under-investment in infrastructure, which will have serious socio-economic implications in the long-term if kept this way. For many investors, Nigeria remains an important part of their long-term Africa portfolio strategy, and rightly so. Between 2005 and 2015, Nigeria’s economy grew by an average of 6.5% annually, driven largely by record revenue receipts from crude oil sales, which funded the country’s consumption-led growth model and propelled it to become the largest economy in Africa in 2014. Also, not only does the country possess the continent’s largest and one of the fastest growing domestic markets, it also accounts for an estimated 29% of Africa’s total GDP (2016). In addition, the strong economic growth the country experienced between 2005 and 2015 helped create new consumer groups with significant pent-up demand for goods and services. Source: United Capital; Unlocking rapid development of transport infrastructure in Nigeria, 2014 However, despite Nigeria’s economic success in the last decade, strong economic growth wasn’t followed by the required infrastructure investments and the country’s infrastructure stock is becoming inadequate to support its large population and level of economic activity. At around 25% to 40% of GDP, Nigeria’s stock of infrastructure is significantly lower than the global average of about 70%. If the country’s infrastructure bottlenecks were concerning before, they have only gotten worse and Nigeria desperately needs to improve its outdated and insufficient infrastructure. Moreover, growth in Africa’s largest economy has turned negative. On the back of a macro-economic environment characterised by low oil output, low oil prices and a faltering exchange rate regime, in 2016, and for the first time in 25 years, the country experienced its first full year contraction, with the economy shrinking by about 1.5%. Since officially slipping into recession in the second quarter of 2016, some of the issues which drove the economy into recession has been “partially” addressed and Nigeria’s economy is expected to come out of recession by the end of 2017. In fact, the IMF estimates that the Nigerian economy will grow by 0.8% in 2017, with growth in 2018 to 2022 averaging 1.8% annually. Yet, as identified by the McKinsey Global Institute (MGI) in 2014, for Nigeria to achieve its full economic potential by 2030, GDP growth needs to average a minimum of 7.1% annually. This would see GDP grow to an estimated $1.6 trillion, with the potential for an estimated 70 million people to move out of poverty. Source: National Bureau of Statistics When comparing the IMF growth estimates above with the 9.45% growth the country saw in 2010, and considering factors such as decades of under-investment in infrastructure which has caused significant infrastructure deficits, a fast growing population - a large proportion of which lives in poverty, and a new reality of low oil prices ($40 to $70 range in the foreseeable future), Africa’s largest economy needs to get serious about investing in infrastructure and creating an environment which attracts significant private investments in infrastructure. Nigeria’s underinvestment in overall infrastructure, historically around 1.5% of GDP, contributed to the worsening infrastructure challenges. This is about one fifth of the investment level needed to keep economic growth at 7% and above. To put things into perspective, countries like China and India invested 8.6% and 5% of GDP, respectively between 1992 and 2013. According to the World Economic Forum rankings on overall infrastructure quality in 2016, Nigeria sits near the bottom at 132nd out of 138 countries surveyed, well below 4 of the 5 largest economies in Africa with Egypt ranking 96th, South Africa 64th, Algeria 100th, and Morocco 58th. With oil prices at about half of what it used to be a couple of years ago, Nigeria’s economy would struggle to grow consistently at rates at which it did in the last decade if it doesn’t aggressively address its infrastructure challenges. For Nigeria to effectively address its infrastructure challenges, it must transition from a consumption-led growth model to an investment-led growth model, one which would promote accelerated investments in infrastructure. Also, according to the MGI, an estimated $1.5 trillion needs to be invested in infrastructure through 2030 to allow Nigeria’s economy reach its full potential, with much of the investments going to power, transportation, and real estate. This would mean annual infrastructure investments in excess of $50 billion. With a fast-growing budget deficit and high borrowing costs, the government is losing the race to boost its own investments. The current government has shown it is serious about investing in infrastructure with record budget appropriations for capital expenditures. ($5.9 billion in 2016, compared with $2.8 billion in 2015). While helpful, it is clear the required level of improvement in Nigeria’s infrastructure won’t come only through increased public investments but rather by promoting a friendlier environment for private investments. To attract the level of investments required to transform Nigeria’s infrastructure, not only must the government properly execute target infrastructure plans, it must lay the groundwork for private investments through a regulatory framework which tackles the availability of private funding and protects private investments in infrastructure. Infrastructure challenges notwithstanding, Nigerian development has come to a decisive moment. Transition to an investment-led growth model, in addition to tackling corruption and waste in government, could see the country achieve faster economic growth than it did in previous years, a scenario which would see Nigeria’s economy become one of the top destinations for private investments in the world. High crude oil prices and improved productivity, which the MGI defined as GDP generated per worker and estimated to have contributed 55% of total growth set the stage for a decade of strong economic growth, which has provided a platform on which Nigeria must build upon. Strong economic growth spurred Nigeria’s economy to become the largest market in Africa, while domestic consumption grew significantly. However, changing dynamics in the oil industry has hit Nigeria hard, forcing it to face the realities of the limitations of its infrastructure. Should Nigeria’s government tackle regulatory and funding challenges in infrastructure investments, it could open up a pipeline of potential private infrastructure investments of more than $500 billion dollars over the next 2 decades, putting Nigeria on course to meet its economic potential. Oludayo Abass, Analyst at Infomineo. Sources African Economic Outlook: 10 facts you probably didn’t know Bloomberg: China Spends More on Infrastructure Than the U.S. and Europe Combined Economic Recovery & Growth Plan 2017-2020 FT; Nigeria economy suffers first annual contraction in 25 years IMF Jackson, Etti & Edu: The infrastructure gap in Nigeria – new sec rules to the rescue? McKinsey Global Institute – Nigeria’s renewal: Delivering inclusive growth in Africa’s largest economy National Bureau of Statistics PWC; Infrastructure Development in Nigeria: Better late than never The Global Competitiveness Report, 2016–2017, page 47 United Capital; Unlocking rapid development of transport infrastructure in Nigeria Vanguard: 2016 budget: FG to spend N1.75trn on Capital Expenditure Word Bank; Africa’s Infrastructure – A Time for Transformation niimp.gov.ng MEA Pulse Episode 2: How is the Nigerian Government Diversifying its Economy? Hosting Soji Akinelye from the Infomineo's Lagos office, MEA Pulse Episode 2 dives into the transitioning Nigerian economy, the success stories of private investments, as well as the data accessibility for business research in the country. https://soundcloud.com/user-961934619/episode-2-how-is-the-nigerian-government-trying-to-diversify-its-economy
Africa’s population since 2010 has officially surpassed one billion[1]. It is projected to be more than two billion by 2050, and possibly more than four billion by the end of the century, almost as much as in Asia[2]. This demographic growth will likely produce a faster growing domestic demand which will also be supported by an increased purchasing power thanks to remittances from the diaspora. Indeed, in 2015 alone, African migrants sent home around 64.6 billion US dollars[3]. In the face of this challenge, the continent’s leaders understand that the private sector must play a forward-looking role. To facilitate that, African governments are making efforts to create a suitable environment for private sector-led activities and hence, encourage foreign direct investments (FDI). On the other hand, over the past two decades, China’s robust economic growth and rapidly expanding presence in global markets have greatly intensified its trade ties with Sub-Saharan Africa. China’s remarkable 10 percent average growth rate between 2000 and 2012[4], has fueled a steadily rising demand for oil, minerals and other primary commodities, many of which are abundant in Sub-Saharan Africa. China has now become a major development partner for countries throughout the continent, and its trade, investment, diplomatic, and political relationships with Sub-Saharan African countries continue to strengthen. FDI Trends in Africa Figure 1: FDI into Africa by capital investment 2015[5] Figure 2: FDI into Africa by project numbers 2015[6] Foreign direct investments into Africa totaled $66.4 billion for a sum of 705 projects in 2015. Egypt was the number one destination for FDI into Africa in 2015, mostly thanks to ENI’s plans to invest between $6 billion and $10 billion in the Zohr gas field[7]. The top 10 destination countries for FDI into Africa account for 77 percent and 75 percent of FDI in the region as a whole, both by number of projects and capital investment respectively. Figure 3: Business activity breakdown of FDI into Africa by capital investment 2015[8] Figure 4: Business activity growth trends for FDI projects in Africa 2015[9] Business Services, Sales, Marketing & Support and Manufacturing were the top three business activities for FDI projects into Africa in 2015. Despite being the fastest growing business activity by capital investment in 2014, the value of Extraction projects dropped 32 percent in 2015 to $15.1bn. Infrastructure-related business activities such as Electricity, Construction and ICT & Internet Infrastructure made up 13 percent of all projects into Africa and accounted for 44 percent of capital invested. Electricity, in particular, saw a 49 percent increase in capital investment and a 91 percent increase in project numbers[10]. Figure 5: Sector breakdown of FDI into Africa by capital investment 2015[11] Figure 6: Sector breakdown of FDI projects in Africa by project numbers 2015[12] Although concentrated in a few countries, Services FDI accounted for 48 percent of Africa’s total stock of FDI, more than twice the share of manufacturing (21 percent) and significantly more than the primary sector (31 percent)[13]. As in 2014, the Coal, Oil & Natural Gas sector ranked top for capital investment in 2015 with $15.7 billion invested. However, $12.2 billion was invested in Alternative/Renewable Energy. The clean energy sector saw a 23 percent increase in capital investment, whereas fossil fuel declined by 52 percent[14]. Figure 7: Top investing countries in Africa by capital investment 2015[15] Figure 8: Top investing countries in Africa by project numbers 2015[16] Italy was the top investor by capital investment in the region in 2015, with projects valued at $7.4 billion, $6 billion of which comes from ENI’s investments. Asian countries invested in 11 percent more African FDI projects in 2015. Key investors were India and China, with China accounting for a 3 percent market share and 4 percent of the number of all inward FDI projects. Despite China ranking 9th by capital investment and 7th by project numbers, it was the second most prolific job creator. In fact, China created 14,127 jobs across the continent in 2015[17]. China’s Outward Direct Investment (ODI)[18] in Africa Much of China’s ODI in Sub-Saharan Africa is closely linked to trade. Official figures from the Chinese Ministry of Commerce (MOFCOM) suggest that ODI to Sub-Saharan Africa reached US $2.52 billion in 2012, and US $3.4 billion in 2013[20]. In 2012, the total stock of Chinese ODI was US $20 billion, yet this accounted for just 5 percent of the total inward foreign direct investment stock in Africa. Meanwhile, the importance of Sub-Saharan Africa and Africa as a whole in China’s total ODI stock remains below 5 percent and has not changed much since 2006. In other words, Africa has benefited from China’s rising ODI outflows, but no more so than other regions. Indeed, Chinese investments have increased worldwide and mainly in Asia, China’s most important ODI recipient. This global trend is driven by the ambitious ‘One Belt, One Road’ (OBOR) initiative that would connect China, Europe and Africa. The initiative plans heavy investments in transportation infrastructure, mainly through Asia and eastern Europe. China’s ODI to countries along OBOR grew 23.8 percent year-on-year in 2015, and was up 60 percent year-on-year in the first half of 2016[21]. China’s economic involvement in Africa has taken many forms, and information about its financial and trade ties to the continent is not always easily comparable to that of other countries. While Official Development Assistance (ODA) is defined by the OECD to include grants, interest-free loans and concessional loans, Chinese ODA includes the use of financing mechanisms that are outside the OECD’s definition, such as export credits, natural-resource-backed credit lines, subsidies for private investment, and so-called “mixed credits,” which are combined concessional and market-rate loans. Therefore, African leaders and governments portray Chinese engagement in the region as positive because of China’s contribution to infrastructure which impacts the economy.Throughout Sub-Saharan Africa, China is investing most heavily in energy and the extractive industries, a pattern similar to its investment strategy in other parts of the world. In West Africa, however, Chinese ODI is unusually concentrated in the transportation sector. From 2005 to 2012, the West African transportation sector received 36 percent of China’s total ODI flows to the region, substantially higher the 14 percent average worldwide[23]. Transport equipment is overwhelmingly related to mineral extraction, a sector where Chinese firms are highly concentrated. Transportation was followed by the mining and metallurgy sector with 32 percent of total regional investment, also well above the 16 percent average worldwide. Energy attracted the third-largest share of Chinese ODI at 28 percent, lower than the 46 percent worldwide average. One of the most critical questions facing African policymakers as a whole, and West African policymakers in particular, is how to maximize the benefits of their increasingly tight financial and trade integration with China. The expansion of natural resources sectors and the contraction or stagnation of the agricultural and industrial sectors are worrying signs of the Dutch disease effect[24] Ultimately, many argued that China has been investing heavily in Africa, some even went as far claiming that the country has become the first source of FDI in the continent. It is true that Africa have benefited from a higher ODI inflow from China, however, it didn’t get more attention that other regions of the world, and the numbers are there to prove it. “The bottom line is clear: by making Africa’s structural transformation open for business, the continent can do more with the private sector’s resources, ingenuity and innovation to drive productivity, growth and development. Doing so will improve the lives and prospects of Africa’s men, women and children. “ Mario Pezzini is director of the OECD Development Centre and acting director of the OECD Development Co-operation Directorate[25] Disclaimer: Chinese official outbound direct foreign investment (ODI) statistics may be distorted by the presence of stop-over destinations such as Hong Kong and offshore centers in the Caribbean. Sarah Nassiri, Analyst Intern at Infomineo. Learn more about Sarah. [1] Source: The World Bank Database. [2] Source: United Nations, Department of Economic and Social Affairs, Population Division (2015). World Population Prospects: The 2015 Revision. New York: United Nations. [3] Source: The Africa Investment Report 2016 - Foreign Investment Broadens Its Base, fDiIntelligence. [4] Source: The World Bank Database. [5] Source: The Africa Investment Report 2016 - Foreign Investment Broadens Its Base, fDiIntelligence. [6] Source: The Africa Investment Report 2016 - Foreign Investment Broadens Its Base, fDiIntelligence. [7] Source: The Africa Investment Report 2016 - Foreign Investment Broadens Its Base, fDiIntelligence. [8] Source: The Africa Investment Report 2016 - Foreign Investment Broadens Its Base, fDiIntelligence. [9] Source: The Africa Investment Report 2016 - Foreign Investment Broadens Its Base, fDiIntelligence. [10] Source: The Africa Investment Report 2016 - Foreign Investment Broadens Its Base, fDiIntelligence. [11] Source: The Africa Investment Report 2016 - Foreign Investment Broadens Its Base, fDiIntelligence. [12] Source: The Africa Investment Report 2016 - Foreign Investment Broadens Its Base, fDiIntelligence. [13] Source: The Africa Investment Report 2016 - Foreign Investment Broadens Its Base, fDiIntelligence. [14] Source: The Africa Investment Report 2016 - Foreign Investment Broadens Its Base, fDiIntelligence. [15] Source: The Africa Investment Report 2016 - Foreign Investment Broadens Its Base, fDiIntelligence. [16] Source: The Africa Investment Report 2016 - Foreign Investment Broadens Its Base, fDiIntelligence. [17] Source: The Africa Investment Report 2016 - Foreign Investment Broadens Its Base, fDiIntelligence. [18] Outward Direct Investment is very similar, but not identical, to foreign direct investment (FDI). As with FDI, ODI includes private financial flows; however, ODI also includes investments from state-owned companies. [19] Source: The Impact of Rising Chinese Trade and Development Assistance in West Africa, Miria Pigato and Julien Gourdon, Africa Trade Practice Working Paper Series - Number 4, May 2014. The World Bank. [20] Source: China’s growing ODI: Where does it all go? - Economic Analysis, Carlos Casanova, Alicia Garcia-Herrero and Le Xia, BBVA Research Department. [21] Source: China’s ‘One Belt, One Road’ gains traction, Lan Shen, Standard Chartered – Economic Trends, December 2nd 2016 https://www.sc.com/BeyondBorders/one-belt-one-road-traction/ [22] Source: The Impact of Rising Chinese Trade and Development Assistance in West Africa, Miria Pigato and Julien Gourdon, Africa Trade Practice Working Paper Series - Number 4, May 2014. The World Bank. [23] Source: The Impact of Rising Chinese Trade and Development Assistance in West Africa, Miria Pigato and Julien Gourdon, Africa Trade Practice Working Paper Series - Number 4, May 2014. The World Bank. [24] Dutch disease is the negative impact on an economy of anything that gives rise to a sharp inflow of foreign currency, such as the discovery of large oil reserves. The currency inflows lead to currency appreciation, making the country's other products less price competitive on the export market. [25] Source: The Africa Investment Report 2016 - Foreign Investment Broadens Its Base, fDiIntelligence.
Mobile Banking and Why It’s Growing in Africa Mobile banking allows its users to conduct financial transactions through mobile devices such as mobile phones and tablets. It is a service offered by banks and other financial institutions that allow users to obtain account balances, pay bills and transfer funds on their mobiles. However, mobile banking is different from mobile payment. Indeed, the latter is a service that allows users to pay for a product or service using a mobile device. Paying for purchases doesn’t require having a bank account. It is more often added to the phone bill or paid by cash to specific agents. Before digging into mobile banking and payment in Africa, it is important to remember that the continent is the fastest growing and second largest mobile phone market in the world[1]. In 2016, there were over 1 billion mobile subscribers in Sub-Saharan Africa[2] alone. Also, 80% of Africans have mobile phones while only 20% of them had access to the internet as of 2015[3]. Fig. 1 - African Mobile Phone Market[4] On the other hand, barely 34% of adults in Sub-Saharan Africa had a bank account in 2014[5]. This account penetration was mainly driven by mobile money accounts. In East Africa, where mobile money penetration is more important, the penetration of financial institution accounts remained steady at 24% whilst mobile money account penetration increased to 35%[6]. Fig. 2 – Account Penetration (2011 and 2014)[7] Fig.3 – Mobile Money Account Penetration in Sub-Saharan Africa[8] In the light of these figures, it becomes obvious that Africans have higher access to mobile money than to mobile banking since a majority of them do not have bank accounts, to begin with. Has mobile money replaced banking in some parts of Africa? Bill Gates once said, “Banking is essential, banks are not.” It seems like Eastern Africa, mainly led by Kenya, has found a way around financial institutions. In fact, almost 60% of the population in Kenya holds mobile money accounts[9]. With over 74% of the population living in rural areas[10], mobile money has made it possible for them to benefit from the perks of banking at lower costs. Moreover, this population doesn’t have fixed salaries since their main source of income is traditional agriculture. Therefore, banking to them is more of a luxury they cannot afford than a necessity for their day to day life. Since it was first launched in 2007 by Safaricom, Kenya’s largest mobile-network operator, mobile money has helped address social challenges while supporting the UN’s Sustainable Development Goals (SDGs). One of the first SDGs directly impacted there is financial inclusion (end poverty in all its forms everywhere). Mobile banking undoubtedly facilitated access to financial services for its 400 million registered users throughout the world[11]. All in all, even though mobile payment does not perfectly meet the definition of financial institution services, it provides those who can’t afford banks with a wide range of financial services including microcredits and money transfers. The growing demand in East Africa mainly might, however, trigger the need for stricter regulations to protect the consumers. Sarah Nassiri, Analyst Intern at Infomineo. [1] Source: African Development Bank, Tracking Africa’s progress in figures report, 2014, [2] Source: The Mobile Economy 2017, GSMA Intelligence, [3] Source: ICT Data and Statistics Division, May 2015, https://www.itu.int/en/ITU-D/Statistics/Documents/facts/ICTFactsFigures2015.pdf [4] Source: African Development Bank, Tracking Africa’s progress in figures report, 2014. [5] Source: The Global Findex Database 2014, World Bank Group, Development Research Group, Finance and Private Sector Development Team - April 2015. [6] Source: The Global Findex Database 2014, World Bank Group, Development Research Group, Finance and Private Sector Development Team - April 2015. [7] Source: The Global Findex Database 2014, World Bank Group, Development Research Group, Finance and Private Sector Development Team - April 2015. [8] Source: The Global Findex Database 2014, World Bank Group, Development Research Group, Finance and Private Sector Development Team - April 2015. [9] Source: Financial Development in Sub-Saharan Africa – Promoting Inclusive and Sustainable Growth, IMF (2016), team led by Montfort Mlachila. [10] Source: World Bank. [11] The Mobile Economy 2017, GSM Association.
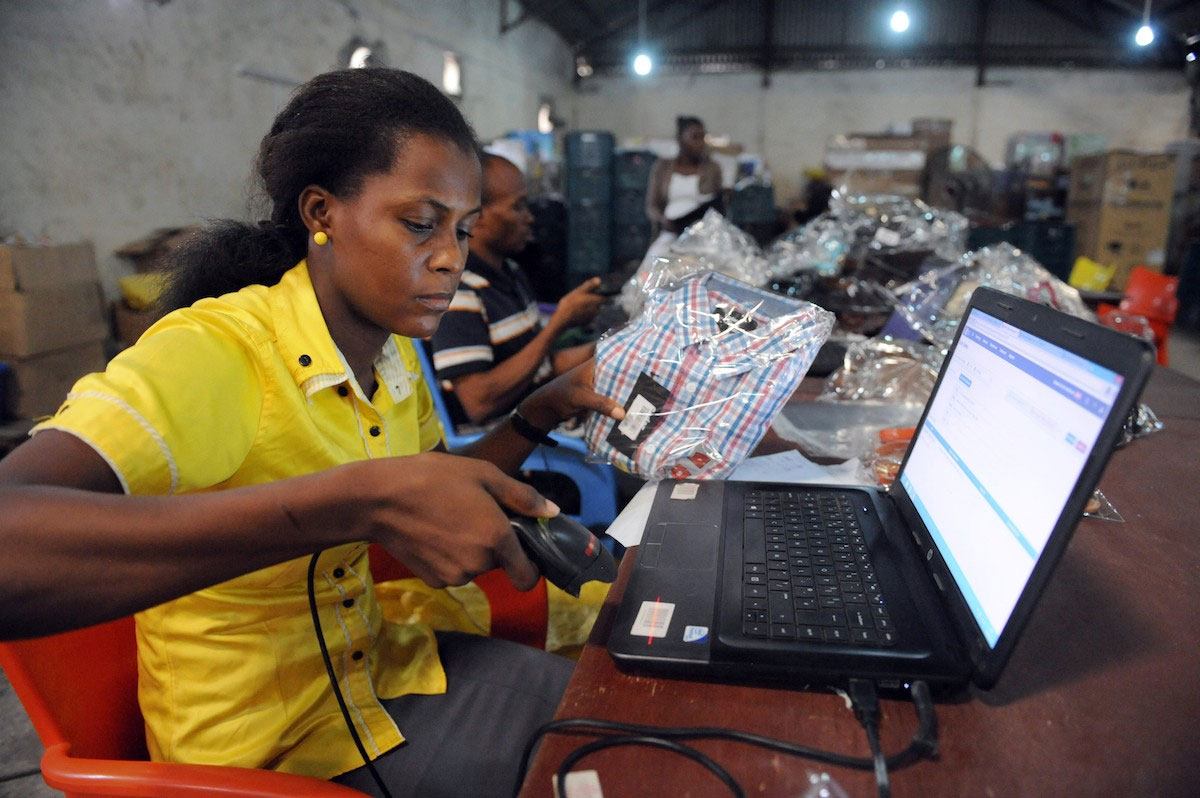
Kenya has been witnessing major growth in entrepreneurship and innovation, led by a rising interest towards new technologies and mobile connectivity. Today, Kenya is leading the way in terms of digital technology development in Africa. The country has been experiencing a boom in internet and mobile savviness with a 90% mobile penetration as of 2016, among which, 44% of mobile users’ own smartphones. Percentage of people using smartphones in Kenya in 2014 and 2016 The leading innovation that Kenya experienced in the past years has been mainly led by mobile money and instant transfer of funds usage. With 96% of households using mobile money in Kenya, it has become dominant over traditional money transfer solutions that are costly and time consuming compared to mobile money services. Moreover, the leading provider of mobile money, M-PESA, also appealed to rural areas and it is believed to have raised 2% of the population out of poverty. This is as a result of the tendency of users, especially women, to be more enticed and open to doing business with the ease of funding and money transactions offered by M-PESA [2]. Survey results to: “Do you use any mobile money service?” Moreover, Kenya is ranked first in Sub-Saharan Africa in terms of technology transfer and expenditure on research and development [4]. The government’s engagement in technological advances provided greater opportunities for Kenyans in being more innovation driven and thus, enabled them to be attracted by entrepreneurship and risk-taking. Some of the initiatives led by the Kenyan government to increase the citizen’s approach to entrepreneurship are represented in several public sources of funds for entrepreneurs. These funds target different parts of the population, such as funds dedicated to increasing entrepreneurial access to young people and women as well as sector dedicated funds [5]. The Kenyan government has also put a lot of emphasis on new technologies, through extensive investments in internet infrastructure. In 2014, Kenya was reported to have emerged as a leader in the internet market within the region, holding the highest bandwidth per person in Africa at one of the lowest rates, further increasing internet penetration in Kenya to 52.3% [6]. As a consequence of all the above incentives combined with the accelerating development in the country, many Kenyan entrepreneurs have been recognised for their efforts and inspiring stories. In 2014, nine Kenyans were among Forbes publication on the 30 most promising entrepreneurs in Africa [7]. In 2016, 75 Kenyans were among the 1,000 startup entrepreneurs in Africa that benefited from the Tony Elumulu Foundation Entrepreneurship Program (TEEP), a program that grants an overall $100 million to 1,000 entrepreneurs selected from a pool of 45,000 applicants in 54 countries [8]. In addition to that, the attractiveness of Kenya in terms of entrepreneurial development led the way to the country hosting the 6th edition of the Global Entrepreneurship Summit in 2016. The event was held in the presence of President Barack Obama and presented the US government’s commitment to global entrepreneurship and highlighted the potential in the country [9], emphasising on the attractiveness of the country and the need for investment especially for women and young entrepreneurs [10]. What’s next? The increased government interest towards raising entrepreneurship and digital innovation and acceptance have raised an entrepreneurship-friendly environment, allowing entrepreneurs to connect with peers, create partnerships, boost knowledge and secure investment. While Kenya’s future looks very promising, there is no doubt that the development plans being pursued by its government to tackle corruption and improve education and infrastructure, in order to be in line with the increasingly competitive global startup landscape, will require much effort and continuous monitoring. Sofia Hazim, Analyst at Infomineo. Learn more about Sofia. Sources: [1] Google Consumer Barometer 2016 https://www.consumerbarometer.com/en/trending/?countryCode=KE&category=TRN-NOFILTER-ALL [2] Kate Baggaley, Mobile money helped 2 percent of households in Kenya rise out of poverty, (Dec 2016) http://www.popsci.com/mobile-money-helped-2-percent-households-in-kenya-rise-out-poverty [3]Sauti Za Wananchi, Money Matters: Citizens and financial inclusion in Kenya, (Dec 2016) http://www.twaweza.org/go/sauti-ke-2016-financial-inclusion [4] The Global Entrepreneurship and Development Institute, Kenya, Sub-Saharan Africa and Global Entrepreneurship in 2016, (July 2015) https://thegedi.org/kenya-sub-saharan-africa-and-global-entrepreneurship-in-2016/ [5] Robert Malit, 7 public sources of funding for Kenyan entrepreneurs, (Feb 2016) http://www.herbusiness.co.ke/public-sources-of-funding-for-kenyan-entrepreneurs/ [6] Elayne Wangalwa, Kenya leads Africa's internet access and connectivity, (Sep 2014) http://www.cnbcafrica.com/news/east-africa/2014/09/09/kenya-leads-internet/ [7] Mfonobong Nsehe, 30 Most Promising Young Entrepreneurs In Africa 2014, (Feb 2014) https://www.forbes.com/sites/mfonobongnsehe/2014/02/04/30-most-promising-young-entrepreneurs-in-africa-2014/2/#d403d176d00e [8] Capital Business, 75 Kenyans to benefit from Sh10bn Africa entrepreneurship program, (Oct 2016) http://www.capitalfm.co.ke/business/2016/10/75-kenyans-benefit-sh10bn-africa-entrepreneurship-program/?doing_wp_cron=1488385464.7398579120635986328125 [9] The United States Agency for International Development, (July 2015) https://www.usaid.gov/sites/default/files/documents/1860/Entreprenurship%20fact%20sheet.pdf [10] Global Entrepreneurship Summit 2015 http://www.ges2015.org/

The Development of Morocco’s IT Sector Morocco aims to position itself as a strategic hub in the Middle East and North Africa by becoming one of the top performing countries in the region in terms of Datacom infrastructure and IT business environment. The investment reform plan presented in July 2016 by Moulay Hafid Elalamy, Minister of Industry, Trade, Investment and the Digital Economy, marked a strategic step in the realisation of new reforms for building a competitive and efficient economic model. This article aims to provide a comprehensive overview of the reforms launched and initiatives taken to develop the Morocco Digital Program 2020. To continue its efforts in promoting Morocco as an attractive destination for outsourcing services and an anchor in the global digital movement, the government has lifted the ban made by the Telecommunications Regulatory National Agency (ANRT) over internet protocol (VoIP) services. In our previously published article, The VoIP ban in Morocco[1], we explained that the ban of VoIP could impact the operating costs of the companies in the sector and decrease the country’s competitive advantage in terms of telecom prices. According to a report published by The Brooking Institution in October 2016, the VoIP ban resulted in 320 million USD of economic loss for Morocco during the first half of 2016. In terms of digital progress, Morocco still struggles with disparities in access to computer technologies in crucial sectors. Even though 60% of Moroccans had access to the internet last year[2], the country’s 2016 network readiness index remains relatively low, ranking 78th out of 139[3]. According to the APEBI[4] Chairwoman, Saloua Karkri Belkziz, the development of a digital economy remains crucial to improving the positioning of the country. In order to exploit the full potential of ICT technologies, Morocco needs to develop a strong and dynamic program to establish itself as a competitive player globally. As an initial step, the MCINET[5] will launch the Moroccan Agency for Investment and Exportation Development (AMDIE) to engage in a competitive and high performing economic model. The agency will play a key role in ensuring the deployment of various programs and coordinate between the different actors, bringing together Morocco Export Agency and the Office of Trade Fairs and Exhibitions (OFEC). This structure will support investment at all levels based on elaborated roadmaps and create a real collective dynamic between the different actors. As an important step to further building the country’s international positioning, the MCINET launched a new Digital Program for 2020, subsequent to the Morocco Numeric 2013 Plan, emphasising the importance of introducing more diversification to improve the competitiveness of the country. According to Mr Elalamy, in order to “reach an emerging country status and enable all citizens to fulfil their aspirations, Morocco should attempt to create the conditions for a sustainable economic growth, in which investment acts as a catalyst”[6]. The Digital Program plans to accelerate Morocco’s digital transformation and reinforce the country’s status as a regional digital hub. The program consists of a 750 million USD investment in reducing the digital divide by 50% through the digitisation of administrative services, improved access to the internet through free Wi-Fi in public spaces and digital literacy programs[7], aiming to train over 39,007 ICT professionals by 2020. Overall Architecture of the Morocco Digital 2020 Strategy The Morocco Digital 2020 Strategy relies on 3 main pillars[8]: Pilar I: Boosting e-government services and fostering the dissemination of ICT usage among Moroccan households Pilar II: Positioning Morocco as a digital hub in French speaking Africa and enabling the development of BPO services with high added values Pilar III: Focusing on Human Resources to increase the regional competitiveness of the country and extend the potential growth of the market Morocco Digital 2020 Objectives Many initiatives have been launched in parallel to strengthen the e-consumer’s protection and enforce the market legislations. The General Confederation of Moroccan Enterprises (CGEM) implemented an “e-thiq@” label[9] that aims to categorise trading websites based on a list of criteria (i.e. commercial transaction, protection of consumer personal information, etc.). In recent years, Morocco tried to position itself as a strategic actor and to be on the frontline in terms of e-commerce and digital development. The country tried to extend its expertise in a wide range of IT areas, from offshoring to electronic payment and software development. According to a report published by the International Data Corporation, the Moroccan IT services market is expected to expand at an average annual growth rate of 10.3% in the coming years and is expected to reach $550 million USD by 2018. To achieve these ambitious plans the country should rely on the development of the telecoms and infrastructure sectors, improve information security regulations, and boost the public services. Mounia Bendraoui, Associate at Infomineo. [1] http://www.infomineo.com/the-truth-behind-voip-ban-in-morocco-and-its-economic-impact-on-the-country/ [2] http://www.internetworldstats.com/stats1.htm [3] http://reports.weforum.org/global-information-technology-report-2016/networked-readiness-index/ [4] Fédération marocaine des technologies de l'information, des télécommunications et de l'offshoring http://www.apebi.org.ma/ [5] http://www.mcinet.gov.ma [6] http://www.mcinet.gov.ma/~mcinetgov/en/content/launching-investment-reform-plan [7] https://www.oxfordbusinessgroup.com/overview/building-new-plan-and-updated-legislation-have-provided-boost-0 [8] https://www.oxfordbusinessgroup.com/overview/building-new-plan-and-updated-legislation-have-provided-boost-0 [9] http://www.cgem.ma/fr/Label-e-thiq@-CGEM

The Rise of Optimism in Africa For many decades, Africa has been regarded as the poorest continent in the world. Although significant challenges face the future development in Africa, a rise of optimism in several countries in the continent support the development and vision that the continent holds. A study conducted by the Pew Research Center demonstrated that there is a rise of optimism and hope for future generations in Africa, especially in terms of health care and education. The conclusions were supported by a survey asking respondents whether the next generations will grow in better or worse conditions than the previous ones.1 Although quantitative figures such as the slower GDP growth rate in Africa can portray a very different picture about the continent’s future economic state, its overall economic outlook is better than that of Europe and the Middle East. The optimist views reported in African nations correlate with the sustained growth that the continent has been experiencing over the past 14 years. Although the growth rate has been lower between 2010 and 2015 (3.3% per year) compared to the period from 2000 to 2010 (5.4% per year), 40% of Africa’s GDP has been generated by economies with accelerating yearly GDP growth.2 The sustained growth and advancements that Africa has been experiencing in the past decade started in the 90s. African countries implemented several macro-economic and political reforms that led to a change in the political, economic and regulatory environments. The heathier macro-economic situation in many parts of Africa has significantly decreased budget deficits, foreign debt and inflation. Moreover, these macroeconomic policies focused on increasing Africa’s international trade, with its largest trading partners being China and the EU.3 Economic and political reforms in the continent, such as the strengthening of the legal system and the increasing privatization of state-owned companies, have also played a major role in improving the regulatory environment for doing business. These structural changes stimulated markets and commerce and led to an increased level of investment and willingness to do business in Africa, a substantial increase in disposable income, and a developing tertiary sector. All of these factors and positive changes could explain the optimism observed among African citizens.3 Furthermore, evidence suggests that there is a positive future ahead for Africa in the next 50 years. A report published by the African Development Bank provides insights about the potential growth Africa is most likely to experience in the coming years based on the improvements and reforms made in the past decades. With the continent having abundant natural resources, combined with the economic reforms and improved political state, many African nations are attracting emerging economies such as China and Brazil that have spotted the investment potential in the continent. These advancements suggest that Africa will profit from its dynamic social and economic conditions, which would go in line with its projected positive future.4 Additionally, from a different standpoint, research indicates that the citizens’ optimism and positive views about their country’s future, positively correlates with economic growth. An article published by Bloomberg argues that pretending to be optimistic is still better for the economy than being pessimistic about a country’s long-term prospects, suggesting that optimistic people work harder, are more confident and live longer, which in turn positively affects business decisions.5 Despite many predictions supporting uncertainty in Africa, the circular causation between the effect of growth on increasing optimism and optimism on furthermore increasing economic growth, suggests that Africa’s future seems in good hands and holds opportunities for development. One might argue that exact predictions would be hard to guarantee, however, it is undeniable that Africa is on the road to change. Sofia Hazim, Analyst at Infomineo. Learn more about Sofia. Sources: [1] Katy Scott, Optimism is rising in Africa, here’s why, (Dec 2016) Link: http://edition.cnn.com/2016/12/16/africa/optimism-in-africa/ [2] Georges Desvaux and Acha Leke, Africa’s future? There’s a case for optimism, (Sep 2016) Link: http://www.iol.co.za/capetimes/business/africas-future-theres-a-case-for-optimism-2068354 [3] Ernest & Young, Africa 2030: Realizing the possibilities, (2014) Link: http://www.ey.com/Publication/vwLUAssets/EY-Africa-2030-realizing-the-possibilities/$FILE/EY-Africa-2030-realizing-the-possibilities.pdf [4] African Development Bank, Africa in 50 Years’ Time, The Road Towards Inclusive Growth, (Sep 2011) Link:https://www.afdb.org/fileadmin/uploads/afdb/Documents/Publications/Africa%20in%2050%20Years%20Time.pdf [5] Charles Kenny, How Optimism Strengthens Economies, (Jan 2015) Link: https://www.bloomberg.com/news/articles/2015-01-08/how-optimism-strengthens-economies

Aggregate data shows that the African continent remains one of the fastest-growing economies worldwide. However, many African countries still base their economy on the production and exportation of commodities, primarily crude oil, with a few value-added operations developed internally. Oil is a natural resource that commonly attracts a high amount of foreign investment and boosts the main economic indicators of a country. It can be easily used as a proxy for natural resource based economies. Moreover, due to the current commodity crisis for certain economies, with the barrel price sinking in 2014-15 to its lowest level since 2003[1], it is easier to highlight some differences in performance between oil producing and non-oil producing African countries. It is also important to highlight such differences since it provides an opportunity to assess the convenience and sustainability of a development process based on these natural resources. Oil and Non-oil Producing Countries Nineteen of the 54 African countries are currently oil producers, however, it is worth noting the number of produced barrels can considerably vary from one country to another. Those countries are home to about 56% of the African population.[2] Fig.1 - African crude oil producing countries[3] In terms of wealth, the gap between the two groups of countries is evident, when it comes to GDP and GDP per capita. Nevertheless, the growth rates for both indicators show how the recent trends are not necessarily related to the oil economy. In relative values, the non-producing countries show better performance than the producers, but the progress of the two groups of countries can be reasonably compared over the years. Fig. 2 – GDP in USD bln[4] Fig. 3 – GDP growth[5] Fig. 4 – GDP per capita in USD[6] Fig. 5 – GDP per capita growth[7] It is easy to identify the higher impact that the 2014-15 price crisis had on oil-producing countries, whose overall GDP and GDP per capita fell by 10.0% and 12.2% respectively in 2015. The same crisis could have also been an important factor in the good export dynamics. As the following chart shows, the oil-producing countries’ export precipitated in 2015 (-49.0%), as a result of a negative trend during the last five years. Even the export from non-oil producing countries fell during the same period, but the overall decrease is moderate (-2.0%). Fig. 6 – Export of goods in USD bln[8] Fig. 7 – Export of goods growth (decrease)[9] In terms of attractiveness, the oil economies continue to attract the most attention from foreign investors, despite the fall in oil prices. The producing countries received increasing FDI (+4,7%) with a fluctuating trend in the course of the years. In the last years, the oil-free countries received around 21% to 56% fewer inflows compared to the oil producers, yet still showing an overall +1.0% growth. Fig. 8 – FDI inflows in USD bln[10] Fig. 9 – FDI inflows growth[11] Beyond indicators strictly related to the economy, it is interesting to recognise how the richer oil-producing countries are on average more developed than the others. With reference to human development aspects such as life expectancy, education, and income per capita (enclosed in the elaboration of the Human Development Index), the African oil producing countries show better performance than non-producers. The following chart shows this gap, despite the fact that HDI growth trends are comparable among the two groups of countries. Fig. 10 – Human Development Index[12] Consequences and Recommendations The recent crash in oil markets and commodity prices has harshly affected the global economy, with no immunity offered to developing countries. Saudi Arabia for instance, once thought immune to the downturn in oil prices, was recently declared at the verge of bankruptcy and forced to make its first international bond sale[13] to bring in necessary cash. In Nigeria, the falling oil prices have been claimed to have “a painful effect” on the country’s economy, with the necessary slowdown of the production and a negative impact on the rest of the industry[14]. In Angola, the oil crisis is believed to have unmasked how poorly managed the country really was in the last decade, giving visibility to all the economic and social deficiencies that were concealed by the high growth percentages[15]. Even some non-producing countries have been affected by the negative situation. For example, in Mozambique the realisation of various large projects aiming to benefit from the country’s natural gas resources, whose selling price is strictly related to oil price, has been continuously delayed these past years. This conjuncture created a series of erroneous expectations leading the country into a major economic downturn, with the government taking on more debt assuming an easy repayment, once revenue from LNG started flowing[16]. The IMF pointed out how most of the African countries where energy and mining exports accounted for a larger share of GDP will need to make “sizeable adjustments” to their domestic spending. On the other hand, countries that have invested in infrastructure and strengthened domestic consumption are all expected to grow at rates between 6-7% and more in the next few years. This is the case for the Ivory Coast, Kenya, Rwanda, Senegal and Tanzania[17], leading to the clear but not so obvious conclusion that diversification is an inescapable factor for sustainable growth. Antonio Pilogallo, Associate at Infomineo. Learn more about Antonio. [1] Source: http://www.bbc.com/news/world-35345874. [2] Source: Infomineo analysis on WB data [3] Source: https://www.cia.gov/library/publications/the-world-factbook/rankorder/2241rank.html. Given the very small amount of crude oil production, Morocco has been considered as a non-producing country. [4] Source: Infomineo analysis on WB data [5] Source: Infomineo analysis on WB data [6] Source: Infomineo analysis on WB data [7] Source: Infomineo analysis on WB data [8] Source: Infomineo analysis on UN Comtrade data [9] Source: Infomineo analysis on UN Comtrade data [10] Source: Infomineo analysis on UNCTAD data [11] Source: Infomineo analysis on UNCTAD data [12] Source: Infomineo analysis on UNDP data [13]Source: http://www.forbes.com/sites/timdaiss/2016/10/23/we-are-doomed-to-bankruptcy-unless-changes-made-says-saudi-official/#6e9b68d24471 [14] Source: http://www.bbc.com/news/world-35345874 [15] Source: https://www.washingtonpost.com/news/worldviews/wp/2016/08/02/how-the-crash-in-oil-prices-devastated-angola-and-venezuela/?utm_term=.816db1e8ab7d [16] Source: http://ww2.frost.com/frost-perspectives/impact-oil-and-gas-price-slump-mozambiques-economy/ [17] Source: https://www.weforum.org/agenda/2016/04/10-things-the-imf-wants-you-to-know-about-africas-economy

Although sub-Saharan Africa has not been famous for its status as a leader in female inclusion within the economic sector, African women are surprisingly beating the odds and defying the obstacles in the field of entrepreneurship in the region. High Female Entrepreneurship Rate Holding a comparison between some of the most developed economies in Africa and in other regions, Nigeria outranks the US and the UK in terms of percentage of entrepreneurs among women with a rate of 41% for the African country against 10% and 5.7% for the two developed countries respectively. Yasmin Belo-Osagie, co-founder of the organization She Leads Africa, stated that, “Sub-Saharan Africa has the highest rate of female entrepreneurship across the globe, with more women starting businesses in Africa than anywhere else in the world.” The extent of the presence of female entrepreneurs is, however, not symmetrically spread across all African countries. Some strong leaders do drive up the rate in the region, namely Kenya, Ghana, Nigeria and Zambia. In fact, the percentage of female entrepreneurs in the three latter surpasses 50% of their total pool of entrepreneurs. Barriers to Female Entrepreneurship The aforementioned figures become even more impressive when considering that the road for African female entrepreneurs is not paved with roses. Women entrepreneurs are facing and circumventing various obstacles pertaining to the social context prevalent within their countries. The dominant culture in sub-Saharan countries is still one that expects women to hold a traditional role confined to home making and child rearing. This has been supported by a study published by the French Development Agency in 2013, which reported that “Time surveys from 11 cities in sub-Saharan Africa show that women spend more time on domestic activities than their male counterparts regardless of household status—head of household, wife, or daughter.” Hence, society might not be open to female entrepreneurs pursuing business ambitions that would take them away from their homes. Business is all about networking. Well, that’s another closed door in the face of African women. Indeed, most networking events take place in mostly male-dominated venues, such as bars of membership clubs, where a woman’s presence by herself might be ill-perceived by social standards. African female entrepreneurs also have limited access to finance in comparison with their male counterparts. Experts estimate the unmet yearly financial needs for women-owned businesses worldwide to be between $260 billion and $320 billion. According to the 2014 Findex report, only 30% of women in sub-Saharan Africa have access to bank accounts. Besides, women in Nigeria and other developing economies have shown to be 20% less likely than men to have a bank account and 17% less likely to have borrowed formally. Factors such as legal restrictions on women to open bank accounts without a male relative’s authorization do contribute to the low account penetration rate among women in the region. Initiatives for Female Entrepreneurship Development Despite the presence of these barriers, there are various development initiatives set in different African countries aiming to alleviate the difficulties and promote female entrepreneurship. In east Africa, 1,200 micro-businesses and 200 small and medium businesses benefited from the Women’s Entrepreneurship in Renewables Project (wPOWER) since its launch in 2013 by the U.S. State Department. The aim of the project was to train female solar entrepreneurs in business management and project financing. In Zambia, the “WECREATE” program launched by USAID has mentored 28 female potato farmers in 2015 on how to expand their business operations. MasterCard has, on its part, committed to three partnerships directed at promoting women entrepreneurship in Egypt, Nigeria and South Africa. These partnerships will be centered on providing young African women with the necessary education, training and mentorship to develop financial literacy, and providing them with easy access to a network of women with an interest in entrepreneurship. Empretec, a capacity-building program created by the United Nations Conference on Trade and Development (UNCTAD) that assists aspiring and female entrepreneurs in strengthening their entrepreneurial and business skills, was recently launched in Kenya, Ghana and South Sudan. The second batch of 40 female entrepreneurs completed the Empretec course on entrepreneurial skills in South Sudan in October 2016. The legal situation in the region is improving as well. According to the World Bank’s 2014 Gender at Work Report, sub-Saharan Africa has reduced the number of gender discriminatory laws against women, mainly regarding property ownership and inheritance rights, by more than half between 1960 and 2010. To sum it all up, African female entrepreneurs are fighting their way to the top despite discouraging cultures and unfavorable business environments with the increasing support of international organizations, local governments, and corporate sponsors that channel their resources and expertise into helping female entrepreneurs fulfill their ambitions. Meryem Khaled, Associate at Infomineo References [1] http://www.idgconnect.com/abstract/10416/sub-saharan-africa-highest-female-entrepreneurship-rate-globally [2] http://documents.worldbank.org/curated/en/884131468332686103/pdf/892730WP0Box3800report0Feb-02002014.pdf [3] http://thenationonlineng.net/financial-inclusion-can-boost-women-entrepreneurship-others/

Rwanda is repeatedly associated with the 1994 genocide, in which a million people were killed. Today, the small East African country is unified, breaking old stereotypes to move towards political, social and economic progress. In fact, the government has launched in 2000 a long-term development strategy “Rwanda 2020”. The goal of this program is to transform the country from a low-income agrarian economy to a medium income export-oriented and knowledge-based economy. Rwanda ICT Sector Information and Communication Technology is an essential element to drive the transformation of Rwanda to a knowledge-based economy. Rwanda is among the fastest growing African countries in several fields of ICT: e-commerce and e-services, mobile technologies, applications development and automation. The first factory unit of hardware is installed in Rwanda “Positivo” and has started operations. So, it should not be surprising if you see, in the near future, laptops, tablets and other electronic devices with a label made in Rwanda. In addition, Rwanda is considered a regional center for the training of professionals and researchers on communication technologies. Quick Facts Government Support Projects in ICT Kigali Technopole: a center dedicated to ICT development and research in Africa with a focus on applications relevant to the African markets. The center is driving Rwanda into a modern knowledge-based economy. It provides ICT solutions beyond borders in Africa and the rest of the world. Technopole is expected to attract skilled ICT professionals and worldwide companies. KLab (knowledge Lab): is an open technology hub in Kigali where students, fresh graduates, entrepreneurs and innovators come to work on their ideas and projects to turn them into viable business models. The aim of the project is to encourage young entrepreneurs to develop their technology-oriented ideas into products and future companies. 4G (LTE): The Rwandan Government, in partnership with the South Korean telecommunications provider KT Corporation, is rolling out a high-speed 4G (LTE) broadband network across the country. The network is expected to cover 95% of the population within three years. ICT : A Real Driving Force for the Economy The government relies on the development of the ICT sector, not only to bring investment and create jobs but also to enable the advancement of Rwandan public services including education, health care, and Finance. Education: Rwanda has taken a step ahead to improve its education system and now stands as a model in Africa. The government implemented the One Laptop per Child (OLPC) program which has played a key role to introduce technology in primary schools. It also allows primary schools’ students early access to computer skills and computer science while expanding their knowledge on specific subjects like science, mathematics, languages and social sciences through online research or server-hosted content. According to the Ministry of Education, 56% of primary schools have access to computers, while 8% of them have access to internet. Healthcare: Rwanda Health Management Information System (R-HMIS) has covered over 500 health facilities in the past two years. Many modules have been added to the system such as death audit reporting for all maternal, Neonatal, and child deaths, Community Health Information System, eTB-a patient level system for tracking MDR (multi-drug resistant) to patients as well as the HIV reporting and disease surveillance system which is currently being transitioned. According to the Ministry of Health, the percentage of health centers connected to internet reached 93.8%. The number of clinical emergencies supported through RapidSMS is 25%, while number of patients at community level tracked using RapidSMS reached 173,131. Finance: Mobile money subscribers across all networks have reached 6,480,449 which was more than twice the number of subscribers in the previous year. The number of mobile money transactions reached USD 824.6 million compared to USD 394 million amount transacted in the year before. (Data & Statistics 2014) Younes Baidada, Senior Analyst at Infomineo. References [1] Ministry of Youth and ICT, Rwanda ICT Highlights 2014, (Mar 2015) Link: http://www.myict.gov.rw/press-room/latest-news/latest-news/?tx_ttnews%5Btt_news%5D=216&cHash=3ab7393897aff0a46d7f29612935c05e [2] Ministry of Youth and ICT, Rwanda ICT Sector-Profile 2014, (Mar 2015) [3] National Bank of Rwanda, Foreign Private Capital in Rwanda, (2015) [4] Press: The New Times, Rwanda Powering Ahead with ICT, (Feb 2016), link: http://www.newtimes.co.rw/section/article/2016-02-04/196744/ [5] Press: CIO East Africa, Rwanda Leads the Way in Demonstrating How ICT Can Fund Development, (Aug 2016), link: http://www.cio.co.ke/blog/rwanda-leads-the-way-in-demonstrating-how-ict-can-fund-development [6] Press: The New Times, Korea Pledges More Support Toward Rwanda’s ICT Sector, (Oct 2016), link: http://www.newtimes.co.rw/section/article/2016-10-05/204184/ [7] Press: The New Times, Kigali Trade Zone to Host ICT Park, (Jan 2013), link: http://www.newtimes.co.rw/section/article/2013-01-15/61849/ [8] Press: The New Times, Why this South American Company is Making Laptops in Rwanda, (Jul 2016), link: http://www.newtimes.co.rw/section/article/2016-10-05/204184/

Is the Italy-Africa relationship taking off? Africa has been one of the fastest growing region in the last decade, holding for long periods the highest rate of return on foreign investment than in any other developing region[1]. Despite a recent slowdown in term of GDP growth rate, there are at least three positive trends that are sustaining Africa’s attractiveness[2]: By 2034, Africa is expected to have the world’s largest working-age population (1.1 billion), Households and business consumption are expected to growth, mainly due to the urbanization processes, African economies are well positioned to benefit from rapidly accelerating technological change. This perspective led the African region to receive USD 54 Billion of FDI in 2015[3]. In this context of opportunities, how does Italy position itself, in terms of actual and perspectives footprint? The past Starting since 1882, Italy has been a colonial power as well as other European countries were, although its presence in Africa evolved in a different way and lead to different historical and socio-economics consequences. In the period of maximum expansion, the Italian colonial possessions covered less than 4% of the overall colonial surfaces, including three African territories (Libya, Somalia, and Eritrea) to which would be later added Ethiopia.[4] Since the end of the Second World War and the progressive loss of colonial possessions, Italian presence in Africa went decreasing, especially when compared to other countries, relegating Italy to a secondary role in terms of economic footprint. The present Today, among the WTO countries, Italy is the 7th mayor exporter to Africa and the total value of the exported goods and services exceeded USD 26 Bln in 2014. Italy to Africa export[5] It is worth to highlight how between 62% and 65% of total Italian export to African countries can be attributed to six main product categories, as the following chart shows[6]. These categories include product like: Machinery and mechanicals appliances, including: dishwashing machines; machinery for cleaning or drying bottles or other containers; turbojets, turbo-propellers and other gas turbines; taps, cocks, valves and similar appliances for pipes, boiler shells, tanks Mineral fuels, mineral oils and products, especially including petroleum oils and oils obtained from bituminous minerals (excl. crude) Electrical machinery and equipment: electrical apparatus for switching or protecting electrical circuits, transformers, converters, wires and cables Iron and steel like bars and rods Vehicles and parts: tractors, motor vehicles for the transport of ten or more people, cars, vehicles for the transport of goods Articles of iron and steel: structures and parts of structures, tubes and pipes, etc. Among African countries, the following markets stand out in terms of size and popularity of Italian products: Tunisia and Morocco, given the geographical proximity South Africa, which is believed to hold about 50% of the overall purchasing power of the continent[7] Ethiopia, to which Italy is bound by mentioned historical reason. The following chart shows the recent trends for the top African market, in terms of value of overall value of products imported from Italy[8]. As for direct investment in African countries, Italian outward flows have considerably increased in the last years, as the following charts show. Italian investment flows in Africa[9] This become particularly relevant when compared to other countries flows, especially because Italy showed no divestments in the last years. The African business environment for Italian companies increase its attractiveness thanks to the strong presence and dynamism of some huge operator. The most relevant among them could be ENI, the national oil company, whose footprint is already well established in 14 countries[10], but also expanding in others – how shown by the exploration permits recently obtained in Morocco[11]. But Africa is also where several entrepreneurial Italian success stories took place, like the case of Mr. Gabriele Volpi’ Orlean Invest, major player in the field of logistics in Nigeria, Angola and Mozambique[12]. The future On May 18th 2016, the biggest Italian ministerial conference ever realized about Africa took place in Rome. In the presence of the institutional leaders, a delegation composed by high-level representatives from 52 African countries met the heads of the most important Italian economics and cooperation bodies, to discuss about migrations, economic and socio-environmental sustainability, peace and security.[13] The Prime Minister Matteo Renzi made clear how Africa became the new priority for the Italian foreign policy. Renzi himself addressed to African countries 3 trips in the last two years (Angola, Mozambique and Congo-Brazzaville in 2014; Ethiopia and Kenya in 2015; Nigeria, Ghana and Senegal in 2016)[14]. Happening for the first time since the foundation of the Italian Republic, this circumstance reveals a strong willing in strengthen the bilateral relationships between the “Bel Paese” and the African economics. Antonio, Analyst at Infomineo. Know more about Antonio. [1] Source: http://www.mckinsey.com/global-themes/middle-east-and-africa/whats-driving-africas-growth [2] Source: https://www.weforum.org/agenda/2016/05/what-s-the-future-of-economic-growth-in-africa/ [3] Source: World Investment Report 2016: http://unctad.org/en/PublicationsLibrary/wir2016_Overview_en.pdf [4] Source: http://www.treccani.it/scuola/tesine/centocinquant_anni_anni_di_guerre_e_di_pace/rabuiti.html [5] Source: Infomineo analysis on ITC data [6] Source: Infomineo analysis on ITC data [7] Source. http://www.investireinsudafrica.org/?page_id=1201 [8] Source: Infomineo analysis on ITC data [9] Source: Infomineo analysis on OECD data [10] Source: ENI 2015 annual report: https://www.eni.com/docs/en_IT/enicom/company/integrated-annual-report-2015.pdf [11] Source: https://www.eni.com/en_IT/media/2016/03/eni-enters-into-the-upstream-of-morocco [12] Source: http://www.orleaninvest.com/ [13] Source: http://www.vita.it/it/article/2016/05/18/italia-e-africa-si-corteggiano/139435/ [14] Source: http://www.rivistaeuropae.eu/esteri/esterni/lafrica-priorita-politica-estera-litalia/

Infomineo conducted an analysis of the leading strategy consulting firms’ footprint in Africa. For this purpose, a benchmark of the six largest management consulting firms has been conducted, including McKinsey & Company, Bain & Company, The Boston Consulting Group, A.T Kearney, Roland Berger Strategy Consultants, and Strategy& (formerly Booz & Company). The research covered all types of functions and roles including Partners, Consultants, Research, Knowledge & Analytics, Support/ Internal Services, and others. Infomineo’s research covered all Africa, with a focus on the seven countries where these companies had a footprint: Angola, Egypt, Ethiopia, Kenya, Morocco, Nigeria and South Africa. Discover the key results of the study in the infographics below. Do not hesitate to contact us to get the full study and discover the Middle East benchmark as well. Access the Infographic: Consulting Footprint in Africa

Ethiopia is a landlocked country split by the Great Rift Valley. It is located in the Horn of Africa, bordering six (6) countries: Djibouti and Somalia to the East, Eritrea to the North and Northeast, Kenya to the South and Sudan and South Sudan to the West. With a population of 94 million (2013) growing at annual rate of 2.5% in 2014, Ethiopia is the second-most populous country in Africa (Moller, 2016). The country is the place of origin for the coffee (Arabica) bean and sometimes referred to as the land of natural contrasts, home to vast fertile West, jungles, and numerous rivers, and also the world’s hottest settlement of Dallol in its North. The real gross domestic product (GDP) growth averaged at 10.9% between 2004 and 2014, which has leapfrogged and positioned the country to become a middle-income country by 2025, after being the second poorest country in the world in 2000 (Moller, 2016). Powered by considerable public infrastructure investment, Ethiopia has witnessed a rapid and stable economic growth, in addition to a decrease in poverty to 30% from 44% in the past decade. Role Agriculture in Ethiopian economy Agriculture is the mainstay of the Ethiopian economy, contributing 41.4% of the country’s gross domestic product (GDP), 83.9% of the total exports, and 80% of all employment in the country (Matousa, Todob, & Mojoc, 2013). Put in perspective, Ethiopia’s key agricultural sector has grown at an annual rate of about 10% over the past decade; much faster than population growth. Other important sectors are service and industrial sectors contributing 43% and 15.6% respectively (The World Factbook, 2016). On agriculture expenditure related metric, Ethiopia has dedicated an annual investment of about 14.7% of all government spending to the agriculture sector since 2003. Ethiopia is among the few African countries that have consistently met both the African Union’s Comprehensive Africa Agricultural Development Program (CAADP) targets of 10% increase in public investment in agriculture by the year 2008 and boosting agricultural production growth by 6% at least by 2015. Although agriculture is one of Ethiopia’s most promising resource, the sector has been slowed down by periodic drought, high levels of taxation and poor infrastructure that often make it hard and expensive to get goods to market. Also, overgrazing, deforestation and high population density has led to massive soil degradation leading to low productivity. The above problems have made it hard for the country to feed itself—best exemplified by the dramatic 1984-85 famine. Since then, the country has experienced similar occurrences that expose a sizeable population to humanitarian needs. As things stand, over 3 million Ethiopians need food and other humanitarian assistance annually (SIDA, 2015). However, a critical look at the sector shows a high potential for self-sufficiency in grains and also for the development export especially for livestock, vegetables, fruits and grains. Further, many other economic activities depend on agriculture. These include processing, marketing and export of agricultural products among others. Sectoral overview Ethiopia has about 51.3 million hectares of arable land. However, just over 20% is currently cultivated, mainly by the smallholders. Over 50% of all smallholder farmers operate on one (1) hectare or less. Smallholder producers, which are about 12 million households, account for about 95% of agricultural GDP. Agricultural production is mainly subsistence, and a large portion of the country’s commodity exports is provided by the small agricultural cash-crop sector. Key agricultural sectors Coffee & tea; Ethiopia has a great potential for coffee production, thanks to the country’s abundant rainfall, optimum temperatures, conducive altitude and fertile soil. Over 60% of Ethiopian coffee is produced as forest coffee, and therefore the use of fertilizers is usually unnecessary as the falling leaves enrich forest floor. Also, the use of chemicals such as pesticides, fungicides among others is limited since the high genetic diversity in the forest creates a balance between parasites and pests (Ethiopian Coffee Exporters Association, 2016). Ethiopia is Africa’s largest coffee producer, and the fifth world’s producer contributing some of the world’s finest coffees. The country accounts for over 3% of the global coffee market. Coffee is by far the country’s largest foreign exchange earner. In 2013/14, Ethiopia exported 190,734 metric tons earning US$ 749 million. Some of the major destinations of the Ethiopian coffee are Germany, Saudi Arabia, Japan, USA, Belgium and France, importing over 70% of the country’s total coffee exports (Tefera, Abu, 2015). While Ethiopia has a potential to grow all types of tea, the country produces only black tea, with a production capacity of 7,000 tons of black tea per annum. According to the country’s ministry of industry, the tea industry has been lacking investment (Ethiopia’s Ministry of Industry, 2016). Thus, investment potential exists in large-scale commercial tea production as well as modern tea packing and blending industries. Cereals; In FY 2014/15, cereals’ overall agricultural production increased by 45% (EUBFE, 2015). Maize, for instance, is one of the most important crop in Ethiopia of which the country is Africa’s second biggest maize producer. Mainly grown in SNNPR and Oromia regions in about 1.77 million ha. Other important cereals are wheat and barley mainly in Oromia and some parts of Amhara Regions in about 1 million ha and 1.4 million ha respectively. There are also opportunities for wheat production under irrigation in the SNNPR, Afar, Gambella and Somali Regions. Livestock & Fishery sector; Ethiopia’s livestock population is believed to be the largest in Africa, and tenth in the world. The sector accounts for about 10% of Ethiopia’s export income, with leather and leather products making up 7.5% and live animals 3.1%. The country is home to about 49 million heads of cattle, 22 million heads of goats, 17 million heads of sheep and 38 million chickens. The country also has demonstrated potential for fishery development in its freshwater lakes, reservoirs and rivers. Other investment potential areas in this sector include fish, milk & meat processing, raising and fattening of sheep, goat, cattle and camel (Ethiopia’s Ministry of Industry, 2016). Ethiopia’s Investment potential Ethiopia’s economy is growing with a wide range of opportunities for investment. However, Ethiopia remains an unexploited market and untapped for investors. Out of the total investment projects approved between 1992 and 2012, FDI’s share accounted for about 15.8%, with China, India, Germany, Italy, Sudan, Turkey, Saudi Arabia, Yemen, the UK, Israel, Canada and the US being the major source of FDI. While that was a great progress going with the country’s history, there has only been a slight increase since 2012 both in the total number of projects and capital invested (Ethiopian Investment Commission, 2015). The country’s continued public investments in infrastructure is remarkable as well as its new industrial policy geared towards diversification and transformation of the economy (EUBFE, 2015). Ethiopia has competitive advantages in agriculture and agro-processing and sugar owing to the country’s favorable climatic conditions and types of soil suitable for the production of a variety of crops. The conditions are suitable for growing major food crops such as cereals, pulses, and oilseeds. Some of the sectors that also have great potential for investment include organic coffee cultivation, sugar cane, tea and spices, cotton (and textile), a broad range of fruits and vegetables and cut flowers. Ethiopia’s competitive market access Apart from a population of around 94 million people (2013) positioning Ethiopia as potentially one of Africa’s largest domestic markets, the above sectors are equally suitable for the fast-growing export market. By virtue of being a COMESA member, bringing together 19 countries with a total population of 400 million, Ethiopia also has preferential market access to these countries. The country’s closeness to the Middle East also gives potential market opportunities in addition to qualifying for preferential access to the EU market under the EU’s Everything-But-Arms initiative and to the US markets under the AGOA and the Generalized System of Preference (GSP). Ethiopian products have access to these markets quota and duty-free. Erickson Oduya, Research Associate at Infomineo – Know more about Erickson References Agricultural Transformation Agency. (2015). Annualy Report, 2013/14: Transforming Agriculture in Ethiopia. Addis Ababa: ATA. Retrieved from http://bit.ly/2anaCE8 Ethiopian Coffee Exporters Association. (2016, July 24). Major Growing Areas. Retrieved from ECEA: http://bit.ly/2agk7WM Ethiopian Investment Commission. (2015). Ethiopia: A Preferred Location for Foreign Direct Investment in Africa. Addis Ababa: Ethiopian Investment Commission. Retrieved from http://bit.ly/2a5fIUw Ethiopia's Ministry of Industry. (2016, July 24). Agricultre Sector Investment Opportunities. Retrieved from Ministry of Industry: http://bit.ly/2aiahov EUBFE. (2015). Ethiopia Economic and Trade Report. Addis Ababa: European Business Forum in Ethiopia. Retrieved from http://bit.ly/2a1uQY6 Matousa, P., Todob, Y., & Mojoc, D. (2013). Roles of extension and ethno-religious networks in acceptance of resource-conserving agriculture among Ethiopian farmers. International Journal of Agricultural Sustainability 11(4) , 301-316. Moller, L. C. (2016). Ethiopia’s Great Run: The Growth Acceleration and How to Pace It. Washington, D.C.: World Bank. Retrieved from http://bit.ly/29HrOTI SIDA. (2015). Ethiopia's Humanitarian Crises Analysis. Addis Ababa. Retrieved from http://bit.ly/29S64Iv Tefera, Abu. (2015). Ethiopia Coffee Annual MY15/16. USDA FAS. Retrieved from http://bit.ly/1FJj345 The World Factbook. (2016, July 11). Ethiopia Country Profile. Retrieved July 15, 2016, from http://bit.ly/1yAYHLA

Public debt in Mozambique: Consequences and perspectives During the last months, Mozambique has been facing a complicated situation from an economic and financial point of view, which granted a big international media exposure to the country, as well as consequences to the public and private sector. At the center of the storm are loans contracted by three state companies: Ematum: USD 850 million debt contracted in 2013 for purchasing of 24 fishing boats and six military speedboats for maritime protection, Proindicus: USD 622 million loan to provide security for oil and gas operations in the Rovuma Basin, and more generally for shipping in the Mozambique Channel, Mozambique Asset Management: USD 535 million loan for the company established to provide maritime repairs and maintenance. This debt has been contracted during the government of the former president, Armando Guebuza. With the exception of the Ematum’s, the existence of those large amount of borrowing had not previously been disclosed to the International Monetary Fund until March 2016, despite a previous agreement with the Mozambican government that required to report any debt-related transactions to ensure full accountability of the government to its citizens and Parliament.[1] These three loans between them amount to over 20 per cent of the country’s total foreign debt of USD 9.89 billion, and around 17 per cent of the total public debt of USD 11.64 billion. The discovery of this debt resulted into multiple consequences[2]: PUBLIC AID IMF has stopped the disbursement of a USD 55 million loan and had suspended lending, as the country had violated the terms of the USD 283 million rescue loan agreement made in December 2015.[3] PUBLIC AID The World Bank not only interrupted direct financial aid to Mozambique, intended for funding individual investment projects, but also held back payments of approximately $40 million for direct budgetary support. Hereafter all the 14 top budget donors, including Sweden, the European Union, the United Kingdom and the African Development Bank, suspended their budget support for a total amount of USD 467 million for 2016, which is 12 per cent of all public expenditure. [4] PUBLIC SECTOR Despite the suspension will not affect the full 12 per cent, since some donors had already begun disbursing aid for 2016 before the scandal came out, the Minister of Finance Adriano Maleiane said the government is making cuts in public expenditure including restrictions on the use of fuel, reduction in travel by government delegations and the suspension on hiring new staff for the state. However, he pledged that education and health will be the last to be affected.[5] INTERNATIONAL CREDIT RATING Before the loans were disclosed, Mozambique’s debt risk profile was considered moderate by the IMF. The newly disclosed debt is expected to shift the country’s debt risk to high. On April 2016, Fitch Ratings has downgraded Mozambique from B to CCC, since the debt to GDP ratio is already 83% and with expected continued devaluation. [6]On March 2016, Standard & Poor had also downgraded Mozambique sovereign rating to CC.[7] PRIVATE SECTOR On a recent conference held in Maputo, the chairman of ENH, the state owned Hydrocarbons Company, Omar Mithà stated that the flagship LNG export project will not be affected by the debt crisis, since the Rovuma Basin O&G investments are regarded as projects on their own, with their own financial basis and legal framework.[8] However, there are other sectors where companies owned by the state play an important role, as energy and infrastructures that could be partially affected by the debt situation. PERSPECTIVES The Government is willing to give the companies that benefited from government guarantees their responsibilities. Business plans from the three companies have been solicited, so that it can be assessed their ability to pay. On one hand, Maleiane didn’t even reject the possibility of selling off the companies’ assets to help pay the debt. On the other hand, the ability to pay will depend entirely on whether oil and gas companies (such as the American Anadarko, or the Italian ENI) or shipping companies operating in Mozambican waters, are willing to pay for their services. On a recent press conference held in Maputo, President Filipe Nyusi compared Mozambique as a house where malaria has been just detected and donors as parents that won’t let their child enter because of the presence of mosquitos. He confirmed how the Government will work together with the financial institution in order to disinfect the house and return to a normal life.[9] Antonio Pilogallo, Associate at Infomineo. Know more about Antonio. [1] Press: Club of Mozambique, AIM: http://clubofmozambique.com/news/mozambican-public-debt-now-us11-64-billion-pm/ [2] Press: Club of Mozambique, AIM: http://clubofmozambique.com/news/mozambiques-finance-minister-warns-of-immediate-public-expenditure-cuts/?platform=hootsuite [3] Press, Wall Street Journal: http://www.wsj.com/articles/imf-cancels-mozambique-credit-meeting-following-wsj-report-1460733681 [4] Press, Wall Street Journal: http://www.wsj.com/articles/world-bank-is-suspending-direct-financial-aid-to-mozambique-1461775025 [5] Press, AllAfrica: http://allafrica.com/stories/201605060667.html [6] Ficht Ratings: https://www.fitchratings.com/site/fitch-home/pressrelease?id=1003700 [7] Press, Bloomerang: http://www.bloomberg.com/news/articles/2016-03-15/mozambique-s-rating-cut-by-s-p-to-cc-on-tuna-bond-restructuring [8] Press, Interfax: http://interfaxenergy.com/gasdaily/article/20137/moz-debt-crisis-will-not-affect-lng-finance-enh [9] Press, Club of Mozambique, LUSA: http://clubofmozambique.com/news/disinfecting-the-house-banishing-the-mosquitoes-nyusi-compares-hidden-debts-to-malaria/

On Tuesday 19th of April, Egyptian media announced that the US Dollar exchange rate exceeded 11 EGP in the black market; a news that caused unprecedented panic across all sectors of the Egyptian society. On the other side, Tarek Amer, Governor of the Central Bank of Egypt (CBE), has denied any intention of devaluing the Egyptian Pound below its current value (0.11 USD), he also blamed the US Dollar hike on informal market speculation, where the demand comes from importers attempting to duck CBE’s restrictions that prohibit banks from trading US Dollars in the formal market to cover the imports of non-essential goods.[1] To address this problem, CBE has recently revised the mechanism for providing US Dollars to the banks in the Egyptian market. Before that, CBE was using a quote system by selling a fixed volume in US Dollar at weekly auctions, the new mechanism requires banks to submit requests detailing investors to the CBE, and then the CBE creates reports about investors before allocating US Dollars to oblige banks to allocate the currency in the products approved by the CBE for imports[2]. Beside this mechanism, the CBE has exerted a lot of efforts to curb the black market speculations through currency devaluation, shutting down violating currency exchange companies and eased restrictions on Dollar deposits from 50,000 USD to 250,000 USD for importers of food, machinery, spare parts, capital goods and medicine while kept it the same for individuals.[3] But those actions seem to have failed; as the Egyptian Pound kept depreciating against the US Dollar, this event started a widespread debate across the Egyptian media about the inevitability of devaluating or rather floating the Egyptian Pound. JP Morgan, a US-based financial services firm, expected in a report issued on the 15th of March, that the Egyptian Pound will be devalued by 35% in 2016, 14% of the 35% devaluation will be through the CBE beside further progressive changes. The report also added that this result will end up with an International Monetary Fund (IMF) loan before the end of the fiscal year. And it is quiet known, that the IMF requires structural reforms in the economy to reduce government expenses and to increase revenues which is referred to by Fiscal consolidation, and also oblige government to decrease subsides and protective measures. Eventually, the Egyptian government will be between the hammer of tough economic decisions and the anvil of economic failure. [4] For the Egyptian Economy that depends mainly on imports devaluating or floating the Egyptian Pound is viewed as a Big no-no!, because since devaluation or floating was introduced in the mid-seventies, the inevitable result was a dramatic increase in prices, which will burden the mid and low income classes in Egypt. The first actual floating of the Egyptian Pound was executed by President Sadat in 1977- first actual floating but implicitly executed along with other austerity measures that lead to 1977 Egyptian bread riots, EGP lost 50% of its value - at this time Egypt was in a budget deficit due to war spending in the period from 1967-1973, the Egyptian government back then started external borrowing to cover its debts which is known by “Paris club debts”; but along with the failure in balancing government budget, lack of Arab investment and economic inactivity in the eighties, private sector started to borrow in US dollars which lead to the bankruptcy of several businesses, and the US Dollar crisis officially began to take place, where US Dollar exchange rate became 0.8 EGP instead of 0.4 EGP.[5] As the figure shows, the USD exchange rate kept rising since 1968 and it reached its peak after floating the Egyptian pound in 2003. Floating the Egyptian Pound was first introduced in 2003 - Public First acquaintance with the term - when the Egyptian government chaired by Atef Ebied decided to float the Egyptian Pound, this decision lead to the depreciation of the Egyptian Pound against the US Dollar by 50%. The US Dollar exchange rate before floating the Egyptian Pound was 3.40 EGP, but afterwards it reached 5.50 EGP, then 7 EGP, then it stood at 6.20 EGP, this action lead to a dramatic increase in prices shown the figure below. Figure shows dramatic increase in inflation rates after 2003 where Egyptian government started to float the Egyptian pound, and in 2008 after the international financial crisis. After the international financial crisis in 2008, the situation was aggravated as Egypt suffered an economic setback reached its peak in 2011 after the 25th of January revolution followed by unrest and political instability which lead to a substantial fall in tourism, foreign investment, Suez Canal revenues and Egyptian expats transfers.[6] The impact of the crisis is explained more subtly in the below examples: Suez Canal Investment Certificate: it was a kind of certificate sold by the four major public banks to generate 64 billion EGP to fund new Suez Canal project, the certificate expected return was 12%, with Egyptian Pound devaluation by 14%, people invested in those certificates lost 2.5% of their investment, Decline in Salaries’ purchasing power by 14.5% for each one pound. Inflation of Inflation: Prices of goods will increase and inflation rate will be 10% at least and expected to increase to 20% according to importers,[7] General Motors stopped its operations in Egypt as it can’t release its production supplies withheld at the Egyptian Customs due to lack of US Dollar.[8] The reasons making Egyptian Pound devaluation is not the best option is that economy cannot be controlled only by monetary policy, giving the fact that economy is affected by other factors other than fluctuations in the money market: Inflation rate caused by trade deficit, where trade deficit is take place when imports exceed exports, which leads to currency depreciation where there is no demand on the country’s currency reflected by its goods, is totally different from inflation rate caused by increase of money supply over supply of goods and services, Importing goods is also importing the inflation rate of the exporting countries, which make it a compound inflation, Increasing budget deficit, public and foreign debts and the interest rates, Trade deficit created by low demand on national currency and inefficient production, Decrease in GDP, which also reflects country’s ability to produce or the economic vitality.[9] Mohamed El-Erian who was appointed by the Egyptian President on the 26th of November 2015 to be a member of the CBE coordinating council that manages fiscal and monetary policies, to advise the CBE, presented a proposal to address the US Dollar crisis, the proposal warns the floating of the Egyptian Pound without adopting effective economic measures which includes controlling imports according to priorities, linking Egyptian Pound to foreign currencies portfolio and abandon US Dollar peg, and increasing the interest rate on the Egyptian pound to avoid Dollarization of Egyptian business and increasing foreign investment.[10] On the same page, Ahmed El-Sayed El-Nagger, economic expert and chairman of Al-Ahram daily - Egypt’s first public newspaper - suggested applying monetary rule of national currency sovereignty, which means obliging investors to deal only in Egyptian Pounds in the Egyptian market to strengthen the national currency and controlling imports according to priorities and facilitating investment procedures by applying one-stop-shop in all Egyptian governorates. [11] He also challenged the IMF claim that currency devaluation will increase demand on domestic goods as the demand on these goods is affected by different variables which is slow growth rates: 1.8%, 2.2%, 2.1%, 2.2%, 4.2%, in years 2011, 2012, 2013, 2014, 2015, respectively and trade deficit that is 38.8 billion EGP in 2014/2015.[12] He added that controlling or decreasing imports is an inevitable choice not only for developing countries but also for developed countries, as the United States following the International financial crisis decreased its imports from 2166 bn USD in 2008 to 1604 bn USD in 2009, according to Direction of Trade Statistics Year Book 2014 issued by the IMF, and also Asian countries like Malaysia, Singapore and South Korea done the same after the crisis of 1997, but on the contrary Egyptian imports is still increasing.[13] Beside those economic measures, it is also important to solve the security issues that affected tourism sector, another alternative for tourism revenues to offset the fall in Russian tourism is attracting Iranian tourism; which is enjoying economic boost after lifting international sanctions. In this context, the Egyptian ministry of tourism is planning to attract 200,000 tourist by the end of 2016, [14]as the ministry’s studies state that the average daily spending of the Iranian tourist is between 170-180 USD, which is higher than the European tourist who spend between 80-85 USD.[15] The Egyptian Pound value against the US Dollar has been viewed throughout the past years as the key indicator of the Egyptian economy, Egyptians fear a similar scenario in neighboring country like Lebanon which suffered from tremendous devaluation after the Lebanese civil war that made 1 USD worth 3000 Lebanese Pound. The Egyptian Pound depreciation is a symptom of a bigger issue in the economy that requires crucial measures and structural reforms for Egypt to regain its position as an economic key player in Africa and the Middle East. Hazem Adel, Business Analyst/Translator at Infomineo, Know more about Hazem [1] Daily News Egypt: Amer denies plans to devalue Egyptian pound after its price falls in informal market [2] Daily News Egypt: CBE revises mechanism of US dollar allocation [3] Bloomberg: Egypt Central Bank Eases Restrictions on Dollar Deposits [4] Daily News Egypt: JP Morgan expects further EGP devaluation, IMF loan deal [5] http://bit.ly/1UFrrLb [6] http://bit.ly/1TXfvlE [7] http://huff.to/1VO9xIs [8] http://bit.ly/23U6uBu [9] http://alamalmal.net/Detail.aspx?id=3466 [10] http://www.almasryalyoum.com/news/details/906700 [11] http://www.ahram.org.eg/NewsQ/448882.aspx [12] AhramOnline: Devaluating the Egyptian pound, big difference between theoretical and practical results [13] http://www.ahram.org.eg/NewsQ/483731.aspx [14] The New Arab: Despite political rivalry, Egypt seeking to lure Iranian tourists [15] http://bit.ly/28mO0M4

South Africa is in the southernmost part of the African continent, bordering six (6) countries: Botswana, Namibia, and Zimbabwe to the north, Mozambique and Swaziland to the east and surrounding the kingdom of Lesotho. The country’s climatic condition is mainly semiarid; subtropical along east coast and characterized by sunny days and cold nights.[1] The World Bank classified South Africa as upper-middle-income economy until 2015. Role Agriculture in South African economy South African population annual growth currently stands at 1.6%.[2] Meaning, the country will be home to over 80 million people by 2035. Therefore, food production must more than double—against fewer natural resources—if the country is to feed her rising population. Agriculture’s contribution to total Gross Domestic Product (GDP) has been declining since 1960 when the sector contributed 10% to 2.5% in 2015.[3] The trend is a global phenomenon, as countries develop from primary industries based economy to the secondary or tertiary sector based. However, despite its declining contribution to the GDP, agriculture remains a significant provider of employment in South Africa, especially in the rural areas. The sector is a major foreign exchange earner. Commercial agriculture is estimated to contribute more than 5% of the country’s labor force. In 2013, it generated about R147.4 billion in income and R116.9 billion in expenditure. The sector still remains one of the primary creators of jobs in the country with nearly 20% of all households engaged in agriculture.[4] Agriculture sector South Africa classifies 79.4% of its land as agricultural, with the permanent pasture accounting for 69.2%— suitable for grazing and livestock farming. Animal husbandry is by far the largest agricultural sector in the country. In 2011, arable land was 9.9%, forest 7.6%, permanent crops 0.3% and the rest of agricultural activities accounted for 13%.[5] In other words, climate-soil combinations leave just 12% of the country as suitable for the production of rain-fed crops. Strictly, only 3% is considered fertile, falling short of countries like India, where arable land accounts for more than 50% of the country land area. The country's rainfall is not evenly distributed across the country, with water availability being one of the limiting factors of production in South Africa. Currently, up to 1.3 million hectares of land are irrigated, producing 30% of the country’s crops. Up to 50% of the country's water is used for agricultural purposes.[6] Despite the above shortcomings, South Africa’s agriculture sector is one of the world’s most productive and robust. The country is not only food self-sufficient but also a net food exporter— making it one of the less than ten countries (the US, Argentina, Canada and Australia among others) globally that exports food regularly. The country’s commercial farming is well developed despite the fact that majority farmers are still engaged in subsistence-focused practices especially in the rural areas. Grain and oilseeds Grain industry is one of the largest subsectors in the South Africa, producing about 30% of the country's total gross agricultural production. Maize, wheat and sunflower account for the largest area of farmland. Up to 15,000 farmers produce maize, most of whom are in the northwest, northern, and eastern Free State, the Mpumalanga Highveld and KwaZulu-Natal midlands. The country is the top maize producer in Africa and 12th in the world, behind some of the world’s largest producers such as the US, Argentina, Brazil, and Mexico among others. The country produced eight (8) million tons of maize in 2015.[7] Wheat is produced mainly in the Western Cape and the eastern parts of the Free State. Average wheat production has been constant over time against a steady increase in consumption, leading to remarkable rise in imports to meet local demand. Barley which is another important grain especially in the brewing industry is produced mostly on the southern coastal plains of the Western Cape. The region accounts for over 98% of the country’s barley production. Sugar industry South African sugar industry ranks among the top 15, out of the 120 main sugar producing countries in the world. Sugarcane production mainly stretches across two provinces of Mpumalanga and KwaZulu-Natal, and is grown by over 24,000 registered growers. Processing of the cane in these regions is through about six milling companies that are operating in the cane-growing areas. The industry produces over 2 million tons of sugar per season, with up to 75% of this marketed in the Southern African Customs Union (SACU) and the rest exported to other African markets, and Asia among others.[8] Livestock industry The livestock is the largest agricultural sector in South Africa. The country is home to about 14 million cattle and almost 30 million sheep.[9] Overall, the country’s livestock production has kept pace with the local demand for the red meat while the milk production has been relatively constant. However, imports of dairy products exceeded exports in the last decade. The case is different from poultry subsector which has seen significant increase in production over the last 20 years. Despite the remarkable significant increase in poultry production, the country is still unable to meet the massive increase in local demand for white meat. Consequently, chicken is currently one of South Africa’s largest agricultural imports. Fruits South Africa is a major producers and exporter of some of the highest quality of deciduous fruit and citrus. Western Cape and in the Langkloof Valley in the Eastern Cape are the main deciduous fruit growing areas. Important export groups are wine, citrus, grapes, apples, pears and quinces. The industry's export earnings account for more than 10% of South Africa's total agricultural export’s earnings.[10] Challenges in the agricultural sector Since 1994, South Africa has faced a myriad of challenges, ranging from the country’s decision to play by the global rules of free trade, lack of adequate land reforms to insufficient support to a large number of farmers. While liberalization was aimed at making South Africa compete with some of the best in the world, the critical aspect (support for the players) was lost. The support was instrumental in facilitating the actors' effort to compete. In contrast, the competing countries were very supportive of their sector players. Land reforms were also unable to keep pace with the expectation without risking the country’s productivity. In fact, only 7.5% of the land targeted for redistribution to black people has so far been transferred, a situation that is likely to lead to proposals that could be counterproductive to the sector.[11] Regulatory framework Although its contribution to the country’s economic growth is declining, agriculture remains a key focus of the country's Development Plan, with the government spearheading a number programs aimed at promoting commercially oriented smallholder farming. The sector has seen some radical changes in the recent past. Previously, the industry was heavily regulated with financial concessions and subsidies available to farmers. However, farming has since been deregulated with the sector now more or less expected to respond to free market conditions. The producers make independent decisions based on where to purchase or sell the farm products. In fact, farmers are increasingly using the South African Futures Exchange to exchange futures contracts and hedge prices for their products, a pointer to a mature economy. Opportunities in the agricultural sector The sector presents opportunities both in primary production, processing and service areas such as financial and insurance services among others. For instance, poultry subsector is one industry that exhibit great investment potential. As mentioned, despite the significant increase in poultry production, the country is still unable to meet the massive increase in demand for white meat, with the deficit met by imports. Even some most popular crops such as—wheat, yellow maize and sunflower—the local production alone is not enough to meet the processing capacity, a clear demonstration of the need for additional investment to boost the country’s export capacity.[12] Financial institutions could also tap into this expanding sector providing finance to smallholders as well as financial advisory services to the established farmers seeking black economic empowerment (BEE) partners. Currently, the six major sources of credit to farmers include: banks (56%), the Land Bank (30%), agricultural cooperatives and agribusinesses (9%), private creditors account for 3% and other creditors and financial institutions for the remaining 2% credit sources.[13] [1] "South Africa". S.A Info, 2016: Weather and climate. Retrieved Apr. 15, 2016 via http://bit.ly/1NsfxPw. [2] "South Africa". World Bank, 2015. Retrieved Apr. 21, 2016 via http://bit.ly/1UCeZyp. [3] "South Africa". World Bank, 2015. Retrieved Apr. 21, 2016 via http://bit.ly/1Xzmynr. [4] "South Africa". Stats SA: Agricultural Statistics. Retrieved Apr. 21, 2016 via http://bit.ly/1VuoW1s. [5] "South Africa". CIA, 2016. Retrieved Apr. 15, 2016 via http://1.usa.gov/1myh9t2. [6] "South Africa". WWF: Agriculture Facts and Trends. Retrieved Apr. 15, 2016 via http://bit.ly/1imEVt9. [7] "South Africa". USDA, 2015: Corn Production by Country. Retrieved Apr. 21, 2016 via http://1.usa.gov/1alf521. [8] "South Africa". S.A Info, 2016: SA Sugar Association. Retrieved Apr. 26, 2016 via http://bit.ly/1MYTAND. [9] "South Africa". S.A Info, 2016: Weather and climate. Retrieved Apr. 25, 2016 via http://bit.ly/1NsfxPw. [10] "South Africa". WWF: Agriculture Facts and Trends. Retrieved Apr. 15, 2016 via http://bit.ly/1imEVt9. [11] "South Africa". PLAAS, 2013: The Distribution of Land. Retrieved Apr. 15, 2016 via http://bit.ly/22TlVGT. [12] "South Africa". DAFF, 2012: The Status of the Agro-processing Industry in SA. Retrieved Apr. 26, 2016 via http://bit.ly/236kKUy. [13] "South Africa". SA Government, 2015: Agriculture Sector. Retrieved Apr. 26, 2016 via http://bit.ly/1Tw5TQt.

Morocco will be hosting the 22nd edition of the Conference of the Parties on November 2016, an event considered as the most important rendez-vous on climate change effects. This event comes at a time when the country is embarking on ambitious projects related to the fight against climate change: Morocco is expecting to raise its share of renewable power energies to 52%[1] by 2030 The country is also willing to reduce its greenhouse gases emissions by 32%[2] by 2030 The “Noor” project’s solar power plant, considered one of the world’s biggest, is being built with a capacity of 580 MW[3] by 2018 Besides the environmental considerations, the organization of the Conference of Parties implies some financial matters. Opportunities for the private sector Currently, the most important contract for the COP22 is related to the event’s organization: preparation and management of the site (the Bab Ighli area in Marrakech). The tender’s value is estimated at € 64million (MAD 700 million[4]). Three criteria[5] were retained for companies willing to submit their bids: 1 – Average turnover of MAD 500 million during the last 3 years 2 – Organization of at least 2 events on behalf of the United Nations Organization (similar to the COP in terms of size) 3 – Completion of at least one civil engineering project during the last five years To overcome the constraints related to turnover and experience capitalized in the organization of such events, local players partnered with international ones. Partnerships between Moroccan and international event agencies Three groups formed by Moroccan companies and international event agencies were shortlisted[6]: Capital Events (a Moroccan events management agency), GL Events (a Euronext-listed company, organizer of the previous COP in Paris and Lima), Agence Publics (a France-based communication and event agency), etc. Groupement MaroCop: Richard Attias & Associates (New York-based consulting firm), Alomra Group International (Moroccan company in business risk management), the Moroccan architect My Abdelouahed, Derichebourg Maroc (Facility management company), Maroc Telecom, Valyans Consulting, etc. La Nouvelle Avant-Scène (Moroccan event communication agency), Finatech Group (a subsidiary of the Moroccan holding company Financecom), URBAGEC (Moroccan company operating in the civil engineering sector), etc. Some other well-known business owners like Vincent Bolloré (through his event company, Havas Event) has initially shown his willingness to be among the bidders. Besides, the British public relations company Henley Media Group is also willing to be in charge of the organization of the Sustainable Innovation Forum, an important business-focused event held alongside the COP meeting. The 6th Sustainable Innovation Forum during the COP21 was organized by the same media group. A subsidiary of Henley Media, Green Media Ltd has already booked the domain name “cop22marrakech.org”. Green Media’s core business is to provide business insights to its clients and establish partnerships between the private sector, governments and NGOs involved in sustainable development and “green economy”. The organization was in charge of the public relations of the COP21. Other contracts related to the COP22 The technical control of the site’s construction (Socotec Maroc and Bureau Veritas Maroc have been shortlisted), the accommodation and transportation services Projects in Marrakech: to be in the spirit of the event, some projects are initiated Introduction of electrical buses powered by solar energy: the project’s cost is estimated at MAD 200 million Set up of a recycling plant: for an approximate cost of MAD 100 million A MAD 70 million-contract[7] for the installation of green lighting solutions In a world where economies need to distinguish themselves in order to be more competitive, Morocco can develop expertise and an edge on the whole ecosystem related to renewable energies. By doing so, the country will be able to play an important role in the “Environmental diplomacy” domain. Fatou, Analyst at Infomineo. Know more about Fatou. [1] Usine Nouvelle - http://www.usinenouvelle.com/article/climat-le-maroc-se-met-en-ordre-de-marche-pour-la-cop-22-de-marrakech-en-novembre.N378986 [2] Jeune Afrique - http://www.jeuneafrique.com/284667/societe/maroc-hakima-el-haite-cop22-faut-deja-reussir-cop21/ [3] Noor Ouarzazate - http://noorouarzazate.com/ [4] Huffington Post Maghreb - http://www.huffpostmaghreb.com/2016/03/15/cop22-maroc_n_9470796.html [5] L’Economiste - http://www.leconomiste.com/article/984730-plus-gros-que-le-gatt-le-cahier-des-charges-de-la-cop22 [6] At the moment when the article is written, the name of the group to organize the event is not disclosed yet. [7] L’Economiste - http://www.leconomiste.com/article/985009-comment-marrakech-se-prepare-la-cop22

It all started on the first week of January 2016, when Internet users all over the country found issues making mobile calls on a regional and international level through free applications such as Skype, Viber, Tango, Facebook Messenger and WhatsApp using their 3G, 4G internet connection. Few days later the Moroccan telecommunications regulation agency, the ANRT, made an official statement confirming that the most widely used VoIP services will be blocked from now on by the Three Moroccan Telecom service providers. This decision was approved by Maroc Telecom, Meditel (Orange) and Inwi who have mutually agreed to block all Voip calls made through 3G and 4G and to expand these restrictions to calls made through Wifi connection. Needless to say that the ban received a significant negative reaction from Moroccans and expatriates who have been using these internet call services for personal or professional purposes. Before you pros and con anything. Let us step back and understand what the VoIP is, who are the key telecom regulators in Morocco and what could be the effect of these limitations on a macroeconomic level. VoIP, what does it stands for: VoIP stands for Voice over Internet Protocol, or in common terms phone service transmitted over a digital network. This technology is commonly used for voice, video and data conferencing and quickly became popular because of the lower cost (compared to traditional phone calls) and convenience thanks to its functionality. VoIP global services market: VoIP services are cost effective and allow both corporate and individual customers to operate calls while avoiding costs incurred using traditional phones calls. Consequently, VoIP services market has grown effectively during the past years, according to a market report published by Transparency Market Research[1], the global VoIP services market was valued at USD 70.9 billion in 2013 and is expected to reach USD 136.76 billion by 2020, growing at a CAGR of 9.7% from 2014 to 2020. Mobile applications popularity is increasing and many apps such as Viber, WhatsApp and Skype monthly active users reach over 200 million (i.e. Viber had 250 million active users as of April 2015[2]). These applications use a “Freemium” model, meaning that the basic services of the apps like calls and texting applications are free but the customer need to pay for extra features (i.e. Viber use premium stickers). This trend has led to a decline of prices for basic voice and data services and had a huge impact on generated revenues for the Global Telecom industry. Indeed, according to a research published by Ovum in 2014, the telecommunications industry will lose a combined USD 386 billion between 2012 and 2018[3]. Concerning consumers, the use of VoIP will grow at an annual rate of 20 percent between 2012 and 2018 to reach 1.7 trillion minutes[4]. This global demand will be sustained thanks to internet penetration, development of wireless devices and continuous prevalence of social media. While some companies have been trying to deal with the increasing growth of VoIP apps worldwide by adjusting to their customer needs and building new innovative approaches (i.e. Swisscom has launched new mobile tariffs with unlimited national voice, SMS…). Many companies have attributed the loss of revenues generated by their companies to the increasing use of VoIP apps which led many countries to block these services. VoIP market regulation: Countries have adopted various regulatory approaches to face the increasing growth of VoIP, they can be classified into countries were[5]: What is the regulatory framework in Morocco? In 2004, the Moroccan Telecommunications Regulatory Agency (ANRT) has published a regulatory article (ANRT/ N° 04-04) to frame the general use of VoIP in the country, asserting that: “A license is required for the provision of any VoIP service. Therefore, only the licensed Public Telecom Operators (PTO) can provide VoIP services[6]. “ The VoIP was since subjected to its own set of regulations in the country, however this law was not effective until January 7th 2016, when the National Agency published an official statement announcing that all telecom services need licenses whether they are Voice over Internet Protocol (VoIP) or others. The ANRT stated that: "In addition to the losses for the telecoms national market, the free internet voice calls do not respond to the required legal gateway, therefore their suspension (VoIP) came in conformity with the operators' obligations that were underlined in their licenses."[7] Furthermore, another regulatory article (ANRT/ N° 83/24-96) related to telecommunications states that : “It is forbidden to use a telecommunication network without a license…This could be punishable by the law with a sentence reaching 1 month to 2 years in prison and a fine of 10,000 to 200,000 MAD”[8]. While VoIP has not yet been made illegal in the country, it is clear that ANRT regulation will try to maintain limitations concerning mobile apps use. The main reasons highlighted remains the non-conformity to the regulatory framework and absence of license permits of mobile apps such as Viber, WhatsApp and Skype. Macro-economic impact: The real impact of the VoIP ban cannot be measured yet, however we can still assume that the Moroccan economy could be directly affected by this decision on many levels. Through its strategy Emergence[9], Morocco has launched various economic and industrial programs aiming to develop 6 key sectors (Offshoring, Automobile, Textile, Food Industry, Electronic and Aeronautic). The Offshoring sector, with a potential of around 100,000 jobs in 2015 and a sectorial turnover estimated more than 20 billion dirham’s is dedicated to the promotion of the country as an attractive destination for outsourcing services and customer Services (Including call centers, many of which are depending on VoIP services). The ban of VoIP apps could impact the operating costs of companies in the sector and decreasing the competitive advantage of the country it terms of telecom prices. While this decision can still be considered as legal, it might represent a step backward for the development of the country. Mounia, Senior Analyst at Infomineo. Know more about Mounia [1] VoIP Services Market (Individual Consumers, Corporate Consumers, Mobile VoIP and Others) - Global Industry Analysis, Size, Share, Growth, Trends and Forecast, 2014 – 2020 : http://www.transparencymarketresearch.com/voip-services-market.html [2] Number of monthly active Viber users in millions : http://www.statista.com/statistics/316423/viber-messenger-monthly-active-users/ [3] Telecom companies count USD 386 billion in lost revenue to Skype, WhatsApp, others : http://fortune.com/2014/06/23/telecom-companies-count-386-billion-in-lost-revenue-to-skype-whatsapp-others/ [4] Telecom companies count USD 386 billion in lost revenue to Skype, WhatsApp, others : http://fortune.com/2014/06/23/telecom-companies-count-386-billion-in-lost-revenue-to-skype-whatsapp-others/ [5] Regulatory issues : https://www.itu.int/osg/spu/ni/voice/papers/FoV-VoIP-Biggs-Draft.pdf * PSTN : Public switched telephone network [6] Regulatory issues : https://www.itu.int/osg/spu/ni/voice/papers/FoV-VoIP-Biggs-Draft.pdf * PSTN : Public switched telephone network [7] ANRT official press release : https://www.anrt.ma/sites/default/files/CP-Telephonie-IP-fr.pdf [8] ANRT regulation : https://www.anrt.ma/sites/default/files/documentation/1997-1-97-162-24-96-loi-telecom-ver-consolidee-fr.pdf [9] Strategy Emergence : http://www.emergence.gov.ma/En/MMM/Offshoring/Pages/Presentation.aspx

This article aims to provide a general insight of the commercial exchanges’ background between Spain and Africa. On this purpose, we will display figures and charts which may enable us to understand the reasons behind the current context, we will also compare Africa with the rest of the world economic areas, as well as Spain with its neighboring countries, and we will try to forecast hypothetical trends for the long term. To start with, in the recent years, Spain has experienced one of the most dramatic economic crisis in his history. On account of this context, Spanish products have seen themselves forced to explore new markets, apart from the existing ones. If we analyze the historic background, Spain, due to its privileged geographical position, has always been regarded as the main bridge between Europe and Africa. Since the Arab occupation in 711 a.c., the Iberian Peninsula has been a key strategic location for commercial and cultural exchanges between both continents. However, after the colonization and decolonization of Africa, due to the fact that Spain did not receive as much territory as other European countries, such as France, UK, Portugal, or Belgium, the Iberian Country lost several influence in the relationships with the continent, both political and commercial. Nowadays, Spain has overturned this situation, as it has increasingly been gaining influence in the continent. Following with this, the Spanish export figures to Africa are remarkable in their growth rate and they are on their way of turning the continent into an engine of foreign trade, given its shown potential. So much so that, Spain is currently the 4th commercial partner in Africa, as well as the main partner of some African countries, highlighting Morocco and Algeria, and is addressing other important markets in the continent, such as Nigeria, South Africa, Angola, and so on. Figures speak by themselves: in the last 15 years, exports from Spain to Africa have more than tripled. Except for the 2008-2010 period, coinciding with the hardest episode of economic recession in Spain, the growth rates have been impressive. Moreover, in 2014, among the top 10 destinations of Spanish Exports in the continent, there were five countries located in the Maghreb Region. What´s more, Algeria has recently surpassed South Africa, which, until last year, had been leading this ranking: Analyzing the ranking, it seems obvious that the Maghreb Region countries, due to their proximity, occupy the leading positions. On the other hand, if we break down each of the countries´ recent record, we can appreciate different tendencies, as each of them are involved in different contexts. For example, Libya has recently suffered from a civil war, which has paralyzed his economic development. Yet, all the top 10 countries have increased their purchases to Spain in the last 15 years, though at different levels. In the second place, if we check the origins of the sales, France was the principal exporter to the continent, recording 20% of the EU exports to Africa in 2014, whereas Spain, occupied the 4th position of the ranking with 12% of the exports. Once again, if we break down each of the countries´ recent record, we can notice how remarkably Spanish exports in the continent have grown compared to other countries, surpassing the United Kingdom and Netherlands. Also, France has been leading this ranking during this period, getting higher export figures than the rest of the EU members. But, what is the magic force pushing this new trend? Experts agree that, it derives from the fact of the unstoppable growing medium class in Africa, matching the needs of internationalization of the Spanish Economy, what is actually allocating the Spanish goods in the respective African Markets. There are other reasons upon the table: the improvement of the legal and political frameworks, allowing most of the African countries to benefit from more transparent, economically safer and less state-owned economies, is undoubtedly playing a positive role in their development. However, despite what figures indicate, the relevance of Africa, among the different geographical areas, still remains low. Although, on the other hand, the share of Spanish exports in Africa has experienced a slight increase, compared to other economic regions worlwide. Besides, in 2014 the share of exports constituted 3.3%, whereas in 2000 they did not surpass 2.5%. In addition, this difference is more noticeable when looking at non-European exports, being an 11.5% in 2014 compared to a 9.4% in 2000. Africa has become the world's third largest region by growing purchases from Spain, after the Middle East and Asia. Sub-Saharan Africa received more than a quarter of Spanish sales to the continent in 2012 and the first semester of 2013 received almost 23% more than in the same period of 2012. As a matter of fact, Africa has recently surpassed Latin America (including Brazil) in total volume of exports. This is quite astonishing if we bear in mind the historic and cultural ties which have linked both locations for centuries. Regarding the composition of the Exports, Capital Goods are the main traded items. In contrast, during the last ten years, we have seen how other items have been increasingly wining more relevance, giving special emphasis on manufactured goods and energy products, which have seen their sales duplicated within this gap of time. This scenario implies a dynamic transformation of the African Economies. To conclude, this scenario is likely to continue in the short run, as a result of a combination of certain positive facts, which we will herewith break down: • The positive macroeconomic perspectives forecasted in most of the African Countries, as a consequence of a progressive transformation to more industrialized and service oriented economies. • The Spanish Economy, weighed down by the economic crisis, is giving signals of recovery. • The previously mentioned growing class in Africa, accounting 400 million people in the recent years. • The unstoppable progress of most of the African Countries towards more transparent and democratic societies. • The willingness of Spanish companies to address unexplored markets. • Economic Liberalization of certain African Countries, removing critical barriers such as import taxes. Javier Solar Irazabal, Analyst @Infomineo. Know more about Javier

COUNTRY DESCRIPTION Kenya is a large country of 580,367 km² that borders Tanzania, Uganda, South Sudan, Ethiopia, Somalia, and the Indian Ocean. Kenya’s nominal GDP in 2014 totaled $60.77 billion USD - $132.4 billion when adjusted for purchasing power – and both the economy and per capita GDP have shown consistent growth despite the recent global downturn, with the national economy averaging 5.2% growth over the past three years. Kenya’s diverse climate and terrain allow for the cultivation of a variety of crops, both for export and consumption. Up to 48% of Kenya’s land is used for agriculture, majority of which is pastoral. Despite possessing 57,000 km² of arable land, only 5,223 km² is dedicated for permanent crop production. Kenya’s water resources are also underutilized. Renewable water resources total 30.7 Km³, yet total fresh water withdrawal only amounts to 2.74 Km³/year.[4] Significant water resources, bolstered by recent aquifer discoveries in northern Kenya, are available for irrigation projects and could stabilize crop production while maximizing annual yield. Regionally, Kenya is the economic and transportation hub of East Africa, possessing a relatively strong domestic manufacturing industry, supported by its transport infrastructure and export capabilities. Chinese and Indian investment in the transportation sector is likely to increase the export capacity and interconnectivity by 2021. While the goal of these investments is to improve connectivity with Kenyan soda ash producers and raw material excavations in Africa’s interior, the creation of an upgraded transportation and export network will benefit the profitability of Kenya’s agricultural sector. Kenya recently underwent a transition in political leadership through an internationally monitored election. Uhuru Kenyatta won the Presidency with 50.51% of the popular vote in the hotly contested election. But, for over 5 years now, the government has had to deal with the security threat posed by the Al-Shabaab militant group. The insecurity has drawn public criticism with some critics citing public officials’ role in smuggling sugar and tobacco from northern Kenya into Somalia thereby empowering the insurgents economically. However, the government has reassured the public and investors of her commitment to deal with the challenges posed by the Al-Shabaab. SECTOR BREAKDOWN: AGRICULTURE Kenyan agriculture accounts for 65 percent of the country’s export earnings. The cash crops that drive these earnings include coffee, tea, tobacco, cotton, sisal, pyrethrum, cashew nuts, and horticulture. Horticulture – According to Kenya National Bureau of Statistics (KNBS), the total horticulture export totaled about US$ 1 billion in 2013.[5] Floriculture sub sector accounts for a significant proportion of horticulture exports. Flowers accounts for more than two thirds of Kenya's horticulture export earnings while vegetables and fruits comprise about 20 percent and 10 percent respectively. While Kenya was not an exporter of the products in the 70s, it is now the major exporter to the EU, where it accounts for almost 40% of all cut flower into the EU. The main EU markets are Holland, Switzerland, Germany, France, and United Kingdom.[6] Coffee – Introduced to the region by the British in 1900, coffee is grown, harvested, processed, and sold via a transparent system of cooperatives and open auctions. 70% of Kenyan coffee is produced by small scale producers who are able to achieve economies of scale because of their progressive cooperative and auction retail system. SL28, grown on the slopes of Mt. Kenya, is widely viewed by coffee experts as one of the best tasting coffee strains on the market. Kenya is benefitting from the coffee price boom, which has boosted average 2015 price to $225 USD per bag (50kg) as of September. Tea–Kenya’s sun-filled days, rain soaked nights, and rich volcanic soil constitute the perfect environment for tea cultivation. Kenya produces more tea than any other country aside from India and China, and grows four different strains that are highly valued on the global tea market. 60% of production is handled by small scale farmers, who rely on the Kenya Tea Development Agency to handle auction sales. The average price of tea sold at auction in Mombasa was 3.10$/Kg. No pesticides are used as the climate prohibits the spread of pests and diseases. Small-scale producers cultivate and harvest manually while large multinationals use mechanized processes. Tobacco – 80% of Kenyan tobacco production occurs in the southern Nyanza region in the Migori, Kuria, Suba and Home Bay districts. British American Tobacco, which owns 70% market share, has identified Kenya as a growth profit market and is actively producing and marketing its product in the region. Small-scale producers are not as organized as Coffee and Tea producers due to BAT market dominance. Demographic and economic trends indicate continued growth in production and sale despite new laws inhibiting single cigarette sales by street vendors. Cotton–Thanks to prohibitive import taxes, cotton was once the largest domestic industry in Kenya. However, the economic liberalization of 1990-1992 shrunk the industry as cheaper, used imports from Uganda and Somalia replaced domestic production. By 2009, production of lint and yarn had fallen by 80%. But the ecological conditions for cotton growth still exist, and with the signing of new trade agreements with Europe, the United States, and much of Asia, the cotton production and processing industries are beginning to recover. In February 2015, China invested $500 million USD in a 50,000 hectare farm/processing facility just outside of Nairobi, while the import/export bank of India has committed $790 million USD to expand Rift Valley Textile Company operations. The cotton industry in Kenya is definitely trending upwards, particularly with Kenya’s favorable labor demographic to support increased production. Cashew Nuts–Cashew nut production in Kenya peaked in 1979, and faces a variety of challenges despite a recent resurgence in yield. Farmers have neglected trees, treating them as wild and failing to routinely trim and water groves. Proper cultivation and tree stock replenishment presents an attractive investment option, as this sector is underdeveloped and Kenyan Cashew refineries often have to import product because their demand cannot be satisfied by domestic sources. Aside from cash crops, the Kenyan climate supports the cultivation of maize, wheat, sugarcane, beans, cassava, potatoes, sorghum and a variety of horticulture. INVESTMENT OPPORTUNITIES The coffee and tea industries in Kenya are technologically advanced, mature industries. Small scale holders are organized and manually harvest crops that sell for high value in the global marketplace, while multinationals have developed technological processing methods to deal with larger scale production. The current coffee and tea price booms would help produce a profitable return for investors as these trends seem set to continue for the next several years. Demand for coffee and tea, especially pesticide free, fair-trade strains, will continue to increase. However, Cotton and Cashew Nut cultivation present two options to invest in high-growth markets where supply does not meet demand and modern production techniques are absent. Investments by India and China in its cotton processing capacity guarantee a market for harvested cotton: Kenya’s processing capacity is set to triple in the next three years. Irresponsible cultivation of cashew trees has likewise reduced cashew yield, to the point that Kenyan processing plants import more expensive nuts from Tanzania because domestic suppliers can only provide 60% of maximum production capacity. Both industries present strong upside for growth, especially considering the current government’s liberal trade policies and Kenya’s growing export infrastructure and capacity. Erickson Oduya, Research Associate at Infomineo - Know more about Erickson [1] Trading Economics, 2016. Accessed on February 03, 2016 via http://bit.ly/1PzGRzu. [2] CIA Fact book, 2015: Kenya’s Demographic. Accessed on February 03, 2016 via http://1.usa.gov/1jNR9f4. World Bank; CIAT. 2015. CSA Country Profiles for Africa, Asia, and Latin America and the Caribbean Series. Washington D.C. Accessed on February 3, 2016 [4] CIA Fact book, 2015: Kenya’s Demographic. Accessed on February 03, 2016 via http://1.usa.gov/1jNR9f4. [5] Kenya: Facts and Figures, KNBS 2014. Accessed on January 26, 2016 via http://bit.ly/1sGXUGE [6] Flower Industry Statistics, Kenya Flower Council, 2015. Accessed on January 26, 2016 via http://bit.ly/1RKvPtp

This article will present the key findings of 2015 report about “Illicit financial integrity” prepared by Global Financial Integrity (GFI) -a non-profit, Washington, DC-based research and advisory organization, which produces high-caliber analyses of illicit financial flows, advises developing country governments on effective policy solutions, and promotes pragmatic transparency measures in the international financial system as a means to global development and security-. While discussing the development equation especially for the developing countries, we should take into consideration the massive outflows of money that are likely to adversely impact the domestic resources and illicit leakages of capital from the balance of payments and trade misinvoicing. Illicit financial flows can be defined as illegal movements of money from one country to another, the illegal attribution can be due to the illegal sources used to earn the money, transfer or utilize it. By their nature, illicit funds are difficult to estimate with precision taking into consideration the lack of economic data and methods that can help in framing and forming the scale of the problem. Among the top ten countries with the highest average illicit financial outflows, which stand for 62.3% of cumulative amount of illicit capital outflows from the entire developing world, the Asian presence is further emphasized as the top exporter of illicit capital with a representation of 5 countries out of the sample (10 countries) and a percentage of 38.8%. The Western Hemisphere represented by Mexico(3rd) and Brazil (6th) in the top ten countries accounted for 20% while Sub-Saharan Africa regions represented as well by two countries: South Africa(7th) and Nigeria (10th) accounted for 8.6%off cumulative illicit financial , Russia (2nd) alone appear in the global top ten representing Developing Europe with 25.5%. The main components of this illicit capital can be represented by trade misinvoicing which means export under invoicing (undervalues export sales) and import over-invoicing (raises import costs).According to statistics found on the “OECD, IMF, UNTCAD Statistics…and other databases” it has been proved that the amount of illicit financial outflows exceeded both official development assistance (ODA) and inward foreign direct investment (FDI) in all developing countries which shows the seriousness and gravity of the issue since the unrecorded illicit outflows are significantly much higher than the resources these countries might accumulate through ODA and FDI. US$1.1 trillion was recorded as the amount of illicit flows in 2013 from developing world, which represent 10 times the amount of official development aid received by these countries in the same year and the annual percentage of growth of these outflows is approximatively 6.5% Money laundering through trade transactions which can be done via various techniques including trade misinvoicing was defined by the financial action task force (FATF) as “the process of disguising the proceeds of crime and moving value through the use of trade transactions in an attempt to legitimize their illicit origins.”. also an important link had been tied between illicit outflows and countries that are major drug producers and/or represent a transit point for drug trafficking since an appealing ratio of misinvoicing to total trade drug transiting countries and the other developing countries was identified (For 68% of the sample trade misivoicing outflows to total trade are significantly above the 6.7% which is the developing countries average. The opacity of global financial system that can be represented in the following issues-tax havens, secrecy jurisdictions, bribery and corruption- which make up the bulk of illicit financial flows from developing countries, even though there are some best practices that should be adopted and promoted at international and institutional level by all these countries such as: Anti-money laundering: by enforcing all anti-money laundering laws and regulations and penalizing employees of financial intuitions who are facilitating the money laundering operations. Beneficial Ownership: Government authorities should coordinate with banks in order to create public registries in order to maintain a database of the true owners of any account opened all over the financial institutions. Country-by-Country Reporting: Multinational companies should have the obligation to disclose their revenues, profits, losses, sales, taxes paid, subsidiaries, and staff levels on a country-by-country basis. Tax Information Exchange: Encouraging the participation of all countries to contribute in the worldwide exchange of tax information. Trade misinvoicing: Preparation of well trained and equipped officers to enhance the ability to detect intentional misinvoicing of trade transactions through the ability to access real-time world market pricing information. The issue of illict finiancial flows is at the forefront international forums and agendas, national and international mobilization is required to tackle the issue and take serious actions on the fight against the phenomenon Fatima-Zahra Boukhari, Analyst at Infomineo Know more about Fatima-Zahra // Know more about Infomineo Sources : • Financial Action Task Force, “Trade Based Money Laundering” (Paris, France: Financial Action Task Force (FATF), June 23, 2006), 3, http://www.fatf-gafi.org/media/fatf/documents/reports/Trade%20Based%20Money%20Laundering.pdf. • “Illicit Financial Flows from Developing Countries 2004-2013” report issued by Global Financial Integrity in December 2015 : http://www.gfintegrity.org/wp-content/uploads/2015/12/IFF-Update_2015-Final.pdf

For years, energy has been heavily subsidized in the MENA region. As stated by the IMF, in 2011 energy subsidies represented 8.5 % of GDP and 22 % of government revenue, at a total cost of $240 billion. Moreover, “six of the world’s largest subsidizing countries are found in MENA, led by Kuwait, Iran, Saudi Arabia, and Qatar, where residents pay less than a third of international prices for fuel and electricity” [1]. For instance, to subsidise electricity and water in Abu Dhabi in 2014, the government spent DH17.5 billion. Also, in the summer of 2014, the Saudi Arabian government burnt 900,000 barrels of oil a month to meet the demand of the already subsidized electricity [2]. This situation was made possible by reserves representing about 57 % of the world’s proven oil reserves and 41 % of proven natural gas resources.[3] (more…)

After a four-year civil war that ended in 1994 and that has thrown Rwanda into a deep crisis, the country is engaged in a new momentum of economic development. In fact, the government has launched in 2000 a long-term development strategy “Rwanda 2020”. The goal of this program is to transform the country from a low-income agrarian economy to a medium income export-oriented and knowledge-based economy. So far, some reassuring economic signals are showing that the Government is engaged in a growing path: (more…)

Africa has for some time now become the focus of the international economic community. With growth having stalled in much of the world’s continents for the last few years, Africa has naturally seen its development take centre stage. Its growing sectors have been more and more sought after for investment opportunities – one of which is the extractives industry. (more…)

Despite the lack of appropriate electronic payment systems and sometimes limited access to internet, many experts and e-Commerce companies are positive about e-Commerce growth in Africa. According to a report published by Mckinsey & Company in 2013, e-commerce is expected to grow considerably over the next few years : “By 2025, it could account for 10% of retail sales in the continent’s largest economies, which will translate into some US$75bn in annual revenue.”[1] Beside, more and more African and International companies are interested in investing in the e-commerce market and aim to expand their activities in Africa. (more…)

[vc_row 0=""][vc_column][vc_column_text 0=""] The country Egypt is a country in North-Eastern Africa. It shares borders with Libya, Sudan, Israel and the Gaza Strip. It has coasts on the Mediterranean Sea and the Red Sea. The total area is 1,000,450 sq. km with a population of 83.39 million[1]. The country’s nominal GDP was in 2014 estimated at 286.4 billion USD, which makes it the third largest African economy after Nigeria and South Africa. The GDP using purchasing power parity was calculated at 943.1 billion USD the same year. In 2014, the GDP’s growth rate of the country was 2.2%. The country’s ranking in World Bank’s doing business was 112th in 2015, a 1 point improvement compared to the previous year. Egypt’s GNI per capita is $3,160[2]. Egypt’s natural resources are diverse: petroleum, natural gas, iron ore, phosphates, manganese, limestone, gypsum, talc, asbestos, lead, rare earth elements, zinc, etc.; but the country is disadvantaged by the fact that its territory is more than 90% arid desert, with as few as 3.6% of the land usable for agriculture[3], which can be considered by other nations as not enough to have a proper agriculture, and yet Egypt has fought to get the most out of its land. The Agriculture Egypt hosts one of the oldest agricultural civilizations. The fertility with the Nile river banks and the delta has pushed the populations of all eras to settle down in an area covering less than 10% of the territory, with the rest all covered by the desert with the exception of a few oases. Agriculture is crucial to the economy; its value added accounts for 14.5% of the country’s GDP. The sector also employs 29.6% of the total active population (2010) and represents 11% of all exports (2001)2. Egypt has a very arid climate, the rainfall does not exceed 190mm in the Mediterranean coasts and 60mm in the Nile delta, and even less than 25mm in the Upper Egypt. The country relies on irrigation, 99.8% of cropland was irrigated in 2002. The water supply is governed by the water-sharing treaty with the Nile basin countries, allocating 55.5 billion cubic meters per year to Egypt, representing in 2003 82.59% of the total available water in the country. Agriculture consumed in 2003 81.1% of the total water supply potential[4]. The key agricultural sectors The major crops cultivated in Egypt are: Rice: it is one the major cereal cultivated in the country. It is the second most exported crop after cotton. The country’s production in 2014 was 4.53 million metric tons[5]. Egypt is the biggest producer of rice in Africa. Cotton: it is the major fiber crop cultivated in the country and the most exported crop. In 2014, the production was 525,000 bales of 480 lb., an increase of 20.69% compared to 2013 after two years of decline. The country is the second producer in Africa after Mali. Corn: With nearly 6 million metric tons produced in 2014 and a 2.76% growth compared to 2013, it is one of the major crops cultivated in the country. The country is the eighth largest consumer in the world and the fifth largest importer[6] and the third producer in Africa after Nigeria and South Africa. Wheat: The country is the major producer of wheat in Africa, with 8.3 million tons in 2014. Egypt is also the second largest importer in the world. Sugar cane: it is the main sugar crop with 90% of the yield used for sugar extraction. Forage crops: Egyptian clover is the main produced forage crop in the Nile valley. The other major crops cultivated in Egypt are fruits, vegetables, and beans5. Livestock production is an essential element of Egypt’s agricultural sector. The population has increased steadily between 2000 and 2009, the number of cattle heads went from 3.53 to 5.00 million, buffaloes from 3.38 to 4.00 million, goats from 3.43 to 4.55 million and sheep from 4.47 to 5.50 million, camels, however, have declined from 141 000 to 110 000 head[7]. The challenges The biggest challenge to Egypt’s agriculture is water. Water is a very scarce resource in the region, the major source of this essential commodity is the Nile River. The Nile is the longest river on the globe, it runs through no less than 10 countries – Rwanda, Burundi, DRC, Tanzania, Kenya, Uganda, Ethiopia, South Sudan, Sudan, and Egypt. During the course of history, many conflicts have risen from the difficulty to please all parties. Many treaties were signed, the last one dates from 1959. One of the most important measures was granting Egypt the right to build the Aswan High Fam that can store the entire annual Nile River flow for a year. There are two major threats to the stability of the agreement on water supply. The first is political. A political instability of any sort in one or more of the countries of the Nile basin may endanger the ability of the others to feed their populations and result in an unprecedented regional crisis. The second threat and the most imminent is the growth of the population of those ten countries. By 2050, Africa’s population is expected to grow by an additional 1.3 billion people, the equivalent of today’s China[8]. For the case of Egypt, the population is expected to reach 97.3 million in 2025, lowering the per capita water availability from 1123 m3 in 1990, to 630 m3 in 2025[9]. This shows that the challenge now for Egypt is to look for perennial solutions to lower its dependency on the Nile water supply and to find sustainable alternatives like desalination. Mohamed Taha Akhanchouf, analyst at Infomineo [1] https://www.cia.gov/library/publications/the-world-factbook/geos/eg.html [2] http://data.worldbank.org/country/egypt-arab-republic [3] http://www.eoearth.org/view/article/152375/ [4] http://www.fao.org/docrep/v9978e/v9978e0e.htm [5] http://www.indexmundi.com/agriculture/?country=eg&graph=production [6] http://www.spectrumcommodities.com/education/commodity/statistics/corn.html [7] http://www.fao.org/docrep/v9978e/v9978e0e.htm [8] http://www.cnbc.com/2015/07/30/world-population-quarter-of-earth-will-be-african-in-2050.html [9] http://www.iss.europa.eu/uploads/media/Alert_Nile.pdf [/vc_column_text][/vc_column][/vc_row]

Background and perspectives Morocco offers multiple types of destinations for tourists. First, it has almost 3000km of coastline which makes it a top destination for seaside activities; second, it is rich of history and offers cultural activities with entire cities being classified as world heritage sites by UNESCO; also, mountains and desert offer unique experience for people who come for discovery and adventure. Economically, tourism represents a key segment in the Moroccan economy; in fact, it represents the third leading sector after agriculture and industry. In 2013, the sector contributed by USD17.2bn to the Moroccan economy representing 18.7% of the total GDP and investments reached USD3.2bn representing 11.2% of total investments[1]. The World Travel & Tourism Council (WTTC) expects the sector to grow by 5.6% per year from 2014 to 2024 and investments to increase by 5.4% per year (on average) for the coming 10 years1. In a country where total unemployment is reaching the two digits, tourism represents a good opportunity for young unemployed (20%)[2]. In 2013, the sector directly supported 814,000 direct and 1,798,000 indirect jobs and total employment is expected to grow by 2.4% (on average) per year during 2014-2024 period1. Stable country Despite the terrorist attack that hit Casablanca in 2003, and Jamaa El Fnaa’ -the most touristic space- in 2011, Morocco has always been considered stable compared to countries of the region. Recently, tourism has enjoyed particular growth following the uprisings that took place in competing economies such as Egypt and Tunisia. Thus, after years of flat growth, Morocco reported a 7.2 percent increase in arrivals since 2012[3]. The enforcement and creation of a special security apparatus have played a significant role in preventing other terrorist threats. In fact, the World Bank ranks Morocco first in North Africa and above average in the MENA region on ‘political stability and absence of terrorism’ indicator[4]. Infrastructure and foreign investments Along with stability, Morocco offers modern infrastructure. For years, the country has been investing significantly on structural projects. Today, the country is linked by 1800km of highway, has 15 international airports, offers advanced telecom services (129% mobile penetration) and hosts one of the biggest ports on the Mediterranean and Africa region[5]; such big projects have attracted foreign investors into Morocco. In 2014, tourism represented 14.7% of total Foreign Direct Investments (FDIs) counting for MAD4.8bn in which more than 50% of investments originated from France, UAE, Saudi Arabia, USA and Kuwait[6]. For instance, the French company “Accor Group” injected more than MAD3.5 billion investment on hotels from 2002 to 2012 and has expected to invest another MAD1.2 billion during 2012-2015 period[7]. On regulation side, the country offers incentives for investors like total tax exemptions for the first five years of touristic projects. Open Sky Morocco has seen significant growth in its air traffic links since it signed the open skies agreement with the EU in 2006. The deal has resulted in a substantial influx of low cost flights to the country, which subsequently boosted the tourism sector. In 2013, Europe’s largest low cost company Ryanair added new aircraft in Moroccan airports and plans to grow its operations to 60 routes and eight airports delivering up to 2.5 million passengers a year to the country[8]. Jetairfly, Easyjet among other low cost companies have also expanded their Moroccan network since 20137. Strategic plans The Moroccan government has implemented two strategic plans “Vision 2010 and 2020” to boost the sector in the last decade. Vision 2020 plans to double the size of the sector to reach 20 million visitors and make from Morocco one of the top destinations worldwide[9]. The focus is to increase the total capacity of the sector by 200,000 beds, target tourists from new and emerging markets, and create 470,000 new jobs in the sector by 20209. Moreover, the Ministry of Tourism launched in 2001 another ambitious plan called Plan Azur. This later aimed to create six seaside resorts with a total capacity of 100,000 beds; yet, after thirteen years of Plan Azur, only three seaside resorts were inaugurated with a capacity of 5,000 beds[10]. Sensitive sector Despite all the efforts made by the Moroccan government through big investments and promotion of the sector worldwide to make from tourism a main source of revenue, the delay of several projects could be explained by the terrorist threats in the region and the financial crisis in the Eurozone. Therefore, the future of tourism remains very sensitive to external factors especially that the recent events in neighboring countries keeps tourists skeptical from visiting the North Africa region. Kheireddine Boulghoudan, Analyst at Infomineo [1] http://www.wttc.org/-/media/files/reports/economic%20impact%20research/country%20reports/morocco2014.pdf [2] https://www.quandl.com/collections/morocco/morocco-unemployment [3] http://www.foxnews.com/world/2014/03/18/morocco-tourism-industry-sees-2013-boost-with-10-million-visitors/ [4] http://info.worldbank.org/governance/wgi/index.aspx#reports [5] http://www.invest.gov.ma/?Id=6&lang=fr [6] https://en.santandertrade.com/establish-overseas/morocco/foreign-investment [7] http://www.lexpress.fr/actualite/monde/afrique/maroc-l-empire-accor_1106838.html [8] http://centreforaviation.com/analysis/ryanair-opens-two-new-bases-in-morocco-6-months-after-charges-dispute-and-ram-looks-for-a-partner-95684 [9] http://www.tourisme.gov.ma/fr/vision-2020/vision-2020-en-bref [10] http://www.medias24.com/ECONOMIE/ECONOMIE/15141-Le-Plan-Azur-dans-l-attente-d-une-reconfiguration.html

The IT outsourcing market is shifting rapidly. The growing globalization with all the new emerging locations, such as Mexico, Philippines, China, Malaysia and Poland, are replacing the typical India-centric onshore-offshore model. (more…)

This article is the second in a series that seek to examine the role of agriculture as a developmental opportunity for Africa. It focusses on Ethiopia and provides a broad overview of some of the key developments in agriculture. It features and analyzes the country’s agricultural progress from 1960s to date, and some future prospects. The paper aims to provide various stakeholders with a deeper understanding of Ethiopia’s dynamics of agriculture, both from a public and private sector perspective. Background Ethiopia is one of the Africa's fastest growing economies. The country’s growth originates from manufacturing, construction and agriculture-related industries. Although periodic drought and massive soil degradation have previously plagued the country’s agriculture, the sector remains the backbone of the country’s economy. Agriculture still accounts for up to 80% of total labor force, 84% of exports and 46.3% of gross domestic product (GDP). Additionally, other numerous economic activities rely on agriculture, including processing, marketing and export of agricultural commodities.[1] Introduction Ethiopia has huge agricultural potential owing to the country’s diverse climate, largely adequate rainfall, its vast fertile lands and a large pool of affordable labor. Unsparingly, the Exports are almost entirely agricultural commodities, with coffee being the largest foreign exchange earner. The country is also Africa's third largest producer of maize.[2] Agriculture remains one of Ethiopia’s most important and promising sector. However, the production has remained subsistence with the bulk of commodity exports coming from the smallholder agricultural farmers. The major crops include coffee, cereals, pulses, oilseeds, potatoes, sugarcane, and vegetables. These crops come from farmers holding an average of 1.2 hectares of land, 55 percent of whom holding less than one (1) hectare.[3] Despite the enormous potential, Ethiopia’s agricultural sector remains underdeveloped. The sector is synonymous with low productivity, low level of technology as well as weak infrastructure. The above problems are exuberated by the ever increasing population which means more encroachment into the potentially agricultural land. The scenario has seen the agricultural underperform over time. A case in point is between 1981 and 1990 when agricultural production consistently dropped while the population grew. The result of which plunged the country into a tragic famine that claimed nearly 1 million people between 1984 and 1986.[4] There are factors that contributed to the underdevelopment of the country's agriculture during the imperial period, some of which persist to date. Firstly, the neglect of the sector by the government. While significant progress is being made to revamp the sector, agriculture was heavily underfunded in the previous regimes with less than two (2) percent of the national budget dedicated to agriculture. While the current funds allocation is commendable—with the sector currently receiving about 15 percent of the national budget—spending is still insufficient to meet the sector’s needs.[5] Secondly, the tenancy and land reform remained a thorny issue in the country for a long time. The previous regimes failed to implement significant land reform thereby tolerating a perpetuated system in which the church and aristocrats owned large tracts of the farmland. A Large number of farmers were tenants providing as high as 50% of their crops as rent. Thirdly, agricultural productivity remained low in most parts of the country, making the sector largely subsistence. Lastly, there was the lack of technological development in the previous regime, a trend that is slowly changing.[6] Key agricultural sectors There are a number of crops that have remained consistently important in country’s agricultural sector. These include both the staple food and cash crops. Grains—consisting of cereals and pulses—are the most important crops and the main component of the diet of most Ethiopians. The most common grains include: are teff, maize, sesame, wheat, barley, sorghum and millet. All of these crops are mainly rain fed, and smallholders produce up to 94 percent of the food crops, while the state and private large commercial farms produce the remaining 6 percent of food crops.[7] Sesame: Sesame is Ethiopia’s 2nd largest cash export crop behind coffee. Sesame accounts for over 90 percent of the total oilseeds’ export earnings and 19 percent of total export earnings, earning more than US$ 200 million annually. The rising global demand for Sesame has seen this previously domestic consumption commodity into an important export crop. In less than a decade, Ethiopia moved from being a minor producer to one of the world’s top five producers of sesame. Ethiopia supplied more than 10 percent of the global raw sesame seeds, making the country one of the world’s leading exporters of the sesame seed.[8] Investment opportunities: Up to 95 percent of Sesame seeds are mainly exported raw, due to limited domestic processing capacity in Ethiopia. If all the 320,000 tons of Sesame seeds exported in 2012 were hulled, additional US$ 64.6 million in export revenue would have been generated.[9] The situation presents a significant opportunity for investment in Sesame hulling and other value addition facilities. Currently, consuming markets such as the US and Mexico mainly demand hulled sesame, which leaves the country’s exporters unable to meet the requirements. Teff: Touted as the world’s super-food especially in North America and Europe—is indigenous to Ethiopia, mainly used to furnish the flour for enjera, a sourdough bread, the principal form in which grain is consumed. The crop accounts for the largest share of Ethiopia’s cereal area under cultivation. Teff is mainly grown as a cash by most farmers, with Ethiopia and Eritrea being the only producers in the world. Investment opportunities: It is estimated that the Teff retails at over 10 times in the US markets than it does in Ethiopia.[10] However, there are no large-scale Teff milling companies, most buyers in the central markets are retailers and small millers that eventually sell to consumers in Addis.[11] Putting up a modern commercial milling or processing company targeting Teff export market could potentially gain from his fast-growing sector. Coffee: Ethiopia accounts for 7% of the World's Arabica Coffee production, ranking among the World's largest producers of Arabica Coffee—a species that represents approximately 70% of the world's coffee production [11bis]. Up to 95 percent of the Ethiopia’s coffee come from smallholders, and mainly grown in three regions: Ghimbi, Harrar and Sidamo.[12] Primarily, coffee is an exportable commodity that earns Ethiopia valuable foreign exchange. Coffee exports were estimated at 235,000 ton in the 2014/2015 fiscal year, with a revenue of US$862 million.[13] Domestically, the coffee market is also vibrant although often affected by high price variations from season to season. Coffee price variations are in most cases caused by surplus production in the country as well as the demand and supply in the global coffee market. Horticulture Most regions of Ethiopia have a favorable climate, adequate land and water resources for the production of wide variety of vegetables, fruits and flowers. The country’s vegetable export products include green beans, lettuce, green chilies, potatoes, melons, white and red onions, beetroots, carrots and tomatoes among others. Exportable fruits are oranges, mangos, guavas, lemons and mandarin grapefruits among others. Cut flower exports are roses, statice, alliums, and carnations. The export volume of horticultural products is growing. The flower industry, for instance, did not exist until 2005 but today, Ethiopia is the second largest supplier of roses globally.[14] In 2004/05, the value of Ethiopia’s horticulture exports was US$ 25.8 million. In 2013/2014, the value of Ethiopia’s horticulture exports reached US 245 million, 760 percent up from the US$ 28.5 million recorded in 2004/05 and created about 180,000 employment opportunities in the country. The flowers make up to 60 percent of the horticultural trade, and over 80 percent of the value of the flower trade comes from the trade with the Netherlands.[15] Fruits and vegetables account for the remaining 40 percent of the horticultural trade with over 30 percent destined for Somalia.[16] Investment opportunities: Ethiopia has a diverse variety of flowering plants. Cut flower and vegetable production are fast growing export businesses, which is a great promise. However, only 25 percent of the areas identified for horticultural development is currently developed, meaning that there is still a US$ 750 million untapped export revenue through the development of the remaining horticultural land areas.[17] Livestock: Ethiopia is Africa’s leading exporter of livestock, and one of the top ten leading global producers. In 2013, the country was home to over one hundred million livestock, consisting of 54 million cattle, 26.5 million sheep, 25 million goats and 0.925 million camels.[18] Currently, Ethiopia supplies the global market with mainly semi-processed products such as hides and skins. The animal husbandry methods are largely traditional, rendering the output per unit of livestock very low. Investment opportunities: Traditional methods of animal husbandry that is currently common in the sector present an investment opportunity for the establishment of modern commercial livestock breeding, production and processing of livestock products such as meat, milk and eggs. Government efforts The Ethiopian Government has put up mechanisms to fast-track reforms in the agricultural sector. The efforts aim to reverse some of the sector’s negative impacts witnessed in the previous decades. For instance, the government has set up a Growth and Transformation Plan (GTP) with the aim of reaching certain goals between 2011 and 2015.[19] The plan targets achieve an 8.1 percent annual growth in the market during the time frame. The plan included programs aimed at augmenting smallholder farmers’ productivity, increasing the volume of irrigated land, upgrading participation of private sector, enhancing marketing systems, and reducing the amount of households with inadequate food. Another key aspect of the transformation plan is to see the production of selected key crops doubled from to about 40 million tons during the period. The road networks are being improved, across the country with the aim of boosting faster market access for rural farmers. Besides, the private sector such as the commercial banks have also come on board to provide annual credit for the purchase of farm inputs to the smallholders. In a shift towards market-oriented agriculture, the government has introduced national business plans for specific export crops. Also, the government has also moved to encourage international investors to set up in the country. The government has moved to encourage the selling of land for setting up flower firms, with policies to generate growth, such as five-year tax breaks and duty-free import of machinery. [1] Netherlands Space Office, 2014. Quick Scan Ethiopia. Retrieved June 11, 2015 from http://bit.ly/1IXZXxa. [2] USDA, 2015. Foreign Agricultural Service: Production, Supply and Distribution. Retrieved June 11, 2015 from http://1.usa.gov/1cjol7M. [3] Zuberi. M. I., T. Gosaye and S. Hossain, 2014. Potential threat of alien invasive species: parthenium hysterophorus l. to subsistence Agriculture in Ethiopia. Sarhad J. Agric. 30(1): 117-125. Retrieved June 11, 2015 from http://bit.ly/1FiMxV0. [4] USAID/Addis Abbaba, 1987. Final Disaster Report: The Ethiopian Drought/Famine for Fiscal Years 1985 and 1986. Retrieved June 12, 2015 from http://1.usa.gov/1cW917k. [5] ACCORD, 2014. Putting Small-Scale Farming First: Improving the National Agriculture Investment Plans of Burkina Faso, Burundi, Ethiopia, Rwanda and Tanzania. Retrieved June 12, 2015 from http://bit.ly/1G88Ddm. [6] Lombardi, Annie 2013. Ethiopia: Managing water and adapting farming practices to provide food security. Retrieved June 12, 2015 from http://bit.ly/1JQ4Loz. [7] Atsbaha Gebre-Selassie, 2012. A Review of Ethiopian Agriculture: Roles, Policy and Small-scale Farming Systems. Retrieved June 12, 2015 from http://bit.ly/1Siis16. [8] Author’s calculation based on FAOSTAT data, accessed on June 12, 2015 from http://bit.ly/QIPNHr. [9] Author’s analysis based on FAOSTAT data, accessed on June 12, 2015 from http://bit.ly/1IyWFxm. [10] The Guardian, (2015). Move over quinoa, Ethiopia's teff poised to be next big super grain. Retrieved June 12, 2015 from http://bit.ly/1eURBn8. [11] FAO, (2013). Analysis of Incentives and Disincentives for Teff in Ethiopia. Retrieved June 12, 2015 from http://bit.ly/1TgdnrB. [11bis] Index Mundi from http://www.indexmundi.com/agriculture/?commodity=green-coffee&graph=arabica-production [12] ECX, (2015). Commodity Briefs: Coffee. Retrieved June 11, 2015 from http://bit.ly/1IwzILn. [13] Ethiopia GP, (2015). New: Ethiopian Coffee Exports to Hit Record in 2015. Retrieved June 11, 2015 from http://bit.ly/1GuZ7pa. [14] Deloitte, (2014). Ethiopia: A growth miracle. Retrieved June 12, 2015 from http://bit.ly/1MvkrLE. [15] Ethiopian Embassy in Brussels, (2015). The 6th international horticulture exposition Conference: 25th - 28th of March 2015 in Addis Ababa. Retrieved June 12, 2015 from http://bit.ly/1C2Fn7e. [16] Author’s analysis based on ITC Trademap data, accessed on June 11, 2015 from http://bit.ly/1INdszS. [17] Author’s analysis based on Ethiopian Horticulture Producers Exporters Association data, accessed on June 11, 2015 from http://bit.ly/1KK2VF1. [18] Author’s analysis based on FAOSTAT data, accessed on June 11, 2015 from http://bit.ly/1MLO4ZG. [19] MoFED, 2010. The Federal Democratic Republic of Ethiopia Growth and Transformation Plan (GTP) 2010/11-2014/15, accessed on June 11, 2015 from http://bit.ly/1J1dbJy.

[vc_row 0=""][vc_column][vc_column_text 0=""] Mobile Insurance meets with great success in several African insurance Markets such as Kenya, Nigeria, Ghana and even Tanzania. This success helps boosting the insurance penetration rates in several African countries generally under 3% which is still low compared with the worldwide penetration rate of 6.5%. (more…)

[vc_row 0=""][vc_column][vc_column_text 0=""]In most African countries, large proportions of the labor force are employed in the agricultural sector. Despite this important contribution to the economy, African agriculture is still characterized by low productivity compared to non-agricultural sectors. The sector’s shares in the GDP are systematically lower than the employment shares of agriculture in most countries in the continent. While globalized trade interaction is on the rise, African participation in the international agricultural market remains low, at only two (2) percent.[1] (more…)

From oil and gas to diamonds and other minerals, Angola is extremely rich in natural resources and its economy is deeply influenced by them. Proof of this is that 42.39% of the country’s GDP (Gross Domestic Product) in 2013 was due to Oil and Diamonds alone. On the other hand, Angola is listed as a Low Human Development Country and it is estimated that over 54% of its population lives on less than 2 USD a day. Having said that, this article attempts a short journey at some of the Angolan natural resources to understand if their economic impact can be translated into social development. (more…)

During the 2014 G20 summit held in Australia, leaders of the major world economies stressed the high importance of funding infrastructure investment, a key driver of economic growth. According to the B20 Infrastructure & Investment Taskforce (a working group of business leaders of G20) the need in additional infrastructure capacity from now to 2030, is estimated to reach USD 60-70 trillion while under current conditions only USD 45 trillion is expected to be achieved. To close this USD 15-20 trillion gap, the B20 taskforce provided a list of recommendations related to six key areas, including national infrastructure investment strategies, infrastructure pipelines and independent national infrastructure authorities, a global infrastructure hub, promotion of FDIs, and increasing long-term financing. (more…)

[vc_row 0=""][vc_column][vc_column_text 0=""]As the African continent is struggling to meet its increasing of food self-sufficiency demands, the food market is becoming very attractive for investors. It is also a major market due to the population’s increase of purchasing power over the last years. The situation in Senegal regarding the most common commodity in the country: rice, is particularly intriguing. US$ 374.2 million[1] imported value in 2013 Senegal’s imports represented almost 20% of world imports Yearly consumption in the country is at 74kg per capita[2] (more…)

One of the main drivers of the aviation industry is the economic growth and development. There is a proved correlation between the amount of air travel and Gross Domestic Product (GDP) around the world that can be observed in the two graphs bellow (MIT). Now taking the example of China as a starting point to highlight this correlation and according to a research done by the University of Nottingham in 2007 in China, for “every 10% increase in a Chinese regional GDP, the volume of air passengers will increase by 8.4% and that of air cargo by 14.8%, holding other conditions unchanged” (Nottingham Study). If we do a parallel with Africa, the region should not be the exception. According to the International Monetary Fund data, sub-Saharan Africa has grown at an annual rate of 4.8% over the last five years. Beating emerging regions like Latin America (3.3%). The potential for economic growth is still there; this time however the growth is not coming only from rising prices of commodities that started in 2010, small and medium enterprises add some 40% to the continent’s GDP and contribute to 50% of overall employment in Africa (Standard Chartered from World Bank), Nigeria for instance, the largest oil producer in Africa, services sector account for more than 50% of GDP. Certainly these successful small and medium businesses will nourish good work conditions and higher wages and salaries that will make an emergence of a middle class evident. If we look back into the last decade, Africa’s poverty incidence has fallen from 58% in 1999 to 48.5% in 2010, by 2030 this indicator is estimated to fall to 16.7%, experts say (World Bank). And as the African Development Bank Chief Economist Mthuli Ncube said in one of his interviews to Reuters: ”Reducing poverty means creating a middle class”. We know the rest of the story; middle class is most probably interested in traveling in good conditions, safe airplanes and well served airports, and avoiding the scenario of having to travel to Europe or Dubai to get to many African capitals. For instance, in a quick Internet travel search, we can note that no direct flight is available and the most surprising thing is that, the cheapest flight is operated by a Middle Eastern airline via Dubai. The same pattern is happening when it comes to trading between African countries: it is still cheaper to export something to another African country via Dubai or Europe than directly. It is clearly penalising the regional trade. We easily understand why the Doing Business 2011 report, shows Sub-Saharan Africa as the world’s most expensive region to trade within. Despite this, we are seeing lately the emergence of major hubs in Eastern and southern Africa, around these 3 cities: Johannesburg, Addis Ababa and Nairobi. This is partly because they are associated to their 3 efficient state-owned carriers: South African Airlines, Ethiopian Airlines and Kenya Airways (ADBG). The good thing about aviation connectivity is also opening remote regions to global community, meaning getting access to tourist’s money and products (pharma, cutting edge technology products…) from global markets. All this sounds very appealing, for any investor. And it is. But it is also far from automatic. Here is a list of major headwinds that are facing the aviation industry in Africa: Fragmentation of the sky: Many African countries restrict their air services markets to protect the share held by state-owned air carriers. Even after signing Yamoussoukro Decision in 1999 (44 countries signed the agreement that stipulate the liberalization of intra-African air transport services in terms of access, capacity, frequency, and tariffs). A 2006 study done by “Intervistas (2006) on behalf of IATA” on the impact of open sky in southern Africa region (SADC), demonstrated that prices on liberated roots have declined on average by 18%. In cases where low-cost carriers entered the market, prices dropped 40% lower than before the liberalisation, on the flip side, passenger volumes would increase by 20% acting as traction for employment and tourism. Safety: Africa reported the world’s highest rate of fatal accidents in 2013. As of the end of 2013, only 11 African states had achieved 60% implementation of the International Civil Aviation Organisation (ICAO) safety-related standards and recommended practices (IATA). Taxation: Africa authorities see aviation as a cash cow to be milked; aircraft landing charges are generally high by international standards, partly because of the absence of non-flight revenues from airport concessions. Sometimes taxation contains a combination of ‘solidarity’ taxes, tourism taxes, VAT, and infrastructure development fees. An example of that is the new rail levy tax in Kenya applied on jet fuel for international flights that will cost airlines an additional $13 million a year in fuel bills (ADBG, IATA) There is still lot to be done but key to this potential growth is government support and more involvement of international aviation bodies in consulting authorities and highlighting this golden egg. Ivory Coast just gave us a good example of that. The state invested 10.6 million of euros to rehabilitate 5 aerodromes, so the company Air Cote D’Ivoire can now join several inland cities. Ali Mhamedi, Senior associate, Infomineo

Morocco constitutes a strategic platform for the African continent. Companies often choose to set up first in Morocco to gain access into other markets in Africa. Indeed, its geographic proximity to Europe, it political stability and its cheap workforce constitute a powerful advantage. This is especially true for the aeronautics sub-contracting market. However, there is still a long way to go to be among the top performers in this sector. (more…)

[vc_row 0=""][vc_column][vc_column_text 0=""]For many decades Africa was known for its oil & gas and mineral potential, this is still true at the 21st century but it’s not the only African reality; as the share of the middle class with floating class in Africa increased from 26.2% in the 80s to 34.3% in 2010, this enormously helped boosting internal consumption and the emergence of growth markets. (more…)

One of the main drivers of the aviation industry is the economic growth and development. There is a proved correlation between the amount of air travel and Gross Domestic Product (GDP) around the world that can be observed in the two graphs bellow (MIT). Now taking the example of China as a starting point to highlight this correlation and according to a research done by the University of Nottingham in 2007 in China, for “every 10% increase in a Chinese regional GDP, the volume of air passengers will increase by 8.4% and that of air cargo by 14.8%, holding other conditions unchanged” (Nottingham Study). (more…)

The financial sector is struggling to develop in Africa. Basically, this is due to the low purchasing power of Africans to afford insurance or to deposit and save their money in bank accounts. A large part of Africa's population is still excluded from the financial system. For instance, the banking penetration rate is 23% in Africa, 11% in Central Africa, and only 2% in Niger. However, with the advancement of emerging technological innovations, the financial sector in Africa is being restructured. Mobile payment system is an example of technologies that promote financial inclusion and provide opportunities for financial integration in Africa. (more…)

Egypt is one of the largest markets in the Middle East. A population of more than 86 million makes it an attractively profitable market in the Arab World. The youth population and its continuous exposure to social media is driving the economy; they are educated, open minded and technologically savvy. The obvious social shift has a significantly positive effect on Egypt’s economy. Social changes besides to the emergence of a more financially-comfortable middle class have caused intense shopping behavior. Moreover, “by 2018, more than 72% of households are expected to be in this middle-income bracket”, which represents the key demographic for increased future household spending (Invest in Egypt) (more…)
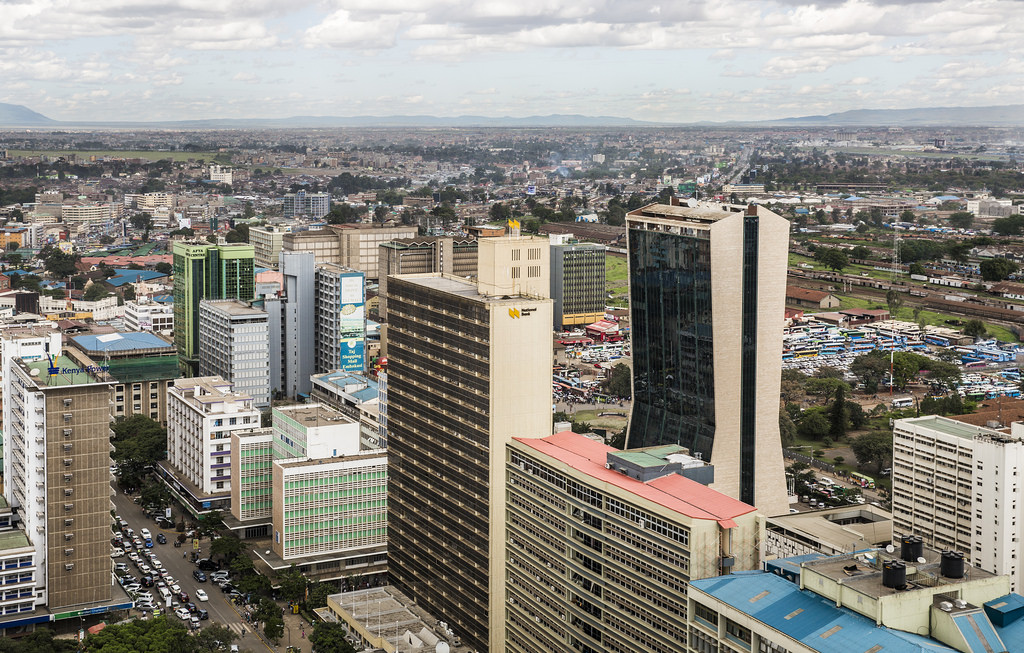
The Kenyan banking sector is composed of 52 institutions, including 43 commercial banks, 1 mortgage finance company and 8 deposit-taking microfinance institutions. The sector is dominated by multinational banks (such as Standard Chartered, Barclays, etc.) and Pan-African groups (such as KCB, Equity Bank, etc.). As of December 31st, 2010, the country included 1,063 bank branches and 1,974 ATMs (Automatic Teller Machine). In addition to the mainstream banking models, the sector in Kenya is characterized by the increased use of E-banking services which became the preferred mode of banking instead of an alternative channel. (more…)

“Be fearful when others are greedy and greedy when others are fearful”, Warren Buffet’s sound business advice for picking good stock might apply perfectly in the case of a start-up looking to expand internationally. When scouting for a location for its 2nd African office, Infomineo settled, rather quickly, on Egypt as a logical choice to fortify the company’s geographical footprint in the continent. Arguably, Egypt has weathered the storm relatively peacefully compared to neighboring geographies, showing that the country has some solid stability pillars that are hard to shake. (more…)

1. Africa is a cheap place to do business No, Africa is not a low-cost business destination. On the contrary several of its most attractive destinations are extremely costly, like Luanda or to a lesser extent Lagos. Several factors account for this and it is important to understand them. Talent is scarce, so the best and brightest command very high salaries. In addition the tax rates on these salaries are often very high to compensate for the small base of people officially employed. Logistics is a challenge. In many countries the infrastructure is weak, leading to port and road congestion, long transportation times and lots of waste. The route to market is also long. Instead of simple manufacturer → wholesaler → retailer → consumer routes, in Africa the number of intermediaries can be very high, with each of them taking their margin. (more…)

[vc_row 0=""][vc_column][vc_column_text 0=""]The low purchasing power of the continent, as well as the underdeveloped formal banking penetration set ground for the micro finance solution to thrive. The multi-billion dollars microfinance industry in Africa has currently a gross loan portfolio of $8.5 billion and reaches a consumer base of 8 million people. According to the World Bank financial inclusion data, the Sub-Saharan African region is among the least unbanked geographical areas in the world; only 24% of the population above 15 years old of age benefit from an account at a formal financial institution. (more…)

One of the questions which is often asked to Infomineo is: Is Africa one continent, is it 54 different countries or is it anything in between? The answer is quite clear today: it is something in between. In fact the old approach to Africa, grouping countries based on colonial heritage, languages or religions, doesn't make much sense any more. This is due to the fact that politics have largely been replaced by the economy. Then the question becomes: What is the best way to cluster Africa ? (more…)

In my previous article published in March, I gave you a general overview of luxury real estate market in Western Africa with a focus on Nigeria and Ghana. Today let us talk about some major projects initiated in Senegal and Côte d’Ivoire. Senegal: A new wind is blowing for the luxurious real estate market With the era of new infrastructures initiated during the last 10 years, the Senegalese luxurious real estate market is also rising. The capital, Dakar gathers the most important luxurious real estate projects. The town is well-known as one of the West African cities where the real estate is very expensive. Over the recent years, huge projects in terms of real estate are flourishing. The most famous among them, Waterfront is developed by Teyliom Group. (more…)

I recently had the chance to spend 5 days in the Ethiopian capital, Addis Ababa, on a market study business trip in the sector of beauty and personal care products. This visit gave me the opportunity to discover some key areas of the business as well as few interesting aspects of Ethiopia and its culture, which were completely unknown to me, and which I believe would be worth sharing. Ethiopia is a landlocked country located in East Africa. It is the 10th largest country of the continent with a total area of 1,104,300 square km. It has a population of more than 85 Million, with more than 50% of it aged bellow 20 years old. Agriculture is the backbone of the Ethiopian economy with 90% of the population earning its living from the land. The country main agricultural export is Ethiopian coffee, for which it is internationally renowned, and the local currency is the Ethiopian Birr (1Euro=26 Birr). (more…)

West African countries represent a population of 245 million of inhabitants. With a yearly average income of $309 for each person, the region‘s economic growth has yearly reached 2.5%. The International Monetary Fund (IMF) expects that globally sub-Saharan Africa’s growth will continue with an annual GDP growth forecast of 5-6% over the next five years. (more…)

According to the IMF, Africa is home to 5 of the top 10 fastest growing economies in the world. The world’s second largest continent’s growth potential stimulates domestic and foreign infrastructure investments in order to achieve self-sufficiency and global competitiveness. The latest African Construction Trends Report by Deloitte kept record of a total investment of over $222 Billion in over 322 projects. The projects under the scope of the study are infrastructure construction projects, with a value of over $50 million, that are in progress but not been commissioned yet. These projects do not include private mining ventures and social infrastructure including housing, roads, schools, clinics, water and sewage reticulation. (more…)

The Market Capital Authority in Morocco has done a study to launch a Commodity Exchange market, looking forward to prepare the financial and the legal framework to develop this project, after assessing its success potential. A Commodity Exchange is a market in which multiple buyers and sellers trade commodity-linked contracts on the basis of rules and procedures laid down by the exchange. Such exchanges typically act as a platform for trade in futures contracts which are a legally binding agreement that gives the investor the right to buy or sell an underlying commodity at a fixed price on a future date. A handful of African Countries have set up commodity exchange markets in an effort to develop the agricultural sector and improve food security. South Africa remains the best to trade in commodities in Africa, and is ranked 14th internationally. (more…)

Today I was stuck in a traffic jam in Nairobi, talking to the driver, Henry. His story sheds lights on what makes me hopeful for Africa, it illustrates that if one has energy and intelligence it can, in most cases succeed. Henry was born in a small city in rural Kenya. He was able to attend school until the age of 9, where he was very bright , one of the best in his class. Unfortunately his parents divorced and he had to be brought up by his grandmother who didn't have much money and needed him to work. At age 21 he got married and he had four children before he turned 30. He got into the taxi business where he has become the perfect driver: available, timely and resourceful. (more…)

Ranked among the last countries in terms of development despite its position of the fourth largest uranium’s producer worldwide, Niger has been for a longtime characterized by a clearly poor economy and population image. September 2001 was my first real contact with the country, as a real habitant. From this date to 2012, nothing changed, except a new bridge in the capital in 2011. The 2001’s picture was the same as the 2012’s one, with no hope on a better future for economy and population. The country still at the bottom of the HDI ranking, no major measures are taken to change the situation. December 2013, I went back to Niger and my first impression was: what happened to this country? (more…)

On February 2012, The Saudi ministry of Commerce and Industry announced an export ban on cement and clinker in order to meet local demand and contribute to price stability in the Kingdom. The only exception was Bahrain, whose market will still benefit from Saudi cement inflow up to 25,000 bags/ week. (more…)
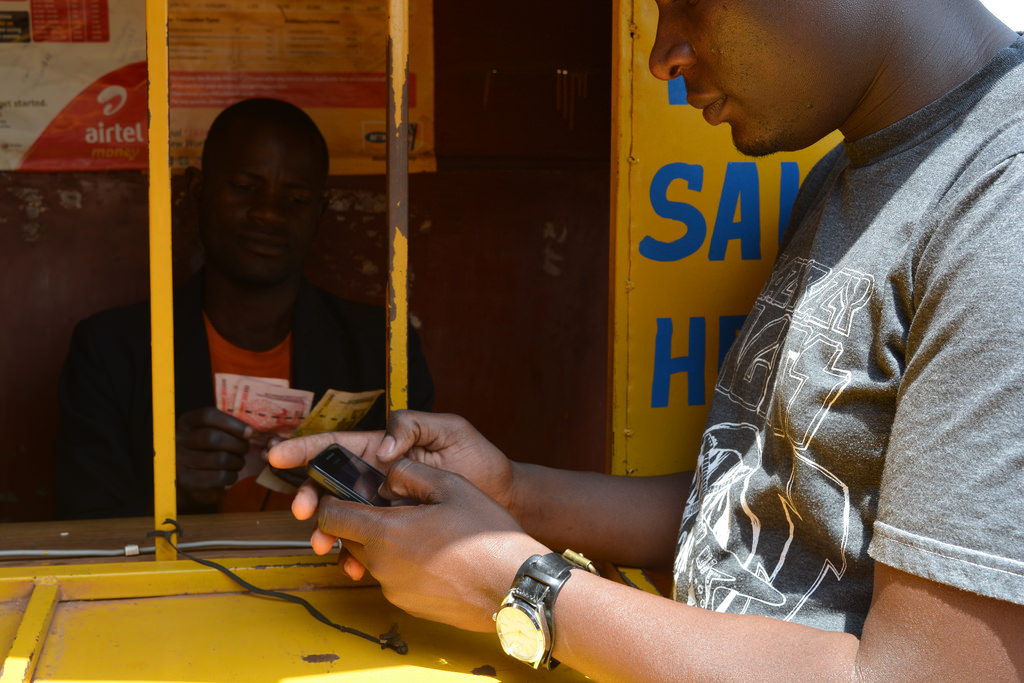
With a growing middle class and a population that is moving into the cities, Africa is on a positive growth trajectory. According to the African Development Bank, African consumers will spend about US$2.2tr annually by 2030. Africa is ushering in positive indicators across the board. The challenge is how to reach this growing demand in a continent where not everyone has access to financial services, rural areas are still highly populated and the costs of expanding ATMs and bank branches to remote rural areas are prohibitive. (more…)

Over the last couple of years, I have been involved in few research projects on the ground in different regions in Africa, including northern, western and sub-Saharan parts of the continent. Few learnings kept coming up over the course of these assignments showing me what a vast geographical space Africa is ,and that conducting business in the continent can, oftentimes, be challenging, but that doesn’t mean it can’t be fun. Hereafter my top 5 learnings that I thought it would be worthwhile to share: (more…)

Nigerian banking industry, regulated by the Central Bank of Nigeria (CBN), is made up of commercial banks and development finance institutions, microfinance banks, finance companies, discount houses and primary mortgage institutions. Economically, Nigeria is now a very attractive country as corruption is being treated and its economy is annually expanding at almost 7 percent, while the inflation’s rate in fewer than 10 percent and keeps going down. In 2005, Nigeria’s government made a consolidation of the banking sector, taking the number of banks from 89 to 24, with capital reserves reaching 25 billion Naira, from the initial 2 billion. The country’s economy was doing well and banks were performing. In 2007, Nigerian capital market was one of the world best-performing ones. (more…)

In the past decades, China has been the center of all attentions, rising from a third world country to being the second largest economy in the world. While it eased access to its vast domestic market, it also emerged as the world’s factory floor, becoming a world class location to produce and source a wide range of products. Arising as a global economic powerhouse, China is now going on a shopping spree, buying companies and increasing cooperation with economies all around the world to capture opportunities that globalization stands to offer. (more…)
Africa achieved a real GDP CAGR of 5.2% over 2005-2010, in comparison with 2.0% for Western Europe and 3.4% for the world. IMF expects a 5.5% CAGR for African real GDP over 2010-2015, in comparison with 1.9% in Western Europe and 4.5% for the world. This sustained and broad-based economic development has triggered an increasing need in the hospitality sector and has created investment opportunities. In fact, Africa, like other recently emerging markets, shows a significant deficit in terms of infrastructure. Most African countries lack hotels and long stay residential projects of international standards for commerce and leisure. The African continent suffers from an increasing imbalance of hotels supply and demand. As a result, key destinations in Africa are experiencing artificially high RevPAR and yield levels making it a rewarding sector for investment. (more…)
Infomineo provides services to companies seeking either a nearshore outsourcing platform for their EMEA operations or looking for information of African and Middle Eastern services. To promote these services my partner Hamza and I travel extensively to visit our clients and prospects around the world, including in the USA, France, Germany, the UK, Switzerland, Belgium, the UAE, South Africa and of course where our head office is based, in Morocco. Although these insights may not be statistically valid we have been able to see different attitudes towards Africa. (more…)

Insurance is considered as one of the booming industries in Africa thanks to the insurers’ will of deepening insurance penetration and take advantage of the continent’s promising trends. It wasn’t an easy task for the insurers to convince African people to buy their coverage products especially when those products are not made compulsory by the law. In order to overcome the constraints of the African market, insurers adopted an interesting distribution business model. (more…)

Private equity seems to hold the African growth promise. Amid the sluggish economy and the lengthy deleveraging process that the developed countries have been going through, Africa is rising as a fertile, promising, and untapped playground for foreign investments. Investors are shifting gears towards the black continent, not only to diversify away from a slowing economy, but also to grasp the unrivalled opportunity that Africa has to offer. Africa’s real GDP has been growing at an average compound rate of 5% in the last 5 years, a pace that is faster than that of developed nations. Other economically viable reasons to set foot on the continent, to name a few, are: a booming consumer market that is expected to reach US$1 trillion by 2020, an advancing and more efficient financial sector, and more importantly new governmental measures that aim at bolstering new opportunities through reforms and diversification from oil industries. (more…)

With a total market of approximately 80 million consumers, the West African market is attracting more and more investments every day. According to the IMF, annual growth rate will be around 6 percent for sub-Saharan countries, while for McKinsey, overall African GDP will reach 2600 billion dollars in the next decade. The European crisis led to a new economic scheme on the African continent, illustrated by more inter-African cooperation acts. This is the case with Morocco, which has become the second largest African investor in the continent, behind the leading South Africa. Morocco reached this rank by the important presence of its big companies such as Maroc Telecom, OCP, ONE or Managem; but mainly because of the presence of its three big banks: Attijariwafa, BMCE and Banque Populaire. (more…)

Working on Infomineo's expansion plan, I had the occasion to make a business trip to Egypt recently and wanted to share a few impressions. First of all, if I hadn't known about the recent political events I would probably not have noticed anything. The city is roaring, people are busy and you don't see protesters or flags or any traces of violence (at least where I went, including in Nasr city which is a stronghold of the Muslim Brotherhood). The only light sign is that there are a few checkpoints here and there, for example on the road to the airport, but with today's global terrorist threat you see this is many cities, from Paris to New York or Casablanca. There is no consensus among the people I spoke to, including supposedly well-informed journalists, on whether the situation will stabilize or will, on the contrary, evolve to more violence. (more…)

The African continent is often considered as a place of great opportunities for mining resources. But, figures show a different reality: the African continent accounts for 5.5% of the world total production in 2011[1], behind Asia (58.2%), Northern Americas (14.5%), Europe (9.9%) and Southern Americas (7.0%) and close to Australia (4.9%). This apparent contradiction is explained by the fact that, despite the relative small weight of Africa in the World mining production, Africa is the leading region of production for specific minerals, often highly valuated. (more…)

As we saw in the previous article, Africa has considerable agricultural potential in terms of lands but doesn’t take full advantage of it because of its lack of means. On other continents, the situation is in the opposite direction as the developed regions of the world started to run out of agricultural resources for various reasons over the last decades. Those contrasted situations created some opportunities for both sides that led to many large-scale land investments. In this article we are going to explain the reasons behind such investments and we will focus on the investor’s and target’s profiles. The world has grown fast, too fast for the agricultural sector which was neglected by the developed regions in the world in favor of industry and services: the part of agriculture in GDP represented less than 10% in 1970 and 2% in 2011. (more…)

The Moroccan insurance market realized an interesting jump during the last 5 years. In 2012, the industry totalized MAD 26 billion of premiums vs. MAD 19.7bn in 2008 which represents a CAGR of 7.14%. The penetration rate (premiums/GDP) of the industry remains low compared with the world average of 7% even if it grew from 2.9% to 3.1% between 2008 and 2012. From an insurer’s perspective, a low penetration rate means a big potential in the insurance market so insurers just have to figure out a way to make the best of this potential by: (more…)

Once famous only for its abundant natural resources, Africa is gradually becoming a growing pool of qualified human resources. From the African diaspora looking to come back to seize opportunities in home countries to locally educated talent, the continent is now offering recruiters a bigger pool to choose from. Needless to say, this hasn’t always been the case: decades of political conflicts and failing economic policies have led to a continuous drain of Africa’s talent towards more stable and growing parts of the world. This post will address talent sourcing issues in Africa and assess the current switch that the continent is witnessing, from a talent exporter to a talent importer. (more…)

The West African banking system is characterized by two (2) main banking markets. On one hand the UMOA zone ( West African Monetary Union ) having a common currency for the West African CFA franc (XOF ) and regulated by the Central Bank of the States of West Africa (BCEAO) . On the other hand, the market of English-speaking countries mainly dominated by Nigerian banks which are becoming increasingly important in the entire West African region, occupying the first places in regional ranking. (more…)

Africa has the second largest agriculture potential in the world in term of land area. But it also has one of the largest populations, Agriculture employs more than 60% of it and accounts for 32% of the African GDP, but the continent is sometimes accused of producing “cash crops” while it is still suffering from malnutrition and is far from being self-sufficient. In this article, we will focus on the crop production in Africa and the impacts on its balance trade. (more…)

In the most expensive city in the world[1]: Luanda, Angola, everything is expensive but time. Even with pre-scheduled meetings, people can leave you waiting for more than an hour and just apologize for it with a common smile; a smile that I will come to understand over the course of my assignment in the country and that translates simply into “Sorry, traffic!”: Navigating the streets of the capital can take an easy two to three hours to move between districts, a clear indicator that Luanda’s infrastructure is not catching up with the city’s exponential and visible growth. (more…)

118 million liters, it is the volume of alcohol consumed in Morocco in 2011, according to the IWSR (International Wine & Spirit Research). Beer holds the first place with 68.3% (80.7 million liters) of total consumption, followed by wine accounting for 27.2% (32.1 million liters), and spirits for 4.5% with a volume of almost 5.3 million liters. Despite the global economic downturn which impacted both local consumption and tourists’ spending, the sharp tax increases in 2010, and the introduction of compulsory security markings (SPICA), the Moroccan Alcohol market grew by 0.5% compared to 2010, where nearly 117.5 million liters were consumed. (more…)

According to fDi Magazine (a division of The Financial Times), South Africa has been crowned as the African country of the future for 2013/2014, with Morocco in second position and Mauritius in third. This ranking takes into account 6 key indicators with data gathered from 55 countries: Economic potential, Labour environment, Cost-effectiveness, Infrastructure, Business friendliness and FDI (Foreign direct investment) strategy. (more…)