


Abstract
Using archived data from the Chandra X-ray telescope, we have extracted the diffuse X-ray emission from 49 equal-mass interacting/merging galaxy pairs in a merger sequence, from widely separated pairs to merger remnants. After the removal of contributions from unresolved point sources, we compared the diffuse thermal X-ray luminosity from hot gas (LX(gas)) with the global star formation rate (SFR). After correction for absorption within the target galaxy, we do not see a strong trend of LX(gas)/SFR with the SFR or merger stage for galaxies with SFR > 1 M☉ yr−1. For these galaxies, the median LX(gas)/SFR is 5.5 × 1039 ((erg s−1)/M☉ yr−1)), similar to that of normal spiral galaxies. These results suggest that stellar feedback in star-forming galaxies reaches an approximately steady-state condition, in which a relatively constant fraction of about 2% of the total energy output from supernovae and stellar winds is converted into X-ray flux. Three late-stage merger remnants with low SFRs and high K-band luminosities (LK) have enhanced LX(gas)/SFR; their UV/IR/optical colors suggest that they are post-starburst galaxies, perhaps in the process of becoming ellipticals. Systems with LK < 1010 L☉ have lower LX(gas)/SFR ratios than the other galaxies in our sample, perhaps due to lower gravitational fields or lower metallicities. We see no relation between LX(gas)/SFR and Seyfert activity in this sample, suggesting that feedback from active galactic nuclei is not a major contributor to the hot gas in our sample galaxies.
Export citation and abstract BibTeX RIS
1. Introduction
The idea that mergers of equal-mass spiral galaxies produce elliptical galaxies was first suggested by Toomre & Toomre (1972) and Toomre (1977). Early computer simulations found that major mergers (i.e., equal-mass pairs) may destroy the disks of spirals, creating spherical systems resembling ellipticals (Barnes et al. 1991; Hernquist 1992; Barnes & Hernquist 1996; Bekki 1998; Naab et al. 1999; Bournaud et al. 2005; Cox et al. 2006b). More recent models show that if sufficient cold interstellar gas survives the merger, it may settle into a plane, re-forming a disk (Barnes 2002; Springel & Hernquist 2005; Robertson et al. 2006). This means that whether the final merger remnant is an elliptical or a spiral depends upon the fate of the interstellar gas. The final quantity of cold gas remaining after the merger depends upon the initial gas mass, the star formation rate (SFR), the amount of heating of the gas, and the amount of infall back onto the galaxies late in the merger. Galaxies that were gas rich before the merger are more likely to produce remnants with disks, since more gas survives (Springel & Hernquist 2005; Robertson et al. 2006; Hopkins et al. 2009b; Athanassoula et al. 2016). Tidal forces can pull gas out of the galaxy into extended tails, which may then fall back into the main galaxies (Hibbard & Mihos 1995; Hancock et al. 2009). In a major merger, gas can be driven into the center of the system (Negroponte & White 1983; Barnes & Hernquist 1991, 1996; Mihos & Hernquist 1994, 1996), triggering bursts of star formation, which may deplete the gas (Di Matteo et al. 2007, 2008; Cox et al. 2008). However, simulations predict that only some major mergers will have strong starbursts, and the timing of the burst varies from system to system depending upon the parameters of the system (Lotz et al. 2000; Di Matteo et al. 2007, 2008; Sparre & Springel 2016).
Other processes that affect the interstellar gas in a major merger, and therefore the final morphological type, are winds driven by supernovae and active galactic nuclei (AGNs). Stellar and supernova feedback heats the gas, potentially lowering the star formation efficiency (Cox et al. 2006b). Supernova-driven winds may drive gas out into the halo; this hot halo material may then cool and re-form a disk, triggering delayed star formation (Hopkins et al. 2013). Winds due to supernovae may remove gas from the galaxy entirely; in some simulations, the mass-loss rate from supernova-driven winds is greater than the SFR (Hopkins et al. 2012b, 2013). AGN feedback also heats the gas, potentially quenching star formation (Di Matteo et al. 2005; Springel & Hernquist 2005; Choi et al. 2015). This may allow more gas to survive to form a new disk (Hayward et al. 2014; Karman et al. 2015). Alternatively, AGN feedback may remove gas from a merger remnant, allowing the formation of an elliptical (Springel & Hernquist 2005; Khalatyan et al. 2008). Some simulations indicate that, without AGN feedback, star formation will continue long after a major merger is complete (Lotz et al. 2000; Springel & Hernquist 2005). In some models, producing an elliptical-like remnant with an old stellar population requires a powerful AGN to clear out the leftover gas (Springel & Hernquist 2005; Hopkins et al. 2006; Sparre & Springel 2017). When pre-existing hot gaseous halos are included in merger simulations, infall from the halo helps sustain star formation, but the efficiency of star formation is decreased because of the heating of halo gas by shocks and by the conversion of satellite orbital energy into heat (Sinha & Holley-Bockelmann 2009; Moster et al. 2011; Hwang & Park 2015; Karman et al. 2015). Model predictions depend upon the resolution of the simulation and the details of the calculations, with higher resolution models including multiphase interstellar gas producing more efficient star formation (Teyssier et al. 2010; Hopkins et al. 2013; Hayward et al. 2014; Sparre & Springel 2016). The duration and intensity of the starburst as well as the final morphology of the merger remnant depend strongly upon the prescription for stellar feedback assumed in the model (Hopkins et al. 2012b; Fensch et al. 2017). How effective AGN feedback is in quenching star formation also depends upon the details of the model (Choi et al. 2015).
To test these feedback models, X-ray observations are required. With high-resolution X-ray imaging, the distribution, temperature, and mass of the hot gas within galaxies can be studied and compared to other properties of the galaxies. In spiral galaxies, the bulk of the hot gas is attributed to feedback from Type II supernovae and young stars (Strickland et al. 2000; Grimes et al. 2005; Owen & Warwick 2009; Mineo et al. 2012b; Li & Wang 2013), while the origin of the hot gas in ellipticals is still under debate. Elliptical galaxies typically have hot gas masses in excess of that expected from star formation feedback alone (O'Sullivan et al. 2001a; Su et al. 2015; Goulding et al. 2016). As summarized by Mathews & Brighenti (2003), traditionally several processes were thought to contribute to the hot gas in ellipticals: (1) a component associated with the older stellar population of the elliptical, including thermalization of the gas lost by red giants and AGB stars and heating by Type Ia supernovae, (2) re-acquisition of hot gas previously ejected into the halo by Type II supernovae during an earlier star-forming phase, (3) accretion of leftover primordial gas, and (4) feedback from AGNs. In the first models of hot gas production in ellipticals, an early starburst used up or cleared out most of the interstellar gas in the system, leaving the galaxy gas deficient until the hot halo was slowly replenished by mass loss from the older stellar population and Type Ia supernovae (Ciotti et al. 1991; Pellegrini & Ciotti 1998). AGN feedback was then added to the scenario to prevent overcooling (see Mathews & Brighenti 2003 and Ciotti et al. 2017, and references therein). In the paradigm of ellipticals being formed by major mergers, Cox et al. (2004, 2006a) suggested another possible source of the hot gas in ellipticals: (5) shocks from the direct collision between two gas disks. Yet another possible source of hot gas in merger remnants was suggested by Hibbard & Mihos (1995) and Read & Ponman (1998): (6) gas shocking during infall from tidal features. However, based on hydrodynamical simulations, Cox et al. (2006a) conclude that such infall is not a major contributor to the hot gas.
Observational studies show that the total X-ray luminosity of ellipticals scales with  (O'Sullivan et al. 2001a), while the hot gas LX scales as
  (Su et al. 2015) or
  (Goulding et al. 2016). The hot gas luminosity in ellipticals scales steeply with gas temperature, as
  (Goulding et al. 2016). These relations indicate that simple models of X-ray production due to virialization of gas from stellar mass loss are insufficient, and other factors contribute (Goulding et al. 2016). There is an anticorrelation between the global LX/LB ratio of ellipticals and fine structure parameters indicative of a past merger, suggesting that the amount of hot gas increases late in a merger (Mackie & Fabbiano 1997; Sansom et al. 2000; O'Sulllivan et al. 2001b). The global LX/LB of ellipticals also increases with stellar population age (O'Sulllivan et al. 2001b), supporting a picture in which the hot gas halo is built by stellar mass loss from older stars.
In the current study, we aim to better understand the spiral-to-elliptical transformation process and the origin of the hot gas in ellipticals by using archival X-ray imaging data from the Chandra telescope to measure the hot ionized interstellar gas in a sample of 49 major mergers. We will compare these to models of hot gas production during mergers. These models include a range of processes, including shock heating of gas due to the collision itself (Cox et al. 2004, 2006a; Sinha & Holley-Bockelmann 2009), shock-heated infalling tidal gas (Hibbard & Mihos 1995; Cox et al. 2006a), winds from Type II supernovae and stellar winds associated with a young stellar population (Hopkins et al. 2013), and AGN feedback (Cox et al. 2006a). The goal of the current study is to test models of stellar and AGN feedback in major mergers by determining how the diffuse X-ray-emitting gas varies with SFR, merger stage, starburst age, and AGN activity and comparing with normal spiral and elliptical galaxies.
Since the timescale for mergers is long (greater than 1 Gyr), testing models of hot gas production in mergers observationally requires a large sample of major mergers in a range of merger stages. The first X-ray versus merger stage study was conducted by Read & Ponman (1998) using low-resolution X-ray images of eight systems from the ROSAT satellite. Their ROSAT measurements included flux from both hot interstellar gas and point sources. They found that, near the middle of the sequence, where LFIR and the far-infrared (FIR-)to-blue luminosity ratio LFIR/LB increased, the ratio of the total X-ray luminosity to that in the FIR, LX/LFIR, decreased. Lehmer et al. (2010) also found a deficiency of total X-ray luminosity LX compared to LFIR for high FIR luminosity galaxies. The cause of this deficiency is uncertain; it may be due to the absorption of the X-rays or to contributions from AGNs to powering the FIR light.
High-resolution X-ray observations with Chandra are able to resolve the brightest of the point sources and to separate their fluxes from that of the hot gas. In an earlier Chandra study, we found a deficiency of ultraluminous X-ray point sources (ULXs; LX > 1039 erg s−1) relative to LFIR for ultraluminous infrared galaxies (ULIRGs; Smith et al. 2012). This deficiency in ULXs in high SFR galaxies was later confirmed by Luangtip et al. (2015). In the current study, we investigate whether there is a corresponding depression in the diffuse X-ray luminosity relative to the SFR at high LFIR or if the global deficiency is due to point sources alone.
The first Chandra study of the diffuse X-ray emission from hot gas in a merger sequence was done by Brassington et al. (2007), using nine systems. They found that in mid-sequence, the X-ray dropped relative to LFIR, then late in the merger, there is an increase in LX to the level found in ellipticals. They concluded that the mid-merger drop in the X-ray flux was because hot gas was escaping from the system, while in the early stages, the gas is confined. Freely flowing hot gas produces little X-ray emission in contrast to hot gas confined by surrounding cooler gas (Hopkins et al. 2012b). Brassington et al. (2007) suggest that LX drops off before the FIR because of the initiation of large-scale outflows from starburst-driven winds before the starburst reaches its peak. They suggest that, once extended winds form, LX drops due to a rapid decrease in the density of the gas, and therefore its X-ray emissivity.
The Brassington et al. (2007) results, although intriguing, are tentative due to the small sample size. Due to the unique interaction parameters associated with each system, there are likely galaxy-to-galaxy variations between galaxies in the same evolutionary stage as well as variations in the gas content and mass of individual galaxies in their sample. In order to better understand the evolution of the hot gas in galaxy mergers, a larger sample size is needed. More than one system in each stage of the merging sequence must be observed for a reliable test of the models.
In the current study, we use Chandra data to investigate the hot X-ray-emitting gas in 49 major mergers in a range of merger stages spanning the full merger sequence. In addition to X-ray observations, observations at a wide range of other wavelengths are needed to track the evolution of various components of the galaxy. Broadband optical and near-infrared images trace morphological transformations in the underlying stellar component of the galaxy, for example, the development of the characteristic r1/4 law radial light profile of ellipticals (Schweizer 1982; Wright et al. 1990; Stanford & Bushouse 1991; Scoville et al. 2000; Chitre & Jog 2002) or other morphological signatures of ellipticals (Cox et al. 2006b; Naab & Ostriker 2009). UV, IR, and Hα observations help quantify the SFR and show that the highest rates are found in systems in the middle of the merger sequence (Casoli et al. 1991; Keel & Wu 1995; Read & Ponman 1998; Brassington et al. 2007; Larson et al. 2016). However, there is a lot of system-to-system variation in the SFR and mass-normalized SFR along the merger sequence, with some mid-merger systems being fairly quiescent (Keel & Wu 1995; Ellison et al. 2013; Larson et al. 2016) and pre-merger interacting galaxies on average having elevated SFRs compared to more isolated systems (Bushouse 1987; Kennicutt et al. 1987; Smith et al. 2007).
Our goal in the current study is to track the evolution of hot gas in mergers compared to other components of the galaxies. For our sample of merging galaxies, we compare the X-ray luminosity from hot gas with other properties of the galaxies, and with normal spirals and ellipticals. We compare the X-ray luminosity of the hot gas with the SFR as determined from UV and IR data, the stellar mass as traced by near-IR observations, and the merger stage as indicated by optical and near-IR images.
In Section 2 of this paper, we describe our merger sample, while the data at other wavelengths are described in Section 3. Section 4 describes our comparison samples of ellipticals and spirals. In Section 5, we outline the processing and analysis of the Chandra data for the mergers. We compare LX(gas) with various other properties of the system in Section 6. In Section 7, we discuss the results. Conclusions are presented in Section 8. The Appendix of this paper includes a detailed discussion of each system in the sample, including morphology.
2. The Merger Sample
2.1. Sample Selection
From the Arp (1966) Atlas of Peculiar Galaxies, we selected the subset of systems that are approximately equal-mass spiral pairs or merger remnants, eliminating triples, groups, unequal-mass pairs/mergers, radio galaxies, and pairs containing ellipticals. We found 32 Arp galaxies that fit these criteria and have archival Chandra data with sufficient sensitivity to detect the most luminous point sources (i.e., 0.3–8 keV X-ray luminosity (LX) ≥ 1040 erg s−1). We excluded Arp 245 from the sample, due to significant pile-up in the Chandra data because of a powerful AGN. We supplemented this sample by adding nearby non-Arp major mergers from the literature that have archival Chandra data to the same limiting LX. These additional systems were obtained from the surveys of Keel & Wu (1995), Gao & Solomon (1999), Rothberg & Joseph (2004), Taylor-Mager et al. (2007), Brassington et al. (2007), and Ellison et al. (2013). We also added the nearby pre-merger pair NGC 2207/IC 2163 (Mineo et al. 2014). This brings our final sample to 49 systems.
The distances to each system are listed in Table 1. These were obtained from the NASA Extragalactic Database (NED)6 assuming a Hubble constant of 73 km s−1 Mpc−1, correcting for peculiar velocities due to the Virgo Cluster, the Great Attractor, and the Shapley Supercluster. All of the galaxies are within 180 Mpc, with a median distance of 51.5 Mpc. Figure 1 provides a histogram of the distances to the sample galaxies.

Figure 1. Histograms of merger stage, distance, and FIR luminosities for the sample galaxies.
Download figure:
Standard image High-resolution imageTable 1. Basic Data on Sample Galaxies
| Name | Stage | Distance | LFUV | LNUV | L24 | log LFIR | log LK | log | SFR | AGN? |
|---|---|---|---|---|---|---|---|---|---|---|
| (Mpc) | (1042 | (1042 | (1042 | (L☉) | (L☉) | LFIR/LK | (M☉ | |||
| erg s−1) | erg s−1) | erg s−1) | yr−1) | |||||||
| AM 1146–270 | 6 | 24.6 | 1.80 | 1.92 | 0.86 | 8.98 | 9.49 | −0.50 | 0.23 | ⋯ |
| AM 2055–425 | 5 | 179.1 | 40.04 | 48.64 | 722.27 | 11.72 | 11.27 | 0.45 | 128.23 | ⋯ |
| AM 2312–591 | 3 | 184 | 45.23 | 55.22 | 752.92 | 11.71 | 11.24 | 0.47 | 133.83 | ⋯ |
| Arp 91 | 1 | 34 | 4.85 | 7.21 | 22.87 | 10.33 | 10.93 | −0.59 | 4.22 | Sy2 |
| Arp 147 | 1 | 129 | 19.34 | 15.70 | 15.90 | 10.22 | 10.80 | −0.57 | 3.65 | ⋯ |
| Arp 148 | 1 | 146.9 | 25.73 | 29.57 | 75.67 | 11.38 | 11.14 | 0.24 | 14.4 | ⋯ |
| Arp 155 | 7 | 46 | 2.16 | 3.24 | 5.14 | 9.99 | 10.98 | −0.98 | 1.00 | ⋯ |
| Arp 157 | 4 | 30.5 | 3.07 | 4.65 | 31.27 | 10.69 | 10.99 | −0.29 | 5.61 | ⋯ |
| Arp 160 | 5 | 39 | 7.82 | 11.00 | 84.50 | 10.72 | 10.70 | 0.02 | 15.14 | ⋯ |
| Arp 163 | 7 | 23.1 | 16.27 | 13.08 | 2.61 | 9.39 | 9.93 | −0.53 | 1.19 | ⋯ |
| Arp 178 | 5 | 62.1 | 5.97 | 8.88 | 9.44 | 10.11 | 11.54 | −1.42 | 1.92 | ⋯ |
| Arp 186 | 5 | 64.2 | 8.52 | 10.22 | 342.46 | 11.27 | 11.20 | 0.07 | 60.33 | Sy2:H ii |
| Arp 217 | 6 | 18.0 | 28.84 | 26.52 | 33.31 | 10.24 | 10.43 | −0.18 | 7.13 | ⋯ |
| Arp 220 | 4 | 83 | 2.21 | 4.57 | 545.82 | 12.03 | 11.27 | 0.76 | 95.65 | Sy |
| Arp 222 | 6 | 26.1 | 0.81 | 1.98 | 1.36 | 8.71 | 11.12 | −2.41 | 0.27 | ⋯ |
| Arp 226 | 5 | 67 | 7.41 | 15.48 | 23.90 | 10.48 | 11.30 | −0.81 | 4.52 | ⋯ |
| Arp 233 | 7 | 25 | 5.69 | 5.01 | 7.49 | 9.62 | 9.99 | −0.36 | 1.57 | ⋯ |
| Arp 235 | 7 | 13 | ... | ... | 0.17 | 8.75 | 9.42 | −0.66 | 0.03 | ⋯ |
| Arp 236 | 1 | 81 | 87.37 | 80.60 | 269.00 | 11.39 | 11.18 | 0.21 | 51.02 | ⋯ |
| Arp 240 | 2 | 102 | 93.68 | 109.18 | 182.60 | 11.29 | 11.68 | −0.38 | 36.18 | ⋯ |
| Arp 242 | 2 | 98 | 14.47 | 15.15 | 31.87 | 10.65 | 11.20 | −0.54 | 6.23 | ⋯ |
| Arp 243 | 5 | 79.4 | 5.55 | 7.51 | 122.40 | 11.34 | 11.00 | 0.34 | 21.68 | ⋯ |
| Arp 244 | 3 | 24.1 | 31.18 | 30.14 | 47.37 | 10.62 | 11.26 | −0.63 | 9.7 | ⋯ |
| Arp 256 | 2 | 109.6 | 70.17 | 67.91 | 186.21 | 11.13 | 11.13 | 0.00 | 35.75 | ⋯ |
| Arp 259 | 2 | 55 | 35.44 | 30.19 | 26.32 | 10.34 | 10.20 | 0.14 | 6.2 | ⋯ |
| Arp 261 | 1 | 29 | 5.55 | 4.60 | 2.09 | 9.26 | 9.66 | −0.39 | 0.62 | ⋯ |
| Arp 263 | 5 | 9.8 | 3.18 | 2.79 | 0.42 | 8.76 | 9.06 | −0.29 | 0.22 | ⋯ |
| Arp 270 | 1 | 29 | 28.96 | 25.76 | 20.70 | 10.16 | 10.65 | −0.48 | 4.93 | ⋯ |
| Arp 283 | 1 | 30 | 3.39 | 3.86 | 31.92 | 10.48 | 10.77 | −0.28 | 5.74 | ⋯ |
| Arp 284 | 2 | 39 | 22.10 | ... | 47.51 | 10.41 | 10.68 | −0.26 | 9.31 | ⋯ |
| Arp 293 | 2 | 82 | 9.10 | 11.77 | 67.61 | 11.10 | 11.41 | −0.30 | 12.24 | Liner/H ii |
| Arp 295 | 2 | 94 | 14.37 | 16.19 | 49.39 | 10.86 | 11.50 | −0.64 | 9.29 | ⋯ |
| Arp 299 | 3 | 48 | 57.03 | 56.03 | 665.19 | 11.60 | 11.37 | 0.23 | 119.01 | ⋯ |
| IRAS 17208–0014 | 6 | 183 | 0.36 | 0.88 | 765.23 | 12.19 | 11.40 | 0.79 | 133.97 | Liner |
| Mrk 231 | 5 | 178.1 | ... | 37.63 | 2929.16 | 12.13 | 12.36 | −0.22 | 450.05 | Sy1 |
| Mrk 273 | 4 | 160.5 | 12.96 | 15.86 | 664.08 | 11.90 | 11.44 | 0.47 | 116.83 | Sy2 |
| NGC 34 | 5 | 79.3 | 7.89 | 12.84 | 173.81 | 11.18 | 11.14 | 0.04 | 30.78 | Sy2 |
| NGC 1700 | 7 | 52.5 | ... | 2.33 | 0.54 | 8.40 | 11.57 | −3.16 | 0.24 | ⋯ |
| NGC 2207/IC 2163 | 3 | 38.0 | ... | 36.63 | 42.90 | 10.73 | 11.48 | −0.74 | 9.03 | ⋯ |
| NGC 2865 | 7 | 37.9 | 0.27 | 1.39 | 0.49 | 9.53 | 11.14 | −1.60 | 0.1 | ⋯ |
| NGC 3256 | 4 | 37.0 | ... | 13.22 | 246.15 | 11.30 | 11.26 | 0.04 | 38.5 | ⋯ |
| NGC 3353 | 6 | 18.5 | 3.58 | 3.18 | 4.26 | 9.43 | 9.66 | −0.21 | 0.91 | ⋯ |
| NGC 5018 | 7 | 38.4 | 0.42 | 2.63 | 2.14 | 9.40 | 11.44 | −2.04 | 0.39 | ⋯ |
| NGC 5256 | 3 | 120.9 | 25.51 | 28.70 | 176.36 | 11.21 | 11.62 | −0.40 | 32.02 | Sy2 |
| NGC 6240 | 4 | 108.8 | 8.40 | 12.17 | 503.17 | 11.61 | 11.81 | −0.19 | 88.46 | Sy2/Liner |
| NGC 7592 | 3 | 99.5 | 52.41 | 45.44 | 135.50 | 11.08 | 11.07 | 0.01 | 26.08 | Sy2 |
| UGC 2238 | 5 | 87.1 | 1.34 | 2.10 | 53.38 | 11.04 | 11.15 | −0.10 | 9.41 | Liner |
| UGC 5101 | 5 | 164.3 | 3.44 | 7.58 | 659.66 | 11.72 | 11.51 | 0.22 | 115.63 | Sy1 |
| UGC 5189 | 2 | 48.9 | 15.01 | 12.72 | 4.96 | 9.48 | 9.47 | 0.01 | 1.54 | ⋯ |
Download table as: ASCIITypeset image
In the Appendix to this paper, we provide detailed descriptions of the sample galaxies. Our sample includes both pre-merger pairs and post-merger remnants, as well as systems in mid-merger. For mid-merger systems and post-merger remnants, we selected systems with morphological signatures characteristic of major mergers, including two tidal tails. We have also included galaxies with shell structures, although there is some uncertainty about the origin of such shells. According to numerical models, major mergers can produce shells (Barnes 1992; Hernquist 1992), but so can minor mergers (Quinn 1984; Dupraz & Combes 1986; Hernquist & Quinn 1987a, 1987b) and weaker interactions (Thomson & Wright 1990; Thomson 1991). We note that the original mass ratio of the progenitor galaxies is generally difficult to determine post-merger, thus it is possible that some of our systems may be the product of minor mergers or mergers of multiple galaxies.
Since our sample was selected based on the existence of suitable data in the Chandra archives, it may be biased toward X-ray-bright objects. Furthermore, since most of our galaxies were chosen from an optical-morphology-selected catalog (the Arp Atlas), the galaxies, on average, may have lower SFRs than other merger samples that are IR flux and luminosity selected (e.g., Larson et al. 2016). However, this bias is partially compensated for by the addition of galaxies from the Gao & Solomon (1999) FIR-selected sample.
2.2. Merger Stages
We did a rough classification of the 49 systems in our sample into seven merger stages based on morphology (Table 1). These stages are: (1) separated but interacting pair with small tails or no tails, (2) separated pair with moderate to long tails, (3) pair with disks in contact, (4) common envelope, two nuclei, and tails, (5) single nucleus and two strong tails, (6) single nucleus but weak tails, and (7) disturbed elliptical with little or no tails. When possible, Hubble Space Telescope near-IR and optical images were used to discern double nuclei (e.g., Haan et al. 2011; Kim et al. 2013; see the Appendix). In Figure 1, we provide a histogram showing the number of galaxies in each of these stages. For each of these stages, we have at least five systems, which will provide a measure of the scatter in the X-ray properties along the sequence. We emphasize that these stages are quite uncertain (as much as ±1 stage in some cases), due to observational limitations, viewing angle, projection effects, and system-to-system variations in the parameters of the interaction and the progenitor galaxies.
The relationship between these merger stages and the absolute timescale of the merger varies from system to system, as it depends upon the masses of the two galaxies, the orbital parameters, and other properties of the system (e.g., Lotz et al. 2000). Furthermore, the timescale of a merger is not necessarily correlated with the age of a starburst triggered by that merger; if and when a starburst is triggered by a merger depends in a complicated way on the properties of the system (e.g., Di Matteo et al. 2008). In spite of these limitations, however, these stages are helpful in searching for general trends in the X-ray properties of galaxies with merger morphology.
In general, the latest stage merger remnants in our sample tend to be more nearby than the other galaxies in the sample. This is shown in Figure 2, where we plot stage versus distance. Very late-stage merger remnants are difficult to identify at large distances. In contrast, several of the systems in the middle of the merger sequence are relatively far away. These include three Infrared Astronomical Satellite (IRAS)-discovered mergers from the Gao & Solomon (1999) survey.
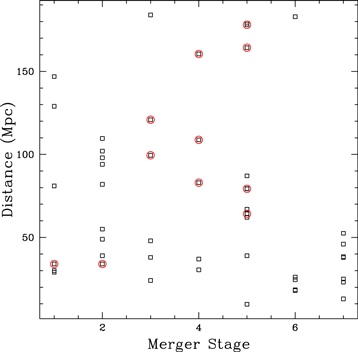
Figure 2. Plot of distance vs. interaction stage. Galaxies containing a Seyfert nucleus are circled in red.
Download figure:
Standard image High-resolution image2.3. Active Galactic Nuclei
Since the presence of an AGN may affect the diffuse X-ray emission in a galaxy, in Table 1 we identify which galaxies in the sample are listed as an AGN in NED. Six of the galaxies in the sample are classified in NED as Seyfert 2, two as Seyfert 1, one as an unspecified Seyfert, and one as "Sy2/H ii." Two were classified as "Low Ionization Nuclear Emission Region" (LINER) galaxies, one as "Sy2/Liner," and one as "Liner/H ii." More information about the spectral types of these galaxies, including references, is available in the Appendix to this paper. In all plots in this paper, the Seyfert galaxies are marked as open red circles. We note that none of the merger stage 6 or 7 systems in our sample are classified as a Seyfert in NED. The majority of the Seyferts in the sample are in the middle merger stages (stages 3, 4, and 5).
Obscured AGNs can sometimes be identified by their mid-IR neon line ratios. To search for additional AGNs in our sample, we scoured the literature for published neon line fluxes for our sample galaxies. At least some neon data were available for 31 of our sample systems (Verma et al. 2003; Bernard-Salas et al. 2009; Pereira-Santaella et al. 2010; Inami et al. 2013). A Ne v λ14.32 μm/Ne ii λ12.8 μm ratio greater than 0.1 is a good indicator of an AGN (Inami et al. 2013). Only two of our systems meet this criteria, both of which are otherwise identified as AGNs (NGC 5256 and Mrk 273).
An alternative way to identify AGNs is via X-ray observations, which in some cases can reveal excess high-energy photons above that expected from a starburst alone. In the Appendix of this paper, we summarize earlier analyses of the Chandra data for each galaxy in our sample as well as observations from other X-ray telescopes. In most cases, AGNs identified by the X-ray spectra had already been identified as AGNs by optical or IR observations. In two cases, Arp 293 and NGC 5018, the X-ray data revealed possible low-luminosity AGNs not found at other wavelengths. Based on published analyses, however, these sources contribute little to the total bolometric luminosity of the galaxies (see the Appendix).
3. UV/IR Data and SFRs
Our primary goal in this study is to compare the diffuse X-ray light from these galaxies with other properties of the systems, including SFR, stellar mass, and stellar population age. To this end, we have extracted UV and IR fluxes for these galaxies from archival Spitzer and Galaxy Evolution Explorer (GALEX) images using the method described in Smith et al. (2007, 2010). In this study we use GALEX far-ultraviolet (FUV; λeff = 1516 Å) and near-ultraviolet (NUV; λeff = 2267 Å) data, as well as Spitzer 3.6 μm and 24 μm fluxes. For the one galaxy without a Spitzer 24 μm image, NGC 2865, we used the WISE 22 μm elliptical aperture photometry from the AllWISE Source Catalog (Cutri et al. 2014) instead. For two of the galaxies without GALEX UV images, Arp 186 and Markarian 231, we used archival Hubble Space Telescope (HST) images in similar filters. For NGC 1700, which had neither GALEX nor HST UV images, we used an archival Swift UV image in the uvm2 filter (central wavelength 2246 Å) in place of the GALEX NUV flux; Swift fluxes in this filter agree well with the GALEX NUV fluxes (Hoversten et al. 2009). Luminosities (νLν) in these bands are provided in Table 1.
In Table 1, we provide estimates of the global SFRs of these galaxies. For most of the galaxies, to calculate the SFR we used the Hao et al. (2011) prescription in terms of the FUV and the 24 μm luminosities.7 For the four galaxies with NUV data but no FUV measurement, we used an alternative relation from Hao et al. (2011) for the SFR as a function of the NUV plus the 24 μm luminosities.8 For the one galaxy with no UV observations, Arp 235, we calculated the SFR from the 24 μm luminosity alone using the relationship from Rieke et al. (2009). The Hao et al. (2011) relation for the SFR is thought to be reliable for a range of SFRs (Catalán-Torrecilla et al. 2015); however, it may overestimate the SFR for galaxies with powerful AGNs or significant contributions to the UV or mid-IR flux from older stars. Contributions from AGNs to powering the global UV and IR fluxes of our galaxies are discussed further in Sections 6.1 and 6.3.
Table 1 also includes the total FIR luminosities (LFIR, from 42.5–122.5 μm; Helou et al. 1985) for these systems, calculated from IRAS 60 μm and 100 μm flux densities. We used the total IRAS fluxes quoted in NED, except in a few cases where we used the online xscanpi software9 to extract total fluxes. One of the galaxies in the sample, NGC 1700, is either marginally detected or not detected by IRAS in these bands.10 For NGC 1700, we used Spitzer 24, 70, and 160 μm fluxes from Temi et al. (2009) to calculate a total IR flux (TIR) using the relation in Dale & Helou (2002). We then used a ratio of LFIR/LTIR = 0.51 (Dale & Helou 2002) to estimate the FIR luminosity of NGC 1700.
Figure 1 displays a histogram of the LFIR for the sample galaxies. The median LFIR for the sample galaxies is 4.5 × 10¹⁰ L☉. FIR luminosities are also sometimes used as a measure of the SFR in galaxies (e.g., Kennicutt 1998), but in low SFR systems, older stars may help power the FIR (e.g., Smith et al. 1991, 1994; Sauvage & Thuan 1992), and in post-starburst systems, the FIR may overestimate the current SFR (e.g., Hayward et al. 2014). The FIR may also overestimate the SFR in systems with AGNs.
Table 1 also includes the near-infrared K luminosities11 of the systems, obtained from the 2MASS database using the KS total magnitudes from the 2MASS Extended Source Catalog (Cutri et al. 2006). The values for LK were co-added in cases where there were magnitudes for the individual galaxies in the pair.12 In the top panel of Figure 3, we plot LK versus merger stage. There is a lot of scatter in this plot. Note that there are a few galaxies at the beginning and end of the merger sequence with considerably lower LK than the majority of the galaxies. The system with the highest LK is the stage 5 Seyfert galaxy Markarian 231; the second highest luminosity system is the stage 4 system NGC 6240. LK is an approximate tracer of the stellar mass of the galaxy; however, it is not perfect as the mass-to-LK ratio can vary with the age of the stellar population due to contributions from asymptotic giant branch stars and red supergiants (Maraston 1998; Bell & de Jong 2000; Into & Portinari 2013). Hot dust heated by an AGN can also contribute to the K-band flux (e.g., Oyabu et al. 2011).
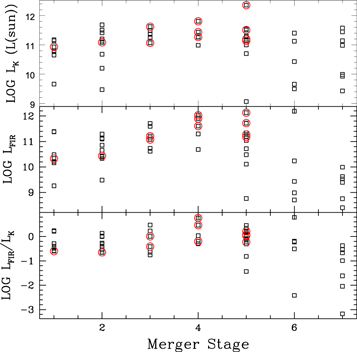
Figure 3. Top panel: plot of log(LK) vs. interaction stage. Middle panel: plot of log(LFIR) vs. interaction stage. Bottom panel: plot of log(LK/LFIR) vs. interaction stage. Galaxies containing a Seyfert nucleus are circled in red.
Download figure:
Standard image High-resolution imageIn the middle panel of Figure 3, we display LFIR versus merger stage. Note that some of the mid-merger systems have very high FIR luminosities, while most of the late-stage mergers have lower LFIR. The bottom panel of Figure 3 shows a plot of LFIR/LK versus merger stage. An enhanced LFIR/LK ratio is an indicator of an increase in star formation relative to the stellar mass of the galaxy. No strong trend of LFIR/LK with merger stage is visible; however, a few systems in stage 3–6 have higher LFIR/LK than the rest, while some of the stage 7 systems and one stage 6 system have low LFIR/LK indicating a quiescent stellar population.
There is a large scatter in LFIR/LK as a function of merger stage. This is consistent with earlier studies that found considerable scatter in the stellar-mass-normalized SFR along the merger sequence (Keel & Wu 1995; Ellison et al. 2013). It is also consistent with numerical simulations, which predict that the duration of a starburst is short compared to the merger timescale, and powerful bursts are infrequent and depend on the parameters of the interaction (Di Matteo et al. 2007, 2008; Lanz et al. 2014).
4. Comparison Samples: Normal Spirals and Ellipticals
As a comparison sample of normal spiral galaxies, we use the nine nearby galaxies in the Mineo et al. (2012b) Chandra study that are classified in NED as spiral galaxies and have no companion in NED with an optical luminosity greater than about one-quarter that of the target galaxy lying within four galaxian diameters. These spiral galaxies have Hubble types between Sb and Sd.
In addition to providing diffuse X-ray fluxes from Chandra, Mineo et al. (2012b) also provide SFRs for their galaxies derived from UV and IR data; however, they use a different formula for the SFR than we do. Therefore, for consistency with our mergers, we obtained published total Spitzer and GALEX fluxes for the spirals from NED,13 from archival images, or from WISE, from either the AllWISE Catalog (Cutri et al. 2014) or Ciesla et al. (2014). We calculated SFRs for these galaxies using the same formulae as for the mergers. As we did for the mergers, for these spirals we used NED to look up IRAS 60 and 100 μm fluxes and 2MASS K-band magnitudes, and calculated LFIR and LK.
We also compare our merging galaxies with two samples of early-type galaxies. The first is a set of 42 elliptical and S0 galaxies from the ATLAS3D survey for which Su et al. (2015) extracted the soft diffuse X-ray fluxes. The second set consists of 33 more massive elliptical galaxies (MK < 25.3 magnitudes) from Goulding et al. (2016), who provide measurements of the diffuse X-ray fluxes from the hot gas. The parent samples for both the Su et al. (2015) and the Goulding et al. (2016) surveys are near-IR selected and volume limited; however, like the current merger study, their X-ray studies are Chandra-archive selected, which may bias them toward X-ray-bright objects.
As with the spirals, we obtained total 2MASS, Spitzer, GALEX, and IRAS fluxes for these early-type galaxies from NED and calculated our own LK and SFR estimates with the same formulae as with the mergers. In the discussion below, these SFR values are treated as upper limits, since the observed UV and MIR light may be powered in part by older stars. Su et al. (2015) provide alternative estimates of the SFRs of their galaxies from UV-to-IR spectral energy distribution (SED) fitting; these are less than ours by a factor of 1.9 in the median. This difference may be due in part to contributions to the UV/IR light from older stars. The E/S0 galaxies will be discussed further in Section 6.2.
5. Chandra Data and Reductions
5.1. Extraction of X-Ray Spectra
All of the Chandra data used in this study came from the Advanced CCD Imaging Spectrometer (ACIS) S-array. We only used data from the S3 chip on this array since it has the highest sensitivity. The data was reprocessed using the chandra_repro script, and the data were filtered, retaining grades 0, 2, 3, 4, and 6. When multiple data sets were available for a system, we combined the data sets to improve the sensitivities.
The basic data reduction was done using the Chandra Interactive Analysis of Observations (CIAO) software version 4.7. For each observation, blank regions of the sky off the galaxy were identified and the light curve extracted. All of our targets are small enough on the sky that they fit within the 8 3 × 83 field of view of the ACIS-S3 chip, and nearby contemporaneous background can be defined on the same CCD. Background regions used for the flux extraction included most of the CCD excluding bright point sources and the target region.
The data were deflared, and the good time intervals (GTIs) were identified. The GTIs were extracted by using the CIAO command deflare with the sigma clipping routine with nsigma = 3 and a bin size of 259.28 s, restricting the energy range to 0.3–8 keV. The final Chandra exposure times range from 2.6 ks to 456 ks, with a median time of 31.5 ks. These quantities are provided in Table 2, along with the data sets used.
Table 2. X-Ray Data
| Name | Exp | Data Set(s) | Point | Unresolveda | Unresolveda |
|---|---|---|---|---|---|
| Time | Source | HMXB | LMXB | ||
| (ksec) | Limit | LX | LX | ||
| (1039 | (1039 | (1039 | |||
| erg s−1) | erg s−1) | erg s−1) | |||
| AM 1146–270 | 36.6 | 10540 | 0.07 | 0.08 | 0.19 |
| AM 2055–425 | 35.9 | 2036 | 2.82 | 224.28 | 11.25 |
| AM 2312–591 | 31.5 | 2037 | 3.28 | 253.23 | 10.5 |
| Arp 91 | 14.1 | 2930, 4023 | 0.26 | 2.67 | 5.21 |
| Arp 147 | 42.5 | 11280, 11887 | 1.73 | 4.88 | 3.87 |
| Arp 148 | 51.8 | 12977 | 1.86 | 20.64 | 8.44 |
| Arp 155 | 53.8 | 10541 | 0.16 | 0.52 | 5.88 |
| Arp 157 | 42.5 | 2924 | 0.07 | 2.07 | 5.91 |
| Arp 160 | 35.5 | 7071 | 0.18 | 8.88 | 3.06 |
| Arp 163 | 2.6 | 7117 | 0.91 | 1.17 | 0.52 |
| Arp 178 | 14.6 | 11679 | 1.15 | 2.27 | 21.38 |
| Arp 186 | 15.8 | 15050 | 1.19 | 74.02 | 9.63 |
| Arp 217 | 42.4 | 2939 | 0.02 | 1.71 | 1.64 |
| Arp 220 | 56.5 | 869 | 0.39 | 77.7 | 11.36 |
| Arp 222 | 18.0 | 2045 | 0.12 | 0.13 | 8.13 |
| Arp 226 | 20.1 | 2980 | 0.69 | 4.32 | 12.13 |
| Arp 233 | 17.4 | 9519 | 0.14 | 0.8 | 0.6 |
| Arp 235 | 4.0 | 7127 | 0.18 | 0.02 | 0.16 |
| Arp 236 | 59.1 | 7063 | 0.47 | 41.83 | 9.15 |
| Arp 240 | 19.9 | 10565 | 2.09 | 54.28 | 29.49 |
| Arp 242 | 28.6 | 2043 | 1.02 | 7.00 | 9.67 |
| Arp 243 | 17.8 | 4059 | 1.24 | 27.22 | 6.12 |
| Arp 244 | 327.4 | 3040, 315, 3041, 3042, 3043, 3044 | 0.01 | 1.19 | 11.09 |
| Arp 256 | 29.6 | 13823 | 1.82 | 49.85 | 8.29 |
| Arp 259 | 35.6 | 9405 | 0.35 | 4.35 | 0.97 |
| Arp 261 | 54.5 | 5191 | 0.07 | 0.21 | 0.28 |
| Arp 263 | 11.8 | 7094, 13764 | 0.04 | 0.06 | 0.07 |
| Arp 270 | 18.9 | 2042 | 0.14 | 2.45 | 2.73 |
| Arp 283 | 5.1 | 10567 | 0.75 | 5.69 | 3.58 |
| Arp 284 | 57.2 | 4800 | 0.13 | 4.36 | 2.93 |
| Arp 293 | 14.0 | 10566 | 1.92 | 17.75 | 15.72 |
| Arp 295 | 18.9 | 10570 | 1.88 | 13.12 | 19.44 |
| Arp 299 | 89.8 | 15077, 15619 | 0.12 | 58.92 | 14.29 |
| IRAS 17208–0014 | 56.2 | 2035, 4114 | 2.12 | 211.8 | 15.42 |
| Mrk 231 | 455.8 | 4028, 4029, 4030, 13947, 13948, 13949 | 0.29 | 333.00 | 139.28 |
| Mrk 273 | 39.3 | 809 | 1.97 | 185.18 | 16.62 |
| NGC 34 | 14.8 | 15061 | 1.92 | 46.5 | 8.44 |
| NGC 1700 | 41.5 | 2069 | 0.21 | 0.13 | 22.91 |
| NGC 2207/IC 2163 | 62.2 | 11228, 14799, 14914, 14915 | 0.11 | 3.84 | 18.63 |
| NGC 2865 | 24.6 | 2020 | 0.19 | 0.05 | 8.46 |
| NGC 3256 | 54.0 | 3569, 835 | 0.1 | 16.43 | 11.2 |
| NGC 3353 | 17.5 | 13927 | 0.09 | 0.38 | 0.28 |
| NGC 5018 | 25.0 | 2070 | 0.2 | 0.22 | 16.92 |
| NGC 5256 | 17.1 | 2044 | 2.62 | 52.61 | 25.54 |
| NGC 6240 | 181.0 | 12713, 1590 | 0.28 | 61.34 | 39.01 |
| NGC 7592 | 13.5 | 6860 | 3.13 | 45.17 | 7.19 |
| UGC 2238 | 14.4 | 15068 | 2.42 | 15.19 | 8.63 |
| UGC 5101 | 48.0 | 2033 | 1.76 | 174.32 | 19.59 |
| UGC 5189 | 129.2 | 11122, 11237, 13199, 13781, 13782, 15869 | 0.06 | 0.52 | 0.18 |
Note.
a0.3–8.0 keV.Download table as: ASCIITypeset image
Table 2 also includes the 0.3–8 keV point source sensitivities, calculated using PIMMS14 software version 4.8 assuming five counts for a lower limit detection on axis and a Γ = 1.8 power-law spectrum, including Galactic absorption but not absorption within the galaxy.
For each observation, the Chandra point-spread function (PSF) as a function of the location on the sky was determined using the CIAO command mkpsfmap. With mkpsfmap, we used an effective energy of 2 keV and included regions encompassing 30% of the source counts of the point source. We then used the PSF map and the CIAO routine wavdetect to identify point sources in or near the galaxy. For wavdetect, we used an energy range of 1.5–7 keV and wavelet scales of 1 and 2. The point source regions were then excluded in determining the diffuse X-ray light from the galaxies.
For all of the systems with SDSS images available, after excluding the point sources, we extracted the X-ray spectrum for the diffuse light within the SDSS g-band surface brightness isophote of 24.58 mag arcsec−2. This corresponds to a B surface brightness of 25.0 mag arcsec−2 (i.e., the D25 isophote), assuming the Jester et al. (2005) g to B conversion with the median g − r color for tidal tails from Smith et al. (2010). When SDSS images were not available, we used the GALEX NUV image, measuring the X-ray flux within an NUV surface brightness isophote of 26.99 mag arcsec−2, using the median NUV − g color for tidal tails of 2.4 (Smith et al. 2010).
We carefully inspected the Chandra maps for emission outside of this region. In most cases, the diffuse X-ray emission does not extend beyond the optical/UV isophotes given above. The exceptions are Arp 220, NGC 6240, and Mrk 273 (see the Appendix for details). All of these are known AGNs. As noted in the Appendix, most of the observed flux for these galaxies lies within our isophotal limits, thus our total flux determinations are reasonably accurate in spite of not including this very extended emission.
The CIAO command specextract was used to extract the spectrum from the selected regions. When multiple data sets are available, the "combine = yes" option was used, which calibrates each data set individually, then co-adds the weighted spectra.
5.2. Correction for Absorption
In fitting our X-ray spectra to spectral models, we need to take into account two separate sources of absorption: foreground gas in the Milky Way and gas within the target galaxy itself. For absorption by Galactic material, we used the Galactic hydrogen column densities NH from Kalberla et al. (2005).15 These values of Galactic NH are provided in Table 3.
Table 3. X-Ray Parameters and Results for Galactic Absorption Correction Only
| Name | F(0.3−8 keV) | NH |

|
χ2/dof | MEKAL LXa | Power Law LXa |
|---|---|---|---|---|---|---|
| (observed) | (1020 cm−2) | (1039 erg s−1) | (1039 erg s−1) | |||
| (10−14 erg s−1 cm−2) | ||||||
| AM 1146–270 |

|
7.4 | 1 | 15.6/15 | 0.6 ± 0.1 | <0.1 |
| AM 2055–425 |

|
3.3 | 3.2 | 97.2/30 | 73.6 ± 9.1 | 170.3 ± 18.8 |
| AM 2312–591 |

|
1.6 | 2.4 | 71.2/30 | 59.5 ± 9.5 | 171.1 ± 21.8 |
| Arp 91 |

|
3.2 | 1.9 | 88.5/47 | 10.5 ± 1.1 | 24.5 ± 2.4 |
| Arp 147 |

|
6.2 | 1 | 20/21 | 23.8 ± 4.6 | 74.5 ± 8.9 |
| Arp 148 |

|
1.0 | 2 | 59.4/29 | 44.6 ± 5.5 | 105.4 ± 9.9 |
| Arp 155 |

|
1.0 | 0.9 | 85.9/91 | 2.3 ± 0.6 | 11.8 ± 1.7 |
| Arp 157 |

|
3.2 | 0.9 | 136.1/148 | 2.3 ± 0.5 | 14.5 ± 1.3 |
| Arp 160 |

|
1.5 | 2.9 | 288.8/101 | 18.4 ± 1 | 35.5 ± 2.1 |
| Arp 163 |

|
1.1 | 0.9 | 4.6/5 | <3.2 | 9.9 ± 2.7 |
| Arp 178 |

|
1.4 | 1.2 | 55.2/47 | 12.1 ± 3.6 | 54.4 ± 8.8 |
| Arp 186 |

|
6.3 | 3.1 | 93.8/30 | 15.4 ± 3.9 | 89.9 ± 8.1 |
| Arp 217 |

|
1.4 | 3.5 | 763/215 | 13.9 ± 0.4 | 24.4 ± 0.8 |
| Arp 220 |

|
3.9 | 2.2 | 166.6/75 | 21.3 ± 1.9 | 55 ± 4 |
| Arp 222 |

|
2.9 | 1.4 | 43.4/32 | 2.3 ± 0.4 | 5.8 ± 1 |
| Arp 226 |

|
2.0 | 1.6 | 58.8/36 | 17.5 ± 2.4 | 44.3 ± 5.3 |
| Arp 233 |

|
1.0 | 1.6 | 28.8/18 | 2.1 ± 0.3 | 2.9 ± 0.6 |
| Arp 235 | <0.11 | 4.3 | 0.8 | 3.2/4 | <2 | <2.2 |
| Arp 236 |

|
1.4 | 4.3 | 587.4/138 | 39.5 ± 3.1 | 209.6 ± 7.1 |
| Arp 240 |

|
1.9 | 1.1 | 80.7/75 | 38.9 ± 9 | 291 ± 22 |
| Arp 242 |

|
1.3 | 1.2 | 53.2/45 | 17.4 ± 3.4 | 41.8 ± 9.1 |
| Arp 243 |

|
3.1 | 1.8 | 19.5/11 | <8 | 27.1 ± 5.3 |
| Arp 244 |

|
3.2 | 11 | 5751.7/524 | 30.3 ± 0.3 | 49.7 ± 0.6 |
| Arp 256 |

|
3.1 | 1.8 | 62.4/35 | 32.9 ± 6.2 | 123.1 ± 12.4 |
| Arp 259 |

|
5.7 | 0.9 | 46.1/51 | 12.3 ± 1.5 | 26.5 ± 2.8 |
| Arp 261 |

|
7.8 | 0.9 | 93.8/100 | <1 | 3.6 ± 0.8 |
| Arp 263 |

|
2.8 | 0.9 | 57.7/66 | <0.5 | 3.5 ± 0.4 |
| Arp 270 |

|
2.0 | 1.1 | 110.1/100 | 6.7 ± 0.7 | 18.4 ± 2 |
| Arp 283 |

|
1.5 | 4.8 | 57.2/12 | <3.4 | 22.8 ± 3.2 |
| Arp 284 |

|
5.0 | 1.6 | 219.2/139 | 10.8 ± 0.8 | 31.9 ± 1.8 |
| Arp 293 |

|
1.8 | 3.3 | 120.6/37 | 54.4 ± 6.3 | 133.6 ± 12.5 |
| Arp 295 |

|
3.6 | 2.1 | 67.6/32 | <14.4 | 133.8 ± 10.2 |
| Arp 299 |

|
0.9 | 10.4 | 2924.5/282 | 62.5 ± 2.1 | 317 ± 4.2 |
| IRAS 17208–0014 |

|
9.7 | 2.9 | 55.1/19 | <16.3 | 178.4 ± 11.7 |
| Mrk 231 |

|
1.0 | 3.6 | 830.8/228 | 92.7 ± 3.2 | 245.1 ± 5.9 |
| Mrk 273 |

|
0.9 | 2.6 | 240.6/94 | 105.7 ± 9.9 | 493.9 ± 24.3 |
| NGC 34 |

|
2.1 | 1.1 | 12.8/12 | <12.6 | 58.8 ± 8.1 |
| NGC 1700 |

|
3.6 | 2 | 378.4/188 | 51 ± 2 | 31.7 ± 4.4 |
| NGC 2207/IC 2163 |

|
8.8 | 1.1 | 291/262 | 24 ± 1.6 | 80.9 ± 2.9 |
| NGC 2865 |

|
6.2 | 1.3 | 19.4/15 | 1.7 ± 0.4 | 5.5 ± 1 |
| NGC 3256 |

|
9.1 | 10.8 | 2611.9/242 | 38.6 ± 1.5 | 178 ± 3.4 |
| NGC 3353 |

|
0.5 | 0.9 | 11.8/13 | 0.6 ± 0.2 | 1.6 ± 0.4 |
| NGC 5018 |

|
6.4 | 2.2 | 77.7/35 | 8.1 ± 0.8 | 12.5 ± 1.4 |
| NGC 5256 |

|
1.7 | 1.7 | 95.5/55 | 202.1 ± 13.1 | 271 ± 24.8 |
| NGC 6240 |

|
4.9 | 13.5 | 4557.4/337 | 122.1 ± 6.3 | 1455.9 ± 13.4 |
| NGC 7592 |

|
3.8 | 1.3 | 20.3/16 | 52.1 ± 7 | 72.5 ± 12.5 |
| UGC 2238 |

|
8.9 | 1.1 | 6.4/6 | <13.2 | 70.4 ± 9.3 |
| UGC 5101 |

|
3.0 | 1.6 | 32.4/20 | <12 | 104.4 ± 10.8 |
| UGC 5189 |

|
2.6 | 1.9 | 484.5/260 | <1.4 | 26 ± 0.9 |
Note.
a0.3–8.0 keV. Calculated assuming kT is fixed at 0.3 keV.Download table as: ASCIITypeset image
For galaxies with high signal-to-noise ratio (S/N) X-ray data, it is sometimes possible to constrain the total (Galactic plus internal) absorbing column from the X-ray spectrum itself. However, these results are often very uncertain (see the Appendix and Section 5.3).
We therefore make an alternative estimate of the internal hydrogen column density using data at other wavelengths and extrapolate to the X-ray. For all of the galaxies that have FUV data as well as 24 μm photometry, we use the FUV/24 μm ratio as in Hao et al. (2011) to estimate the attenuation in the FUV band, AFUV. We then obtain the attenuation in the optical V band, AV, assuming the Calzetti (2001) dust attenuation law. For the four galaxies without FUV images but with NUV data, we use the NUV/24 μm ratio as in Hao et al. (2011) to estimate AV. From AV, we infer the color excess E(B−V) using the relation AV/E(B−V) = 3.1 (Savage & Mathis 1979) and calculate the hydrogen column density NH using the Bohlin et al. (1978) equation NH(cm−2) = 5.8 × 10²¹ E(B−V). We did not calculate the internal absorption for the one galaxy in our sample that does not have any UV data available.
These estimates of the internal NH in the target galaxies are given in Table 4. We note that this method makes assumptions about the geometry of the X-ray-emitting gas compared to the UV-emitting stars, which may not always be reliable. However, they provide a first estimate, when more direct measurements from the X-ray spectra are not possible.
Table 4. X-Ray Luminosities Including Internal Absorption Correction from UV/IR
| Name | NH |

|
χ2/dof | MEKAL LXa | Power Law LXa |
|---|---|---|---|---|---|
| (1020 cm−2) | (1039 erg s−1) | (1039 erg s−1) | |||
| AM 1146–270 | 8.4 | 1.1 | 16.3/15 | 0.8 ± 0.3 | <0.9 |
| AM 2055–425 | 34.1 | 1.5 | 44.6/30 | 745.7 ± 76.3 | 142 ± 24.2 |
| AM 2312–591 | 33.4 | 1.5 | 43.5/30 | 619.2 ± 74.5 | 142 ± 29.5 |
| Arp 91 | 23.6 | 1.2 | 54.2/47 | 52.1 ± 5.3 | 24.3 ± 2.8 |
| Arp 147 | 11.4 | 0.7 | 13.7/21 | 58.2 ± 12.7 | 77.8 ± 9.6 |
| Arp 148 | 20.1 | 1.3 | 36.8/29 | 190.7 ± 23.5 | 100.8 ± 11.6 |
| Arp 155 | 18.6 | 0.9 | 78.1/91 | 10.1 ± 2.2 | 12.2 ± 2 |
| Arp 157 | 29.6 | 1.1 | 170.2/148 | 17.9 ± 2.7 | 15.2 ± 1.8 |
| Arp 160 | 30.0 | 1.5 | 150.4/101 | 122.3 ± 6.5 | 30 ± 2.6 |
| Arp 163 | 3.8 | 0.8 | 4/5 | <2.5 | 10.2 ± 2.7 |
| Arp 178 | 15.7 | 1.2 | 54.9/47 | 38.8 ± 11.2 | 57.8 ± 10.3 |
| Arp 186 | 40.4 | 1.9 | 58.4/30 | 271.9 ± 36.8 | 79.7 ± 9.8 |
| Arp 217 | 13.6 | 2 | 426.7/215 | 35.6 ± 1.1 | 26.2 ± 0.9 |
| Arp 220 | 54.9 | 2 | 149.4/75 | 433.4 ± 30.2 | 37.3 ± 6.3 |
| Arp 222 | 16.1 | 1.4 | 44.7/32 | 7.1 ± 1.3 | 5.6 ± 1.2 |
| Arp 226 | 20.8 | 1.1 | 38.9/36 | 77.6 ± 10 | 46.7 ± 6.6 |
| Arp 233 | 14.4 | 1.5 | 26.1/18 | 5.4 ± 1 | 2.5 ± 0.7 |
| Arp 235 | ... | ... | .../... | ... | ... |
| Arp 236 | 20.4 | 1.8 | 251.6/138 | 253.7 ± 13.3 | 229.4 ± 8.4 |
| Arp 240 | 17.1 | 1.1 | 79.1/75 | 183.8 ± 31 | 311.4 ± 26.6 |
| Arp 242 | 18.0 | 1.1 | 47.9/45 | 60.1 ± 12.2 | 45.8 ± 11.4 |
| Arp 243 | 35.6 | 1.6 | 17.2/11 | <19.4 | <34 |
| Arp 244 | 15.4 | 5.2 | 2718.4/524 | 86.5 ± 0.5 | 49.4 ± 0.7 |
| Arp 256 | 19.4 | 1.1 | 40.1/35 | 148.3 ± 24.3 | 126.2 ± 14.8 |
| Arp 259 | 10.8 | 0.7 | 38/51 | 26.5 ± 3.9 | 26.7 ± 3.1 |
| Arp 261 | 7.2 | 0.9 | 91.2/100 | 1.7 ± 0.8 | 3.8 ± 0.8 |
| Arp 263 | 3.3 | 0.8 | 55.7/66 | <0.6 | 3.7 ± 0.5 |
| Arp 270 | 10.6 | 1 | 101.3/100 | 14.7 ± 1.9 | 20.5 ± 2.2 |
| Arp 283 | 29.0 | 2.7 | 32.9/12 | 36.1 ± 4.5 | 21.6 ± 3.4 |
| Arp 284 | 17.8 | 1.2 | 164.4/139 | 38.9 ± 2.9 | 32.3 ± 2.1 |
| Arp 293 | 27.1 | 1.6 | 58.7/37 | 364.9 ± 36.8 | 120.6 ± 15.3 |
| Arp 295 | 21.3 | 1.8 | 56.6/32 | 48.8 ± 19.9 | 155 ± 15.7 |
| Arp 299 | 30.6 | 4.1 | 1147.6/282 | 661.6 ± 8.4 | 317.7 ± 5.2 |
| IRAS 17208–0014 | 72.1 | 1.1 | 21.6/19 | 1077.4 ± 170.7 | 187.2 ± 22 |
| Mrk 231 | 51.2 | 3.6 | 827.1/228 | 1514 ± 28.3 | 224.1 ± 8.6 |
| Mrk 273 | 42.3 | 3 | 286.7/94 | 1886.4 ± 67.3 | 479.6 ± 35.6 |
| NGC 34 | 35.6 | 1 | 11.5/12 | 122.5 ± 29.6 | 59.2 ± 10.4 |
| NGC 1700 | 4.1 | 1.7 | 322.3/188 | 68.3 ± 3.9 | 31.9 ± 4.5 |
| NGC 2207/IC 2163 | 12.8 | 1 | 264/262 | 58.2 ± 4.5 | 84.5 ± 3.3 |
| NGC 2865 | 16.7 | 1.2 | 18/15 | 5.6 ± 1.5 | 5.8 ± 1.2 |
| NGC 3256 | 37.2 | 3.4 | 828.7/242 | 589.7 ± 8 | 173 ± 4.4 |
| NGC 3353 | 13.8 | 0.9 | 11.5/13 | 1.6 ± 0.5 | 1.6 ± 0.4 |
| NGC 5018 | 24.3 | 1.1 | 38.6/35 | 38.2 ± 3.8 | 10.9 ± 1.7 |
| NGC 5256 | 26.6 | 2 | 110.7/55 | 993 ± 44.6 | 230.5 ± 31.2 |
| NGC 6240 | 43.6 | 6.2 | 2100.2/337 | 4249.6 ± 42.3 | 1488.4 ± 17.8 |
| NGC 7592 | 19.2 | 1.2 | 19.6/16 | 167.2 ± 27.5 | 63.1 ± 14.7 |
| UGC 2238 | 40.3 | 1.6 | 9.5/6 | 93.4 ± 35.3 | 74.1 ± 11.6 |
| UGC 5101 | 52.8 | 1.2 | 24.3/20 | 363.5 ± 62.8 | 109.8 ± 16.9 |
| UGC 5189 | 6.6 | 1.8 | 467.7/260 | <0.9 | 28.3 ± 1.2 |
Note.
a0.3–8.0 keV. Calculated assuming kT is fixed at 0.3 keV.Download table as: ASCIITypeset image
5.3. Spectral Fitting
We used the xspec16 software version 12.9.0 to fit the extracted X-ray spectra using a two-component spectral model: a thermal optically thin plasma modeled by a MEKAL function (Mewe et al. 1985; Liedahl et al. 1995) combined with a power-law component. As discussed at length in Section 5.4 below, the MEKAL component is likely dominated by emission from hot interstellar gas, while the power-law component is assumed to be mainly from unresolved point sources. Throughout this paper, we assume that the MEKAL component is due to hot gas, thus we will refer to the absorption-corrected luminosity of the MEKAL component as LX(gas) throughout. The unresolved point sources making up the power-law component are discussed in detail in Section 5.4 below.
For our initial fits, we fixed the temperature of the thermal component to 0.3 keV and the photon index of the power-law component to Γ = 1.8. A temperature of 0.3 keV is characteristic of the hot gas in spiral galaxies (Strickland et al. 2004; Grimes et al. 2005; Mineo et al. 2012b), while Γ = 1.8 is typical of high-mass X-ray binaries (HMXBs) with LX < 1039 erg s−1 in nearby galaxies (Kong et al. 2002; Swartz et al. 2004). The contributions from unresolved HMXBs to the diffuse X-ray emission is discussed further in Section 5.4.1. We repeated the fitting process twice, first with the absorbing column fixed to the Galactic value and second with NH set to the total attenuation, including the internal attenuation obtained from the UV/IR data as described above.
Results from these fits are included in Tables 3 and 4, where we provide the absorption-corrected 0.3–8 keV X-ray luminosities for these two components, along with the best-fit reduced chi-squared  , the chi-squared χ2, the degrees of freedom, and the total observed X-ray flux. Table 3 gives the results including only Galactic absorption, while Table 4 gives the luminosities including both Galactic and internal absorption.
As can be seen by comparing Tables 3 and 4, the fits are generally better when internal absorption is included; however, for some systems, good fits are also found with only Galactic absorption. For the galaxies with poor fits in Table 4, we experimented with fitting additional parameters to improve the fit. For systems with long exposure times and high S/N spectra, we ran a total of 14 spectral models of increasing complexity. These models included (1) varying the temperature of the MEKAL component, (2) adding a second MEKAL component and fitting for the second temperature as well, (3) fitting for the absorbing column, (4) fitting for the photon index of the power-law component, (5) fitting for the absorbing column of the MEKAL component separately from the absorbing component of the power-law component, (6) varying the abundances of the α-elements relative to iron by using the VMEKAL function instead of the MEKAL function, (7) adding a Gaussian at 6.4 keV to match the Fe–Kα line (e.g., Grimes et al. 2005), and (8) various combinations of the above. For the VMEKAL models, as in Grimes et al. (2005) we tied the abundances of the α-elements together and tied the abundance of Fe to that of Ni, Ca, Al, and Na. We then fit for the α/Fe ratio.
We then rejected models with non-physical results (i.e., extreme power-law photon indices or very low temperatures, <0.2 keV). We also rejected more complex models in which one or both MEKAL components were detected at <3σ levels, or models in which the column density was not well-determined. We then sorted the remaining models and selected the model with the most degrees of freedom (least number of parameters) that had a null hypothesis probability ≥0.10 (i.e., if the null hypothesis is that the model is a good fit to the data, we fail to reject the null hypothesis at the 10% level). If none of the models met this criteria, we selected the model with the highest null hypothesis probability. In cases with multiple good models with different parameters, we inspected the fits to the X-ray spectra by eye, especially the low-energy regime, to select the best model. In choosing between a good-fit model with a high gas temperature and a low absorbing column, and a second good-fit model with a lower gas temperature but higher absorbing column, we selected the former.
The final best models selected by this procedure are included in Table 5, along with the parameters of the model. Some example spectra with the best-fit models overlaid are presented in the Appendix. In no case did adding the 6.4 keV Fe−Kα Gaussian component significantly improve the fit, so those models were not used. In no case were we able to strongly constrain the photon index of the power-law component, and in no case did varying the photon index of the power law provide the best model. Table 5 also includes the absorption-corrected 0.3–8 keV luminosities of the MEKAL and power-law components of these new fits. In most cases, our new final absorption-corrected MEKAL luminosities agreed well with the results obtained with fixed 0.3 keV temperature and fixed UV-/IR-derived absorption (Table 4). For the 23 galaxies in Table 5, the mean and median ratio of the MEKAL luminosity in Table 5 to that in Table 4 is 0.99, and the root mean square deviation in this ratio is 0.68. The fluxes in the two tables generally agree to within a factor of three (0.5 dex) or better. This gives us an estimate of the uncertainty in the luminosities obtained by our simple fixed temperature, fixed column density estimates for the lower S/N systems. For the systems for which we can estimate the absorbing column from the X-ray spectra, these values generally reasonably well with our UV/IR estimates of NH (Tables 4 and 5).
Table 5. X-Ray Fits for More Complex Models
| Name | Besta |

|
χ2/dof | NH | NH | kT | MEKAL LXb | Power Law LXb |
|---|---|---|---|---|---|---|---|---|
| Model | (MEKAL) | (P.L.) | (keV) | (1039 erg s−1) | (1039 erg s−1) | |||
| (1020 cm−2) | (1020 cm−2) | |||||||
| AM 2055–425 | 2T | 1 | 26.4/27 | 34.1F | 34.1F | 0.23 ± 0.03/0.77 ± 0.1 | 567.5 ± 184.6/222.9 ± 106.5 | 74.6 ± 29.8 |
| Arp 160 | 2T | 1 | 94.6/98 | 30.1F | 30.1F | 0.25 ± 0.01/1.03 ± 0.06 | 116.7 ± 12/25 ± 5.2 | 14.9 ± 3.6 |
| Arp 186 | 1T2N | 1.2 | 31.6/27 | 61.6 ± 10.3 | 2.9 ± 7 | 0.62 ± 0.06 | 213.7 ± 102.9 | 40.7 ± 12.4 |
| Arp 217 | 2TV | 1.3 | 276.8/210 | 13.6F | 13.6F | 0.24 ± 0.02/0.58 ± 0.03 | 19.1 ± 5.1/20.5 ± 4 | 17.2 ± 1.4 |
| Arp 220 | 2N | 1.1 | 77.2/73 | 47.8 ± 4.6 | 1.3 ± 1.9 | 0.3F | 221.5 ± 63.5 | 39.6 ± 5.3 |
| Arp 236 | 2N | 1 | 129.6/136 | 49.5 ± 2.8 | 6.8 ± 1.7 | 0.3F | 762.9 ± 123.7 | 174 ± 9.7 |
| Arp 244 | 2TV1N | 1.6 | 842.1/518 | 4.1 ± 0.7 | tied | 0.2 ± 0.03/0.58 ± 0 | 5.6 ± 1.1/38.4 ± 2.5 | 27.4 ± 1 |
| Arp 283 | 1T | 1.7 | 18.7/11 | 29F | 29F | 0.52 ± 0.07 | 29 ± 5.7 | 16.5 ± 3.7 |
| Arp 284 | 2N | 1 | 140.8/137 | 38.9 ± 4.5 | 4.8 ± 2.5 | 0.3F | 64.7 ± 17.4 | 25.7 ± 2.4 |
| Arp 293 | 2T | 1.1 | 36.9/34 | 27.2F | 27.2F | 0.3 ± 0.03/1.04 ± 0.12 | 260.8 ± 50.3/82.1 ± 32.7 | 63.6 ± 21.6 |
| Arp 295 | 1TV2N | 0.8 | 21/27 | 28.6 ± 11.5 | 1268.9 ± 330.2 | 0.69 ± 0.12 | 129.1 ± 41.2 | 852 ± 217.6 |
| Arp 299 | 1TV2N | 1.1 | 292.3/277 | 15.8 ± 2.8 | 19.8 ± 16.9 | 0.61 ± 0.01 | 328.5 ± 29.5 | 188 ± 7.3 |
| Mrk 231 | 1TV2N | 1.1 | 251.4/223 | 3.9 ± 1.1 | 509.1 ± 49.4 | 0.66 ± 0.02 | 244.5 ± 19.1 | 573.8 ± 37.5 |
| Mrk 273 | 1T1N | 1.3 | 121.3/92 | 0.6 ± 0.8 | tied | 0.66 ± 0.02 | 155.3 ± 18 | 426.1 ± 28.2 |
| NGC 1700 | 1T | 1.1 | 205.8/187 | 4.2F | 4.2F | 0.42 ± 0.01 | 56.4 ± 3.3 | 23 ± 4.3 |
| NGC 3256 | 1TV2N | 1.2 | 280/237 | 29.3 ± 2 | 12.6 ± 1.9 | 0.61 ± 0.01 | 223.8 ± 21.5 | 90.5 ± 6.2 |
| NGC 5256 | 2T1N | 1 | 52.9/51 | 3.1 ± 2.8 | tied | 0.2 ± 0.04/0.78 ± 0.09 | 112.5 ± 54.7/175.2 ± 63.7 | 190.2 ± 27.7 |
| NGC 6240 | 2TV1N | 1.4 | 463.9/331 | 18.1 ± 0.7 | tied | 0.65 ± 0.01/1.85 ± 0.28 | 815 ± 62.8/387.2 ± 56.8 | 708.3 ± 76.8 |
Notes.
a1T: one temperature component, absorbing column fixed; 2T: two temperature components, with absorbing column fixed; 1T1N: one temperature component, one absorbing column (absorbing columns for MEKAL and power-law components tied together); 2N: fitting for MEKAL and power-law absorbing columns separately, with fixed single-component MEKAL temperature. 1T2N: one temperature component; MEKAL and power-law absorption fit separately; 2T1N: two MEKAL temperature components; MEKAL and power-law absorbing columns tied together; 1TV2N: one temperature component, VMEKAL, two absorbing columns; 2TV: two temperature components, VMEKAL, absorbing column fixed; 2TV1N: two temperature components, VMEKAL, absorbing columns for MEKAL and power-law components tied together. For the VMEKAL models, the α/Fe ratios are Arp 217: 1.97 ± 0.83; Arp 244: 1.96 ± 0.56; Arp 295: 6.56 ± 14.86; Arp 299: 3.25 ± 2.48; NGC 3256: 3 ± 2.05; NGC 6240: 3.61 ± 0.97; Mrk 231: 2.86 ± 0.58. b0.3–8.0 keV.Download table as: ASCIITypeset image
To improve the fits in Table 5 further would require even more complex models. For example, one might divide the data into different radial regimes and fit different spatial regimes separately. Such analyses have been done using the Chandra archival data for some of our galaxies by other research groups. In the Appendix to this paper, the methods and results of these earlier studies are described in detail and compared with our results. The assumptions and methods used in these earlier studies differed widely. However, for most of these systems, our total absorption-corrected MEKAL luminosities agree within a factor of a few with these earlier studies. This gives another estimate of the uncertainties in our luminosities.
Yet another method of estimating the uncertainties in the derived absorption-corrected MEKAL luminosities is to compare the best-fit absorption-corrected MEKAL luminosities for different "good" models for the same galaxy. There were 15 galaxies in our sample which had at least three different "good fit" models, with null hypothesis probability greater than 0.10 and meeting the other criteria listed above. For each of these galaxies, we calculated the rms spread in the absorption-corrected MEKAL luminosities for the different models. The median rms dispersion for the sample was 0.31 dex, or a factor of two in the luminosity. This means that the choice of model can cause the derived luminosity to differ by about a factor of two on average.
For the subsequent analysis in this paper, when a better fit is available (Table 5), we used that rather than the luminosities from Table 4. For the models with two MEKAL components, we used the sum of the two MEKAL luminosities in Table 5 as the X-ray luminosity of the hot gas rather than the MEKAL luminosity from Table 4. In Table 6, we provide the ratios of these estimates of LX(gas) with LFIR, LK, and SFR, for both Galactic and total absorption.
Table 6. Ratios Involving the Diffuse MEKAL Component of the X-Ray Luminosity
| Name | Galactic Absorption | Internal Absorption | ||||
|---|---|---|---|---|---|---|
log( ) ) |
log( ) ) |
log( ) ) |
log( ) ) |
log( ) ) |
log( ) ) |
|

|

|
|||||
| AM 1146–270 | −3.81 | −4.32 | 39.39 | −3.65 | −4.16 | 39.55 |
| AM 2055–425 | −4.43 | −3.98 | 38.76 | −3.38 | −2.93 | 39.81 |
| AM 2312–591 | −4.52 | −4.04 | 38.65 | −3.5 | −3.03 | 39.67 |
| Arp 91 | −3.89 | −4.49 | 39.39 | −3.2 | −3.8 | 40.09 |
| Arp 147 | −3.42 | −4.01 | 39.81 | −3.03 | −3.62 | 40.2 |
| Arp 148 | −4.31 | −4.07 | 39.49 | −3.68 | −3.44 | 40.12 |
| Arp 155 | −4.22 | −5.21 | 39.36 | −3.57 | −4.56 | 40.01 |
| Arp 157 | −4.9 | −5.2 | 38.62 | −4.02 | −4.31 | 39.5 |
| Arp 160 | −4.04 | −4.02 | 39.09 | −3.15 | −3.13 | 39.97 |
| Arp 163 | <−3.46 | <−4 | <39.44 | <−3.4 | <−3.94 | <39.5 |
| Arp 178 | −3.61 | −5.04 | 39.8 | −3.1 | −4.54 | 40.3 |
| Arp 186 | −4.67 | −4.59 | 38.41 | −3.51 | −3.44 | 39.56 |
| Arp 217 | −3.68 | −3.87 | 39.29 | −3.22 | −3.41 | 39.74 |
| Arp 220 | −5.29 | −4.52 | 38.35 | −4.27 | −3.51 | 39.36 |
| Arp 222 | −2.93 | −5.35 | 39.92 | −2.43 | −4.85 | 40.41 |
| Arp 226 | −3.82 | −4.64 | 39.59 | −3.17 | −3.99 | 40.23 |
| Arp 233 | −3.87 | −4.24 | 39.14 | −3.47 | −3.84 | 39.54 |
| Arp 235 | <−3.03 | <−3.71 | <40.77 | |||
| Arp 236 | −4.38 | −4.16 | 38.89 | −3.09 | −2.87 | 40.17 |
| Arp 240 | −4.28 | −4.68 | 39.03 | −3.61 | −4 | 39.71 |
| Arp 242 | −4 | −4.54 | 39.44 | −3.46 | −4 | 39.98 |
| Arp 243 | <−5.02 | <−4.68 | <38.57 | <−4.51 | <−4.17 | <39.07 |
| Arp 244 | −3.72 | −4.36 | 39.49 | −3.52 | −4.17 | 39.69 |
| Arp 256 | −4.19 | −4.2 | 38.96 | −3.54 | −3.54 | 39.62 |
| Arp 259 | −3.83 | −3.69 | 39.3 | −3.5 | −3.36 | 39.63 |
| Arp 261 | <−3.82 | <−4.23 | <39.22 | −3.62 | −4.02 | 39.43 |
| Arp 263 | <−3.64 | <−3.94 | <39.37 | <−3.58 | <−3.88 | <39.42 |
| Arp 270 | −3.92 | −4.41 | 39.13 | −3.58 | −4.06 | 39.47 |
| Arp 283 | <−4.53 | <−4.82 | <38.77 | −3.6 | −3.89 | 39.7 |
| Arp 284 | −3.96 | −4.23 | 39.07 | −3.18 | −3.45 | 39.84 |
| Arp 293 | −3.95 | −4.26 | 39.65 | −3.15 | −3.46 | 40.45 |
| Arp 295 | <−4.28 | <−4.93 | <39.19 | −3.33 | −3.97 | 40.14 |
| Arp 299 | −4.38 | −4.15 | 38.72 | −3.66 | −3.44 | 39.44 |
| IRAS 17208–0014 | <−5.56 | <−4.77 | <38.09 | −3.74 | −2.95 | 39.91 |
| Mrk 231 | −4.75 | −4.97 | 38.31 | −4.33 | −4.55 | 38.73 |
| Mrk 273 | −4.46 | −3.99 | 38.96 | −4.29 | −3.83 | 39.12 |
| NGC 34 | <−4.66 | <−4.62 | <38.61 | −3.67 | −3.63 | 39.6 |
| NGC 1700 | −1.27 | −4.45 | 41.33 | −1.23 | −4.4 | 41.37 |
| NGC 2207/IC 2163 | −3.93 | −4.69 | 39.42 | −3.55 | −4.3 | 39.81 |
| NGC 2865 | −3.89 | −5.5 | 40.22 | −3.36 | −4.97 | 40.76 |
| NGC 3256 | −4.3 | −4.26 | 39 | −3.53 | −3.5 | 39.76 |
| NGC 3353 | −4.2 | −4.43 | 38.85 | −3.82 | −4.05 | 39.23 |
| NGC 5018 | −3.07 | −5.12 | 40.31 | −2.4 | −4.44 | 40.99 |
| NGC 5256 | −3.49 | −3.9 | 39.8 | −3.44 | −3.86 | 39.84 |
| NGC 6240 | −4.1 | −4.3 | 39.14 | −3.11 | −3.31 | 40.13 |
| NGC 7592 | −3.94 | −3.94 | 39.3 | −3.44 | −3.43 | 39.81 |
| UGC 2238 | <−4.5 | <−4.61 | <39.15 | −3.65 | −3.76 | 40 |
| UGC 5101 | <−5.23 | <−5.01 | <38.02 | −3.74 | −3.53 | 39.5 |
| UGC 5189 | <−3.92 | <−3.9 | <38.96 | <−3.8 | <−3.79 | <39.08 |
Download table as: ASCIITypeset image
5.4. Contributions to the Observed Diffuse X-Ray Emission
The observed diffuse X-ray emission from galaxies is made up of at least two distinct spectral components (e.g., Long et al. 2014; Kuntz et al. 2016). First, there is hot gas with a thermal spectrum. In spiral galaxies, this hot gas is mostly due to supernova shocks and feedback from star formation (e.g., Grimes et al. 2005), while in ellipticals and spheroidal bulges the hot gas is thought to be mainly virialized gas ejected from old stars (e.g., Ciotti et al. 1991; Pellegrini & Ciotti 1998). Second, the observed diffuse X-ray emission from galaxies also includes the light from faint unresolved point sources below the point source detection threshold, most of which have a power-law spectrum. Unresolved sources include HMXBs, low-mass X-ray binaries (LMXBs), cataclysmic variables (CVs), coronally active binaries (ABs), and young supernova remnants, as well as objects associated with a young stellar population, including protostars and young stars. Unresolved young supernova remnants below the point source sensitivity limit are expected to have a thermal X-ray spectrum (Long et al. 2010) and thus are included in our hot gas component. The other components are discussed further below. Another possible contributor to the measured diffuse X-ray emission is contamination by incompletely removed bright point sources, i.e., spillage outside the aperture in the wings of the point-spread function. This light is also expected to have a power-law X-ray spectrum. This component is also discussed below.
5.4.1. Contributions from Unresolved HMXBs
The contribution from unresolved HMXBs is expected to have a power-law X-ray spectrum and to scale with the SFR (Grimm et al. 2003; Mineo et al. 2012b). The luminosity of the unresolved sources will depend upon the point source sensitivity of the observations.
To estimate the expected contributions to the observed diffuse X-ray emission from HMXBs, we scale from the SFR using the Mineo et al. (2012a) best-fit X-ray luminosity function for HMXBs in a sample of nearby star-forming galaxies,
where L38 is the 0.5–8 keV luminosity in units of 1038 erg s−1.
Integrating over this luminosity function gives the total unresolved X-ray luminosity due to HMXB:

Using Llower = 1034 erg s−1 = 10−4 L38 as in Mineo et al. (2012b) and the Mineo et al. (2012a) best-fit values of γ = 1.6 and ξ = 1.49 (also see Grimm et al. 2003) gives

A power-law X-ray spectrum with a photon index Γ is assumed (i.e., a photon flux A ∝ E−Γ, where E is the energy). We assumed Γ = 1.8, the average value for resolved LX < 1039 erg s−1 point sources in nearby star-forming galaxies (Kong et al. 2002; Swartz et al. 2004). Using Lupper equal to the five-count PIMMS sensitivity limit (Table 2), we integrated this formula to determine the total X-ray luminosity expected due to unresolved HMXBs. These values are also included in Table 2.
In Figure 4, the ratio of the predicted LX(unresolved HMXBs) to the best-fit power-law X-ray luminosity is plotted against the SFR. In the top panel, the results assuming only Galactic absorption are shown, while the bottom panel shows the results using the correction for internal absorption. Red circles mark AGNs. The red dotted line indicates the expected result if all of the measured power-law flux is due to HMXBs.
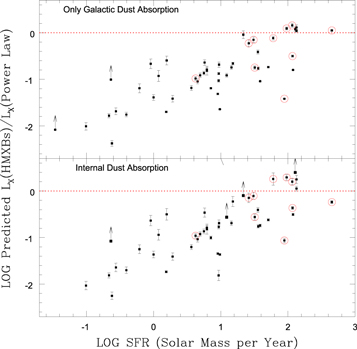
Figure 4. Predicted X-ray luminosity from unresolved HMXBs, divided by the absorption-corrected X-ray luminosity of the power-law component, plotted against the SFR. The top panel shows the results assuming only absorption by Galactic absorption, while the bottom panel includes a correction for absorption internal to the target galaxy. The red line shows the expected result if all of the observed power-law flux is due to HMXBs. The red circles mark the AGNs. See the text of the paper for more details.
Download figure:
Standard image High-resolution imageThese plots show a strong trend. At the high SFR end, the ratios are consistent with the power-law flux being dominated by light from unresolved HMXBs. However, at the low SFR end, another source of hard X-ray light must be contributing. The most likely contribution is from LMXBs associated with the older stellar population. This is discussed in the next section.
5.4.2. Contributions from LMXBs
The light from unresolved LMXBs is expected to have a power-law spectrum with a photon index of Γ ∼ 1.6 (Irwin et al. 2003). To first approximation, the total X-ray luminosity of LMXBs in a galaxy is expected to scale with the stellar mass M* of the galaxy (Gilfanov 2004). This ratio also depends upon the average stellar population age, with about a factor of 1.5 times higher total LX per M* for older ages (Zhang et al. 2012). For each galaxy in our sample, we calculated the expected total X-ray luminosity from LMXBs, LX(LMXBs), scaling from the K-band luminosity using the average value of 6.1 × 1039 erg s−1 per 1011 L☉ for LMXBs from Gilfanov (2004). These estimates are also included in Table 2.
In Figure 5, the ratio of the predicted best-fit LX(LMXBs) to the absorption-corrected power-law luminosity is plotted against the SFR. The top panel assumes only Galactic absorption, while the bottom includes absorption internal to the galaxy. These plots show that in most cases, LMXBs alone are insufficient to account for the observed power-law flux. However, for a few of the lower SFR systems, the expected contribution from LMXBs could account for all of the power-law emission.
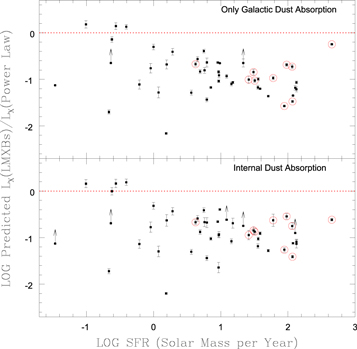
Figure 5. Predicted X-ray luminosity from unresolved LMXBs, divided by the absorption-corrected X-ray luminosity of the power-law component, plotted against SFR. The top panel shows the results assuming only Galactic absorption, while the bottom panel includes a correction for absorption internal to the target galaxy. The red line shows the expected result if all of the observed power-law flux is due to LMXBs. The red circles mark the AGNs. See the text of the paper for more details.
Download figure:
Standard image High-resolution imageIn Figure 6, we plot the SFR against the sum of the expected HMXB plus LMXB flux, divided by the absorption-corrected power-law luminosity. Given that there is considerable scatter in the HMXB−SFR relation (rms dispersion ∼0.4 dex; Mineo et al. 2012a) and the LMXB−LK and LMXB−M* relations (rms dispersion ∼0.2 dex; Zhang et al. 2012), Figure 6 shows that in most cases, HMXBs and LMXBs together can plausibly account for most of the observed power-law flux. However, there are a few systems that appear to have an excess of power-law flux compared to these predictions. In order from largest excess, these three galaxies are UGC 5189, Arp 263, and Arp 295. Our diffuse fluxes from these systems may include some imperfectly removed light from an AGN, although none of them are classified as Seyfert galaxies.

Figure 6. Predicted X-ray luminosity for both unresolved HMXBs and LMXBs, divided by the absorption-corrected X-ray luminosity of the power-law component, plotted against the SFR. The top panel shows the results assuming only Galactic absorption, while the bottom panel includes a correction for absorption internal to the target galaxy. The red line shows the expected result if all of the observed power-law flux is due to HMXBs and LMXBs. The red circles mark the AGNs. See the text of the paper for more details.
Download figure:
Standard image High-resolution image5.4.3. Contributions from CVs and ABs
Another possible contributor to the diffuse X-ray emission from galaxies is CVs and ABs. This component is not likely to be the cause of the possible excess power-law component, as it is expected to have an approximately thermal component, rather than a power law (Revnivtsev et al. 2008). Because they have similar X-ray spectra, the flux from CVs/ABs cannot be separated spectroscopically from hot gas. However, contributions from CVs/ABs are expected to be small. Revnivtsev et al. (2008) find that CVs and ABs with LX < 1036 erg s−1 contribute a constant ratio log(LX/LK) ∼ −5.8 to the global light of galaxies. This ratio is significantly smaller than the observed MEKAL-to-K-band ratios for almost all of our galaxies (see Table 6), thus we conclude that CVs and ABs contribute a negligible part of the observed diffuse emission for our galaxies.
5.4.4. Residuals or Deficiencies Due to Point Source Removal
To estimate whether spillage from incompletely removed bright sources is a significant source of contamination, we compare the total point source counts for each galaxy with the measured diffuse emission. Such spillage is typically expected to be 2%–4% of the point source counts, but can be up to 10% (Mineo et al. 2012b). The median ratio of the point source counts to the counts in the diffuse emission is only 0.39, with the largest ratio, 4.6, being found for Arp 261. In the median case, only 1.6% of the observed diffuse counts are due to imperfectly removed point sources. For Arp 261, the residual counts due to contamination is at most 18% of the measured diffuse flux. Thus, this factor is likely unimportant for our sample. If such residuals are present in our data, they will contribute to the power-law component, possibly accounting for some of the excess power-law flux above that expected from HMXBs and LMXBs.
A related issue is that, when removing the point sources from the image, one may inadvertently leave "holes" in the map of the diffuse emission, causing the total diffuse light to be underestimated. To estimate how important this missing flux is, for each system we calculated the total area covered by the point sources and compared with the area used to measure the diffuse emission, assuming that the diffuse gas uniformly covers the measured area. The galaxy with the largest fractional area covered by point sources was IRAS 17208–0014, with 5.1%. The median fraction for the sample was only 0.3%, and thus little flux was missed.
A detailed analysis of the spatial extent of the hot gas and the locations of the point sources relative to the hot gas is beyond the scope of this paper. However, we can make a more exact estimate of the missed flux by assuming a centrally peaked Gaussian distribution for the hot gas rather than a uniform distribution. For each point source, we calculated the positional offset of the source from the center of the galaxy and scaled relative to the optical extent of the galaxy as measured by the B band 25 mag arcsec−2 radius. The median offset was found to be 0.35 times the μB = 25 mag arcsec−2 radius. At this distance from the center, the expected hot gas flux assuming a Gaussian is about twice that calculated assuming a uniform surface density, assuming the full width tenth-maximum intensity of the hot gas is coincident with the μB = 25 mag arcsec−2 isophote. With these assumptions, in the median only 0.6% of the diffuse emission is lost due to point source removal. Thus, this factor is also likely unimportant and can be ignored.
6. The X-Ray Luminosity from Hot Gas
In the rest of this paper, we focus mainly on the X-ray luminosity from the hot gas LX(gas), which we assume is equal to the MEKAL component from our best fits to the diffuse X-ray spectrum. As noted above, in Table 6 we provide ratios of this component to the FIR and K-band luminosities and to the SFR.
6.1. Comparison with Merger Stage
The top panel of Figure 7 shows a plot of LX(gas) versus the interaction stage, where the X-ray luminosity has only been corrected for Galactic extinction. In the bottom panel, LX(gas) after correction for internal absorption is plotted against interaction stage. In this plot and all subsequent plots, the upper limits plotted for the X-ray luminosities are 3σ. In the lower panel of this plot and subsequent plots involving internal absorption, the stage 7 remnant Arp 235 is not plotted because it lacks UV data and is undetected in the MEKAL component. The black open squares in all panels of Figure 7 are the data for the individual galaxies; the blue filled diamonds that are offset slightly to the left of the stage show the median value for that stage. The error bars on the blue diamonds show the semi-interquartile range, equal to half the difference between the 75th percentile and the 25th percentile. Upper limits above the median were not included in calculating the median. In Figure 7, there is a decrease in the value of LX at stage 7 and a possible increase in the middle of the sequence, but there is not a strong overall correlation.

Figure 7. Plot of the best-fit LX(gas) vs. interaction stage (open black squares), including the uncertainty in LX. The top panel gives the X-ray luminosities only corrected for Galactic absorption. The bottom panel includes internal absorption. The filled blue diamonds are the median values for each stage, slightly offset to the left. The error bars plotted on the median values are the semi-interquartile range, equal to half the difference between the 75th percentile and the 25th percentile. Upper limits above the median were not included in calculating the median. Galaxies containing a Seyfert nucleus are circled in red. The upper limits are 3σ.
Download figure:
Standard image High-resolution imageIn Figure 8, we normalize LX(gas) by the stellar mass as traced by the K-band luminosity and plot against merger stage. The black open squares are the data for the galaxies, while the blue filled diamonds are the median values for that stage. The top panel gives the results assuming only Galactic absorption, while the bottom plot includes internal absorption. The LX(gas)/LK ratio shows a lot of scatter without clear trends. However, in the middle stages, the median LX(gas)/LK ratio is higher than the later stages. This result is consistent with a picture in which some of the mid-merger systems have enhanced SFRs, increasing the amount of hot gas relative to the older stellar population.
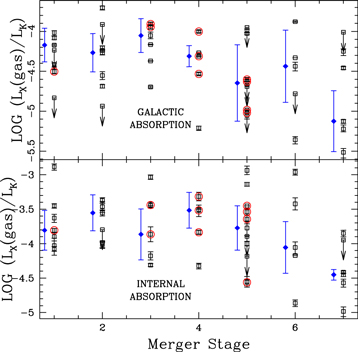
Figure 8. Plot of the best-fit diffuse LX(gas)/LK vs. interaction stage (open black squares), including the uncertainty in LX/LK. The top panel gives the X-ray luminosities only corrected for Galactic absorption. The bottom panel includes internal absorption. The filled blue diamonds are the median values for each stage, slightly offset to the left. The error bars plotted on the median values are the semi-interquartile range, equal to half the difference between the 75th percentile and the 25th percentile. Upper limits above the median were not included in calculating the median. Galaxies containing a Seyfert nucleus are circled in red.
Download figure:
Standard image High-resolution imageIn the top panel of Figure 9, we plot LX(gas)/LFIR versus stage, where LX(gas) has only been corrected for Galactic extinction. The black open squares are the data for the galaxies, while the blue filled diamonds are the median values for that stage. In the middle panel of Figure 9, LX(gas)/SFR is plotted versus stage, where LX(gas) has again only been corrected for Galactic absorption. In the bottom panel of Figure 9, the LX(gas)/SFR corrected for internal absorption versus merger stage is shown, where the X-ray luminosity has been corrected for internal absorption attenuation.

Figure 9. Top panel: plot of LX(gas)/LFIR vs. interaction stage (open black squares). The X-ray luminosity in this plot has only been corrected for Galactic absorption, not for material within the host galaxy itself. Galaxies containing a Seyfert nucleus are circled in red. The galaxy with the highest LX/LFIR ratio is NGC 1700, which we classify as stage 7. Middle panel: plot of diffuse LX(gas)/SFR vs. interaction stage, where the X-ray luminosity has only been corrected for Galactic absorption. Bottom panel: plot of diffuse LX(gas)/SFR vs. interaction stage, where the X-ray luminosity has been corrected for absorption within the host galaxy itself, using the UV/mid-infrared ratio as described in the text. Note that the galaxy with the highest LX/LFIR and LX/SFR, the stage 7 system NGC 1700, is not plotted in the bottom panel since no UV data are available. In all panels, galaxies containing a Seyfert nucleus are circled in red. The filled blue diamonds are the median values for each stage, slightly offset to the left. The error bars plotted on the median values are the semi-interquartile range, equal to half the difference between the 75th percentile and the 25th percentile. Upper limits above the median were not included in calculating the median.
Download figure:
Standard image High-resolution imageIn Figure 9, considerable scatter is present in these quantities from system to system for each stage. In the top and middle panels of Figure 9, when only Galactic absorption is included, merger stages 4 and 5 show lower median LX(gas)/LFIR and LX(gas)/SFR values. However, when internal absorption is included, this effect disappears (bottom panel Figure 9). After correction for internal absorption, no overall trends are visible in these plots, except that the median value for stage 7 is higher than the other stages. The systems with the highest LX(gas)/SFR ratios are NGC 1700, NGC 5018, and NGC 2865, all of which are classified as stage 7.
The AGNs do not stand out in Figure 9, except that none of our stage 6 and stage 7 merger remnants are classified as Seyferts. In addition, in stages 4 and 5 the AGNs have somewhat lower LX(gas)/FIR and LX(gas)/SFR ratios on average. This may be because of AGN contributions to powering the UV and IR fluxes, causing us to slightly overestimate our SFRs in some cases. The system with the lowest LX(gas)/SFR ratio, the stage 5 merger Mrk 231, hosts a powerful Seyfert 1 nucleus. This AGN may contribute significantly to powering the UV and IR fluxes (see the Appendix for a detailed discussion of the SFR in Mrk 231). This means that our nominal SFR calculation may overestimate the SFR, which will artificially lower the LX(gas)/SFR ratio. The stage 4 mergers Mrk 273 and Arp 220 are other possible examples.
6.2. Comparison with Normal Spiral Galaxies and Ellipticals
For the nine normal spiral galaxies in our comparison sample, we use the 0.5–2 keV luminosities of the diffuse X-ray emission provided by Mineo et al. (2012b). They have already subtracted an estimated contribution from unresolved point sources, corrected for Galactic absorption and fit to a MEKAL plus power-law function. For consistency with our fluxes, we converted the Mineo et al. (2012b) MEKAL X-ray fluxes to the 0.3–8 keV energy range. In some cases, they were able to fit for internal absorption using the X-ray spectra, while in other cases, Galactic absorption alone provided a good fit. They found gas temperatures of 0.2–0.3 keV, with some systems having a second 0.5–0.9 keV component.
For their sample of ellipticals and S0 galaxies, Su et al. (2015) provide 0.1–2 keV fluxes for the hot gas, after subtracting contributions from CVs, ABs, and LMXBs, and correcting for attenuation by Galactic absorption. For consistency with our galaxies, we approximately converted their fluxes into the 0.3–8 keV range using PIMMS. For the hot gas, they used an APEC model instead of a MEKAL function. For many of their galaxies, Su et al. (2015) were able to derive a gas temperature from the X-ray spectra; their best-fit temperatures range from 0.15–1.05 keV, with a median of 0.6 keV.
For their sample of massive elliptical galaxies, Goulding et al. (2016) extracted measurements of the diffuse X-ray luminosity from the hot gas, after removal of the light from LMXBs and AB/CVs. They model the hot gas using an APEC model and find a median gas temperature of 0.85 keV, with a range of 0.44–2.9 keV. Goulding et al. (2016) provide both total hot gas fluxes and fluxes within the effective radius of the galaxy. For the comparison to our mergers, we use the values within the effective radius, thus they are a lower limit to the total X-ray flux of the galaxy.
In Figure 10, we plot LX(gas)/SFR against LX(gas)/LK for the mergers, the normal spirals, and the E/S0 galaxies. For the mergers and spirals, larger symbols represent data corrected for internal absorption, while the small dots represent data assuming only Galactic absorption. In this figure, the mergers are color-coded against merger stage. After correcting for internal absorption, merger stages 1 and 2 are identified by open green triangles, stages 3, 4, and 5 are plotted as open cyan diamonds, and stages 6 and 7 are marked by blue open squares. The same colors are used as small dots for the data corrected only for Galactic absorption. Merging galaxies containing a Seyfert nucleus are circled in red. Black crosses or dots mark the normal spirals from Mineo et al. (2012b).

Figure 10. LX(gas)/LSFR vs. LX(gas)/LK, for the mergers, the normal spirals, and the E/S0 galaxies. The mergers are color-coded by merger stage, after correcting for internal absorption. Merger stages 1 and 2 systems are marked as open green triangles. Merger stages 3, 4, and 5 are open cyan diamonds, and merger stages 6 and 7 are identified by blue open squares. Merging galaxies with a Seyfert nucleus are circled in red. Small dots of the same color represent the mergers with only Galactic absorption. Large black crosses mark the normal spirals after correction for internal absorption; small black dots are spirals with only Galactic absorption. The red open squares represent the Goulding et al. (2016) massive ellipticals and the Su et al. (2015) E/S0 galaxies are marked by magenta open circles, calculated using SFRs derived from the UV+IR data with the Hao et al. (2011) relation (these SFRs are assumed to be upper limits for the E/S0 galaxies). The magenta filled upside-down triangles mark the Su et al. (2015) E/S0 galaxies using SFRs from SED fitting. The black line is the relation expected if the observed 24 μm flux is powered solely by the older stellar population (see the text for more details). The E/S0 values were obtained using only Galactic absorption.
Download figure:
Standard image High-resolution imageThe red open squares in Figure 10 represent the Goulding et al. (2016) massive ellipticals, while the Su et al. (2015) E/S0 galaxies are marked by magenta open circles. The X-ray luminosities for the E/S0 galaxies have only been corrected for Galactic absorption. For these E/S0 galaxies, the points marked by the red open squares and the magenta open circles were calculated using SFRs derived from the UV/IR data in the same manner as for the mergers. Since the E/S0 SFRs are likely upper limits, due to contributions to the observed UV/IR fluxes from older stars, the LX(gas)/SFR values for the E/S0 galaxies are plotted as lower limits. The magenta upside-down filled triangles mark the Su et al. (2015) E/S0 galaxies using SFRs from SED fitting.
Figure 10 shows an apparent trend for the E/S0 galaxies, in that LX(gas)/SFR appears correlated with LX(gas)/LK. This is an artifact caused by the fact that the formula used for the SFR is not valid for these galaxies. The 24 μm flux from most E/S0 galaxies may be dominated by circumstellar dust, which produces an approximately constant LK/L24 (Temi et al. 2009). In the formula used for the SFR, the 24 μm component dominates over the FUV for the majority of the ellipticals, thus a constant LK/SFR ratio is produced. In Figure 10, the black line is the relation expected using the Temi et al. (2009) LK/L24 ratio for an older stellar population and the Hao et al. (2011) SFR formula. This line thus marks the dividing line between systems with reliable estimates of the SFR and those without; points that lie above this line are lower limits. Interestingly, when the SED-determined SFRs are used (magenta upside-down filled triangles), there is also a trend in this plot, which argues that they are also unreliable.
All but one of the ellipticals/S0s lie above the black line; the exception is the SB0 galaxy NGC 1266, which lies in the same regime as most of the mergers. Three of the late-stage mergers (NGC 1700, NGC 5018, and NGC 2865) also lie above the line, in the same regime as the ellipticals. A fourth late-stage merger (Arp 222) is close to the line. This suggest that the SFR estimates may also be unreliable for these mergers.
In Figure 10, the spirals and the majority of the mergers are clearly separated from the E/S0 galaxies, having lower LX(gas)/SFR values for their LX(gas)/LK ratios. In the galaxies in the lower right of the plot, the hot gas is related to star formation. It is not related to star formation for the galaxies above the line. Only one of the E/S0 galaxies, NGC 1266, lies in the hot-gas-from-star formation regime.
6.3. Diffuse X-Ray Light from Hot Gas versus SFR
In the top panel of Figure 11, we compare LX(gas)/LFIR with the SFR, where the X-ray luminosity has only been corrected for Galactic extinction. The middle panel shows LX(gas)/SFR versus SFR, where again the X-ray luminosity has only been corrected for Galactic absorption. The bottom panel again plots LX(gas)/SFR versus SFR, but this time the X-ray luminosity has been corrected for absorption within the target galaxy. In Figure 11, we include data for the spirals along with the mergers; the E/S0 galaxies are not included.

Figure 11. Top panel: diffuse LX(gas)/LFIR, after only correcting for Galactic absorption, plotted vs. SFR. The data points are color-coded by merger stage. Merger stages 1 and 2 systems are marked as open green triangles. Merger stages 3, 4, and 5 are open cyan diamonds, and merger stages 6 and 7 are identified by blue open squares. Galaxies containing a Seyfert nucleus are circled in red. Black crosses mark the normal spirals from Mineo et al. (2012b). Middle panel: plot of diffuse LX(gas)/SFR vs. SFR, where the X-ray is only corrected for Galactic absorption. Bottom panel: plot of diffuse LX(gas)/SFR vs. SFR, after correction for internal absorption.
Download figure:
Standard image High-resolution imageIn the top and middle panels of Figure 11, there are weak anticorrelations, in that the galaxies with the highest SFRs tend to have lower LX(gas)/LFIR and LX(gas)/SFR ratios. However, when the diffuse X-ray luminosity is corrected for absorption within the galaxy itself, no strong trend with SFR is present (bottom), except that a few of the low SFR systems have high LX(gas)/SFR ratios.
To quantify these relationships, we calculated the Spearman rank correlation coefficient for each plot, excluding galaxies with SFR < 1 M☉ yr−1 and only including the galaxies in the merger sample (ignoring the spiral control sample). For the top, middle, and bottom panels of Figure 11, these correlation coefficients are −0.74, −0.67, and −0.35, respectively, ignoring upper limits. The likelihood of the correlations in the top two plots to have occurred by chance is <0.1% (i.e., 99.9% confidence for the correlation). In the bottom panel, however, the likelihood of the correlation occurring by chance is >5%, meaning that we must reject the hypothesis of a correlation.
The AGNs do not stand out in these plots, except that most of the galaxies classified as Seyferts have moderately high SFRs. Also, the system with the highest SFR, the Seyfert 1 Mrk 231, has the lowest LX(gas)/SFR ratio. As noted earlier, AGNs may contribute significantly to powering the global UV and IR fluxes of this galaxy, causing our SFR value to be overestimated and so LX(gas)/SFR to be artificially low. Arp 220 and Mrk 273 are other examples of high SFR AGNs with moderately low LX(gas)/SFR ratios (Table 6); as with Mrk 231, this ratio maybe somewhat underestimated if the AGN contributes significantly to powering the UV and IR fluxes.
The results presented in Figure 11 are displayed in a different way in Figure 12, where we plot LX(gas) versus SFR using only Galactic absorption (top panel) and internal absorption (bottom panel). Above SFR = 1 M☉ yr−1, the hot gas luminosity is clearly correlated with the SFR (Spearman correlation coefficients of 0.82 and 0.88, respectively). When internal absorption is included and AGNs omitted, the best-fit slope is 1.00 ± 0.10, consistent with a constant LX(gas)/SFR ratio on average for star-forming galaxies. When AGNs are included, the slope is less than one (0.74 ± 0.09 when internal absorption is included), perhaps due to an artificial depression of LX(gas)/SFR at high SFRs because of contributions by the AGN to powering the UV/IR fluxes.
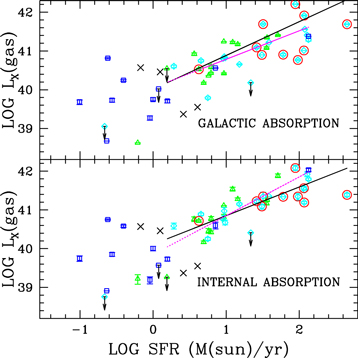
Figure 12. Top panel: diffuse LX(gas) vs. SFR, after only correcting for Galactic absorption. The data points are color-coded by merger stage. Merger stages 1 and 2 systems are marked as open green triangles. Merger stages 3, 4, and 5 are shown by open cyan diamonds, and merger stages 6 and 7 are identified by blue open squares. Galaxies containing a Seyfert nucleus are circled in red. Black crosses mark the normal spirals from Mineo et al. (2012). Bottom panel: plot of diffuse LX(gas) vs. SFR, after correction for internal absorption. Best-fit lines for data points above SFR = 1 M☉ yr−1 are plotted. Black solid lines are the fits including all of the mergers (slope = 0.87 ± 0.12 top panel, and 0.74 ± 0.09 bottom panel) and dashed magenta lines when the AGNs are omitted (slope = 0.74 ± 0.05 top panel and 1.00 ± 0.10 bottom panel).
Download figure:
Standard image High-resolution image6.4. LX(gas)/SFR versus Stellar Mass
As noted earlier, the near-IR K band is an approximate tracer of stellar mass in galaxies, with some possible contamination from red supergiants, AGB stars, and AGNs. In Figure 13, we plot LX(gas)/SFR corrected for internal absorption against LK for the mergers and the spirals. The mergers are color-coded according to merger stage (see the caption). Figure 13 also contains the values for the E/S0 galaxies, corrected only for Galactic absorption (magenta open circles and red open squares for the Su et al. 2015 and Goulding et al. 2016 samples, respectively). The LX(gas)/SFR ratios for the E/S0 galaxies are plotted as lower limits.
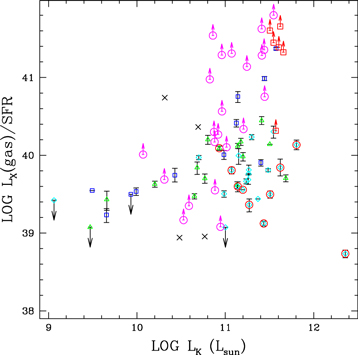
Figure 13. Plot of diffuse gaseous internal-absorption-corrected LX/SFR vs. LK. The data points are color-coded by merger stage. Merger stages 1 and 2 systems are marked by open green triangles. Merger stages 3, 4, and 5 are shown by open cyan diamonds, and merger stages 6 and 7 are identified by blue open squares. Here, L☉ represents the bolometric luminosity of the Sun, 3.9 × 1033 erg/s. Black crosses mark the normal spirals from Mineo et al. (2012). The open red squares indicate the Goulding et al. (2016) ellipticals, while the Su et al. (2015) E/S0 galaxies are shown by open magenta circles. As noted earlier, for the E/S0 galaxies, the SFRs from the UV+IR data using the Hao et al. (2011) formula may be upper limits, if the older stellar population is contributing significantly to the UV or IR data. Note that Arp 235 is not plotted, since no UV data are available.
Download figure:
Standard image High-resolution imageThere is no strong correlation between LX(gas)/SFR and LK for the mergers in Figure 13. The Spearman rank correlation coefficient is only 0.23 ignoring upper limits. The three stage 7 post-mergers with high diffuse LX(gas)/SFR all have high K-band luminosities. However, there are other mergers with equally high LK which have substantially lower LX(gas)/SFR values. Thus, a high LK does not guarantee high LX(gas)/SFR. The mergers overlap with some of the lower mass Su et al. (2015) E/S0 galaxies, although this is uncertain due to the fact that the LX(gas)/SFR values for the E/S0 galaxies are lower limits. Many of the mergers have K-band luminosities in the same range as the Su et al. (2015) E/S0 galaxies, but only a fraction of the mergers are as luminous in K as the massive E galaxies from Goulding et al. (2016).
However, the median LX(gas)/SFR for the mergers with LK < 1010 L☉ is lower than that for mergers with higher LK. Most of the systems with LK < 1010 L☉ are undetected in the MEKAL component of the diffuse emission (Figure 13) or were detected at low S/N (Table 4). However, our sample includes only a handful of galaxies with LK < 1010 L☉, so this result is uncertain.
The Seyfert galaxies do not stand out in Figure 13, except that they all have moderately high K-band luminosities, and the system with the highest LK by far, Mrk 231, is a Seyfert. None of the galaxies with low K-band luminosity are classified as Seyferts.
6.5. LX(gas)/SFR versus Stellar Population Age
In Figures 14 and 15, we plot the LX(gas)/SFR ratio against two different measures of the ratio of young-to-old stars in galaxies: the LFIR/LK ratio (Figure 14) and the [3.6 μm magnitude] – [24 μm magnitude] color (Figure 15). For both plots, for the mergers and the spirals, the X-ray fluxes have been corrected for internal absorption. For the mergers, the data points are color-coded according to merger stage. The spirals are plotted as black crosses. In Figures 14 and 15, the E/S0 galaxies have also been plotted, with the understanding that their LX(gas)/SFR ratios are lower limits.
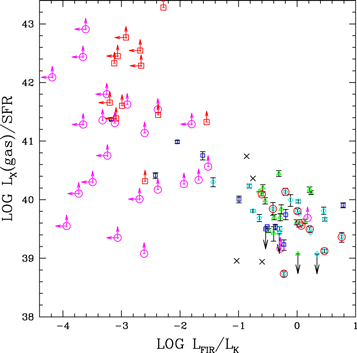
Figure 14. Plot of diffuse gaseous LX/SFR after correcting for internal absorption vs. LFIR/LK. Merger stages 1 and 2 systems are marked as open green triangles. Merger stages 3, 4, and 5 are shown as open cyan diamonds, and merger stages 6 and 7 are identified by blue open squares. The galaxy with the highest LFIR/LK ratio is IRAS 17208–0018, followed closely by Arp 220. Black crosses mark the normal spirals from Mineo et al. (2012). The open red squares indicate the Goulding et al. (2016) ellipticals, while the Su et al. (2015) E/S0 galaxies are shown by open magenta circles.
Download figure:
Standard image High-resolution image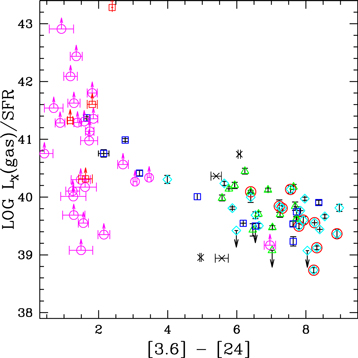
Figure 15. Plot of LX/SFR vs. [3.6] – [24]. These X-ray luminosities have been corrected for internal absorption. Merger stages 1 and 2 systems are marked as open green triangles. Merger stages 3, 4, and 5 are shown as open cyan diamonds, and merger stages 6 and 7 are identified by blue open squares. Black crosses mark the normal spirals from Mineo et al. (2012). The open red squares indicate the Goulding et al. (2016) ellipticals, while the Su et al. (2015) E/S0 galaxies are shown by open magenta circles.
Download figure:
Standard image High-resolution imageThe near-infrared K and Spitzer 3.6 μm bands are both approximate tracers of the older stellar population, while the total FIR and the 24 μm bands are approximate tracers of young stars. This means that galaxies with low LFIR/LK ratios and small [3.6] – [24] in Figures 14 and 15 tend to be dominated by older stellar populations, while galaxies with high LFIR/LK ratios and large [3.6] – [24] have large young stellar populations relative to the older stars.
In Figures 14 and 15, systems with large relative amounts of older stars (log LFIR/LK < −1.2 and [3.6] – [24] < 4.0) are found to have large LX(gas)/SFR ratios. Four of the late-stage mergers (NGC 1700, NGC 2865, NGC 5018, and Arp 222) stand out in these plots as having high LX(gas)/SFR ratios, low LFIR/LK values, and low [3.6] – [24]. These merger remnants lie in the same place on these plots as the ellipticals. Among the mergers, NGC 1700 has the smallest young/old stellar population and the largest LX(gas)/SFR ratio.
For systems with high log LFIR/LK ratios (younger stellar populations), above log LFIR/LK > −1.2, there is no trend of LX(gas)/SFR with LFIR/LK (Spearman rank correlation coefficient of −0.24 ignoring upper limits, corresponding to a greater than 5% likelihood that these trends happened by chance). For the mergers with [3.6] – [24] > 4.0, there is a weak correlation between LX(gas)/SFR and [3.6] – [24] (Spearman rank correlation coefficient of −0.49 ignoring upper limits, corresponding to about 1% likelihood of happening by chance). Thus, there is a weak trend of enhanced X-ray emission for younger average stellar populations.
The FUV – NUV color is another tracer of average stellar age, although it is also affected by dust. In the left panel of Figure 16, we compare FUV – NUV against FUV – [24], another tracer of dust attenuation. In the right panel, we plot FUV – NUV versus the NUV – [3.6] color.17 The panels in the top row show the mergers, while the panels in the bottom row mark the spirals and E/S0 galaxies. The mergers are color-coded into four classes according to their internal-absorption-corrected LX(gas)/SFR ratios (see the caption).

Figure 16. Left: plot of FUV – NUV vs. FUV – [24]. Right: FUV – NUV vs. NUV – [3.6]. Top row: mergers. Bottom row: spirals, ellipticals, and S0. The data points for the mergers are color-coded according to the internal-absorption-corrected LX(gas)/SFR ratio: magenta filled circles, LX/SFR > 1040.5 (in units of erg s−1)/(M☉ yr−1)); black filled diamonds, LX/SFR between 1039.9 and 1040.5; green open triangles, LX/SFR between 1039.5 and 1039.9; blue asterisks, LX/SFR ≤ 1039.5. In the bottom row, the cyan circles are the Su et al. (2015) E/S0 galaxies, red squares are the massive E's from Goulding et al. (2016), and black crosses are the Mineo et al. (2012b) normal spirals. The curves are the Starburst99 models (see the text).
Download figure:
Standard image High-resolution imageIn Figure 16, we have overlaid stellar population synthesis model colors from the Starburst99 code (Leitherer et al. 1999; Vázquez & Leitherer 2005). These are solar metallicity instantaneous burst models with a Kroupa (2002) IMF. We have plotted curves of constant age (green solid curve: 3 Myr; red dotted line: 20 Myr; cyan short dashed line: 100 Myr; blue long dash: 250 Myr; magenta dot-dash: 500 Myr). In these plots, model extinction increases left to right (toward larger FUV − [24] and larger NUV − [3.6]), while age increases bottom to top (i.e., toward increasing FUV – NUV). The model FUV – [24] colors in the left panel were calculated assuming the Hao et al. (2011) dust attenuation relation. Although these galaxies likely host a range of stellar ages rather than a single stellar population, this comparison provides a rough indication of the average stellar age and attenuation in the galaxies.
The two galaxies with the largest FUV – NUV colors in Figure 16 stand out as having the highest LX(gas)/SFR ratios. These are two of the late-stage mergers discussed earlier, NGC 5018 and NGC 2865. Comparison to the models indicates that these two systems have luminosity-weighted average stellar ages of ∼500 Myr. The galaxy with the highest LX(gas)/SFR in our sample, NGC 1700, does not appear in Figure 16, due to the lack of FUV data. However, based on optical photometry, the stellar population age in NGC 1700 is estimated to be 1–2 Gyr (Trancho et al. 2014) or ∼3 Gyr (Brown et al. 2000).
In Figure 16, two of the galaxies in the next highest LX(gas)/SFR range, the stage 5 merger Arp 226 and the stage 6 system Arp 222, also have somewhat elevated FUV – NUV colors, implying moderately old luminosity-weighted average stellar ages of 100–500 Myr. For the rest of the mergers, there is no obvious relationship between LX(gas)/SFR and the UV/IR colors on these plots. For most of the mergers, the UV/IR colors imply ages between a few Myr and about 250 Myr, similar to the expected ages for the normal spirals. The mergers, on average, have higher implied attenuations than the spirals. The four mergers with the oldest implied ages have UV/IR colors similar to those of many of the E/S0 galaxies, except with enhanced 24 μm flux, thus more dust.
These results indicate that the LX(gas)/SFR ratio remains relatively constant during ongoing star formation; however, when star formation diminishes, the hot gas luminosity decreases on a longer timescale, leading to an enhanced LX(gas)/SFR ratio. This point is discussed further in Section 7.5.
6.6. Hot Gas Temperature versus SFR
For 15 systems in our sample, our best-fit models included a fit to the gas temperature (Table 5). In Figure 17, for these 15 systems, we plot these gas temperatures against the SFR, color-coding by merger stage. In interpreting this plot, one must keep in mind that a fixed temperature of kT = 0.3 keV gives an acceptable fit for most of the galaxies in the sample (see Table 4). In other words, for most of the galaxies in the sample, we are not able to reliably constrain the gas temperature, and we cannot rule out 0.3 keV as the true gas temperature. To illustrate this point, these galaxies are included on the plot as small black dots at kT = 0.3 keV. We have also included the comparison elliptical and spiral samples in Figure 17. For the spirals and ellipticals, we used the published temperatures; we did not extract and re-fit the X-ray spectra ourselves. This introduces additional scatter in the plot because of different assumptions used in the spectral fitting.
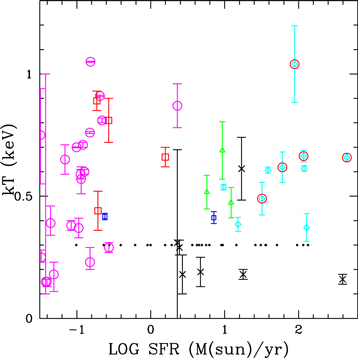
Figure 17. Best-fit hot gas temperature kT plotted against SFR for the galaxies in our merger sample for which we were able to obtain a good fit for the gas temperature. Merger stages 1 and 2 systems are marked as open green triangles. Merger stages 3, 4, and 5 are shown by open cyan diamonds, and merger stages 6 and 7 are identified by blue open squares. AGNs are identified by large red circles. The black dots represent mergers for which a fixed temperature of 0.3 keV provides a good fit to the X-ray spectrum. The Mineo et al. (2012b) spirals are marked by black crosses, the Su et al. (2015) ellipticals by open magenta circles, and the Goulding et al. (2016) ellipticals by red open squares. For systems in which the best model had two temperature components, the temperature plotted is the luminosity-weighted gas temperature.
Download figure:
Standard image High-resolution imageNo trend between kT and SFR is seen in Figure 17. Among the mergers, the temperature is not strongly dependent upon merger stage or AGN activity; however, this result is uncertain due to the small number of systems with reliable temperatures. For a sample of star-forming galaxies with moderate SFRs (≤20 M☉ yr−1), Mineo et al. (2012b) also did not see any correlation between hot gas temperature and SFR. However, Grimes et al. (2005) found a tendency for ULIRGs to have higher temperatures. To better determine the relationship between gas temperature and SFR for mergers, higher S/N X-ray spectra are needed to constrain the temperatures for more galaxies.
As shown in Figure 17 and as noted previously (e.g., Goulding et al. 2016), elliptical galaxies tend to have higher hot gas temperatures than spiral galaxies. In ellipticals, the gas temperatures are thought to be related to the depth of the gravitational potential (and therefore the mass of the galaxy) rather than to star formation processes (Goulding et al. 2016). See Section 7.5 for more discussion about the hot gas in elliptical galaxies.
6.7. Large-scale Environment
In addition to exploring possible correlations of LX(gas)/SFR with merger stage, we also looked for correlations with environment on a more global scale. Using redshifts from the 2M + + redshift compilation (a 2MASS-based redshift survey), Carrick et al. (2015) presented a reconstruction of the density of galaxies within 200 h−1 Mpc, a range that includes our entire sample. They have made available a grid of luminosity-weighted density contrast δg smoothed with a Gaussian of scale Mpc h−1 versus location on a grid with spacing 1.5625 Mpc h−1 centered on the Local Group. We have associated the location of each of our galaxy pairs with the interpolated luminosity density contrast at that point. Figure 18 shows a scatter plot of LX(gas)/SFR versus  . No obvious correlation is present (Spearman correlation coefficient = 0.07 when AGNs and upper limits are excluded). This argues against a scenario in which the diffuse X-ray emission from our sample galaxies is dominated by intragroup or intracluster gas. However, the variation in LX(gas)/SFR seems to be larger for interacting galaxies in overdense regions, and thus it is possible that intragroup or intracluster gas may contribute to some extent for some of the sample galaxies. Two of the late-stage mergers with high LX(gas)/SFR ratios, NGC 2865 and NGC 5018, are in dense regions, but the highest ratio galaxy, NGC 1700, is at average density. NGC 2865 and NGC 5018 have been identified by Kourkchi & Tully (2017) as members of groups.
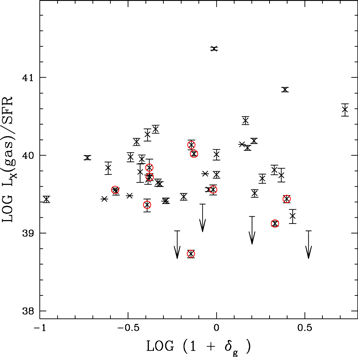
Figure 18. Plot of the internal-absorption-corrected LX(gas)/SFR ratio against the large-scale environment luminosity-weighted density contrast δg (see Section 6.6). On the x-axis, log(1 + δg) = 0 corresponds to the average local density.
Download figure:
Standard image High-resolution image6.8. Major Mergers versus Minor Mergers versus Multiple Mergers
We do not see a trend in the LX(gas)/SFR ratio with either merger stage or SFR; however, there is considerable scatter from system to system. It is possible that some of this scatter is caused by variations in the mass ratio of the galaxies in the pair. Some of the systems in our sample may be the product of a minor (unequal-mass) merger, rather than a major merger. Alternatively, they may be the product of the merger of more than two galaxies, or of a disk galaxy with a spheroid. After a merger has occurred, it is often difficult to determine the mass and Hubble type of the progenitor galaxies. In the Appendix to this paper, we describe each system in detail and provide a summary of the discussion in the literature about the evolutionary history of the system.
Out of our 49 sample systems, there are 19 for which there is some debate in the literature about their classification as the product of a merger of two approximately equal-mass gas-rich disk galaxies (see the Appendix). To test whether such misclassification contributes to the scatter in the LX(gas)/SFR ratio, in Figure 19, we reproduce our earlier plots of LX(gas)/SFR versus merger stage and LX(gas)/SFR versus SFR, but this time identifying the 19 controversial systems using green squares. In both panels, the X-ray luminosity has been corrected for internal absorption.
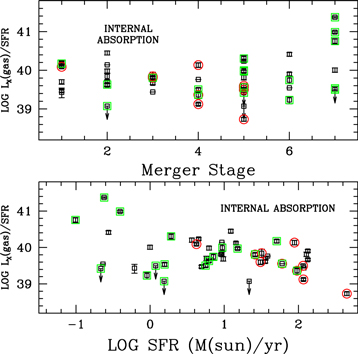
Figure 19. Plots of the internal-absorption-corrected LX(gas)/SFR ratio against merger stage (top panel) and SFR (bottom panel). Objects circled in red are classified as Seyferts in NED. Sources marked by a green square may not be classical "wet" major mergers, according to the discussion in the literature (see the Appendix).
Download figure:
Standard image High-resolution image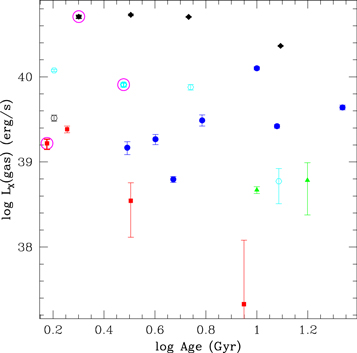
Figure 20. Plot of LX(gas) vs. stellar population age for our three post-starburst systems (large magenta circles), compared to the Boroson et al. (2011) early-type galaxies. The galaxies are color-coded with the following ranges: stellar velocity dispersion between 201 km s−1 and 238 km s−1 and gas temperatures between 0.32 keV and 0.36 keV (blue filled circles), velocity dispersion between 223 km s−1 and 260 km s−1 and gas temperature greater than 0.36 keV (black filled diamonds), velocity dispersion between 170 km s−1 and 200 km s−1 and kT ≤ 0.38 keV (red filled squares), velocity dispersion between 200 km s−1 and 260 km s−1, with kT < 0.32 keV (green filled triangles), velocity dispersion between 170 km s−1 and 201 km s−1, with kT > 0.36 keV (cyan open hexagons), and velocity dispersion greater than 232 km s−1 and less than 260 km s−1 with kT ≥ 0.32 keV and kT ≤ 0.36 keV (black open circle).
Download figure:
Standard image High-resolution imageAs expected, most of the controversial systems are later stage mergers; however, even for some of the earlier stage systems there is some debate. However, even when these controversial systems are eliminated from the sample there is still some scatter in the LX(gas)/SFR. This shows that such misclassification is likely not responsible for the observed scatter. With the exception of the three stage 7 systems with high LX(gas)/SFR, the controversial systems show the same range in LX(gas)/SFR as the other systems.
7. Discussion
We have used archival Chandra data to study the hot gas emission from 49 major mergers spanning the full merger sequence. After removal of the point sources, we have fit the spectrum of the diffuse X-ray light to two components: a soft thermal component and a hard power-law component.
7.1. The Diffuse Power-law Component
The power-law component of the diffuse emission can generally be accounted for by unresolved HMXBs and LMXBs (Figure 4). At high SFRs, HMXBs dominate this component, while at low SFRs, LMXBs become more important (Figure 5). Summing up their expected contributions and comparing to the observed power law, we find good agreement on average but with some scatter (Figure 6). Variations in the HMXB–SFR relation from system to system may contribute to this scatter. These variations may be due in part to different timescales for the formation of HMXBs compared to the stars responsible for the UV and IR fluxes used to calculate the SFR. HMXBs typically have ages of 20–70 Mpc (Antoniou et al. 2010; Williams et al. 2013), while the FUV and 24 μm light is sensitive to stars with ages from 0–100 Myr (Kennicutt & Evans 2012). Another factor that may contribute to the scatter is variations in the LMXB–LK ratio with stellar population age. Incompletely removed point sources, especially AGNs, may also contribute to the scatter.
7.2. The Relative Constancy of LX(gas)/SFR in Star-forming Galaxies
As noted above, the thermal component of the diffuse X-ray emission is likely dominated by radiation from hot gas. Excluding galaxies with low SFRs and correcting for internal absorption, we find no trend between LX(gas)/SFR and merger stage, SFR, AGN activity, or large-scale environment (see Figures 9, 11, and 18). The lack of a correlation between LX(gas)/SFR and the SFR for star-forming systems is in agreement with previous smaller surveys (Grimes et al. 2005; Mineo et al. 2012b). These results indicate that the main power source for the hot gas is star formation. The lack of a trend with AGN activity rules out feedback from AGNs as the main source of hot gas in our sample galaxies (see Section 7.7 below). The relatively constant LX(gas)/SFR ratio and the lack of a trend between LX(gas)/SFR and merger stage also argue against models in which the hot gas in mergers is primarily due to shocks from the direct collision of gaseous disks or gaseous halos (e.g., Cox et al. 2006a; Sinha & Holley-Bockelmann 2009). This topic is discussed further below in Section 7.8.
The relative constancy of LX(gas)/SFR suggest that stellar feedback in star-forming galaxies reaches a quasi-steady-state condition on average, with a constant fraction of the total energy output from supernovae and stellar winds being converted into X-ray flux. This simple state of affairs disagrees strongly with the classical Chevalier & Clegg (1985) theoretical model of hot gas production in starbursts, which predicts LX(gas) ∝ SFR2 (Zhang et al. 2014). More recent theoretical models of galactic winds including gravitational forces and more sophisticated radiative cooling calculations (Bustard et al. 2016; Meiksin 2016) can reproduce the observed LX(gas) ∝ SFR relation, if the mass loading factor (mass outflow rate/SFR) decreases with increasing SFR. Observationally, there is evidence from HST UV spectroscopy that the mass loading factor of galactic winds does decrease with increasing SFR (Chisholm et al. 2015). Both hydrodynamical simulations (Muratov et al. 2015) and analytical calculations (Hayward & Hopkins 2017) find that the mass loading factor of winds should decrease as the SFR increases.
In an alternative theoretical treatment, Sarkar et al. (2016) conclude that at SFRs greater than 1 M☉ yr−1, LX(gas) ∝ SFR2, but at low SFRs, a hot circumgalactic medium contributes, artificially producing an overall LX(gas) ∝ SFR relation. This model is ruled out by our data, however; even excluding systems with SFR < 1 M☉ yr−1 we do not see a trend of LX(gas)/SFR with SFR (Figure 11).
The fraction of the total mechanical energy of the starburst converted into diffuse thermal X-ray light is sometimes labeled the X-ray production efficiency. In simplistic starburst models in which the X-ray production efficiency is assumed to be constant, for an instantaneous burst, the X-ray luminosity from hot gas is expected to rise dramatically about 3 Myr after the burst when Type II supernovae start occurring and drop off steeply at an age of about 40 Myr when SN II activity decreases (e.g., Leitherer et al. 1999; Oskinova 2005). In contrast, if star formation continues at a constant rate and the X-ray production efficiency is constant, LX(gas) remains approximately constant relative to the absorption-corrected Hα luminosity (see Figure 12 in Smith et al. 2005).
In realistic models of major mergers, starbursts are not instantaneous, but instead prolonged for extended periods (≥100 Myr; Lotz et al. 2000; Di Matteo et al. 2008; Bournaud et al. 2011; Fensch et al. 2017). Furthermore, the hot gas lingers for an extended period. Using standard cooling functions (McKee & Cowie 1977; McCray 1987), we estimated approximate cooling times for the hot gas, based on estimates of the angular extent of the diffuse X-ray emission. These times range from about 10 to 500 Myr with a median value of about 100 Myr, similar to the Mineo et al. (2012b) estimates for disk galaxies. This cooling timescale is similar to the timescale of the expected variations in the SFRs. When the hot gas in a galaxy cools on a timescale approximately equal to the timescale for the star formation and/or is expelled on this timescale, the hot gas content will remain proportional to the current SFR, not to the integrated star formation history of the galaxy. In major mergers, star formation occurs in different locations within a system at different times, with at least some star formation happening somewhere in the system throughout most of the merger process. Another contributing factor is the fact that the strongest star formation occurs at different times in different mergers. The timing of a starburst relative to the morphological merger stage depends upon the parameters of the encounter, with some mergers having star formation in earlier stages than others (Lotz et al. 2000; Di Matteo et al. 2007, 2008). These factors conspire to produce no strong trend in the absorption-corrected LX(gas)/SFR ratio with merger stage.
The similar extended timescales for gas cooling and star formation bursts mean that to first approximation we can estimate the X-ray production efficiency by comparing with population synthesis models assuming continuous star formation. For galaxies with SFRs greater than 1 M☉, the median absorption-corrected LX(gas)/SFR ratio for our sample galaxies is 5.5 × 1039 ((erg s−1)/(M☉ yr−1)). Comparing to Starburst99 population synthesis models with continuous star formation (e.g., see Figure 12 in Smith et al. 2005), the X-ray production efficiency for our sample galaxies is about 2%. That is, about 2% of the total mechanical energy production due to star formation (mostly from SNe) is converted into X-rays. The system-to-system variation in the inferred efficiency is about a factor of two (see Section 7.9). Assuming that the total thermal luminosity of the hot gas at all wavelengths is about twice the luminosity in the 0.3–8 keV range (Mineo et al. 2012b), this implies that about 4% of the total mechanical energy from supernovae is thermalized.
7.3. Comparison to Previous Studies
For a sample of seven dwarf starbursts, six edge-on starbursts, and nine ULIRGs, Grimes et al. (2005) found an approximately constant LX(gas)/LFIR ratio of ∼10−4. This is a factor of three times lower than our median LX(gas)/LFIR value of 3.0 × 10⁻⁴. For a sample of 21 spiral and irregular galaxies, Mineo et al. (2012b) find an approximately constant LX(gas)/SFR after correcting for internal absorption of 7.3 × 1039 ((erg s−1)/(M☉ yr−1)). This value is 30% higher than our ratio.
Both the Grimes et al. (2005) and Mineo et al. (2012b) samples have lower stellar masses on average than ours, which may bring down the LX(gas)/SFR ratios (see Section 7.6). Mineo et al. (2012b) use a different prescription for their SFRs (see Mineo et al. 2012a). However, when we obtained total Spitzer and GALEX fluxes for their sample galaxies from NED and re-calculated the SFRs using the Hao et al. (2011) formula, we find little difference in the median, although there is a scatter of about 0.15 dex in the ratio of the two SFR calculations.
Our X-ray production efficiency of ∼2% is twice that of Grimes et al. (2005), who quote ∼1%. Mineo et al. (2012b) give an efficiency of 5%; however, this refers to the total thermal luminosity from the hot gas at all wavelengths rather than just that measured within the 0.3–8 keV band that we use. Since they use a correction factor of 2, we find good agreement with their results.
7.4. Low Observed LX(gas) at High LFIR
When the X-ray luminosities are not corrected for internal absorption, we see a depression in the median LX(gas)/LFIR and LX(gas)/SFR in the middle of the merger sequence (merger stages 4 and 5), compared to other stages (top and middle panels, Figure 9). For stages 4–5, with just Galactic absorption, the median LX(gas)/LFIR is 2.5 × 10⁻⁵, while for stages 1–3 plus stage 6 the median is 1.1 × 10⁻⁴, a factor of four times higher. We exclude stage 7 systems from this comparison, since some stage 7 systems have noticeably higher LX(gas)/SFR ratios (see Section 7.5). For stages 4–5, with just Galactic absorption, the median LX(gas)/SFR is 7.9 × 1038 ((erg s−1)/(M☉ yr−1)), while for stages 1–3 plus stage 6, this ratio is 1.6 × 1039 ((erg s−1)/(M☉ yr−1)), twice as large. Including internal absorption the median LX(gas)/SFR is 3.6 × 1039 ((erg s−1)/(M☉ yr−1)) for stages 4–5, while stages 1–3 plus 6 have a median 1.8 times larger, of 6.5 × 1039 ((erg s−1)/(M☉ yr−1)). Galaxies in mid-merger tend to have more obscured star formation. Correcting for internal absorption and using the SFR rather than LFIR decreases the drop in the middle of the sequence (bottom panel, Figure 9). Given the factor of approximately two in the uncertainties in the absorption-corrected luminosities (Section 5.3) and taking into account possible contributions from AGNs to the observed UV and IR fluxes, we conclude that there is no strong trend between LX(gas)/SFR and merger stage in our sample galaxies.
The systems with the lowest Galactic-absorption-corrected LX(gas)/LFIR and LX(gas)/SFR ratios tend to be higher SFR systems. The highest SFR systems tend to be in the middle of the merger sequence (Figure 3). When only Galactic absorption is included, systems with the highest SFRs appear to be deficient in diffuse thermal X-ray luminosity compared to other galaxies (top and middle panels, Figure 11). However, when internal absorption is included, this discrepancy almost disappears (bottom panel, Figure 11), particularly if the highest SFR system, Mrk 231, is ignored due to possible contamination of the UV/IR fluxes by the Seyfert 1 nucleus, and possible AGN contributions to the high SFR systems Arp 220 and Mrk 273 are taken into consideration. With only Galactic absorption, the median LX(gas)/LFIR is 3.6 × 10⁻⁵ for systems with SFR > 40 M☉ yr−1 and 1.1 × 10⁻⁴ for systems with 1 M☉ yr−1 < SFR < 40 M☉ yr−1. With only Galactic absorption, the median LX(gas)/SFR is 5.4 × 1038 ((erg s−1)/(M☉ yr−1)) for systems with SFR > 40 M☉ yr−1 and 1.5 × 1039 ((erg s−1)/(M☉ yr−1)) for systems with 1 M☉ yr−1 < SFR < 40 M☉ yr−1. Both LX(gas)/LFIR and LX(gas)/SFR are down by a factor of three for high SFR systems compared to lower SFRs if only Galactic absorption is included. When internal absorption is included, the median LX(gas)/SFR is 3.5 × 1039 ((erg s−1)/(M☉ yr−1)) for systems with SFR > 40 M☉ yr−1 and 1.9 times larger, 6.5 × 1039 ((erg s−1)/(M☉ yr−1)), for systems with 1 M☉ yr−1 < SFR < 40 M☉ yr−1. Galaxies with very high SFR and LFIR tend to have more obscured star formation and are more likely to host AGNs; when the X-ray luminosity is corrected for internal absorption and AGN contributions are taken into account, their LX(gas)/SFR ratios generally agree with systems with lower SFRs, given the uncertainties on the absorption-corrected LX(gas) values. Thus, we conclude there is no strong correlation between LX(gas)/SFR and SFR for galaxies with SFRs > 1 M☉ yr−1.
A deficiency in the global hard (2–10 keV) X-ray emission from LIRGs and ULIRGs relative to LFIR or SFR has been previously noted (Persic & Rephaeli 2007; Iwasawa et al. 2009; Lehmer et al. 2010). In these studies, the X-ray emission was only corrected for Galactic absorption. Persic & Rephaeli (2007) suggest that the 2–10 keV LX/LFIR is higher in lower SFR systems since LMXBs contribute substantially to the total X-ray light, while in higher SFR systems HMXBs dominate. Alternatively, Iwasawa et al. (2009) suggest that the deficiency at high LFIR may be because highly obscured AGNs are powering the FIR luminosity. A third opinion was given by Lehmer et al. (2010), who argue that the X-ray deficiency at high SFRs is likely due to absorption.
Our current study shows that, after point sources are removed and the thermal and power-law contributions separated, if internal absorption is not taken into account there is an apparent deficiency in the diffuse thermal LX from hot gas relative to LFIR and SFR. We attribute this deficiency to higher absorption in the most powerful starbursts. Interestingly, the number of luminous X-ray point sources relative to the FIR and SFR also shows a deficiency in LIRGs and ULIRGs (Smith et al. 2012; Luangtip et al. 2015), a result attributed to absorption. Thus, both the extended and point source X-ray light, if uncorrected for internal absorption, are lower relative to the SFR in LIRGs and ULIRGs.
Using Chandra data, Brassington et al. (2007) found a dip in the diffuse LX/LFIR in the middle of their merger sequence, near nuclear coalescence. They concluded that this drop was caused by the break-out of a galactic wind. However, the dip was caused by a single system, Arp 220, for which they found a diffuse LX/LFIR (only correcting for Galactic absorption) that is a factor of 10 times lower than for the other systems in their sequence. We also see a low value of Galactic-absorption-corrected diffuse LX/LFIR for Arp 220; however, once corrected for internal absorption, Arp 220 does not stand out relative to the other galaxies in our sample (see Table 6).
Our conclusion that there is no strong trend of LX(gas)/SFR with SFR is consistent with earlier studies. In their survey of the hot gas in 22 star-forming galaxies, Grimes et al. (2005) saw no correlation between the internal-absorption-corrected LX(gas)/LFIR and FIR luminosity. Mineo et al. (2012b) also did not see a trend with SFR in their sample.
7.5. Hot Gas in Post-starburst Late-stage Remnants
In our plot of absorption-corrected LX(gas)/SFR versus merger stage (Figure 9), three low SFR systems in the last merger stage stand out as having higher median LX(gas)/SFR ratios: NGC 1700, NGC 2865, and NGC 5018. Compared to the median value for the other systems, the absorption-corrected LX(gas)/SFR ratio for these three galaxies are enhanced by a factor of 8–47. As discussed at length in Section 6.5 and in the Appendix, compared to the other galaxies, these three systems have older stellar populations (500 Myr–3 Gyr, according to UV/IR/optical data).
The three late-stage galaxies with enhanced LX(gas)/SFR ratios have lower LFIR/LK ratios and lower [3.6] – [24] colors than the rest of the mergers, but they are not as extreme in these colors as the majority of the ellipticals in our comparison samples (Figures 14 and 15). This suggests that they are transition objects. Furthermore, although NGC 2865 and NGC 5018 are as red in FUV – NUV as some of the ellipticals (implying an older population), they are redder in FUV – [24] and NUV – [3.6] than the ellipticals (implying more extinction) (Figure 16). NGC 1700 (which lacks FUV data) has NUV – [3.6] = 8.55 ± 0.06, also redder than a typical elliptical. This also supports the idea that these three galaxies are in a transition phase.
The observed increase in LX(gas) in these three systems relative to their SFRs is less than that expected from an aging stellar population assuming a constant X-ray production efficiency and a single instantaneous burst. By 20 Myr after an instantaneous burst ends, the ratio of the total mechanical luminosity relative to the number of hydrogen-ionizing photons is expected to be about a thousand times larger than that produced by steady-state star formation (see Figure 12 in Smith et al. 2005). This implies that either our SFRs are overestimates due to contributions to the UV/IR fluxes from older stars, or star formation did not completely stop in these systems. For example, if the SFR in a galaxy with continuous star formation abruptly dropped to a level 50 times lower than its original rate then remained constant at the new level, there would be a time lag equal to the gas cooling time plus the lifetime of the most massive stars before the diffuse X-ray luminosity dropped to match the new SFR. During this transition period, LX(gas)/SFR will be enhanced by a factor of 50 relative to the original steady-state value. By this same argument, a star formation rate that declines gradually with time could also lead to an increase in the observed LX(gas)/SFR.
In classical models of hot gas production in elliptical galaxies, an early starburst is assumed to quickly use up or clear out most of the gas, leaving the galaxy deficient in gas until a hot halo is rebuilt by virialization of mass loss from older stars and Type Ia supernovae (Ciotti et al. 1991; Pellegrini & Ciotti 1998). This rebuilding is expected to be a slow process, with the halo regeneration taking many gigayears. In the Ciotti et al. (1991) standard model, from its initial starburst level, LX(gas) drops by a factor of 10 within ∼1 Gyr, then drops by another factor of 10 to a minimum at an age of about 5 Gyr, and then steadily increases. To study the rebuilding process, using ROSAT data, O'Sulllivan et al. (2001b) compared the global LX/LB ratios of ellipticals with the stellar population age. They found a trend of increasing LX/LB with increasing age. They concluded this trend was likely caused by Type Ia supernovae and other stellar mass loss. Their relation, however, shows a lot of scatter and includes many upper limits on the X-ray fluxes, and thus is very uncertain.
For a sample of nearby non-cD early-type galaxies, Boroson et al. (2011) used sensitive Chandra images to remove the bright point sources and fit the spectrum of the diffuse emission to multiple components to extract the hot gas content. For the subset of their early-type galaxies with stellar velocity dispersions σ* between 170 km s−1 and 260 km s−1, in Figure 20 we plot the average stellar age against LX(gas) (which is only corrected for Galactic absorption). In Figure 20, we color-code the Boroson et al. (2011) galaxies according to σ* and gas temperature (see the caption for the ranges). We have added our three post-starburst systems to Figure 20, color-coded in the same way but also surrounded by large magenta circles.18
As shown in Figure 20 and as previously noted by Boroson et al. (2011), systems with higher gas temperatures tend to have higher LX(gas) and systems with higher dynamical masses (as indicated by σ*) also tend to have higher LX(gas); however, there is a lot of scatter. As previously pointed out by Boroson et al. (2011), for the subset of seven ellipticals with moderate σ* (between 202 and 232 km s−1) and moderate gas temperatures (between 0.32–0.36 keV), there is a trend of increasing LX(gas) with increasing stellar age (blue filled circles in Figure 20). However, systems with low dynamical masses (σ* between 170 km s−1 and 200 km s−1) and moderate to low gas temperatures (kT ≤ 0.38 keV) show a decrease in LX(gas) with increasing age (red filled squares), although there are only four galaxies in that subset. The other subsets show approximately constant LX(gas) values with age, but only contain a few galaxies each. Given the small number of systems in each subclass, it is difficult to make any strong conclusions about the evolution of hot halos in post-mergers from these data. We note that our three post-starburst systems have LX(gas) similar to systems in the Boroson et al. (2011) sample with similar velocity dispersions, gas temperatures, and ages, thus they are not unusual compared to similar systems. Observations of additional post-starburst, post-merger systems would be useful to search for definitive evolutionary trends with age.
For their sample of early-type galaxies from the ATLAS3D survey, Su et al. (2015) calculated the ratio LX(gas)/LK and compared it with stellar age. They found a rough trend, in that galaxies with older stellar populations have higher LX(gas)/LK. However, there is a very large amount of scatter in this relation (up to a factor of 1000 in the LX(gas)/LK ratio at a given age). Furthermore, their sample only includes a handful of systems with young ages, thus the evolution of the hot gas in the early post-starburst period remains uncertain.
7.6. Low-mass Galaxies
As discussed in Section 6.4, the galaxies in our sample with the lowest K-band luminosities appear to be deficient in hot gas relative to the SFR, compared to higher LK galaxies (Figure 13). Above LK = 1010 L☉, no obvious trend is seen. The absorption-corrected median LX(gas)/SFR for the systems with LK < 1010 L☉ is <2.3 × 1039 (erg s−1)/(M☉ yr−1)), while systems with 1010 L☉ < LK < 1011 L☉ have a median value of 5.0 × 1039 (erg s−1)/(M☉ yr−1), and systems with LK > 1011 L☉ have a median of 6.0 × 1039 (erg s−1)/(M☉ yr−1)). However, our sample only includes a handful of galaxies with LK < 1010 L☉, so this result is uncertain.
A complicating factor is that our sample includes a range of morphological types, from disk systems to spheroidals, and a range of stellar population ages. However, inspection of Figure 13 shows that when the merger sample is divided into three subsets—pre-mergers (merger stages 1 and 2; green open triangles), mid-mergers (merger stages 3, 4, and 5; cyan open diamonds), and merger remnants (stages 6 and 7; blue open squares)—each subset shows lower LX(gas)/SFR ratio for low LK. This suggests that morphology is not the only factor, and the dynamical mass plays a role. Each subset, however, only contains a few galaxies with LK < 1010 L☉. It would be useful to increase the numbers of galaxies in each of these classes to get better statistics on the amount of hot gas as a function of stellar mass in various types of systems.
Lower LX(gas)/SFR for galaxies with low LK may be caused by increased gas loss via winds due to weaker gravitational fields, if galaxies with lower stellar masses also have lower total masses. From an HST UV spectroscopic study of the wind velocities of starburst galaxies, Chisholm et al. (2015) conclude that galaxies with stellar masses greater than about 3 × 10¹⁰ M☉ do not lose interstellar gas via winds, but at lower masses some gas is removed. This stellar mass cutoff for gas lost through winds is consistent with expectations based on binding energy arguments (Dekel & Woo 2003). Using a typical stellar-mass-to-LK ratio of 1 M☉  (e.g., Bell et al. 2003), this mass limit corresponds to LK ∼ 3 × 10¹⁰ L☉. Given the uncertainties, this value is reasonably consistent with the LK limit at which we see a drop-off in the LX(gas)/SFR ratio. Alternatively, the apparent deficiency in LX(gas) at low LK may be due to lower metallicities, as the observed X-ray luminosity from hot gas increases for increasing metallicity (e.g., Silich et al. 2001).
As noted in Section 7.3, the Grimes et al. (2005) LX(gas)/LFIR is lower on average than ours. This may be because their sample has lower LK on average. Half of their galaxies have LK < 1010 L☉, compared to only 8 out of 49 in our sample. However, the Mineo et al. (2012b) sample also has about half with LK < 1010 L☉, but their best-fit LX(gas)/SFR ratio is slightly higher than ours.
7.7. The Importance of AGN Activity
In none of our plots do we see a systematic difference between the properties of the AGNs and the other galaxies. The lack of an observed trend with AGN activity implies that winds and jets from AGNs are less important energetically in major mergers than star formation, at least as far as the diffuse X-ray-emitting gas is concerned. Perhaps jets and winds from AGNs are sufficiently smothered during most major mergers that they do not create large volumes of hot gas within the galaxies. Alternatively, perhaps powerful jets and winds from AGNs can be very disruptive of the interstellar medium, but only for short timescales and only rarely. In a sample of only 49 systems, maybe we do not have a large enough subset with AGNs in an outburst phase for us to detect a trend.
We note that most of the AGNs in our sample are in the middle merger stages (stages 3, 4, and 5). This may be in part a selection effect, since this is an archive-selected sample. Galaxies in those stages tend to be more distant (Figure 2) and more luminous in both the FIR and the K band (Figure 3).
We also note that we excluded radio galaxies from our sample. This may cause a bias, if a radio galaxy phase is responsible for producing the hot gas in ellipticals. Once the cold gas is depleted in a merger and the SFR ends, maybe a large radio jet can be produced (i.e., "smothering" of the jet by the interstellar medium no longer occurs). Such jet activity may be periodic, keeping the interstellar gas in ellipticals hot. In the Ciotti et al. (2017) hydrodynamical models of AGN feedback in early-type galaxies, the AGN outbursts are predicted to last about 30 Myr and have a duty cycle of 4%.
7.8. Shocks
The relatively constant LX(gas)/SFR ratio argues against models in which the hot gas in mergers is primarily due to shocks caused by the direct collision of gaseous disks or gaseous halos (e.g., Cox et al. 2006a; Sinha & Holley-Bockelmann 2009). The lack of a trend between LX(gas)/SFR and merger stage also argues against these models, although the timing of such shocks depends upon the impact parameter of the merger. The Cox et al. (2006a) simulations involve nearly radial orbits, which are expected to produce strong shocks early in the merger during the first impact, and a second maximum near nuclear coalescence. For a larger initial impact parameter, strong shocks may not be produced until final coalescence. Such variations in initial orbital parameters may smear out any correlation of shock emission with merger stage.
Optical imaging spectroscopy (Monreal-Ibero et al. 2006, 2010; Rich et al. 2011, 2014, 2015; Soto & Martin 2012) has revealed enhanced [N ii]/Hα, [S ii]/Hα, and [O i]/Hα emission line ratios over spatially resolved areas within some LIRGs and ULIRGs, indicative of excitation by large-scale shocks rather than H ii regions or AGNs. Further, these systems tend to have larger velocities dispersions, 100–200 km s−1, compared to more quiescent systems. Such optical signatures of large-scale shocks tend to be more frequent in closer pairs and later stage mergers. At present, there is some uncertainty about what is producing these shocks, with three competing ideas: (1) stellar feedback, including supernovae and galactic winds, (2) the direct collision of two gaseous disks, or (3) large-scale gas flows within the galaxies due to tidal forces. All of these processes directly or indirectly correlate with the SFR; for example, gas flows within the disks and collisions between disks likely enhance star formation, which in turn powers galactic winds. Therefore, distinguishing among those three scenarios is difficult.
The relationship between the shocks probed by these optical line ratios and the X-ray-emitting gas is also uncertain, as the optical lines are produced by colder neutral gas compared to the gas detected in the X-rays. To better address this question, detailed comparisons of the spatial distribution of the diffuse X-ray light compared to the location of the shocks traced by the optical emission line maps would be useful, along with multiphase modeling of the gas. Such an analysis is beyond the scope of the current paper.
7.9. The Scatter in LX(gas)/SFR
For moderate and high SFRs, we see no correlation between the absorption-corrected LX(gas)/SFR with merger stage or SFR; however, there is a fair amount of scatter in these plots (Figures 9 and 11). For galaxies with SFR > 1 M☉ yr−1, the root mean square deviation in log LX(gas)/SFR is 0.36, or about a factor of 2.3 in LX(gas)/SFR. This variation is similar to that found in earlier studies. Mineo et al. (2012b) noted a scatter of 0.34 dex in LX(MEKAL)/SFR, while Grimes et al. (2005) found a spread of 0.38 dex in LX(gas)/LFIR.
One factor that may contribute to the observed scatter may be strongly variable SFRs. Depending upon the timing and the duration of the starburst versus the gas cooling time and/or gas escape time, the LX(gas)/SFR may vary a great deal (see Section 7.5). System-to-system variations in the parameters of the interaction as well as variations in the initial properties of the galaxies affect the star formation history of the galaxy. Also, as noted earlier, system-to-system variations in dynamical mass may affect the rate at which the hot gas escapes. Metallicity variations may also affect the LX(gas)/SFR ratios. Shock heating from direct collisions between gas-rich disks may also heat the gas (Cox et al. 2006a; Sinha & Holley-Bockelmann 2009), adding scatter to the global LX(gas)/SFR ratios. Differences in the large-scale environments of the galaxies may also cause some galaxy-to-galaxy variations in the LX(gas)/SFR ratio because of infall from intragroup and intracluster gas. It is also possible that past AGN activity may have affected the hot gas content in some of these galaxies, although we see no correlation between LX(gas)/SFR and current AGN activity in our sample. Other factors that may contribute to the scatter in our LX(gas)/SFR values may be variations in the NH/AV ratio (i.e., the gas-to-dust ratio), variations in the geometry of the hot gas relative to the stars, temperature gradients across the galaxy, or variations in the absorbing column across a galaxy. Also, as noted earlier, different assumptions about the absorbing column and gas temperature in the model that is used can cause the derived luminosities to vary by a factor of two on average. Further studies are needed to investigate these possibilities.
8. Summary and Conclusions
We have used high-resolution X-ray spectral imaging data from the Chandra telescope to study the properties of the hot interstellar gas in a sample of 49 major mergers spanning the full Toomre sequence. After removal of the bright point sources, we fit the X-ray spectrum of the diffuse emission to a two-component model: a thermal component described by a MEKAL function to represent the hot gas and a power-law component that is dominated by light from unresolved point sources. When absorption within the target galaxy is accounted for, LX(gas)/SFR does not depend strongly upon the SFR. The absorption-corrected LX(gas)/SFR ratio also does not depend upon merger stage, AGN activity, or large-scale environment. These results indicate that the hot gas in these mergers is mainly powered by stellar and supernova feedback associated with a young stellar population. This feedback appears to be regulated such that an approximately constant fraction of about 2% of the total energy output from supernovae and stellar winds is converted into X-ray flux.
Three late-stage merger remnants in our sample have LX(gas)/SFR ratios that are about 10–50 times larger than the median for the other galaxies. These three galaxies have low SFRs (<1 M☉ yr−1) and UV/optical/IR signatures of post-starbursts, suggesting that they are in the process of becoming "red and dead" ellipticals with excess hot gas.
For the merger sample, LX(gas)/SFR does not vary with LK for galaxies with LK > 1010 L☉. However, galaxies with LK < 1010 L☉ show a deficiency in LX(gas) relative to the SFR. Since LK approximately traces the stellar mass in galaxies, this result suggests that hot gas escapes more easily from these systems due to weaker gravitational fields, assuming galaxies with lower stellar masses also have lower total masses. Alternatively, the lower LX(gas)/SFR in these galaxy may be due to lower metallicities.
We thank the anonymous referee for very helpful suggestions, which greatly improved the paper. This research was supported by NASA Chandra archive grant AR6–17009X, issued by the Chandra X-ray Observatory Center, which is operated by the Smithsonian Astrophysical Observatory for and on behalf of NASA under contract NAS8–03060. Support was also provided by National Science Foundation Extragalactic Astronomy Grant ASTR-1311935, as well as the NASA Tennessee Space Grant program. The scientific results reported in this article are based on data obtained from the Chandra Data Archive. This research has also made use of the NASA/IPAC Extragalatic Database (NED), which is operated by the Jet Propulsion Laboratory, California Institute of Technology, under contract with NASA. This work also utilizes archival data from the Spitzer Space Telescope, which is operated by the Jet Propulsion Laboratory (JPL), California Institute of Technology, under a contract with NASA. This study also uses archival data from the NASA Galaxy Evolution Explorer (GALEX), which was operated for NASA by the California Institute of Technology under NASA contract NAS5–98034.
Appendix: Notes on Individual Galaxies in the Sample
In this appendix, we describe each of the galaxies in our sample and provide references, and we compare the results of our analysis of the archival Chandra data (Tables 2–4) with earlier studies using the same Chandra data. See the references listed below for images of these galaxies in the X-ray and other wavelengths. In Figure 21, we provide some example Chandra spectra for four of our galaxies: Arp 293, Arp 295, NGC 5256, and NGC 6240.

Figure 21. Chandra diffuse X-ray spectra of four of our sample galaxies, plotted with their best-fit models. The x-axis is energy, in units of keV, while the y-axis has units of normalized counts s−1 keV−1. All of these models have a power-law component plus at least one MEKAL or VMEKAL component. The individual components of the model are plotted as dotted curves, while the sum of all of the components is shown as a solid curve (in blue). In all cases, the highest dotted curve on the right side of the plot (in red) is the power-law component, while the other dotted curve(s) (in black) is (are) the MEKAL component(s). Top left: Arp 293. Top right: Arp 295. Bottom left: NGC 5256. Bottom right: NGC 6240. For details on the models and the fitting process, see Table 5 and Section 5.3. For more information about the individual galaxies, see the Appendix.
Download figure:
Standard image High-resolution imageFor 19 of the systems in our sample, their classification as major mergers has been questioned in the literature. These include Arp 157, Arp 160, Arp 163, Arp 178, Arp 186, Arp 217, Arp 220, Arp 233, Arp 235, Arp 236, Arp 259, Arp 263, NGC 1700, NGC 2865, NGC 3353, NGC 5018, NGC 7592, UGC 2238, and UGC 5189. Details on all 49 systems are provided below.
AM 1146–270 (ESO 504–G017): We classify this as a post-merger stage 6 system, as it is a single compact source with a short tail. In NED, it is listed as an Scd/BCD H ii galaxy. Using optical images, Smith & Hintzen (1991) found numerous blue knots near the nucleus. Compared to the other systems in our sample, it has both a low LK and a low LFIR (108.98 L☉ and 109.49 L☉, respectively) as well as a relatively low LFIR/LK and a low SFR (0.26 M☉ yr−1). This is likely a low stellar mass system with a low but non-zero specific star formation. In NED, it is classified as Seyfert 2. AM 1146−270 was included in the Read & Ponman (1998) ROSAT study of X-ray emission along a major merger sequence. They classify it as "beyond the end of the Toomre sequence," as a "spheroidal galaxy with a small tail-like structure." No X-ray flux was detected by the ROSAT study. In the current Chandra study, the diffuse X-ray emission is marginally detected. The Chandra data for AM 1146−270 are previously unpublished.
AM 2055–425 (ESO 286–IG 019; IRAS 20551–4250): In the Arp-Madore Catalogue photograph of this system (Arp & Madore 1987), two tidal tails are visible, one more pronounced than the other. Only one nucleus is visible in broadband red images from HST (Kim et al. 2013) and in archival Spitzer 3.6 μm images, thus we classify this system as merger stage 5 (single nucleus with two strong tails). The optical surface brightness profile approximates an R1/4 law (Kim et al. 2013). AM 2055−425 has a high FIR luminosity (1011.72 L☉), placing it in the LIRG category. Although its K-band luminosity is also quite high (1011.27 L☉) compared to many of the other galaxies in our sample, its LFIR/LK ratio is one of the highest in our sample, thus it is undergoing a strong starburst, consistent with its high inferred SFR of 142 M☉ yr−1.
Based on XMM-Newton X-ray data, Franceschini et al. (2003) classify AM 2055−425 as an AGN. Using optical imaging Fabry–Perot Spectroscopy, Rich et al. (2015) find a composite post-starburst and LINER spectrum, but conclude that the distribution of line strengths is more consistent with extended shock excitation than with an AGN.
AM 2055−425 was included in the Grimes et al. (2005) Chandra survey of hot gas in nearby galaxies, who found a total thermal 0.3–2.0 keV luminosity of 2.8 × 1041 erg s−1 and an absorbing column of  . The large uncertainty on this absorbing column is consistent with our estimate from the UV/IR data (Table 3), while our total LX is about twice their value. The same Chandra data were used earlier by Huo et al. (2004) to study the hot gaseous halo, with consistent results.
AM 2312−591 (IRAS 23128−5919; ESO 148–IG 002): AM 2312−591 has two long tidal tails visible in the Arp & Madore (1987) Catalogue photograph. In archival HST optical and IR images, two disks are seen in very close contact. These disks appear to be just starting to merge, thus we classify this system as stage 3. AM 2312−591 is infrared luminous, with LFIR = 1011.71 L☉ and an SFR of 149 M☉ yr−1.
The diffuse X-ray-emitting gas in AM 2312−591 as seen by Chandra was previously studied by Grimes et al. (2005). They separated the diffuse emission into two annuli with a boundary at 3 42 and fit the spectra of the two parts separately. For the inner portion, they used a combination of the VMEKAL function and a power-law function, and fitted for the thermal temperature, the power-law index, and the absorbing column. For the VMEKAL component for the inner annulus, they found
  ,
,  , and LX(0.3–2.0 keV) = 1.7 × 1041 erg s−1. This absorbing column is about 2.4 times larger than our estimate for the entire system. For the outer annulus, their fit did not require a power-law component or internal absorption. For the outer annulus using just Galactic absorption, they obtained
  and LX(0.3–2.0 keV) = 1.7 × 1041 erg s−1. Combining the two annuli, for the thermal component they found LX(0.3–2.0 keV) = 3.4 × 1041 erg s−1. This is 40% less than our total internal-absorption-corrected 0.3–8 keV thermal luminosity, calculated using our UV-/IR-estimated NH = 3.3 × 1021 cm−2.
Arp 91 (NGC 5953/4): This is a pre-merger pair with a relatively small pair separation but without strong tidal tails, thus we classify it as merger stage 1. The more southern galaxy, NGC 5953, has a Seyfert 2 nucleus and a short tidal tail. The companion, NGC 5954, is a distorted spiral without tails. NGC 5954 is classified as SAB(rs)cd? pec in NED, while NGC 5953 is listed as SAa? pec. The Chandra data for Arp 91 have been exploited earlier in studies of X-ray point sources (Evans et al. 2010; Liu 2011; Smith et al. 2012), but the diffuse X-ray emission in Arp 91 has not previously been studied.
Arp 147 (IC 298): The western galaxy in Arp 147 is a collisional ring (Theys & Spiegel 1976; Madore et al. 2009). The likely intruder, a companion galaxy to the east, resembles a disk galaxy seen edge-on and is classified as S0? pec in NED. The companion is redder in the optical and near-infrared than the ring galaxy and has a K-band luminosity that is one-half that of the ring galaxy (Romano et al. 2008). At 3.6 μm, the companion is 40% more luminous than the ring galaxy (Rappaport et al. 2010). In HST images, a ring-like structure is seen in the companion as well (Rappaport et al. 2010). Given the lack of prominent tidal tails, we classify this system as a stage 1 major merger; however, the ring morphology indicates that they have already collided.
The Chandra data for Arp 147 have been previously used by Rappaport et al. (2010) to investigate the X-ray point sources. However, the diffuse X-ray emission in Arp 147 has not previously been studied. We find extended X-ray emission along the northeastern arc of the ring galaxy in Arp 147.
Arp 148 (VV 32): The western galaxy in Arp 148 is another collisional ring (Madore et al. 2009) with a disk companion seen edge-on. In the K band, the luminosity of the edge-on disk is 2.9 times that of the ring galaxy (Romano et al. 2008). Without strong tidal tails, we classify this as a stage 1 major merger. Together, this pair is classified as an LIRG, with LFIR > 1011 L☉ and an SFR of 16 M☉ yr−1. In archival Spitzer and GALEX images, the edge-on galaxy dominates the total light of the pair. The Chandra data for Arp 148 has not previously been published. The Chandra map reveals significant diffuse X-ray emission in the edge-on disk and a lower level in the ring of the ring galaxy.
Arp 155 (NGC 3656): This peculiar elliptical galaxy has been classified as a shell galaxy by Balcells (1997), who discovered two faint tidal tails. The interior follows an R1/4 law in both the optical and the near-infrared (Balcells & Stanford 1990; Balcells 1997; Rothberg & Joseph 2004). We classify it as a stage 7 merger remnant. It has a moderate SFR of 1.1 M☉ yr−1.
Arp 155 was included in a ROSAT survey of early-type galaxies conducted by O'Sullivan et al. (2001a), who found it was undetected with an upper limit of LX < 1040.61 erg s−1. The archival Chandra data for Arp 155 have previously been used for a study of the X-ray point sources in interacting galaxies (Smith et al. 2012); however, the diffuse X-ray emission from Arp 155 as seen by Chandra has not previously been studied.
Arp 157 (NGC 520): This system may be the result of a merger of one gas-rich disk galaxy and one gas-poor disk galaxy since one tail is gas poor (Hibbard & van Gorkom 1996). We classify it as a stage 4 merger, as it has two nuclei (Stanford & Balcells 1990) and a long tail (Stockton & Bertola 1980; Stanford 1990). Arp 157 was included in the Toomre (1977) merger sequence.
The Chandra X-ray map of Arp 157 was previously presented by Read (2005), who called it a half-merger. Using Galactic absorption and an absorbed MEKAL model, they obtained a gas temperature of  and an absorption-corrected 0.2–10 keV luminosity of 8.03 × 1039 erg s−1. This is about half our total (MEKAL + power law) 0.3–8 keV luminosity assuming Galactic absorption, but about 3.7 times our MEKAL luminosity.
Arp 160 (NGC 4194): In the Arp (1966) Atlas photograph, Arp 160 has a short plume-like structure extending to the north as well as fainter extended arcs or shells in the south. It has a long H i tail extending to the south opposite the optical plume (Manthey et al. 2008). It has a single nucleus and a near-infrared K-band light profile that approximately fits an R1/4 profile (Rothberg & Joseph 2004). Arp 160 has variously been classified as a minor merger, the product of a disk galaxy falling into a larger elliptical (Manthey et al. 2008; Weistrop et al. 2012), and as a major merger (Rothberg & Fischer 2010). In the current study, we assume that it is the result of an approximately equal-mass merger and classify it as merger stage 5.
The Chandra X-ray data for Arp 160 has been utilized several times before, both for the point sources (Lehmer et al. 2010; Mineo et al. 2012a; Smith et al. 2012; Luangtip et al. 2015) and the diffuse emission (Mineo et al. 2012b). Mineo et al. (2012b) found a diffuse MEKAL component with LX = 1040.39 erg s−1 (with Galactic absorption) or 1041.1 erg s−1 (correcting for internal absorption). These are consistent with our values. From fitting the X-ray spectrum, they derived a hot gas temperature of  and an absorbing column of
  . This column density is consistent with the value we obtained from the UV/IR data.
Arp 163 (NGC 4670): Arp 163 appears to be a late-stage merger remnant. In the Arp (1966) photograph, the inner region looks like a warped and distorted lens, while NED classifies it as SB0/a(s) pec?. The K-band radial profile of Arp 163 cannot be fit with either an R1/4 profile or an exponential disk (Chitre & Jog 2002), while at V the radial distribution appears to be a truncated exponential disk (Baggett et al. 1998). Only one nucleus is seen in the K band (Chitre & Jog 2002). A bar-like structure is detected in the near-infrared (Jog & Maybhate 2006). Although it is not an elliptical, we classify Arp 163 as a stage 7 merger because it has no tails. Arp 163 has a relatively low K-band luminosity of 109.93 L☉, and is listed as a Liner? in NED.
Arp 163 was included in studies of X-ray point sources as seen by Chandra (Swartz et al. 2009; Evans et al. 2010; Liu 2011; Smith et al. 2012); however, the diffuse X-ray emission has not previously been studied. In the current study, we do not detect a thermal component to the diffuse X-ray flux from Arp 163.
Arp 178: As catalogued by Arp (1966) and in NED, Arp 178 consists of three galaxies, NGC 5613/4/5. However, NGC 5613 has a redshift that is 4500 km/s higher than the other two, so may not be part of the same system. We exclude NGC 5613 from our analysis. NGC 5614 and 5615 have very similar redshifts. NGC 5615 is very faint compared to NGC 5614 (the g and 3.6 μm flux ratios are 1:100 and 1:21, according to NED and Brassington et al. 2015, respectively). A strong tail-like structure extends out from NGC 5614. NGC 5615 appears to be associated with the tail in some way. NGC 5614/5 may be an M51-like system, with the tail material pulled out from either NGC 5614 or NGC 5615. Alternatively, the tail may be tidal debris from NGC 5615 which is being cannibalized by NGC 5614. Based on the near-infrared light ratio of this pair, NGC 5614/5 would not be classified as a major merger, unless considerable stripping of NGC 5615 has occurred. Another possibility is that NGC 5614 is itself a merger remnant, and the tail is the result of a past merger rather than an interaction with NGC 5615. NGC 5614 is classified as SA(r)ab pec in NED and has a prominent bulge and a distorted disk. Archival optical HST images show only one nucleus in NGC 5614. Alternatively, it may be a stage 4 system (two nuclei) or a minor merger. In the Galaxy Zoo 2 study, 46% of the participants classified this system as a merger (Willett et al. 2013). We tentatively classify NGC 5614 as a stage 5 merger remnant (single nucleus, two long tails), although only one tail is visible. In the current study, we tentatively include NGC 5614/5 as a candidate major merger remnant; however, its exact stage and original stellar mass ratio are uncertain.
In the Chandra map, only a small amount of diffuse X-ray emission is seen, near the nucleus of NGC 5614. The Chandra data were previously unpublished.
Arp 186 (NGC 1614): Arp 186 is a classic stage 5 merger, with two long tidal tails (Arp 1966) but only one nucleus in near-infrared images (Bushouse & Stanford 1992; Forbes et al. 1992; Haan et al. 2011). It has a high LFIR of 1011.20 L☉ and a high SFR of 67 M☉ yr−1. In NED, Arp 186 is listed as an SB(s)c pec LIRG starburst. Its red light distribution fits an R1/4 law (Kim et al. 2013). Its K-band light also approximately fits the R1/4 law except in the inner regions (Rothberg & Joseph 2004). Although Arp 186 has sometimes been classified as a minor merger (e.g., König et al. 2016), we will follow Haan et al. (2011, 2013) and assume it is the relic of a major merger.
Based on its optical spectrum, Veilleux et al. (1995) and Yuan et al. (2010) classified Arp 186 as a composite LINER/H ii or starburst/AGN galaxy; alternatively, it is catalogued as an H ii region galaxy by Véron-Cetty & Véron (2006). Its near-infrared spectrum is consistent with that of a starburst, not an AGN (Väisänen et al. 2012). Its mid-infrared neon line ratios from Spitzer also do not indicate an AGN (Inami et al. 2013). However, higher spatial resolution mid-infrared spectra show a strong mid-infrared continuum but weak PAH features, maybe indicating an obscured AGN (Pereira-Santaella et al. 2015). Using low S/N archival data from the Advanced Satellite for Cosmology and Astrophysics (ASCA), Risaliti et al. (2000) detected hard X-ray emission from Arp 186, which they concluded was due to an obscured AGN; however, later analyses using XMM-Newton observations found that the hard X-ray radiation from Arp 186 could be accounted for from HMXBs associated with a starburst (Pereira-Santaella et al. 2011; Väisänen et al. 2012).
The Chandra data for Arp 186 were previously analyzed by Herrero-Illana et al. (2014) in conjunction with radio, optical, and IR observations. They provided a map of the diffuse X-ray emission and fit the nuclear spectrum. They concluded that an AGN was not required to account for either the nuclear X-ray emission or the data at other wavelengths. For the diffuse X-ray emission, assuming only Galactic absorption, they obtained their best fit using the VMEKAL model (without including an additional power-law component). Their best-fit temperature was kT = 1.7 ± 0.7 keV, giving a 0.5–2 keV luminosity of  . This is about four times higher than the luminosity of the MEKAL component in our MEKAL + power-law fit using Galactic absorption, assuming a fixed kT = 0.3 keV.
Arp 217 (NGC 3310): Arp 217 has been classified as a "ripple" system with strong star formation. Balick & Heckman (1981) suggested the ripples were caused by a smaller galaxy being torn apart by tidal forces. However, the system appears to have two H i tails (Kregel & Sancisi 2001), supporting the idea of a major merger. Wehner et al. (2006) conclude that it is the result of either a major merger or multiple mergers with smaller companions. For the current study, we assume it is a major merger and classify it as stage 6.
The Chandra data for Arp 217 was previously analyzed by Lehmer et al. (2015), jointly with NuSTAR X-ray data. They found diffuse emission from hot gas in Arp 217, with a low kT ∼ 0.2–0.3 keV.
Arp 220: Arp 220 is the prototype of a ULIRG (Soifer et al. 1984). In the Arp (1966) Atlas photograph, tidal debris is visible around a compact core. In near-infrared images, two nuclei are resolved (Graham et al. 1990; Scoville et al. 1998), while the galaxy as a whole obeys the R1/4 law (Wright et al. 1990). It has been suggested that Arp 220 might be the product of the merger of four or more galaxies (Taniguchi et al. 2012); however, in the current study, we assume it is a single stage 4 major merger. Although a powerful starburst is clearly ongoing in Arp 220 (Sturm et al. 1996; Genzel et al. 1998), both near-infrared (Depoy et al. 1987) and optical (Sargsyan et al. 2011) spectra reveal broad hydrogen lines, indicating the presence of an obscured AGN as well. However, based on a joint analysis of XMM-Newton and NuSTAR data, Teng et al. (2015) concluded that the X-ray spectrum of Arp 220 could be accounted for by a starburst alone, although they could not rule out a highly obscured AGN.
The large-scale diffuse X-ray morphology of Arp 220 as seen by Chandra has been discussed in detail by McDowell et al. (2003), who note the presence of extended emission outside of the optical galaxy in "plumes" and "lobes." They conclude that at least some of this light is associated with a starburst-driven superwind. These features have a soft X-ray spectrum, with temperatures corresponding to kT ∼ 0.2–1 keV. Excluding the inner 3'' radius core, using only Galactic absorption at our distance, they find a total 0.3–10 keV diffuse X-ray luminosity of 1.1 × 1041 erg s−1. This is about 60% higher than our Galactic-absorption-only value.
The Chandra data for Arp 220 was also studied by Huo et al. (2004), who analyzed the inner halo separately from the outer halo, dividing at a radius of 5 kpc (<12''). For the outer portion, using Galactic absorption only and fitting to a pure MEKAL function, they found  and
and  . For the inner regime, they fit to a MEKAL function plus two power laws as well as the absorbing column. They found
  ,
,  , and
, and  . Their best-fit absorbing column is only 60% higher than the Galactic value, and about one-eighth our best-fit and UV-/IR-determined values. Their total MEKAL luminosity is about 2.6 times our Galactic-absorption-only value, but about one-fourth our value corrected for internal absorption.
A third independent analysis of the Chandra Arp 220 data was done by Grimes et al. (2005), who also studied the inner and outer emission separately. Their inner region was elliptical in shape, with major and minor axes of 772 (3.2 kpc) and 623 (2.1 kpc), respectively. The X-ray spectrum of the outer region was successfully fit to a VMEKAL model with Galactic absorption, giving a temperature of  and a 0.3–2 keV luminosity of 7.3 × 1040 erg s−1. The inner region was fit to a VMEKAL+power-law model, fitting for both temperature and absorbing column. For the inner region, they found
  ,
,  , and a thermal 0.3–2 keV LX = 1.6 × 1040 erg s−1. Their best-fit absorbing column for the inner region agrees well with our estimate from the UV/IR ratio, while their total thermal luminosity is about one-half our value.
Arp 222 (NGC 7727): Arp 222 is classified as a late-stage major merger remnant by Georgakakis et al. (2000). In optical images, two extended tidal tails and some inner loops are visible (Arp 1966; Sandage & Bedke 1994). The K-band light fits an R1/4 profile (Chitre & Jog 2002; Rothberg & Joseph 2004). We classify it as a stage 6 merger. Arp 222 has a very low FIR luminosity (108.71 L☉) relative to its K-band luminosity (1011.12 L☉), thus it is now a relatively quiescent galaxy. However, high-resolution optical and IR images revealed the presence of intermediate-age (1–2 Gyr) globular clusters in Arp 222 (Trancho et al. 2014), suggesting a starburst in the past.
Arp 222 was included in the Brassington et al. (2007) Chandra survey of major mergers, as the second-to-last in their merger sequence. Including only Galactic absorption, they measured a diffuse X-ray luminosity of 6.5 × 1039 erg s−1, similar to our value. Their best-fit gas temperature is  .
.
Arp 226 (NGC 7252): Arp 226 is the classic post-merger "Atoms for Peace" galaxy with two prominent tidal tails (Arp 1966). In the K band, it fits the R1/4 law with a single nucleus (Stanford & Bushouse 1991; Rothberg & Joseph 2004). Its tails are longer and more prominent than those of Arp 222, thus we classify it as stage 5 rather than stage 6. Six star clusters in Arp 226 have been age-dated to 400–600 Myr old (Schweizer & Seitzer 1998), consistent with its location in the "post-starburst" region of Figure 16 (FUV – NUV versus NUV − [3.6]).
The Chandra data for Arp 226 were included in the Brassington et al. (2007) survey (see Nolan et al. 2004). Brassington et al. (2007) report an X-ray luminosity from hot gas of 2.4 × 1040 erg s−1, consistent with our value using Galactic absorption. From ASCA X-ray spectra, Awaki et al. (2002) derive a soft (0.5–4 keV) X-ray luminosity for Arp 226 of 2 × 1040 erg s−1, also consistent with our Chandra results for Galactic absorption.
Arp 233 (Mrk 33; Haro 2; UGC 5720): The morphological type and evolutionary state of the peculiar galaxy Arp 233 are uncertain. In the Arp (1966) photograph, a compact central core is surrounded by wispy nebulosity. In NED, Arp 233 is listed as Im pec, and it is classified as a blue compact galaxy by Davidge (1989). However, it was included in a study of E/S0 galaxies with dust lanes by Finkelman et al. (2010), and Loose & Thuan (1986) concluded that it is a low-mass elliptical galaxy with a young stellar population. Buta et al. (2015) classified Arp 233 as an E3-4 pec galaxy based on Spitzer images. According to Loose & Thuan (1986), its optical radial profile is better fit by an R1/4 law than by an exponential disk, but the best-fit model is in between these two cases.
Arp 233 clearly has ongoing star formation, with blue optical colors (Huchra 1977; Loose & Thuan 1986) and higher Hα equivalent widths than other candidate dust-lane E/S0 galaxies (Finkelman et al. 2010). Arp 233 is likely a low-mass system, with a somewhat subsolar metallicity (≥1/3 solar; Zhao et al. 2010) and a moderately low LK (109.99 L☉). In the current work, we consider it a very late stage (stage 7) remnant, perhaps the relic of the merger of two low-mass galaxies. Its presence in our sample helps to anchor the low-mass end of the survey.
The Chandra data for Arp 233 were previously used in surveys of X-ray point sources in nearby galaxies (Evans et al. 2010; Smith et al. 2012). Arp 233 was also included in the Mineo et al. (2012b) Chandra study of the diffuse X-ray emission from star-forming galaxies, who measured a MEKAL LX similar to our Galactic-absorption-corrected value. They found a best-fit gas temperature of  .
.
Arp 235 (NGC 14; VV 80): In the Arp (1966) photograph, Arp 235 is a peculiar elongated object surrounded by nebulosity and a faint outer oval. Arp 235 is classified as an IB(s)m peculiar galaxy in NED, as Im based on SDSS images (Ann et al. 2015), and as IAB(s:)m by Buta et al. (2015) based on Spitzer images. In Galaxy Zoo, 36% ranked Arp 235 as an elliptical, 33% as spiral/disk, 15% as a merger, and 15% as unknown (Lintott et al. 2011). Arkhipova et al. (1978) suggested that it could be a former double galaxy that has undergone a merger. We classify Arp 235 as a possible stage 7 merger remnant. Like Arp 233, Arp 235 has a low LK (109.43 L☉). The Chandra point source detections for Arp 235 have previously been studied by Swartz et al. (2009), Liu (2011), and Smith et al. (2012). No diffuse X-ray emission is detected in the Chandra data for Arp 235.
Arp 236 (IC 1623; VV 114): The Arp (1966) image of Arp 236 shows three galaxies: IC 1623, a disturbed pair of interacting spirals, and IC 1622, a third galaxy with a similar redshift and brightness 3' away to the southeast. In the current study, we only include the two galaxies in the IC 1623 pair in our analysis. We classify this pair as a stage 1 merger, since although it is disturbed with a distorted spiral arm, this feature is not prominent. This system has a high FIR luminosity and a high SFR (1011.39 L☉ and 57 M☉ yr−1, respectively).
The Chandra observations of Arp 236 were previously discussed by Grimes et al. (2006) along with XMM-Newton and UV spectroscopy. Their fit to the X-ray spectrum produced an average absorbing column of 6 ± 3 × 1021 cm−2, consistent with our best-fit value and slightly higher than our estimate from the UV/IR data. They derived a temperature of 0.62 ± 0.03 keV for the gas and an absorption-corrected 0.3–2 keV luminosity from the hot gas of 2.0 × 1041 erg s−1. This luminosity agrees well with our estimate using the UV/IR-derived internal absorption, and is about one-fourth our best-fit value.
Arp 240 (NGC 5257/8): Arp 240 is a widely separated pre-merger pair with two tidal tails and a connecting bridge (Arp 1966). We categorize it as a stage 2 merger. Both galaxies are independently LIRGs. The total SFR for the pair is high, 40 M☉ yr−1. The diffuse X-ray emission in Arp 240 was previously studied by Smith et al. (2014), in conjunction with data at other wavelengths. Diffuse X-ray emission is visible along prominent arcs of star formation at the base of the tidal tails. Analytical models suggest that the star formation in these regions has been triggered by intersecting caustics along the base of the tails, where a caustic is a narrow pile-up zone produced by orbit crowding during a galaxy interaction (Struck & Smith 2012).
Arp 242 (NGC 4676): Arp 242 is the famous double-tailed "Mice" pre-merger interacting galaxy pair. We list it as a stage 2 merger. The pair has a moderately high LFIR of 1010.65 L☉. The diffuse X-ray emission in Arp 242 as seen by Chandra was previously studied by Read (2003). Correcting only for Galactic absorption, they find a total 0.3–10 keV thermal luminosity of 1.9 × 1040 erg s−1, in agreement with our result. Read (2003) finds gas temperatures of  and
and  for the northern and southern galaxies, respectively. The Read (2003) results for Arp 242 were included in the Brassington et al. (2007) Chandra survey of merging galaxies.
Arp 243 (NGC 2623): Arp 243 is a single galaxy with two prominent tidal tails (Arp 1966) and a high FIR luminosity (1011.34 L☉). In HST near-infrared images, only one nucleus is visible (Haan et al. 2011), thus we list it as merger stage 5. The Chandra data for Arp 243 have previously been utilized in surveys of X-ray point sources (Evans et al. 2010; Smith et al. 2012). In the current Chandra study, we do not detect any thermal X-ray emission from Arp 243. Using ROSAT PSPC data, Read & Ponman (1998) claim a detection of soft (kT = 0.20 keV) diffuse X-ray emission with LX = 4 × 1040 erg s−1 to the west of Arp 243, outside of the optical extent of the galaxy. They suggested that this may be a large outflow lobe. However, this is a low S/N detection, and emission is only seen on one side of the galaxy. Furthermore, they do not see this feature with the ROSAT High Resolution Imager (HRI). It is also not seen in the Chandra data. Based on our upper limit to the Chandra flux in the main portion of the galaxy (Table 2), we would have expected to obtain a marginal detection (∼3σ–5σ) of this lobe in our data.
Arp 244 (NGC 4038/9): The stage 3 system Arp 244 (the Antennae) is a pair of disk galaxies in close contact and two long tidal tails. The LFIR of Arp 244 is 1010.61 L☉, very similar to that of Arp 242. The Chandra diffuse X-ray map of Arp 244 has been previously discussed by several groups (Fabbiano et al. 2001, 2003; Metz et al. 2004; Baldi et al. 2006a, 2006b; Smith et al. 2014). These data were also included in the Brassington et al. (2007) study. In the spatially resolved study of Baldi et al. (2006a), the diffuse X-ray spectrum for more than a dozen different regions were analyzed. The best-fit temperatures for these regions varied from kT = 0.20 keV to 0.66 keV, with most around 0.62 keV. Their derived columns varied from <0.12 × 1020 cm−2 to 24.6 × 1020 cm−2. For comparison, from the UV/IR data, we estimate an average NH = 15.4 × 1020 cm−2, while our best-fit value for the MEKAL component is 2.7 times larger. Summing over all these regions and using our distance, the total hot gas LX for Arp 244 from the Baldi et al. (2006b) analysis is 2.7 × 1040 erg s−1, about half our best-fit estimate. Our determination using the UV/IR estimate of the absorption is 7.1 × 1040 erg s−1, 2.6 times larger than the Baldi et al. (2006b) result.
Arp 256: Arp 256 is another stage 2 system, consisting of a pair of widely separated spiral galaxies with tidal features (Arp 1966). Together, the pair is classified as an LIRG; however, about 90% of the FIR light comes from the southern galaxy (Howell et al. 2010). In an earlier study (Smith et al. 2014), we used the Chandra data for Arp 256 to measure the diffuse X-ray flux from a luminous knot of star formation at the base of the northern tail of the northern galaxy of Arp 256. We found that the X-ray light from this region is resolved, with LX = 3.2 × 1040 erg s−1 using NH = 2.4 × 1021 cm−2. Ricci et al. (2017) also analyzed the archival Chandra data for both galaxies of Arp 256 and concluded that the emission can be accounted for a starburst, without the need for an AGN. Neither galaxy was detected by NuSTAR (Ricci et al. 2017). In the current study, we extract the total diffuse X-ray spectrum for the combined pair and derive a luminosity four times larger assuming a similar absorbing column. Inspection of the Chandra map shows that the majority of extended emission in Arp 256 is arising from the southern galaxy.
Arp 259 (NGC 1741): In the Arp (1966) Atlas photograph, Arp 259 has a peculiar appearance, consisting of at least two edge-on disks surrounded by loops and tidal debris. The nature and evolutionary state of Arp 259 has been a matter of debate. Hickson (1982) classify this system as a compact group (HCG 31) and identify four galaxies. Rubin et al. (1990) concur, identifying two overlapping strongly interacting edge-on disk galaxies (A and C), another edge-on galaxy (B), and a fainter galaxy (D), as well as other more distant galaxies. In contrast, Richer et al. (2003) conclude that A and C are a single tidally distorted galaxy, and some of the more distant objects are tidal debris rather than pre-existing galaxies. They find that Galaxy B is kinematically distinct from A+C and is counterrotating relative to it, thus they conclude that another more distant galaxy (G) is responsible for the tidal features of A+C. In an opposing view, Amram et al. (2007) and Alfaro-Cuello et al. (2015) conclude that A and C are two gas-rich interacting Magellanic-type irregular galaxies in the process of merging. In the current study, we will treat Arp 259 as a peculiar major merger and classify it as stage 2, although this classification is very uncertain. The total K-band luminosity of Arp 259 is moderately low (1010.20 L☉), but there are half a dozen other systems in our sample with lower LK than Arp 259. The SFR is also a moderate value, 6.9 M☉ yr−1.
The Chandra X-ray data for Arp 259 were included in earlier studies of X-ray point sources (Smith et al. 2012; Tzanavaris et al. 2014). The hot X-ray-emitting gas in and around Arp 259 was previously investigated by Fuse & Broming (2013) and Desjardins et al. (2013). Fuse & Broming (2013) found a total 0.3–6.0 keV MEKAL LX of 1041.6 erg s−1 using only Galactic absorption. In contrast, Desjardins et al. (2013) measured a factor of 10 times lower LX of  , also with Galactic absorption. Desjardins et al. (2013) also fit for temperature and find
  . Our extraction yields a result reasonably consistent with that of Desjardins et al. (2013) and much lower than that quoted by Fuse & Broming (2013). Inspection of the Chandra map shows that almost all of the diffuse X-ray light lies within A+C.
Arp 261 (VV 140): The Arp (1966) picture of Arp 261 shows a close pair of edge-on disk-like galaxies surrounded by tidal debris, and a smaller irregular galaxy (GALEXMSC J144935.10–100444.6) about five disk radii (5') away to the north. In the current study, we only include the two main galaxies in our analysis. We class it as a stage 1 merger, since the tidal features are not long or prominent. Arp 261 has a low LK = 109.66 L☉ and a low SFR of 0.7 M☉ yr−1. The star cluster population in Arp 261 has been investigated by B. Peterson et al. (2017, in preparation), who found a peak in the age distribution at ∼15 Myr. The Chandra data for Arp 261 were included in the point source study of Evans et al. (2010); however, the diffuse emission has not previously been studied.
Arp 263 (NGC 3239): Arp 263 is the most nearby of the galaxies in our sample, at only 9.8 Mpc. It also has the lowest LK in our sample. It is classified as an IB(s)m pec in NED. In optical images it has a knotty appearance, with two distorted tail-like structures (Arp 1966). Based on its morphology and kinematics, Krienke & Hodge (1990) suggested it is a merger remnant. Taylor-Mager et al. (2007) also classify it as a merger remnant based on UV/optical images. We list it as a stage 5 merger assuming only a single nucleus, although this is uncertain from the archival Spitzer 3.6 μm image because of the presence of luminous star-forming knots.
The Chandra data for Arp 263 were previously searched for X-ray point sources (Swartz et al. 2009, 2011; Liu 2011; Smith et al. 2012); however, the diffuse X-ray emission has not previously been studied. Although we detect low-level diffuse emission, we do not detect a MEKAL component in the spectrum of the diffuse light.
Arp 270 (NGC 3395/6): The two galaxies in the Arp 270 pair are relatively close together, but only short tails are visible in optical light (Arp 1966) and in the UV (Smith et al. 2010). However, in 21 cm H i maps, a long gaseous tail is visible to the southeast (Clemens et al. 1999). In the current study, we classify it as a stage 1 merger since the optical tails are short. The Chandra data for Arp 270 were included in the X-ray point source study of Smith et al. (2012), while the diffuse X-ray light was analyzed by Brassington et al. (2005). They measured a total absorption-corrected MEKAL LX of 9.5 ± 0.3 × 1039 erg s−1, in agreement with our results. Their best-fit NH was  for the northeastern galaxy NGC 3395 and
  for the southwestern galaxy NGC 3396, in reasonable agreement with our UV/IR-derived absorption for the system. Brassington et al. (2005) derived gas temperatures of
  and
and  for NGC 3395 and NGC 3396, respectively.
Arp 283 (NGC 2798/9): This pre-merger interacting pair only has short tails in the Arp (1966) Atlas photograph, thus we classify it as a stage 1 merger. A third galaxy at a similar redshift, UGC 4904, lies 5' to the south. Arp 283 was previously included in the Chandra point source surveys of Liu (2011) and Smith et al. (2012). The diffuse X-ray emission of this group as seen by Chandra was previously investigated by Desjardins et al. (2014). For the group, they obtained an upper limit for the thermal component of LX < 5 × 1039 erg s−1 assuming Galactic absorption. This is consistent with our non-detection of the MEKAL component for Arp 283 assuming Galactic absorption. Including internal absorption, however, we detect a MEKAL component (Tables 4 and 5). Inspection of the Chandra image shows diffuse emission in the disk of NGC 2798, the western galaxy in the Arp 283 pair.
Arp 284 (NGC 7714/5): The more western galaxy in Arp 284, NGC 7715, has a partial ring and a long tidal tail stretching to the west; the companion NGC 7714 is an edge-on disk connected to NGC 7714 by a bridge (Arp 1966). Numerical simulations suggest that the ring was produced by an off-center collision between the two galaxies (Smith & Wallin 1992; Struck & Smith 2003). Because of the tidal features, we list Arp 284 as a stage 2 merger. The nucleus of NGC 7714 is the prototypical nuclear starburst (Weedman et al. 1981), while NGC 7715 is classified as a post-starburst (Bernlöhr 1993).
A complete analysis of the Chandra data for Arp 284 was conducted by Smith et al. (2005). In the interior of NGC 7714, they noted diffuse hot gas outside of the compact nucleus. They fit the spectrum of this hot gas with a thermal (MEKAL) component and a hard (power-law) component. For a 95 radius region near the center of NGC 7714 but excluding the nucleus, they measured a total diffuse MEKAL 0.3–8 keV LX of 1.1 × 1040 erg s−1. They found a best-fit  and an absorbing column of
  . This absorption is consistent with our estimate from the UV/IR ratio as well as our best-fit value. Farther out in the disk, Smith et al. (2005) detected a total of 1.1 × 1040 erg s−1 of resolved emission associated with four extra-nuclear H ii regions. In the current study, our best-fit absorption-corrected MEKAL luminosity for the entire system is about three times the sum of the fluxes calculated by Smith et al. (2005).
Arp 293 (NGC 6285/6): Arp 293 consists of two widely separated disk galaxies with short tails (Arp 1966). We list this system as a stage 2 merger. Together, their FIR luminosity is 1011.1 L☉. Of this, about 80% comes from the southeastern galaxy NGC 6286 (Howell et al. 2010). NGC 6286 is a peculiar edge-on disk galaxy, which was classified as a LINER by Veilleux et al. (1995) based on optical spectra, and as a composite AGN/starburst by Yuan et al. (2010). Based on infrared spectra, Dixon & Joseph (2011) conclude that less than half of the infrared luminosity of NGC 6286 is powered by an AGN. Ricci et al. (2016) analyzed the archival Chandra data for Arp 293 jointly with XMM-Newton and NuSTAR data and concluded that NGC 6286 contains a buried AGN. This AGN, however, has a low intrinsic luminosity and contributes less than 1% of the bolometric luminosity of the system (Ricci et al. 2016). The companion nucleus NGC 6285 was undetected by NuSTAR (Ricci et al. 2016). In Figure 21, we display the diffuse X-ray spectrum for Arp 293, along with the best-fit model.
Arp 295: Arp 295 is a very widely separated pair of spirals connected by a long bridge (Arp 1966). The morphology of this pair was reproduced in the Toomre & Toomre (1972) paper. Arp 295 was included in the Hibbard & van Gorkom (1996) survey of H i in tidal tails as well as in Spitzer and GALEX imaging studies of nearby Arp systems (Smith et al. 2007, 2010). The southwestern galaxy in the pair, Arp 295A, is listed as a possible LINER in NED, while the second galaxy, Arp 295B, is listed as having a H ii region optical spectrum (Corbett et al. 2003). The Chandra data for Arp 295 has not yet been published. Our best fit for the X-ray spectrum indicates a highly extincted power-law component, perhaps due to an obscured AGN (see Table 5 and Figure 21).
Arp 299 (NGC 3690): Arp 299 is a mid-merger system with two disks in very close contact (Arp 1966), thus we classify it as a stage 3 merger. Arp 299 is an LIRG with a very high implied SFR of 132 M☉ yr−1.
High-energy X-ray observations with the NuStar satellite reveal a highly absorbed hard source, likely an AGN, associated with the western nucleus Arp 299-B (Ptak et al. 2015). The Chandra data for Arp 299 were previously published by Ptak et al. (2015) and Anastasopoulou et al. (2016). After removal of the point sources, Anastasopoulou et al. (2016) fit the spectrum to an absorbed power-law plus thermal spectrum. After correction for Galactic absorption, they found that the diffuse emission has a total 0.5–8 keV luminosity of 2.06 ± 0.02 × 1041 erg s−1, and the total 0.1–2.0 keV luminosity is 1.70 ± 0.02 × 1041 erg s−1. They quote a measured 0.3–10 keV luminosity for the diffuse thermal component of 1.89 × 1041 erg s−1. This is about three times larger than our Galactic-absorption-corrected MEKAL luminosity and 60% of our value after correction for internal absorption. Their best-fit temperature for the thermal component is kT = 0.72 ± 0.03 keV. Inspection of the Chandra map shows considerable diffuse emission outside of the nuclear regions; however, this diffuse emission is contained within the μB = 25.0 mag arcsec−2 isophotes as seen in the SDSS g image.
IRAS 17208–0014 (IRAS F17207−0014): IRAS 17208−0014 is a late-stage merger remnant with short tails visible in the SDSS images. We classify it as a stage 6 merger since only a single nucleus is visible in HST near-infrared images (Haan et al. 2011); however, we note that adaptive optics observations with the Keck telescope may separate the two nuclei (Medling et al. 2014). It has an R1/4 profile in the K band (Zenner & Lenzen 1993). IRAS 17208−0014 is a ULIRG, with LFIR = 1012.19 L☉ and SFR = 149 M☉ yr−1. Although IRAS 17208−0014 has sometimes been listed as an LINER (Rupke et al. 2005), its optical spectrum has also been classified as that of a H ii region galaxy (Veilleux et al. 1995; Yuan et al. 2010). Its mid-infrared spectrum is consistent with that of a starburst (Farrah et al. 2007; Stierwalt et al. 2013).
The Chandra data for IRAS 17208−0014 were previously analyzed by Iwasawa et al. (2011), who found no evidence for an obscured AGN in this galaxy based on the X-ray data. From the X-ray spectrum, they derived an absorbing column of 5.2 ± 1.0 × 1021 cm−2, consistent with our estimate of 7.2 × 1021 cm−2 based on the UV/IR data. They obtained a thermal temperature of  and noted that the X-ray emission extends out to a radius of 11''. After correction for Galactic absorption and scaling to our distance, they found a soft X-ray luminosity (0.5–2 keV) of 9.9 × 1040 erg s−1 and a hard (2–10 keV) luminosity of 2.2 × 1041 erg s−1. Together, these are 60% larger than our total 0.3–8 keV luminosity assuming only Galactic absorption.
Mrk 231 (IRAS 12540+5708): The SDSS images of Mrk 231 show two moderate-length low surface brightness (μB ∼ 25 mag arcsec−2) tails and only a single nucleus, thus we classify it as a stage 5 merger. Mrk 231 has the highest LK in our sample (1012.36 L☉) and the second highest LFIR (1012.13 L☉). Mrk 231 has been classified as a Seyfert 1 galaxy and as a low-ionization broad absorption line QSO (e.g., Boroson & Meyers 1992). It is included in the Healey et al. (2007) catalogue of flat-spectrum radio sources. Millimeter (Feruglio et al. 2010) and FIR (Sturm et al. 2011) spectroscopy shows evidence for fast (∼1000 km s−1) molecular outflows from Mrk 231, possibly driven by AGN feedback. Optical imaging spectroscopy shows that neutral gas winds extend out to at least 3 kpc from the nucleus (Rupke & Veilleux 2011). Outside of the nucleus, a star-forming disk has been observed (Taylor et al. 1999; Davies et al. 2004). This disk is estimated to contribute 25%–40% of the bolometric luminosity of the galaxy (Davies et al. 2004). Using multiwavelength observations and population synthesis, Davies et al. (2004) estimate an SFR of ∼125 M☉ yr−1. This is about one-fourth of the SFR we get using the standard UV+IR relation (Table 4). This suggests that the powerful AGN in this system may contribute significantly to powering the UV and IR measurements, causing our SFR to be overestimated. Veilleux et al. (2009) and Nardini et al. (2010) independently estimated the fraction of the bolometric luminosity powered by star formation to be 29% and 66%, respectively.
Gallagher et al. (2002) analyzed the first 40 ks exposure of the Mrk 231 Chandra data and noted that the nucleus was strongly variable. They found that diffuse soft X-ray light is visible out ∼25'' from the nucleus. Assuming solar metallicity, a reasonable fit to its spectrum could be made by either two Raymond–Smith plasma models or by one Raymond–Smith component and a power-law component. In the former case, the best-fit temperatures were  and
and  , while in the latter case the best-fit temperature was
  . Using Galactic absorption, they measured the diffuse 0.5–2 keV luminosity within a 25'' radius to be 1.2 × 1041 erg s−1. This is in reasonable agreement with our determination.
An early subset (25.3 ksec) of the Chandra data for Mrk 231 was analyzed by Grimes et al. (2005). For the diffuse X-ray emission outside of a 334 radius assuming Galactic absorption, they obtained a temperature of  and a thermal 0.3–2 keV luminosity of 2.6 × 1041 erg s−1. For the diffuse emission inside this radius, they found a thermal LX of 2.4 × 1041 erg s−1,
  , and
, and  . This absorbing column agrees with our estimate for the full system using the UV/IR ratio, but is about 10 times larger than our best-fit value for the total diffuse X-ray spectrum. Their total thermal luminosity agrees with our best-fit value.
The full Chandra data set for Mrk 231 was analyzed by Veilleux et al. (2014). They divided the extended light into four annuli with inner radius of 1 kpc and outer edge of 40 kpc, and fit the spectrum of each annuli to various functions, including a MEKAL plus power law. Keeping the temperature fixed to kT = 0.67 keV and adding a second fixed temperature MEKAL component of kT = 0.27 keV to the outer two annuli and only including Galactic absorption, their total MEKAL luminosity was 2.4 × 1041 erg s−1. This is about a factor of two larger than our value assuming Galactic absorption. Veilleux et al. (2014) find that a shock model fits the X-ray data equally well. A joint Chandra/NuSTAR X-ray analysis by Teng et al. (2014) found an intrinsic MEKAL 0.5–30 keV luminosity of 2.4 × 1041 erg s−1, with two temperature components at 0.26 keV and 0.87 keV.
Mrk 273 (UGC 08696; IRAS 13428+5608): In the SDSS optical images of Mrk 273, a long straight high surface brightness tail extends 1' to the south, with a weaker plume extending to the northeast. In near-infrared images, at least two nuclei are visible (Majewski et al. 1993; Knapen et al. 1997; Scoville et al. 2000), thus we classify it as a stage 4 merger. Mrk 273 has a high LFIR of 1011.90 L☉ but a less extreme LK of 1011.44 L☉, and a high inferred SFR of 130 M☉ yr−1. At least one of the nuclei of Mrk 273 is an AGN, based on its optical spectral classification as a Seyfert 2 system (Khachikian & Weedman 1974; Koski 1978). Mrk 273 was detected in the mid-infrared [Ne V] 14.32 μm line (Farrah et al. 2007), confirming the presence of an AGN.
The Chandra data for Mrk 273 were previously analyzed by several groups. Xia et al. (2002) identified a compact hard X-ray point source coincident with the northern nucleus as seen in near-IR maps and concluded that its X-ray spectrum is consistent with that of an obscured AGN. The existence of an obscured AGN in Mrk 273 was further confirmed by Teng et al. (2015) using Chandra data in conjunction with NuSTAR observations, while Iwasawa et al. (2017) used Chandra + NuSTAR data to argue that both nuclei are AGNs. Outside of the nucleus, Xia et al. (2002) found bright soft X-ray emission extending to about 10'' (7.8 kpc) from the nucleus. Beyond this, faint "halo" emission is seen, spanning 52'' × 33'' (108 kpc × 68 kpc; Xia et al. 2002). Most of this "halo" emission lies near the southern tidal tail and within the μB = 25.0 mag arcsec−2 contours indicated by the SDSS g image, thus it is included in our flux measurements. Outside of the μB = 25.0 mag arcsec−2 isophote, some faint emission is visible to the east of the southern tail; however, this does not contribute much to the total light of the system. Fitting a MEKAL + power-law + 6.7 keV line model to the diffuse X-ray emission within 10'', for the MEKAL component Xia et al. (2002) found a best-fit temperature of  and an absorbing column of
  , giving an absorption-corrected 0.1–10 keV luminosity of
  . For this same ≤10'' radius region but only correcting for Galactic absorption, Iwasawa et al. (2011) found a thermal temperature of kT = 0.58 ± 0.04 keV and a soft X-ray (0.5–2 keV) luminosity of 5.6 × 1040 erg s−1 for this emission. For the more extended "halo" gas, Xia et al. (2002) found
  ,
,  , and 1.9 × 1041 erg s−1. Another independent analysis of the Chandra data was done by Grimes et al. (2005), who fit the spectrum of the diffuse X-ray light outside of a central 475 × 374 region and found a thermal component with
  and a 0.3–2.0 keV luminosity (only including Galactic absorption) of 3.4 × 1041 erg s−1. For the diffuse gas at smaller radii, using a VMEKAL+power-law model, Grimes et al. (2005) found
  , a MEKAL luminosity of 1.5 × 1041 erg s−1, and column
  . The Grimes et al. (2005) absorbing column for the inner region is about 100 times larger than what we estimate from the UV/IR data and 6000 times our best-fit value for the whole system. Our estimate of the total absorbing column from the global UV/IR fluxes is 2.7σ larger than the Xia et al. (2002) best-fit value from the X-ray spectrum of the inner diffuse emission, but our best-fit value of NH(MEKAL) is lower, consistent with the Galactic value and with the Xia et al. (2002) fit for the extended halo.
Our derived X-ray luminosity for the hot gas is about twice that obtained by Iwasawa et al. (2011), only including Galactic absorption in both cases. This may be because we included the halo gas as well, while they only included the bright inner region. In contrast, our estimate with only Galactic absorption is about a third that of Grimes et al. (2005); however, they did not include a power-law component. Our best-fit absorption-corrected MEKAL 0.3–8 keV luminosity is about one-fourth the Xia et al. (2002) total MEKAL luminosity (both inner and halo) of 4.5 × 1041 erg s−1.
NGC 34 (NGC 17; VV 850; IRAS 00085–1223; Mrk 938): NGC 34 is a mid-merger system with a long straight tail extending to the northeast and a second fainter tail to the southwest (Mazzarella & Boroson 1993; Schweizer & Seitzer 2007). Only one nucleus is seen in the near-infrared (Haan et al. 2011), thus we classify it as a stage 5 merger. NGC 34 has high FIR and K-band luminosities of 1011.18 L☉ and 1011.14 L☉, respectively. NGC 34 has been variously listed as a Seyfert 2 galaxy (Dahari 1985; Veilleux et al. 1995; Véron-Cetty & Véron 2006) or an LINER (Osterbrock & Dahari 1983). According to Esquej et al. (2012), the FIR light is mainly powered by a starburst. However, a joint analysis of the Chandra, NuSTAR, and XMM-Newton data for NGC 34 indicates a highly obscured AGN (Ricci et al. 2017).
NGC 1700: NGC 1700 is an elliptical-like galaxy (classified as E4 in NED) with fine structure in its outer reaches variously classified as tidal tails (Brown et al. 2000), shells (Forbes & Thomson 1992), or an outer ring (Franx et al. 1989). Based on its morphology, Schweizer & Seitzer (1992) and Brown et al. (2000) conclude that NGC 1700 is the result of a major merger (i.e., two spirals). However, the existence of a counterrotating core with a younger stellar population led Statler et al. (1996) and Kleineberg et al. (2011) to conclude that NGC 1700 is the result of the merger of three or more systems: a minor merger that produced the counterrotating core and a gas-rich major merger, producing the large-scale structure. In the current study, we assume NGC 1700 is the product of a major merger and classify it as a stage 7 system.
Based on optical BVI imaging, Brown et al. (2000) suggest an age for the younger stellar population in NGC 1700 of about 3 Gyr. Using HST and Gemini optical and IR, Trancho et al. (2014) concluded that NGC 1700 hosts globular clusters with intermediate ages (1–2 Gyr). The optical radial profile provides evidence for a stellar disk in the interior (Franx et al. 1989; Goudfrooij et al. 1994).
The Chandra data for NGC 1700 used in the current study were previously utilized by Statler & McNamara (2002) to study the extended X-ray emission in NGC 1700. They find a very flattened distribution and conclude that the hot gas is in a rotating disk. They suggest that this gas may have been acquired during a merger. Their total 0.3–7 keV luminosity of 8.37 ± 0.32 × 1040 erg s−1 (obtained only using Galactic absorption) agrees well with our Galactic-absorption-only value.
NGC 2207/IC 2163: The two disks of this pre-merger pair are in contact (Struck et al. 2005), thus we classify it as a stage 3 system, although strong tidal tails are not visible in optical images. The western galaxy in the pair, NGC 2207, hosts a high SFR (1.7 M☉ yr−1) IR-luminous knot of star formation in its outer disk near the base of a short tail-like structure (Elmegreen et al. 2006; Smith et al. 2014). This source contributes about 12% of the total 24 μm flux of the galaxy (Elmegreen et al. 2006).
The Chandra data for this system were previously analyzed by Smith et al. (2014) and Mineo et al. (2014). Smith et al. (2014) focused on the luminous star-forming region in the west, noting that it is extended in the X-ray with a soft spectrum. They found a total 0.3–8 keV luminosity of 2.5 × 1040 erg s−1 for this region, after correcting for a total (Galactic plus internal) absorption of NH = 5.9 × 1021 cm−2 obtained from the Hα/24 μm ratio. Mineo et al. (2014) extracted and fit the spectrum of the diffuse X-ray light for the entire system and found a thermal component with  , a total (internal plus Galactic) absorption of NH = 2.0 ± 1.4 × 1021 cm−2, and a 0.5–2 keV LX of 7.9 × 1040 erg s−1. Their absorbing column is about twice the value we obtained from the UV/IR ratio but within the uncertainties; their luminosity is a factor of two higher than our determination.
NGC 2865 (AM 0921–225): NGC 2865 is an elliptical with shell structures (Malin & Carter 1983; Fort et al. 1986) and a short tidal tail or polar ring (Whitmore et al. 1990). It was identified as a merger remnant by Hau et al. (1999), who noted a kinematically distinct core. The UV morphology was studied by Rampazzo et al. (2007). For the current study, we assume NGC 2865 is a stage 7 major merger, although there is some uncertainty as to the mechanism that produces shell galaxies. An HST and Gemini study by Trancho et al. (2014) concluded that NGC 2865 hosts a 1.8 ± 0.8 Gyr old population of globular clusters. Longhetti et al. (2000) estimate a stellar population age of ≤1 Gyr, based on Hβ and other optical line indices.
The archival Chandra data for NGC 2865 were previously used in several studies. The X-ray point sources were studied by Liu (2011), while the hot gas as seen by Chandra was studied by several groups (Diehl & Statler 2005, 2007; Fukazawa et al. 2006; Sansom et al. 2006; Mulchaey & Jeltema 2010). Sansom et al. (2006) extracted the spectrum of the diffuse X-ray light out to a radius of 100'' (5 effective radii) and successfully fit the spectrum with a MEKAL plus bremsstrahlung model. The temperature of the latter component was fixed at 7.3 keV, and the absorbing column was fixed to the Galactic value. Their best-fit temperature for the MEKAL component was  , and their total absorbed diffuse 0.3–7 keV flux was 6.44 ± 10−14 erg s−1 cm−2. This is about twice our value; however, their extraction radius was three times larger than ours.
In an independent analysis of the same Chandra data, Diehl & Statler (2007) extracted the diffuse X-ray light out to three effective radii and modeled contributions from unresolved point sources by a power law. Based on their analysis, unresolved point sources dominate the diffuse light, and they only obtain an upper limit to the 0.3–5 keV X-ray luminosity from hot gas of <9.9 × 1040 erg s−1. In our analysis, we also find that the power-law component dominates the total flux; however, we detect the MEKAL component at the 4σ level, at a level well below the upper limit quoted by Diehl & Statler (2007).
In a third independent analysis, Fukazawa et al. (2006) extracted the diffuse X-ray emission out a radius of 80'' (2.7 × our extraction radius). With Galactic absorption, they find a hot gas temperature of 0.33 ± 0.10 keV, a 0.2–5 keV luminosity of 2.0 × 1039 erg s−1, and a 2–10 keV luminosity of 1.3 × 1040 erg s−1. Their soft component is similar to ours, although their high-energy flux is about two times larger.
In yet another independent study of the same Chandra data, Mulchaey & Jeltema (2010) fit the diffuse X-ray spectrum of NGC 2865 to a MEKAL plus power-law model with Galactic absorption and find that the thermal component of the diffuse Chandra emission has a 0.5–2 keV luminosity of  . This value is in agreement with ours. The radius of their extracted region is not given explicitly; however, they state the radius is set equal to the maximum extent of the X-ray emission, which was determined from radial profiles.
NGC 3256 (AM 1025–433): The stage 4 merger NGC 3256 has two long tidal tails in optical photographs (e.g., Sandage & Bedke 1994). Near-/mid-infrared images reveal two nuclei, with the southern being much more obscured (Zenner & Lenzen 1993; Kotilainen et al. 1996). The southern nucleus may be an AGN (Kotilainen et al. 1996; Ohyama et al. 2015), although this is uncertain (Lira et al. 2002; Lehmer et al. 2015).
The Chandra data for NGC 3256 have been previously analyzed by Lira et al. (2002). Fitting to two thermal components and a power law, they obtained temperatures for the thermal components of  and
and  , with the former being subject to only Galactic absorption and the latter having NH = 9.2 ± 2.2 × 1021 cm−2. The total intrinsic 0.5–10 keV luminosity was determined to be 6.79 × 1041 erg s−1. Our best-fit absorbing column for the MEKAL component is about one-third their value for their second thermal component, while our total absorption-corrected luminosity is about half theirs. Lehmer et al. (2015) also studied the diffuse X-ray light from NGC 3256 as seen by Chandra. They fit its spectrum to two thermal components plus a power law. They obtained gas temperatures of the two thermal components of
  and
and  and an absorbing column of
  , twice our best-fit value for the MEKAL component.
NGC 3353 (Mrk 35; Haro 3): In the RC3, NGC 3353 is classified as Sb? pec, while NED lists it as a BCD/Irr H ii galaxy. It has a low K-band luminosity (109.66 L☉), a low LFIR of 109.43 L☉, and a moderate SFR of 1.0 M☉ yr−1. In HST optical images, the inner region of NGC 3353 shows numerous bright knots (Malkan et al. 1998). In SDSS images, Muzcua et al. (2014) identify two of these knots as galactic nuclei. These two candidate nuclei are also visible in archival Spitzer 3.6 μm images, with the more northern one brighter at 3.6 μm. The northern source is also detected in the radio continuum spectrum (Johnson et al. 2004). Whether these two sources are both galactic nuclei is uncertain; for example, Johnson et al. (2004) and Hunt et al. (2006) both assume that the northern source is a luminous star-forming region, not a second nucleus. In both the HST and the SDSS images, two disks in close contact may be present, though that is also uncertain. Based on the HST images, Taylor et al. (2005) classify NGC 3353 as a merger. In the HST and SDSS images, a short spiral arm or tail-like structure extending to the southwest is seen. Two luminous knots of star formation are visible near the end of this tail/arm. Another short extension is seen to the northeast. For the current study, we assume this system is a merger remnant, but the merger stage is uncertain. In spite of the possible double nucleus, we tentatively list it as stage 6 because of the shortness of the tail-like structure.
The Chandra data for NGC 3353 have not previously been published.
NGC 5018: NGC 5018 is another elliptical-like galaxy with shells (Malin & Carter 1983; Fort et al. 1986). It is listed as E3: in the RC3 and in NED, but was classified as an SAB0- by Buta et al. (2010) based on Spitzer 3.6 μm images. In short-wavelength Spitzer images (Kim et al. 2012) and in optical images (Ghosh et al. 2005), a tail-like structure extends to the northwest. NGC 5018 was identified as a very late-stage major merger remnant by Schweizer et al. (1990) and Buson et al. (2004). We classify it as merger stage 7. Population synthesis suggests a typical stellar age of ∼3 Gyr for NGC 5018 (Buson et al. 2004).
The Chandra X-ray data for NGC 5018 were previously analyzed by Ghosh et al. (2005). They note that the nucleus hosts an X-ray point source which may be a low-luminosity AGN (intrinsic LX ≤ 3.5 × 1039 erg s−1). They found that the diffuse X-ray emission is spatially coincident with strong Hα emission, suggesting that it is powered by star formation. Ghosh et al. (2005) obtained a good fit for the spectrum of the diffuse light with a MEKAL plus power-law model with Galactic absorption. For the MEKAL component, they found kT = 0.41 ± 0.04 keV. Their total absorption-corrected 0.5–8 keV luminosity for the diffuse light was 13.7 ± 1.5 × 1039 erg s−1, with about 54% arising from the MEKAL component. This is in reasonable agreement with our results.
NGC 5256 (Markarian 266): In the SDSS images, NGC 5256 is a pair of disks in close contact surrounded by tidal debris, thus we classify it as a stage 3 merger. This pair has high FIR and high K luminosities (1011.21 L☉ and 1011.62 L☉, respectively), as well as a moderately high SFR of 36 M☉ yr−1. The southwestern galaxy is classified as a Seyfert 2 nucleus (Osterbrock & Dahari 1983).
The Chandra view of the diffuse X-ray light in NGC 5256 was previously investigated by Brassington et al. (2007). Both nuclei are detected as X-ray point sources. Diffuse emission is seen between and surrounding the two nuclei. A separate patch of diffuse emission is seen 20'' to the north, coincident with tidal debris seen in the SDSS images and in Hα maps (Brassington et al. 2007). All of the diffuse X-ray emission in NGC 5256 lies within the μB = 25.0 mag arcsec−2 isophote as indicated by the SDSS g image and thus is included in our extraction. Brassington et al. (2007) divide the diffuse emission into three zones: between the two nuclei, surrounding the two nuclei, and the northern region. Assuming just Galactic absorption and fitting the X-ray spectra of the diffuse light to single MEKAL functions, Brassington et al. (2007) find temperatures of  , 0.52 ± 0.06 keV, and
  for these three zones, respectively. Their total diffuse 0.3–6 keV luminosity is 27.7 ± 0.9 × 1040 erg s−1. Our MEKAL component assuming Galactic absorption is about 25% lower than theirs, but we measure an additional power-law component with similar luminosity. In Figure 21, we display the diffuse X-ray spectrum for NGC 5256, along with our best-fit model.
NGC 6240 (IRAS 16504+0228): In the SDSS images, NGC 6240 has a distorted structure with a prominent dust lane and tidal debris. Two nuclei are seen in both the optical (Fried & Schultz 1983) and the near-infrared (Eales et al. 1990), thus we classify NGC 6240 as a stage 4 merger. NGC 6240 has both high LFIR and LK (1011.61 L☉ and 1011.81 L☉, respectively) as well as a high SFR (98 M☉ yr−1). Based on its optical spectrum NGC 6240 is sometimes classified as an LINER galaxy (Veilleux et al. 1995; Véron-Cetty & Véron 2006); however, it is sometimes called a Seyfert galaxy (e.g., Contini 2013.) Using spatially resolved spectra, Rafanelli et al. (1997) conclude that the northern nucleus has LINER-like line ratios, while the southern source shows indications of a Seyfert nucleus. Mid-infrared spectroscopy reveals the presence of a buried AGN; however, it may contribute less than half of the total bolometric luminosity of the system (Genzel et al. 1998; Armus et al. 2006), although this is uncertain (Lutz et al. 2003; Egami et al. 2006). Risaliti et al. (2006) detected broad Brα emission (line width ∼1800 km s−1) from the southern nucleus and a steep 3–5 μm continuum from the northern nucleus. They conclude that both nuclei host AGNs, but the AGNs contribute little to the bolometric luminosity.
The Chandra data have previously been used to study both nuclear activity and the diffuse X-ray light. Using archival Chandra data, Komossa et al. (2003) concluded that both nuclei are AGNs. Hard variable X-rays indicative of an obscured AGN were also detected by the NuSTAR satellite (Puccetti et al. 2016). The diffuse emission in NGC 6240 was studied by Grimes et al. (2005) using the initial 35.6 ksec of Chandra data. They found that 95% of the light lies within a radius of 62'' (32 kpc). They split the emission into two annuli and fit the spectra for the two regions with a power-law plus MEKAL spectrum. They found a MEKAL  for the inner annulus (inside an 8'' × 11'' radius) and
  for the outer region. For the inner annulus, they also fit for NH, finding 4 ± 1 × 1021 cm −2; for the outer annulus, they used the Galactic value. Their determination of NH for the inner annulus agrees well with our estimate from the UV/IR ratio and is about twice our best-fit value. They found a total 0.3–2 keV thermal emission of 1.3 × 1042 erg s−1. Our best-fit absorption-corrected MEKAL luminosity agrees well with their result. The diffuse X-ray emission from NGC 6240 was again studied by Nardini et al. (2013) using a much longer Chandra exposure. They note diffuse emission spread over a 225'' × 162'' diameter region (110 × 80 kpc). They divided the area into six azimuthal sectors, and fitting to a thermal plus power-law model found gas temperatures between 0.65 and 0.82 keV for these sectors. They found a total 0.4–2.5 keV luminosity for the hot gas of 4 × 1041 erg s−1 assuming Galactic absorption only. This is about three times our value with only Galactic absorption. When they included internal absorption in their fit, they obtained an absorbing column of NH = 3 × 1021 cm−2, similar to our best-fit estimate. The observed that the extent of the diffuse X-ray light extends faintly to the west about 1' beyond the μB = 25.0 mag arcsec−2 isophote as indicated by the SDSS emission. Thus, our nominal aperture misses some of this faint low-level emission. In Figure 21, we display the diffuse X-ray spectrum for NGC 6240, along with our best-fit model.
NGC 7592 (VV 731): The SDSS images of NGC 7592 show two disks in close contact, with at least two faint tidal tails. One of the tails is very long, extending 2' (58 kpc) to the south. In addition to the two galactic nuclei, another bright source is visible in the optical SDSS images at the base of one of the tails. This is listed in NED as a third galaxy (NGC 7592C). However, in the Spitzer 3.6 μm image, this source is considerably fainter than the two galactic nuclei. Both optical (Rafanelli & Marziani 1992) and mid-infrared (Haan et al. 2011) spectra indicate strong star formation at that position. We thus argue that this third source is likely an extra-nuclear star-forming region, perhaps akin to the "hinge clumps" studied by Smith et al. (2014), rather than a third nucleus. We thus follow the lead of Haan et al. (2011) and classify NGC 7592 as a major merger, since the near-infrared luminosities of the two galaxies are similar. We therefore list NGC 7592 in Table 1 as a stage 3 merger. The nucleus of the western galaxy in the pair has been identified as a Seyfert 2 nucleus, while the eastern nucleus has a H ii spectrum (Rafanelli & Marziani 1992; Veilleux et al. 1995). These classifications have been confirmed by 2.5–5 μm spectroscopy (Imanishi et al. 2010).
The X-ray point sources in the Chandra data for NGC 7592 were included in the Evans et al. (2010) survey. The diffuse X-ray emission has not previously been analyzed. We find diffuse emission around both galactic nuclei in NGC 7592.
UGC 2238 (IRAS 02435+1253): In the Spitzer 3.6 μm image, UGC 2238 has an edge-on disk-like appearance with a single nucleus and possible tidal tails. Only one nucleus is seen in K-band images also (Smith et al. 1996; Rothberg & Joseph 2004). This galaxy was classified as a merger remnant by Rothberg & Joseph (2004) based on its optical appearance, although they noted that its K-band light did not fit an R1/4 profile. The tails are also visible in the Rothberg & Joseph (2004) K-band image. We classify this system as a stage 5 merger since only one nucleus is visible. UGC 2238 has a high FIR luminosity (1011.04 L☉), placing it in the LIRG category. It also has a high LK of 1011.15 L☉. UGC 2238 is classified as an LINER by Veilleux et al. (1995). Tateuchi et al. (2015) note extended Paα emission over a 3 kpc region in the disk. The Chandra data for UGC 2238 have not previously been published.
UGC 5101 (IRAS 09320+6134): The SDSS images of UGC 5101 show a straight tail extending about 50'' (40 kpc) to the west and a fainter curved structure about the same length in the north. Only a single nucleus is visible in the SDSS images. We thus classify it as a stage 5 merger. It was included in the Rothberg & Joseph (2004) catalogue of merger remnants, who concluded that it has only one nucleus in the near-infrared and the K-band light fits an R1/4 law. UGC 5101 has a high LFIR of 1011.72 L☉, a high LK of 1011.51 L☉, and a high inferred SFR of 128 M☉ yr−1. UGC 5101 is classified as a Seyfert 1 galaxy by Véron-Cetty & Véron (2006), but as an LINER by Veilleux et al. (1995). UGC 5101 was confirmed as a powerful but obscured AGN via infrared observations (Imanishi et al. 2001; Armus et al. 2004).
The archival Chandra data for UGC 5101 were previously used by Imanishi et al. (2003) to confirm the existence of an obscured AGN. Imanishi et al. (2003) also studied the diffuse light seen in the Chandra image. They find an absorption-corrected 0.5–2 keV luminosity of 1.2 × 1041 erg s−1, about one-third of our value. The diffuse hot gas in UGC 5101 as seen by Chandra was also studied by Grimes et al. (2005). They concluded that 95% of the diffuse light is contained within 8.75 kpc (105). They divided the data into two annuli (separated at 428 = 3.4 kpc) and fitted the spectra of each annulus separately to a VMEKAL plus power-law function. For the inner and outer regions, they obtained thermal temperatures of  and
and  , respectively. For the outer annulus, they assumed only Galactic absorption. For the inner annulus, they fit for the absorbing column and found
  . This absorbing column agrees within the uncertainties with our estimate from the UV/IR ratio. Grimes et al. (2005) derived a total diffuse thermal 0.3–2 keV luminosity of 1.0 × 1041 erg s−1. Our total internal-absorption-corrected thermal LX is about three times the Grimes et al. (2005) value. In a third independent study, Huo et al. (2004) analyze the diffuse X-ray light from UGC 5101. Only including the inner 8.7 kpc radius (109), a fit to the MEKAL plus power-law model gave them
  ,
,  , and a total 0.3–10 keV absorption-corrected luminosity of
  . Their column density agrees within the uncertainties with our UV/IR estimate, but their total LX is only one-quarter of our value.
UGC 5189 (VV 547): In SDSS and other optical images (e.g., Taylor et al. 2005), UGC 5189 looks like two disk galaxies connected by a broad tidal bridge. The more western galaxy (NED01) has a higher surface brightness, while the more eastern one (NED03) is larger but has a lower surface brightness. NED also lists a small point-like object (NED02) as a third galaxy. NED02 was found to be a low-metallicity (log(O/H) + 12 = 8.24) star-forming region by Izotov et al. (2006) based on its SDSS spectrum. Ignoring the third object, we classify UGC 5189 as a stage 2 merger. UGC 5189 has low LFIR (109.48 L☉) and LK (109.47 L☉). Dahari (1985) classify the optical spectrum of UGC 5189 as Nuclear Emission Type (NET) 4.0, meaning a H ii region-like spectrum. In 2010, a bright Type IIn supernova, SN 2010jl, was discovered in the western galaxy of UGC 5189 (Benetti et al. 2010; Newton & Puckett 2010). The Chandra data of this supernovae was analyzed by Chandra et al. (2012). In our analysis, the supernova is detected as a point source.
Footnotes
- 6
- 7
SFR(M☉ yr−1) = 4.5 × 10−44(LFUV + 3.89L24), where LFUV and L24 are the luminosities νLν at the FUV and 24 μm wavelengths, respectively. This assumes a Kroupa (2002) initial mass function (IMF). Our SFRs are a factor of two times lower in the median than the SFRs quoted by Howell et al. (2010) for the 16 galaxies in common with their sample of LIRGs; the difference is due to a different IMF and a different prescription for the SFR (FUV plus total IR rather than FUV+24 μm).
- 8
SFR(M☉ yr−1) = 6.76 × 10−44(LNUV + 2.26L24), where LNUV and L24 are the luminosities νLν at the FUV and 24 μm wavelengths, respectively.
- 9
- 10
As indicated by the scanpi results; also see G. Knapp (1994, private communication) quoted in NED.
- 11
- 12
We note that for three of our systems, Arp 242, Arp 270, and NGC 5256, our K-band luminosities differ significantly from those of Brassington et al. (2007); for these systems, they used the smaller 2MASS point source catalog fluxes (N. Brassington 2014, private communication) rather than the total fluxes.
- 13
- 14
Portable Interactive Multi-Mission Simulator, http://asc.harvard.edu/toolkit/pimms.jsp.
- 15
- 16
- 17
For the GALEX FUV and NUV magnitudes, we use a zero magnitude flux density of 3631 Jy (i.e., the AB magnitude system). For the Spitzer 3.6 μm and 24 μm magnitudes, we use zero magnitude flux densities of 277.5 Jy and 7.3 Jy, respectively.
- 18
NGC 1700, NGC 2865, and NGC 5018 have σ* of 238 km s−1, 184 km s−1, and 191 km s−1, respectively (Dressler et al. 1991; Bender et al. 1994; Koprolin & Zeilinger 2000), while their stellar ages have been estimated to be between 1–3 Gyr, 1–2 Gyr, and 3 Gyr, respectively (see the Appendix). The gas temperatures for NGC 1700, NGC 2865, and NGC 5018 have been determined to be 0.47 ± 0.03 keV (Statler & McNamara 2002),
 (Fukazawa et al. 2006), and 0.41 ± 0.04 keV (Ghosh et al. 2005), respectively.
