Jun 11, 2022
Kayla Kornoelje
Title: Measurements of cosmic expansion and growth rate of structure from voids in the Sloan Digital Sky Survey between redshift 0.07 and 1.0
___________________________________________________________________
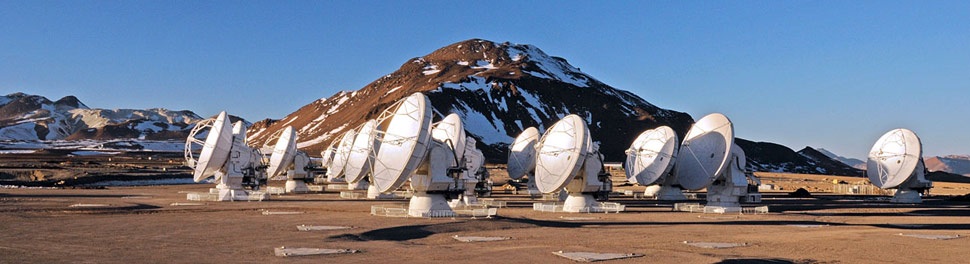
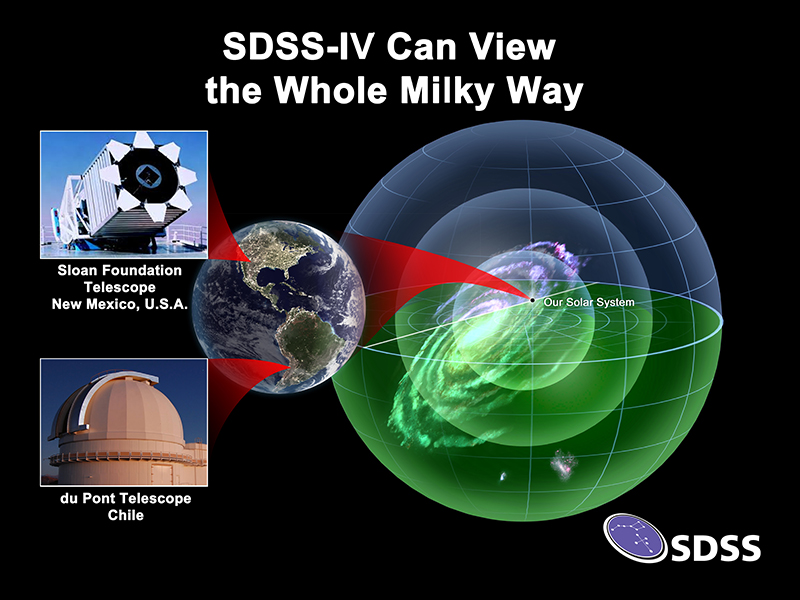
Apache Point Observatory
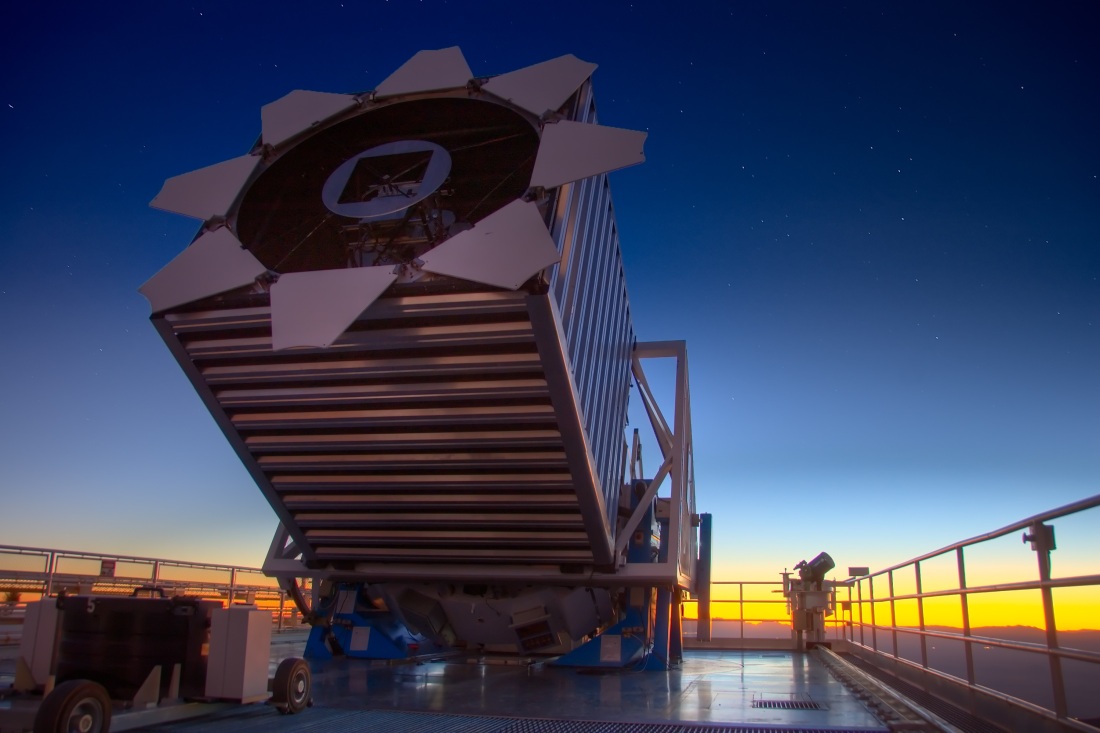 SDSS Telescope at Apache Point Observatory, near Sunspot NM, USA, Altitude 2,788 meters (9,147 ft).
 Apache Point Observatory near Sunspot, New Mexico Altitude 2,788 meters (9,147 ft).
___________________________________________________________________
Authors: Alex Woodfinden, Seshadri Nadathur, Will J. Percival, Slađana Radinović, Elena Massara, Hans A. Winther
First Author’s Institution: Waterloo Centre for Astrophysics, University of Waterloo
Status: Submitted to ArXiv [12 May 2022]
Pitch: BAOs are Cool
Cosmologists love Baryon Acoustic Oscillations (BAO), and here’s why you should too. Back when the universe was just a baby made out of hot plasma, a battle between gravity and radiation was raging on. Small overdensities in the hot plasma fought to collapse under gravity, while tightly coupled radiation provided pressure that resisted this collapse. The outcome of this battle were oscillations of matter that spread out across the plasma, almost like ripples in a pond. As the universe began to cool, radiation no longer provided support against gravitational collapse, and overdensities of matter contained within these ripples could finally collapse into galaxy clusters. These ripple-like patterns of galaxy clusters are known as BAOs, and they’re extremely important to cosmologists because their size and properties depend on the details of our universe’s composition. Precise measurements of these BAOs can provide constraints on important cosmological parameters such as the amount of baryonic matter, dark matter, and dark energy in the universe. Additionally, monitoring the size of BAOs over a wide range of redshifts can be used to measure how the expansion rate of the universe changes across cosmic time. Given everything that we can learn from studying BAOs, it’s no wonder why cosmologists have been using them as cosmological probes for decades. Have I sold you on BAOs yet?
Pitch 2: So are Cosmic Voids
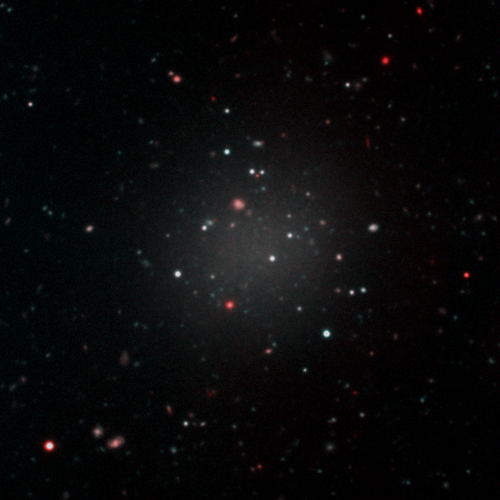
If so, I have another cosmological probe to sell you on: cosmic voids. If BAOs represent overdense regions in the universe, it’s no surprise that there are regions with extremely low densities as well. These cosmic voids are around a tenth of the average density of the universe, and they’re massive, making up around 90% of our universe. And, as it turns out, these voids are just as exciting to test parameters of cosmology as BAOs are! The properties of voids are sensitive to everything from Dark Energy and “modified gravity” [MOND], to structure growth and galaxy formation. Who knew you could get something from studying nothing!
_____________________________________________________________________________________
The Dark Energy Survey
![]()

Dark Energy Camera [DECam] built at DOE’s Fermi National Accelerator Laboratory.

 NOIRLabNSF NOIRLab NOAO Cerro Tololo Inter-American Observatory(CL) approximately 80 km to the East of La Serena, Chile, at an altitude of 2200 meters.
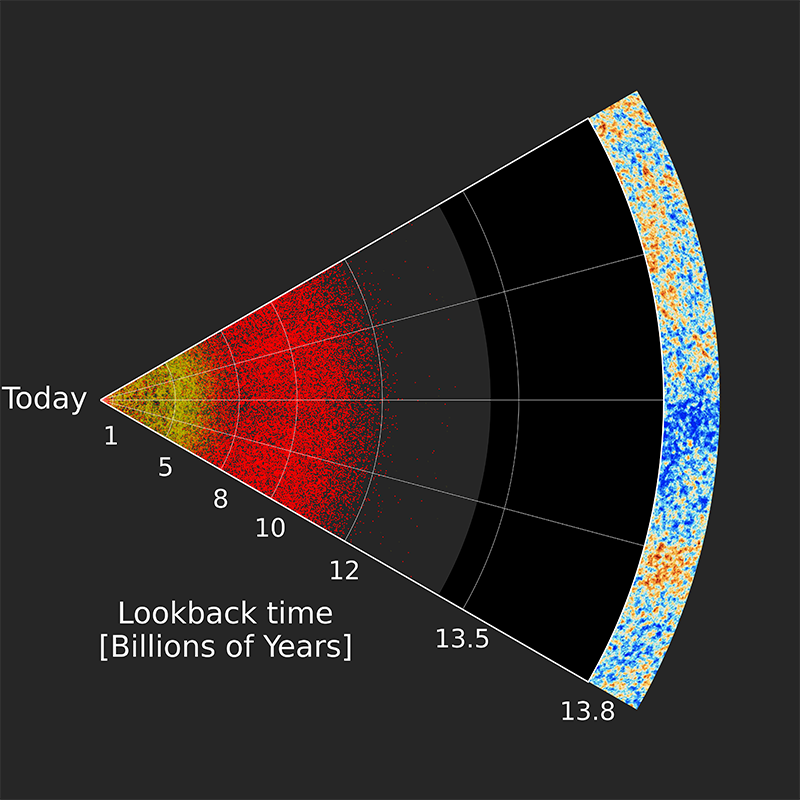
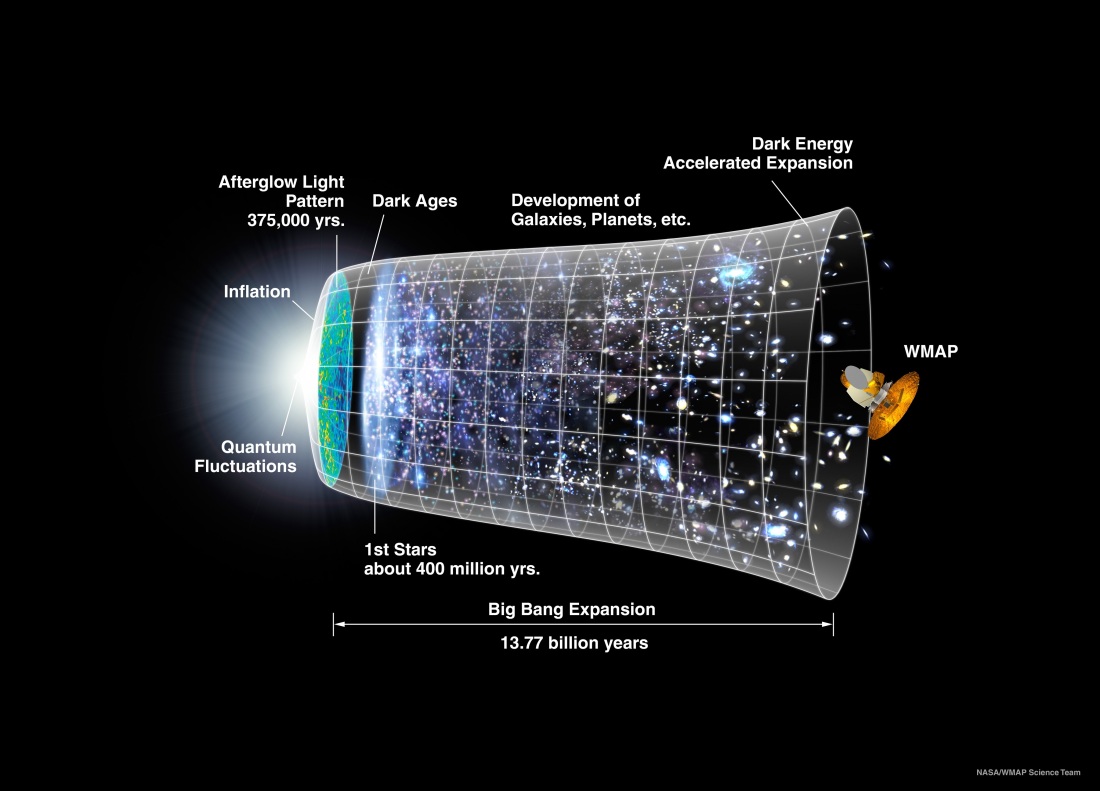 Timeline of the Inflationary Universe WMAP.
The The Dark Energy Survey is an international, collaborative effort to map hundreds of millions of galaxies, detect thousands of supernovae, and find patterns of cosmic structure that will reveal the nature of the mysterious dark energy that is accelerating the expansion of our Universe. The Dark Energy Survey began searching the Southern skies on August 31, 2013.
According to Albert Einstein’s Theory of General Relativity, gravity should lead to a slowing of the cosmic expansion. Yet, in 1998, two teams of astronomers studying distant supernovae made the remarkable discovery that the expansion of the universe is speeding up.
 Saul Perlmutter (center) [The Supernova Cosmology Project] shared the 2006 Shaw Prize in Astronomy, the 2011 Nobel Prize in Physics, and the 2015 Breakthrough Prize in Fundamental Physics with Brian P. Schmidt (right) and Adam Riess (left) [The High-z Supernova Search Team] for providing evidence that the expansion of the universe is accelerating.
To explain cosmic acceleration, cosmologists are faced with two possibilities: either 70% of the universe exists in an exotic form, now called Dark Energy, that exhibits a gravitational force opposite to the attractive gravity of ordinary matter, or General Relativity must be replaced by a new theory of gravity on cosmic scales.
The Dark Energy Survey is designed to probe the origin of the accelerating universe and help uncover the nature of Dark Energy by measuring the 14-billion-year history of cosmic expansion with high precision. More than 400 scientists from over 25 institutions in the United States, Spain, the United Kingdom, Brazil, Germany, Switzerland, and Australia are working on the project. The collaboration built and is using an extremely sensitive 570-Megapixel digital camera, DECam, mounted on the Blanco 4-meter telescope at Cerro Tololo Inter-American Observatory, high in the Chilean Andes, to carry out the project.
Over six years (2013-2019), the Dark Energy Survey collaboration used 758 nights of observation to carry out a deep, wide-area survey to record information from 300 million galaxies that are billions of light-years from Earth. The survey imaged 5000 square degrees of the southern sky in five optical filters to obtain detailed information about each galaxy. A fraction of the survey time is used to observe smaller patches of sky roughly once a week to discover and study thousands of supernovae and other astrophysical transients.
_____________________________________________________________________________________
MOND [Modified Newtonian dynamics]


_____________________________________________________________________________________
![]()
Figure 1: Measurements of the growth rate of structure (ƒσ₈) compared to the values measured by the cosmic microwave background (blue strip). The red marks represent the measurements from the void-galaxy correlation, the gray marks represent measurements from BAOs, and the green marks represent void-galaxy correlation measurements using different analysis techniques. (Figure 6 in the paper)
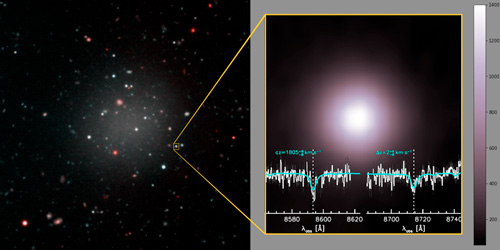
But most important for today’s discussion is the information encoded within the void-galaxy cross-correlation function. While it sounds like a mouthful, this function really just describes the properties, such as the density and peculiar velocities, of galaxies surrounding voids. This statistical property is particularly important as it can characterize both red-shift-space distortions (RSDs), and the Alcock-Paczyński (AP) effect. Astronomers use an object’s velocity to determine its redshift, and RSDs are simply biases in our redshift measurement due to an additional peculiar velocity component. Since peculiar velocities are dependent on local gravitational interactions, accurately characterizing RSDs can tell us a lot about the properties of matter in our universe, such as the growth rate of structure. The AP effect, on the other hand, is a distortion of the shape of a distribution of galaxy clusters. If we assume galaxy clusters are distributed like a sphere around voids, the AP effect can make the distribution of clusters appear flattened or elongated if astronomers make incorrect assumptions about the geometry of the universe. Analysis of these distortions provides astronomers with measurements of what is known as the Alcock-Paczyński distance ratio, which is the ratio between the comoving angular diameter distance and the Hubble distance. This is particularly exciting for the study of cosmic voids, as they should be able to constraint this distance ratio even more precisely than BAOs can. All in all, cosmic voids are a novel probe of the properties of our universe. Not sold yet? Well, let’s let the results of today’s paper do the talking then!
The Proof is in the Cosmic Void
The authors of today’s paper examined the cross-correlation of galaxies and cosmic voids to unravel the wealth of cosmological information packed within them. After careful and rigorous treatment of both selection and systematic errors that can arise from the analysis of cosmic voids, the authors found exciting results. First, the authors found that cosmic voids alone can constrain the value of the growth rate of structure just as precisely as BAOs can (Figure 1). While this is not a novel result, this precision points to the fact that voids are a great tool to use in combination with BAOs to get better measurements of cosmological parameters than either of them can do alone. But, perhaps even more compelling is the fact that the author’s results also confirm that cosmic voids do beat BAOs when it comes to measuring the AP distance ratio (Figure 2). Such results demonstrate the importance of voids as cosmological probes, and support a powerful new avenue for cosmologists to explore to unlock the mysteries of our universe. And, as the cherry on top of it all, there are new galaxy surveys such as DESI and Euclid coming up in the near future, which will probe much larger volumes of the universe over a larger redshift range. Watch out world, precision cosmology is about to get even more precise!


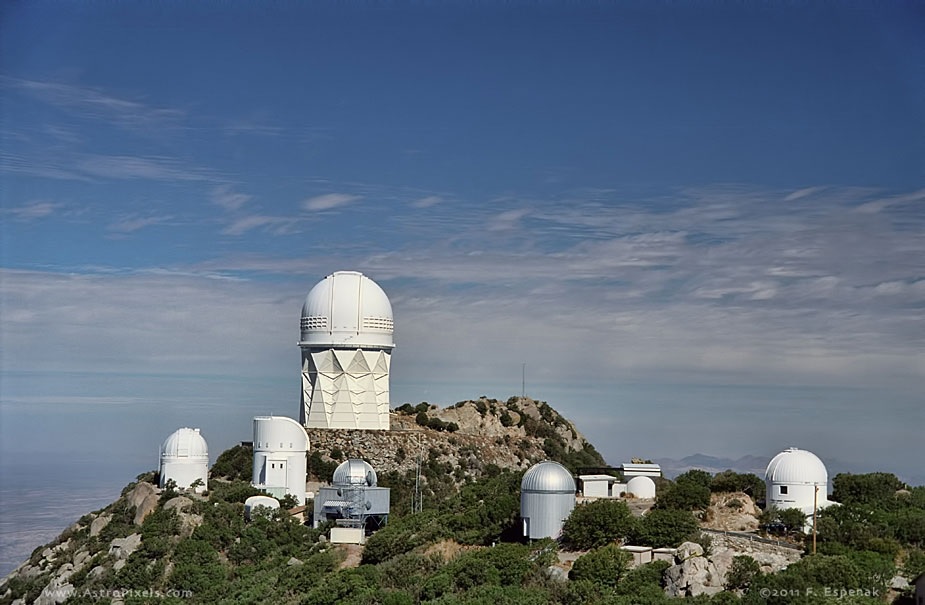

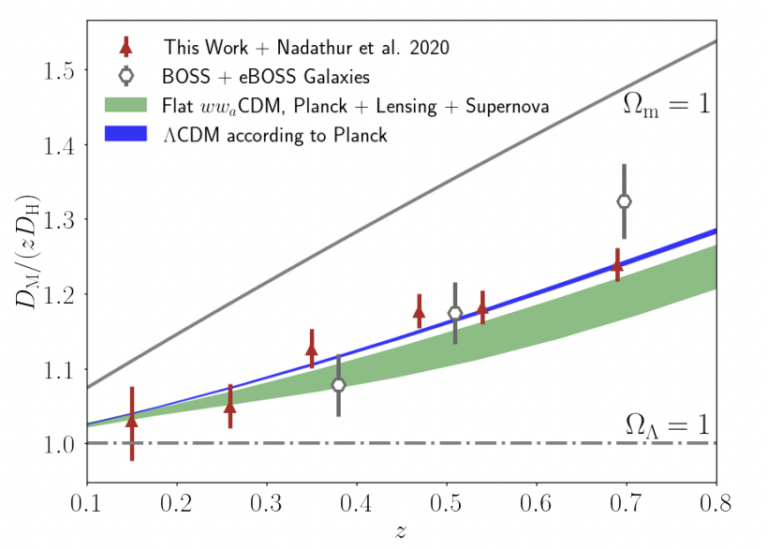
Figure 2: Measurements of the AP distance ratio Dₘ/DH. Red points represent measurements from void-galaxy correlations, and gray points represent those from BAOs. The green and blue bands are expected values from the CMB (blue) and the CMB combined with other cosmological probes (green). (Figure 7 in the paper)
See the full article here .

five-ways-keep-your-child-safe-school-shootings
Please help promote STEM in your local schools.
What do we do?
Astrobites is a daily astrophysical literature journal written by graduate students in astronomy. Our goal is to present one interesting paper per day in a brief format that is accessible to undergraduate students in the physical sciences who are interested in active research.
Why read Astrobites?
Reading a technical paper from an unfamiliar subfield is intimidating. It may not be obvious how the techniques used by the researchers really work or what role the new research plays in answering the bigger questions motivating that field, not to mention the obscure jargon! For most people, it takes years for scientific papers to become meaningful.
Our goal is to solve this problem, one paper at a time. In 5 minutes a day reading Astrobites, you should not only learn about one interesting piece of current work, but also get a peek at the broader picture of research in a new area of astronomy.