Recommended
Blog Post
With people’s attention turned towards the Mega Million lottery drawing at the end of August, the IMF’s recent release of data on the changes in SDR holdings for June-July might have flown a bit under the radar. But as we show in this blog, the monthly releases of changes in SDR holdings bear many resemblances to a lotto draw and are also worth mega millions.
In an attempt to make SDR data a bit more decipherable—and because exploring SDRs data can be quite amusing (despite what your friends and family might say)—we have decided to publish our own monthly updates on the SDR holdings data in the form of a blog post. In each post we’ll highlight the mechanics, overall status, and surprising surprises that the world of SDRs offers.
The 2021 allocation vs. end July 2022
First, let’s compare SDR holdings in 2021 with holdings now, almost a year after the allocation.
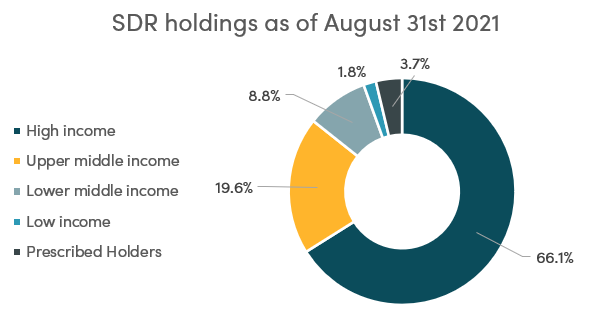
In August 2021, holdings looked like this:
In August 2022, we have now reached this:
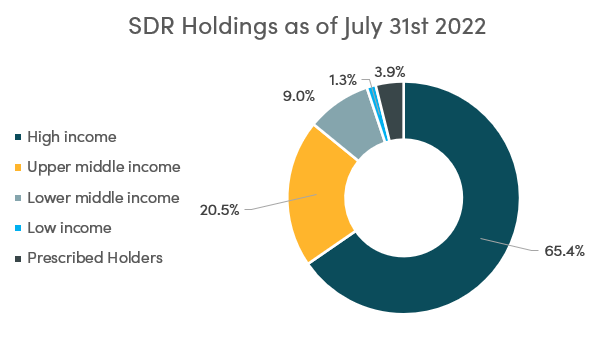
When the numbers are rounded, we can notice that a slow, slow, slow redistribution is taking place. At this rate, we’ll be lucky to see the G20 pledge to recycle $100 billion worth of SDRs fulfilled before the end of the century!
The June-July changes
After triple checking that we still knew how to do a subtraction, we can confidently say that, once again, the SDR holding data are. . . confusing. This time, our confusion is not due to the IMF’s obscure accounting techniques, but rather to some odd dynamics.
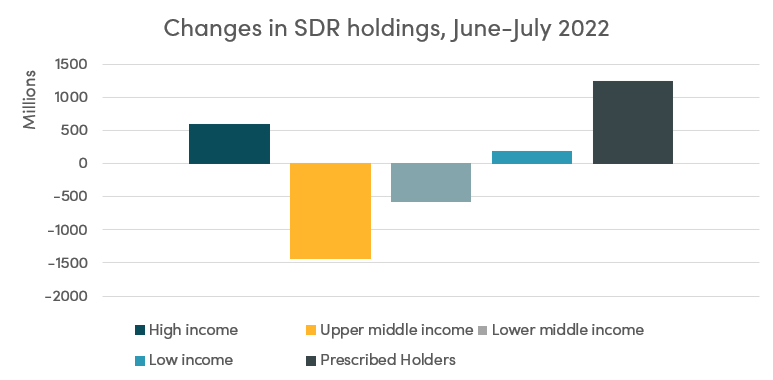
Overall, during the month of July, low-income countries saw their holdings of SDRs increase by SDR 174 million along with big increases for prescribed holders, notably the IMF’s General Resources Account. Upper-middle-income countries traded in their SDRs for hard currency or paid off debt to other prescribe holders.
As we noted in previous blogs, accurately tracking SDRs exchanges is impossible (by that, we mean that we cannot be sure where the SDRs that country X receives come from or the ones that country Y loses go to). However, we can make educated guesses: if, let’s say Comoros was to gain 86,000 SDRs and Denmark sees its holdings decrease by the exact amount, we can deduce that Comoros provided hard currency to Denmark. This scenario seems odd, because it is, but it is also real.
Here is a compilation of our favourite odd SDR movements—let us know via Twitter which one is your favourite!
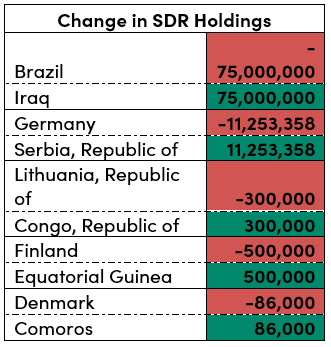
Now, these are surprising dynamics. Why would Finland need a half a million SDRs worth of hard currency and why would Equatorial Guinea provide it? Or did Equatorial Guinea need SDRs for some reason? We’ll see what they do with them next month.
It appears Iraq accumulated SDRs in July to repay the IMF General Resources Account this month—a payment of SDR 73 million is due.
It must be said that these are not game changing amounts. As mentioned earlier, high income countries over the last year have accumulated the most SDRs, meaning they have been the main providers of hard currency to LMICs and others.
Still, it would be interesting to know the reason for these movements. We can see only two possibilities:
- The voluntary trading arrangement (VTA) system might not be functioning in the way we expect, leading to LICs and LMICs to provide SDRs to high-income countries (the intricacies of the VTA system can be found here)
- LICs and LMICs want to accumulate SDRs as they are a polyvalent tool.
The main international changes and global dynamics
Here are the five main changes in this month’s SDR data:
SDR losers
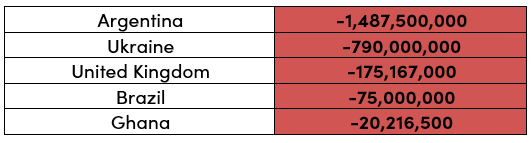
Argentina has been a bit a of a wild card for the last couple of months as it has been struggling with debt repayment and bleeding SDRs ever since, especially as it has repaid the IMF in SDRs.
On the other hand, the Ukrainian movements are very interesting and are the result of this mechanism of Special Administered Account – donors gave them SDRs in June and they exchanged them for hard currency in July. We suspect that this is not the last time we will be talking about Ukraine and SDRs. (More details on the Special Administered Account and Ukraine here.)
SDR gainers
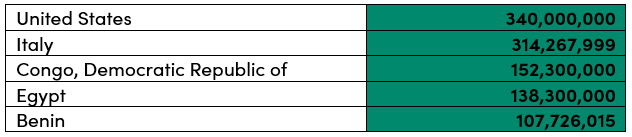
The Democratic Republic of Congo and Benin received loan disbursements from the IMF. The reasons for the movement of the other three of the top five are unclear.
Out of the 28 countries that saw their SDRs increase, only nine are high-income countries (with the US and Italy accounting for 45 percent of the increase in high-income-country holdings). Overall, high-income countries accounted for 57 percent of the total country increase in holdings. It should also be mentioned that 20 percent of the world’s SDRs are now safely stored in the US accounts.
Disclaimer
CGD blog posts reflect the views of the authors, drawing on prior research and experience in their areas of expertise. CGD is a nonpartisan, independent organization and does not take institutional positions.
Image credit for social media/web: Adobe Stock