Modeling of swordtip squid (Uroteuthis edulis) monthly habitat preference using remote sensing environmental data and climate indices
 Ali Haghi Vayghan
 Aratrika Ray2
  Ming-An Lee
- 1Department of Ecology and Aquatic Stocks Management, Artemia and Aquaculture Research Institute, Urmia University, Urmia, Iran
- 2Department of Environmental Biology and Fishery Science, National Taiwan Ocean University, Keelung, Taiwan
- 3Center of Excellence for Oceans, National Taiwan Ocean University, Keelung, Taiwan
- 4Doctoral Degree Program in Ocean Resource and Environmental Change, National Taiwan Ocean University, Keelung, Taiwan
Understanding the spatial arrangement of species in maritime settings necessitates the study of oceanography. Hence, doing a study on the correlation between oceanography and species dispersion is imperative, considering the impacts of global climate change. The study used a generalized additive modeling approach to analyze the influence of oceanographic conditions on the distribution of swordtip squid in northeastern Taiwan, integrating fishing data, climatic oscillation and oceanography. Among seven oceanographic characteristics, bottom sea temperature (SSTB), sea surface height (SSH), sea surface chlorophyll (SSC), and sea surface temperature (SST) showed significant influence in generalized additive model (GAM) analysis (combined deviance explained: 40.30%). The monthly catch rate of swordtip squid is influenced by six climatic oscillations, with the Pacific Decadal Oscillation having the most significant impact, accounting for 31% of the distribution, followed by the North Pacific Gyre Oscillation at 10.8% and the Western Pacific Oscillation at 6.05%. From 2015 to 2019, the main areas for squid fishing were situated in the northeastern waters of Taiwan, precisely within the geographical coordinates of 25°N to 28°N and 121.5°E to 125°E. This study provides crucial insights for managing swordtip squid fisheries in Taiwan's northwest waters, highlighting the importance of incorporating oceanographic conditions relating to climate change information into decision-making to protect global ocean fisheries and their dependent communities.
1 Introduction
Forage fish play a pivotal role in marine ecosystems and are highly valuable worldwide, both directly as a landed commodity and indirectly as prey for other harvested species (Hunsicker et al., 2010; Pikitch et al., 2014). Squid (Cephalopoda: Loginidae) plays a critical role in sustaining trophic webs, is fast growing, has a short life span, lives in warm continental shelf waters, is a highly reproductive species, and is sensitive to changes in ambient oceanic variables, which result in its wide distribution in the Pacific Ocean from the South China Sea to Japan and through the Java Sea and coastal waters of Indonesia, Malaysia, and Thailand as well as the waters of the tropical and equatorial regions of Latin America (Roper et al., 1984; Liao et al., 2006; Wang et al., 2021; Fang et al., 2023). These characteristics rapidly increase the population size of this commercially important species in suitable habitats. Therefore, environmental factors play a critical role in its life cycle (Arkhipkin et al., 2015), which results in interannual changes in its overall yield. Cephalopods are sensitive to environmental variables, with the water temperature (Jiajia et al., 2020; Yamaguchi et al., 2020a; Yamaguchi et al., 2020b; Yamaguchi et al., 2022) being the key factor affecting the population biomass and species distribution (Cheng et al., 2022; Pang et al., 2022; Yu et al., 2019a) in terms of spawning activity and recruitment (Agnew et al., 2000; Postuma and Gasalla, 2010). Any change in water temperature, chlorophyll a concentration, and salinity affects biological characteristics (Yunrong et al., 2013; Jin et al., 2019), migration (Chen, 2016), feeding behavior (Lin et al., 2020), and catch status of squids in different habitats (Yu et al., 2015; Gong et al., 2021; Zhang et al., 2022). Climate change has had large impacts on squid catch fluctuation and habitat (Yu et al., 2015; Fang et al., 2021; Wang et al., 2023). For example, changes in surface water temperature have caused squid to shift northward or southward (Chen et al., 2007), resulting in inter-annual variations in growth, maturation, population dynamics, and fishing grounds (Chen et al., 2022). Cephalopods have been largely exploited in China, Taiwan, Japan, and Korea in the Northwest Pacific Ocean, and they are also preyed upon by top predators (e.g., shark, tuna, and billfish), marine mammals (e.g., whales, dolphins, and seals), and seabirds (Rodhouse and Nigmatullin, 1996; Smale, 1996). Habitat monitoring of cephalopods can indirectly provide insights into top predators’ habitat, spawning grounds, and migration routes. Therefore, suitable habitat research can enable sustainable fishery production.
Increasingly, the health of ocean ecosystems and aquatic habitats has been threatened by overexploitation, global warming, pollution, and anthropogenic-driven climate change, affecting fish population sustainability and marine fishery (Andrews et al., 2023; Barman et al., 2023). The distribution of fish species is significantly influenced by various oceanographic factors, including temperature, salinity, dissolved oxygen levels, nutrients, and water currents, with temperature particularly affecting the distribution of various fish species. Changes in water temperature influence fish feeding, habitat suitability, metabolic rate, reproduction, disease, stress, oxygen consumption, spawning habits, and migration patterns (Alfonso et al., 2021; Teng et al., 2021; Vayghan and Lee, 2022). Fish populations and the ecosystems they are a part of may suffer from abrupt or significant temperature fluctuations. For example, fish that are exposed to higher temperatures have higher metabolic rates, which in turn cause them to feed more. Temperature variations in the water can affect which habitats are suitable for a given species, which could result in changes to the species’ distribution and abundance. The temperature of the water is also a major factor in fish reproduction. It may have an impact on when spawning occurs, how eggs develop, and how long larvae survive. Fish diseases can vary in severity depending on the temperature. Because fish are ectothermic, the environment outside affects their internal body temperature. Fish can experience stress due to abrupt or drastic changes in water temperature, which can weaken their immune systems and general well-being. Finally, the timing and paths of migration can be impacted by changes in water temperature (Chanda and Bora, 2020), which may also have an effect on the availability of food and suitable habitats. Salinity also affects fish distribution. It is essential for some of the most important processes, including spawning (Bani et al., 2016; Ferreira-Martins et al., 2016), migration, and osmoregulation (Urbina and Glover, 2015) as well as physiological processes such as sperm activation, egg fertilization, and embryo development (Mendoza-Portillo et al., 2023). Changes in salinity may therefore influence the distribution of many fish species because salinity is important for several processes, mainly osmoregulation. In addition to breathing, oxygen is essential for survival, growth, activity, behavior, and reproduction. Gamete formation and hormone modulation are extremely oxygen-dependent and are two crucial processes for attaining maturity or spawning in albacore tuna (Sear et al., 2014). Nitrogen and phosphorus are essential for primary productivity in water. Phytoplankton, which form the base of the food chain, requires nutrients to grow. Nutrient-rich environments support higher productivity, thus attracting fish. As nutrient concentrations fluctuate because of upwelling, runoff, or pollution, fish distribution patterns also alter. Ocean currents influence fish distribution, migration, and dispersal (Haghi Vayghan et al., 2016; Teng et al., 2021; Mammel et al., 2022). They carry fish larvae, eggs, and juveniles over long distances, which affects their connectivity and settlement. Currents also affect the distribution of food supplies, influencing the geographical patterns of fish populations. Rising atmospheric CO2 concentrations induce ocean acidification, which decreases the pH of saltwater (Pearson and Palmer, 2000; Jiang et al., 2019). The effects of acidity on fish physiology and behavior may affect fish distribution. Notably, these oceanographic characteristics interact with one another and other environmental elements to form ecosystems that are ideal habitats for marine organisms.
Additionally, oceanographic phenomena, including waves, oceanic fronts, upwelling, ocean current, and climatic phenomena such as the Pacific Decadal Oscillation (PDO) and the El Niño-Southern Oscillation (ENSO), all contribute to the marine environment (Johnson et al., 2020; Choi and Son, 2022). Turbulence and vertical mixing, for instance (Barman and Bora, 2021; Chanda and Pramanik, 2023), can be brought on by wave action at the ocean’s surface. Plankton and other small organism distribution may be impacted, which may have an impact on fish prey bases since fish distribution and prey distribution are frequently correlated. Oceanic fronts are areas where various water masses that have different salinity and temperature properties come together. Variations in nutrient availability and productivity are frequently caused by these fronts. These areas may draw fish because of the abundance of prey linked to higher productivity.
Habitat changes in fishery resources can affect catch rates and habitat suitability, and these changes result in ecosystem imbalance and socioeconomic problems (Mammel et al., 2023; Peluso et al., 2023). Satellite remote sensing data enable the rapid screening of aquatic species habitats; through this approach, scientists conduct extensive surveys worldwide from different perspectives. Subsequently, combining different technologies and scientific management strategies, such as EBFM, contributes to favorable sustainable fishery development in oceans.
Climate change has led to markedly elevated global temperatures, primarily due to an increase in greenhouse gas emissions—particularly CO2—especially since the Industrial Revolution (Lønborg et al., 2020). This has been causing a continuous increase in water temperature, which may affect the habitat of many fish and shellfish species, ultimately damaging fisheries (Arias et al., 2021). Consequently, SST has also increased. Seas have a critical role in capturing and storing heat from the atmosphere (Arneth et al., 2020). Because of its high heat capacity, seawater can absorb and store a large amount of heat. With global warming, oceans serve as a heat sink, absorbing a significant portion of additional heat (Suh et al., 2020), thereby increasing SST. By 2100, ocean SST is expected to have increased globally by 1–4°C. Consequently, the oceanographic factors that are closely related to SST are also changing, likely altering species habitat (Kroeker and Sanford, 2022). Thus, understanding the present-day oceanography preferences of any species to predict the future habitat condition is crucial. To this end, by understanding spatiotemporal fishery resource production and managing anthropogenic activity over oceans, ecosystem-based fishery management (EBFM) is required for planning ocean resources and for ensuring the sustainable yield of protein source in oceans.
A better understanding of the monthly patterns of swordtip squid (Uroteuthis edulis) fishery by using environmental data and climate indices can help to identify possible changes in its habitat that are caused by environmental changes and to develop appropriate plans. Therefore, given the commercial value of swordtip squid, habitat trend modeling with an emphasis on hotspot regions should be conducted to establish possible management strategies for ensuring future sustainable fisheries and food supplies.
In this work, we used scientific fishery data collected over a period of five years (2015 to 2019) to examine the spatial and temporal distribution patterns of U. edulis in the East China Sea (ECS) around Taiwan. To be precise, we created habitat models in order to determine the primary environmental factors that influence the distribution of species and provide predicted maps for different months. These maps demonstrate the fluctuation in the probability of occurrence throughout the research region and throughout the year. This research improves the comprehension of the geographical and temporal fluctuations in the environmental preferences of U. edulis and establishes a significant database and theoretical structure for the efficient management of this fishery.
2 Materials and methods
2.1 STEP I – Data collection
2.1.1 Squid fishery data
For this study, small-scale squid fishery data from January 2015 to December 2019 were obtained from Taiwan Fisheries Agency (primarily coastal water fishing trawlers<100 gross registered tonnages and<24 m in length). The monthly fishery data had a spatial coverage of 20–26°N and 117–126°E with a spatial resolution of 0.1°. The logbook included information such as year, month, latitude, longitude, fish catch in kilograms, fishing effort in hours, total catch weight (but not dried or wet weight), type of fishing gear used, and vessel identification number. No information was available regarding the duration of fishing gear soaking or fishing depth.
2.1.2 Climatic oscillation data
The monthly climatic oscillation data were downloaded from the National Oceanic and Atmospheric Administration website (http://www.cpc.ncep.noaa.gov). The collected climatic oscillation data were Southern Oscillation Index (SOI), Multivariate ENSO Index Version 2 (MEI V2), PDO, and Dipole Modular Index obtained from January 2014 to December 2019 (Data access: 15.08.2023).
2.1.3 Oceanographic variable data
For the current study, seven oceanographic characteristics were collected from various sources: sea surface temperature (SST), bottom sea temperature (SSTB), sea surface salinity (SSS), mixed layer depth (MLD), sea surface chlorophyll (SSC), sea surface height (SSH), and bathymetry (BAT). SST (1-2 m) and SSTB (ocean floor) pertain to the thermal conditions of separate oceanic strata, each serving unique functions within the marine ecosystem (Table 1). The CMEMS global ocean eddy-resolving reanalysis product GLORYS12V1 (0.08° horizontal resolution and 50 vertical levels) was utilized to acquire SST, SSS, MLD, and SSH*. The processing level and coordinate reference system are L4 and W, respectively. As an added benefit, we collected SSC** by using the CMEMS global ocean biogeochemical hindcast product FREEGLORYS2V4 (0.25° horizontal resolution, 75 vertical levels, and daily temporal resolution; EPSG 42); the processing level and coordinate reference system are L4 and ETRS89, respectively. BAT*** data were collected from the website of Asia-Pacific Data Research Center (APDRC) with zonal and meridional resolution of 0.08°.
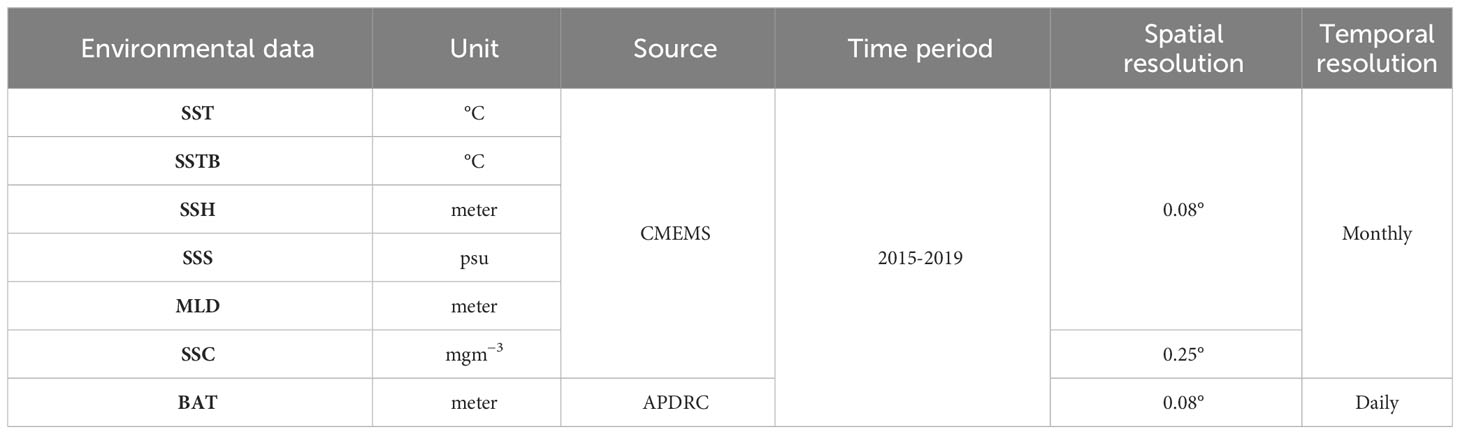
Table 1 Source of different oceanographic data.
All these data were collected between January 2015 and December 2019 (Data access: 15.08.2023), encompassing the geographic ranges 117°E–126°E and 20–26°N, respectively. To match the fishery data (version 2019a), all these data were interpolated to a spatial resolution of 0.1° by using MATLAB. In addition, similar to oceanographic and fishery data, BAT was interpolated to a monthly temporal resolution by using MATLAB.
2.2 STEP II – Impact of climatic oscillations on squid catch
2.2.1 Wavelet analysis
Wavelet analysis helps to understand catch variability by analyzing time series data, providing insights into population dynamics, environmental influences, and fishing activities, ultimately improving fisheries management practices. Following the method of Tzeng et al. (2012), we conducted cross-wavelet coherence and phase analyses to understand the association between the climatic oscillations and squid catch. According to Grinsted et al. (2004), the wavelet coherence of two time series can be defined as follows:
where W is the wavelet transform of the time series, and S is a smoothing operator used to calculate average values (Torrence and Webster, 1999).
The wavelet coherence phase can be derived as follows:
For a more detailed calculation of the wavelet transform, please refer to the studies of Torrence and Compo (1998) and Rouyer et al. (2008). Additionally, MATLAB, whcih was used to calculate the wavelet transform, and the time series analysis methods presented by Hsieh et al. (2009) and Tzeng et al. (2012) were applied to analyze long-term trends.
2.2.2 Generalized additive model analysis
Generalized additive models (GAMs) are valuable in oceanography and fisheries due to their flexibility in modeling complex relationships in data, handling non-linearity, interactions, and irregularly sampled data. Thus, GAM analysis was performed to identify the effect of each climatic oscillation on squid catch by using R studio version 4.2.3. Each climatic oscillation was considered a predictor variable, whereas squid catch was considered the response variable. We used the Gaussian family and the generalized cross-validation (GCV) method in the “mgcv” package. The climatic oscillations with the highest influence were selected on the basis of the least GCV values and the highest R2 value explained the highest deviance. Only the selected climatic oscillation was used in further analysis.
2.3 STEP III – Standardization of nominal CPUE
Fishery data standardization is crucial for sustainable practices, informed decision-making, and global marine resource conservation, ensuring reliability, comparability, and integrity in fisheries management and research. The relative abundance of squid was indexed as nominal CPUE (N.CPUE). N.CPUE was calculated using the following formula:
To obtain bias-filtered standardized CPUE (S.CPUE) data and to diminish the dominating effects of spatial (latitude, longitude) and temporal (year, month) factors, N.CPUE was standardized using one of the most common methods, namely generalized linear model (GLM). We also included the selected climatic oscillation from the previous analysis in the standardization model construction because many climatic oscillations have been demonstrated to significantly contribute to species catch (Auber et al., 2015). A GLM model with five factors was constructed in R studio version 4.2.3 by using the mgcv program. The GLM models were constructed as follows:
where c has the constant value of 0.1, n is the no. of variables, GLMn is the model with n factors, µ is the intercept (Year*Lat, Year*Lon, and Lat*Lon), € is a variable with a normal distribution and zero mean, and CO is the selected climatic oscillation.
2.4 STEP IV – Collinearity analysis
When two predictor variables are collinear, this implies that they are highly correlated, making the accurate estimation of their individual regression coefficients difficult or impossible. Collinearity analysis is a crucial regression modeling tool that helps researchers identify and address issues related to multicollinearity, thereby improving the reliability, interpretability, and generalizability of the models. Thus, two-step analysis was conducted to validate collinearity results by comparing the outcomes of two different approaches. The two-step collinearity analysis performed were as follows:
2.4.1 Variance inflation factor analysis
In a regression study, multicollinearity is evaluated using the variance inflation factor (VIF) measure with in the R studio of version 4.2.3 using the “car” library and “vif” functions. In the present study, VIF was used to test the collinearity of oceanographic variables. Any oceanographic variable with VIF > 5 was considered to exhibit collinearity and was excluded from further analysis.
2.4.2 Pearson correlation coefficient analysis
To validate the result of VIF analysis, Pearson correlation coefficient analysis (Báez et al., 2020) was performed to test collinearity between all possible pairs of oceanographic variables. Pearson correlation coefficient analysis was performed in the R studio of version 4.2.3 using the “ggplot2” library and “corr” functions. The index range for the degree of collinearity between two explanatory variables was from −1 to 1. This indexing scale was divided into six sections, with 0 representing no relationship, +1 or −1 representing an ideal positive or negative correlation, +0.1 to +0.3/−0.1 to −0.3 representing a weak positive or negative correlation, +0.4 to +0.7/−0.4 to −0.7 representing a moderate positive or negative correlation, and +0.8 to +1.0/−0.8 to −1.0 representing a strong positive or negative correlation, respectively (Ratner, 2009). Any pair of explanatory variables (Zuur et al., 2010) with a correlation coefficient of 0.75 or more (Lezama-Ochoa et al., 2017) was considered to exhibit collinearity and was excluded from further analysis.
2.5 STEP V – Impact of oceanographic variables on standardized CPUE for squid
By using R 4.2.3, we performed GAM analysis to identify the effect of each oceanographic variable on the standardized CPUE for squid. This is because GAMs are valuable in oceanography and fisheries due to their flexibility in modeling complex relationships in data, handling non-linearity, interactions, and irregularly sampled data (Mondal et al., 2023a; Mondal et al., 2023b). Each oceanographic variable was considered as a predictor variable, whereas the standardized CPUE for squid was considered as a response variable. We used the Gaussian family and the GCV method in the “mgcv” package. Oceanographic variables were ranked on the basis of the least GCV values and the highest R2explained the highest deviance. Oceanographic variables that explained a deviance of 10% or more were only selected for further analysis. The GAM model was as follows:
where S.CPUE is the standardized CPUE of the long-line catch data, s is a smoothing function of each model covariate, and an is the nth oceanographic variable.
2.6 STEP VI – Habitat prediction
The study examined the association between environmental fluctuations and catch rate of swordtip squid from 2014 to 2019 between January to December. Furthermore, a habitat preference model was created and generalized additive models (GAMs) were employed to analyze potential seasonal fishing grounds. GAMs are advantageous due to their ability to represent complex relationships between responses and explanatory variables, including highly nonlinear and nonmonotonic relationships. This makes GAMs well-suited for expressing underlying relationships in ecological systems. The GAMs were built using R version 4.2.3 with the “mgcv” package. function. The response variable in this study was the catch rate. The predictor variables included time variables (year and month) and environmental factors. The GAM was formulated in the following manner:
c represents 10% of the average S.CPUE. To address the issue of the log-link function’s inability to handle zeroes, a constant value c was introduced to all catch rates. The c-value is frequently employed in catch rate standardizations for pelagic species. All covariates were treated as continuous variables, and the effective degrees of freedom were estimated for each main factor. The above equation defines the model constant, a0, and the spline smoothing function, s for each covariate in the model. The interaction between year and month was included in the analysis to consider potential inter-annual variability in the temporal patterns of squid, which may be influenced by environmental factors.
The model with the optimal conformation was chosen through a stepwise procedure that relied on the lowest GCV and highest R2 value. The final set of variables had a P-value below 0.05. The GAMs selected were utilized to forecast the relative abundance of the swordtip squid in the study region from 2015 to 2019. This was achieved by employing the R function “predict.gam.” The catch rates were predicted and mapped using MATLAB, and then overlaid with the actual catch rates.
3 Results
3.1 Catch rate variability in the study period
Figure 1 illustrates the total catch of swordtip squid from 2015 to 2019. Compared with the catch rate in other years, the total catch exhibited an excessively high upward trend in 2018. The total catch rate in 2018 was approximately 4,50,000 kg. It fluctuated downward again in 2019, with<50,000 kg of catch. The first peak of the highest total catch rate in 2018 occurred in July, with a second peak in September. Overall, a declining trend was observed in the total catch rate for swordtip squid from 2015 to 2019.
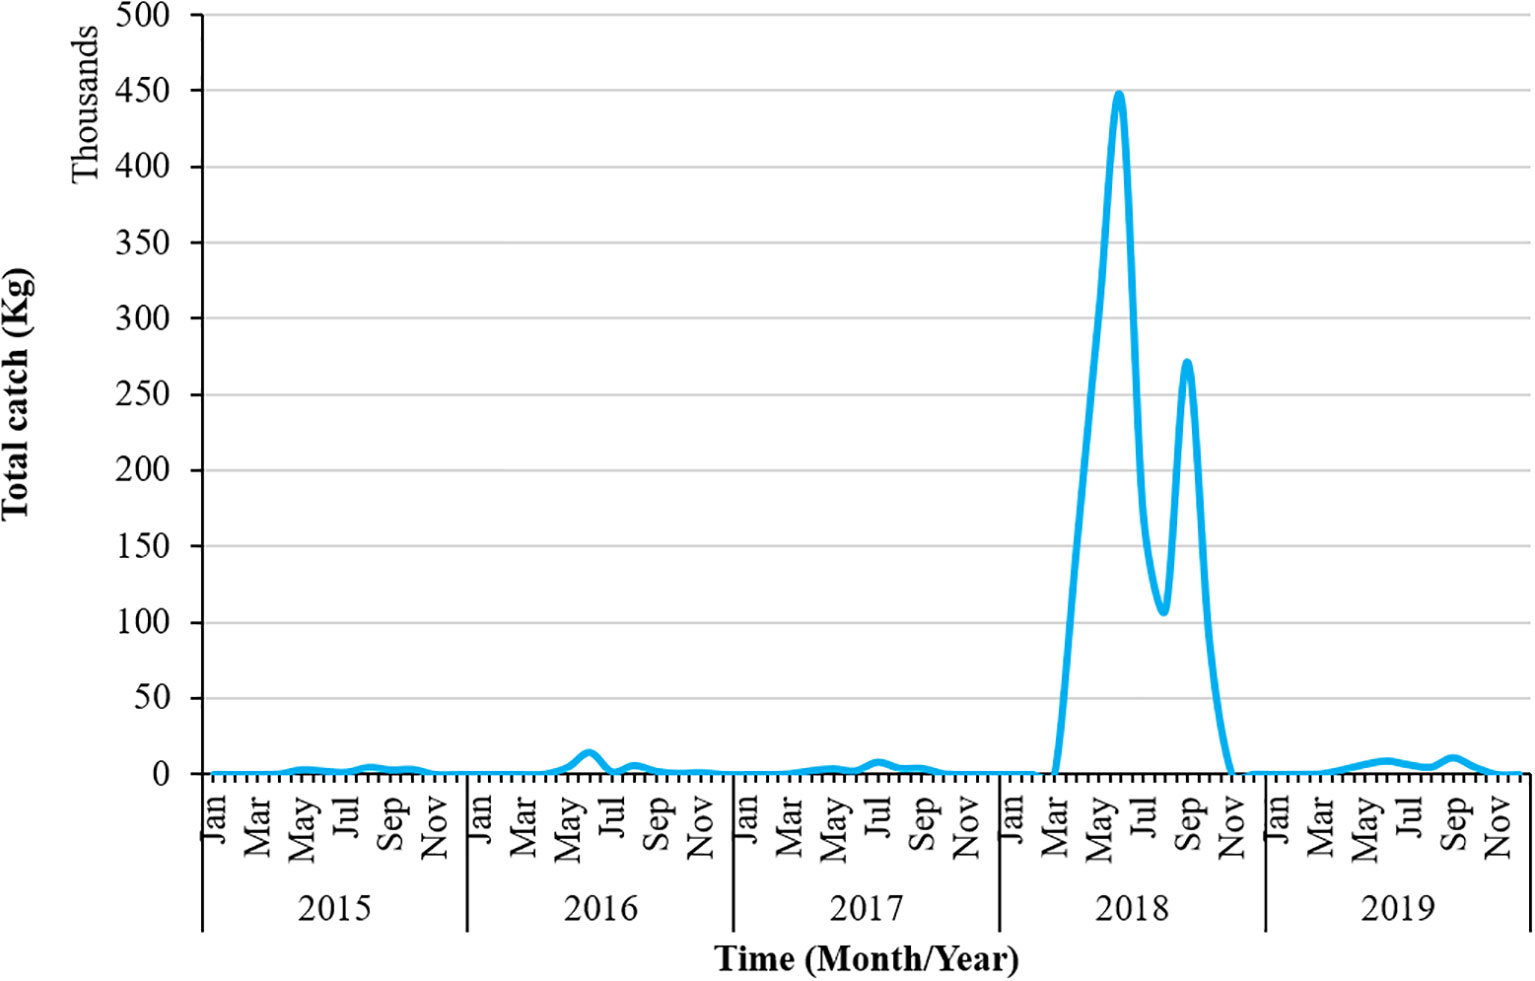
Figure 1 Total catch rate of swordtip squid from 2015 to 2019.
3.2 Multicollinearity among climatic indices by VIF
Figure 2 illustrates multicollinearity among the climate indices, specifically SOI, PDO, Western Pacific Oscillation (WPO), North Pacific Gyre Oscillation (NPGO), (Multivariate El-Niño Southern Oscillation Index version 2 (MEI_V2), and Nino 3.4. MEI_V2 and Nino 3.4 had high collinearity (VIF > 5). Therefore, these factors were eliminated from further analysis. The VIF values (all<2) for the other predictor variables (SOI, PDO, WPO, and NPGO) in the model indicate that multicollinearity was not an issue.
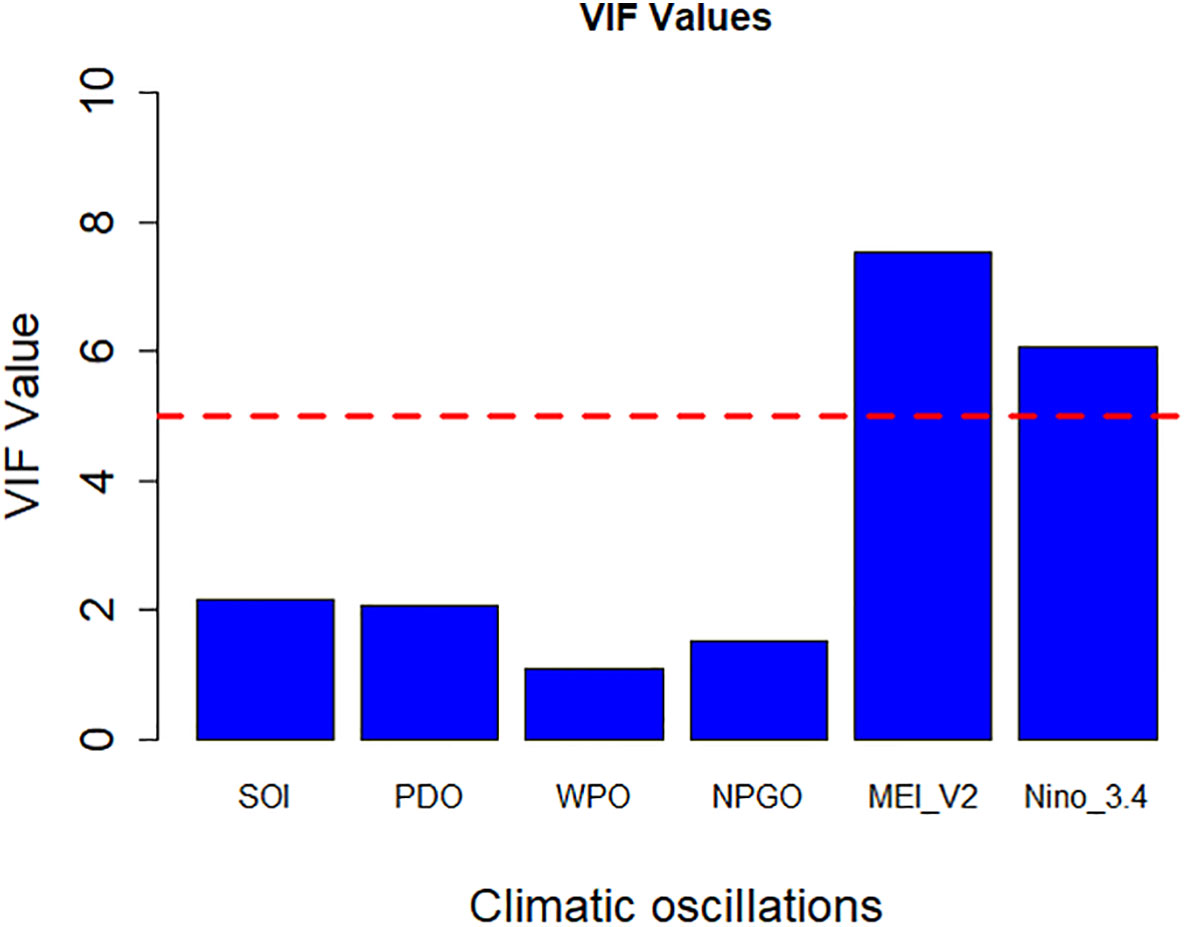
Figure 2 Multicollinearity test among climate indices by VIF. The red dashed line represents the threshold VIF value = 5, beyond the climate indices show severe correlation.
3.3 Influence of climatic indices on catch rate by GAM
The results from Figure 3 and Table 2 indicate the impact of climatic indices on the catch rate. The significance of these findings was determined through a GAM analysis. The highest level of deviance was explained by PDO (31%), followed by NPGO (6.05%), whereas SOI explained the least amount of deviance (0.87%).

Figure 3 Impact of Pacific Decadal Oscillation (PDO), WPO, North Pacific Gyre Oscillation (NPGO), and Southern Oscillation Index (SOI) on the monthly catch rate of swordtip squid. The solid line represents the fitted GAM function, whereas the black dot line represents 95% confidence intervals. The rug plot on the x-axis indicates the relative density of data points.
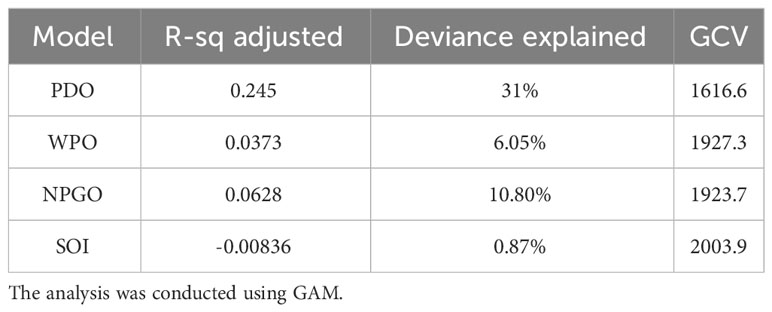
Table 2 Relationship of climatic oscillations on the monthly catch rate of swordtip squid.
3.4 Nominal catch per unit effort standardization by GLM and spatiotemporal variability
Using the GLM, the nominal swordtip CPUE values were standardized to reduce the bias with various causes. Among all climatic oscillations, PDO was used for standardization because it had the highest influence on the catch rate of swordtip squid.
S.CPUE reached its peak in 2018 at approximately 50,000 individuals and reached its lowest point from 2015 to 2016 (Figure 4). The primary fishing season for swordtip squid occurs between April and September. The standardized CPUE reached its peak in June from 2015 to 2019. Specifically, catch rates increased from early spring to late autumn and decreased in winter.
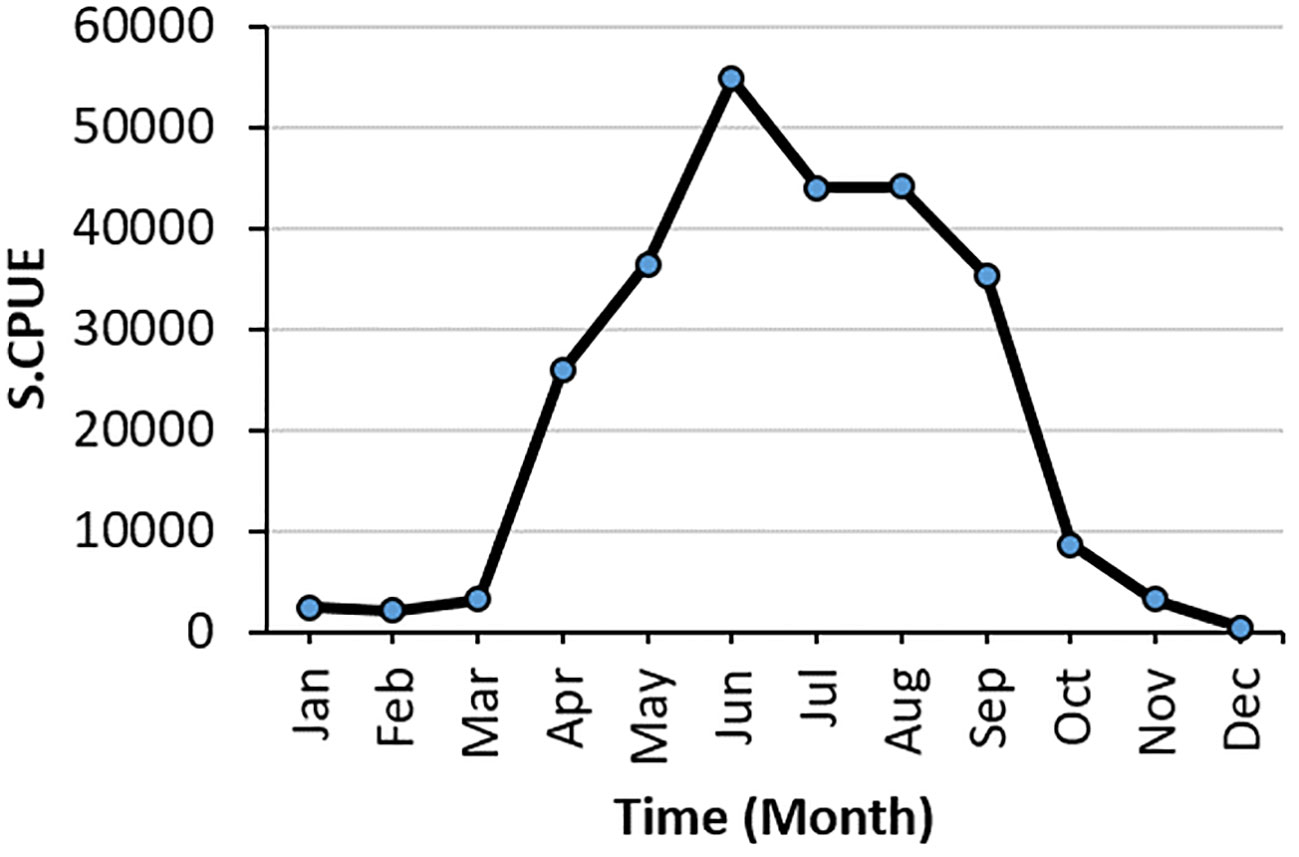
Figure 4 Monthly variation in the sum of S.CPUE of swordtip squid.
3.5 Influence of environmental parameters
The Pearson correlation analysis revealed the correlations among all the seven environmental parameters (Figure 5). Correlation analysis was conducted to examine the relationship among environmental variables. SSH and SST had a higher positive correlation than the other parameters, followed by MLD and SSC and SSTB and SSC. However, SSS and SST exhibited the highest negative correlation, followed by MLD and SST, SSS and SSC, and SSTB and SSS. The other parameter combinations displayed milder positive and negative correlation values. Therefore, the influence of all these parameters on the catch rate was determined using GAM analysis.
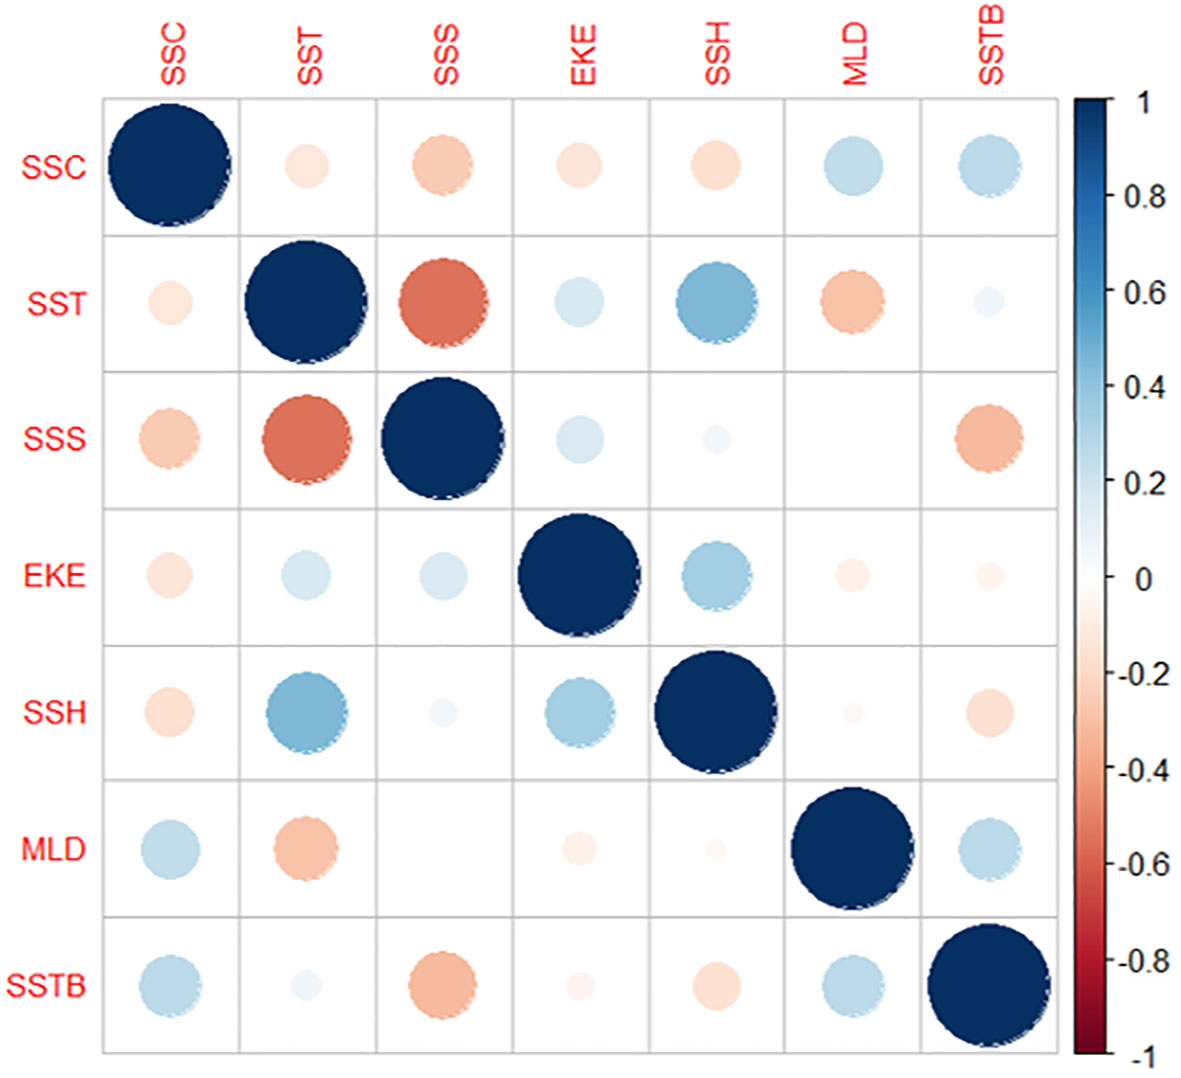
Figure 5 Correlation between various environmental parameters.
Table 3 and Figure 6 present the results of the effects of different environmental parameters on the catch rate calculated using a GAM analysis. SSTB explained the most variation (13%), followed by SSH (12.50%), SSC (11%), and SST (6.48%), whereas SSS (3.80%) and EKE (3.59%) explained the least variation.

Table 3 Swordtip squid catch rates and the influence of monthly environmental fluctuations by generalized additive model (GAM).
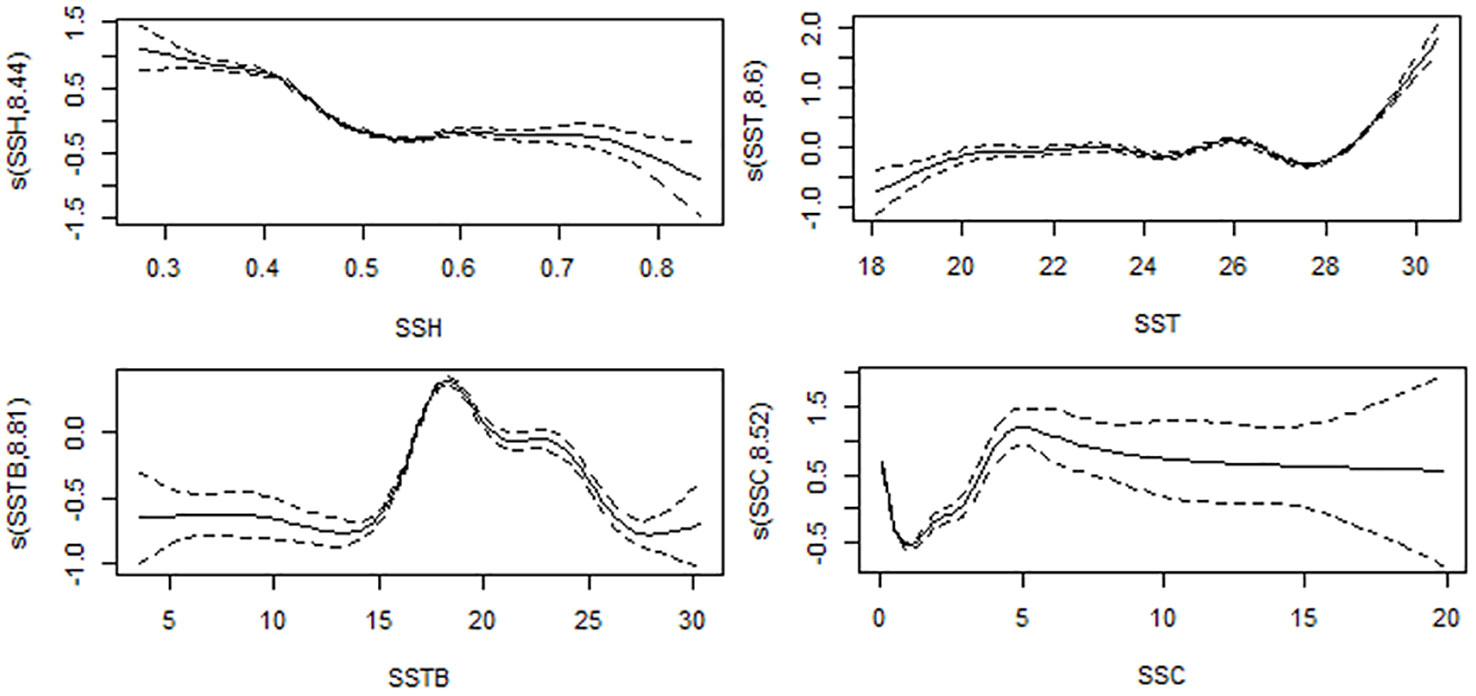
Figure 6 Effects on monthly swordfish catch rates from SSTB, SSH, SSC, and SST. The fitted generalized additive model (GAM) function is shown as a solid line, with 95% confidence intervals as black dot lines.
SSTB, SSH, SSC, and SST exerted the highest influence in GAM analysis; therefore, these four variables were included in the final model for CPUE prediction. Figure 7 depicts the presence or absence of multicollinearity among the final four environmental variables: SSTB, SSH, SSC, and SST. The VIF values (all<1) for all the predictor variables in the model suggest that multicollinearity is not a concern.
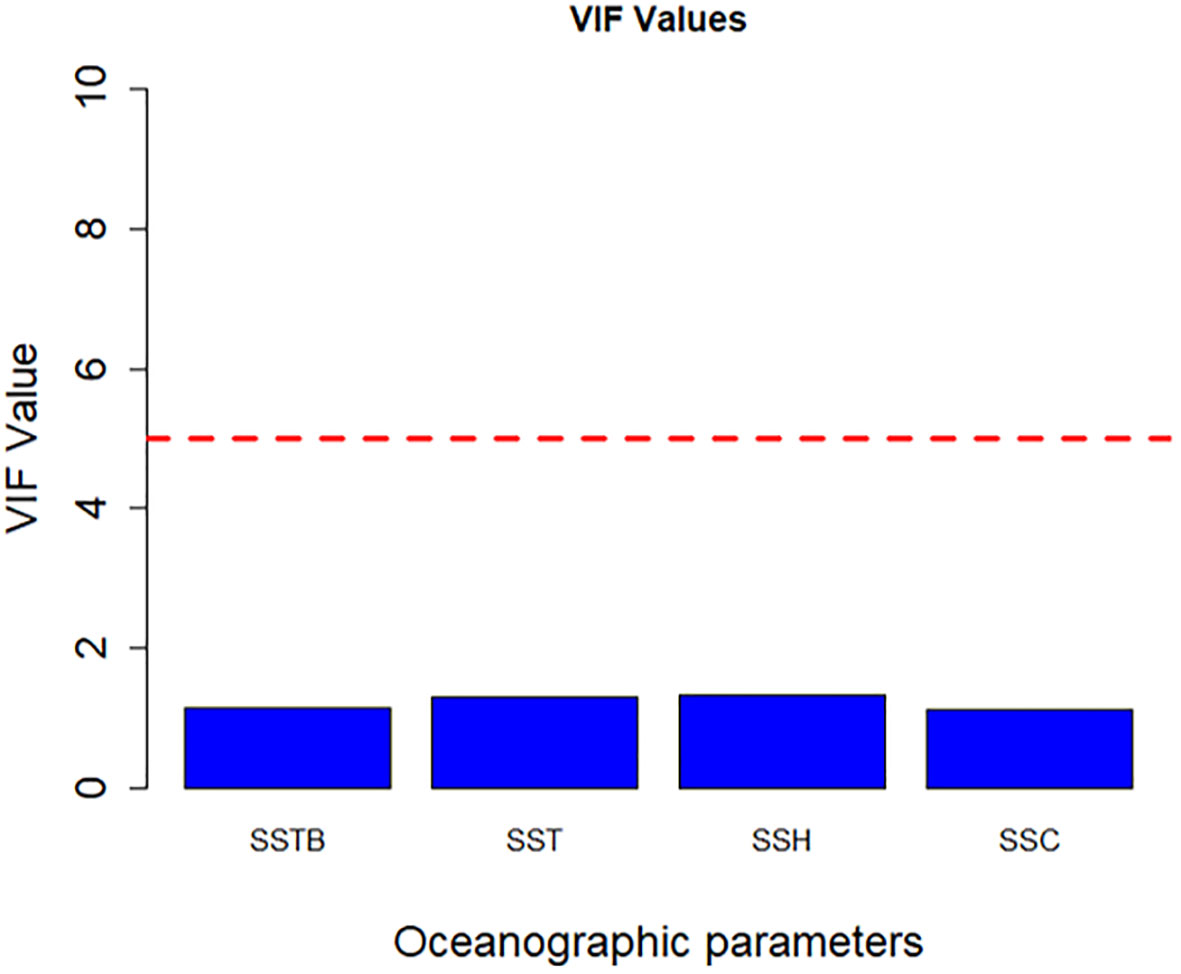
Figure 7 Multicollinearity test was conducted on environmental parameters by using VIF. The red dashed line represents the VIF threshold value of 5, indicating a significant correlation.
3.6 Final prediction model through GAM
The selected GAM accounted for 40.30% of the observed deviance over the years (Table 4). Additionally, the residuals conformed sufficiently to the assumption of a Gaussian distribution, as indicated by the normal quantile–quantile plots (Figure 8). All analyzed variables, including SST, SSTB, SSH, and SSC, were significant predictors. Furthermore, the inclusion of predictor variables at various levels increased the proportion of explained deviance. We observed temporal variations in the catch rates of swordtip squid, as indicated by the interaction between year and month (Figure 9).
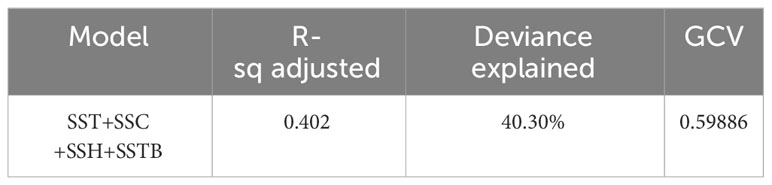
Table 4 Final model for predicting the distribution pattern of swordtip squid by using the selected four remote sensing environmental parameters.

Figure 8 Normal quantile–quantile plot and histogram of the final GAM prediction.
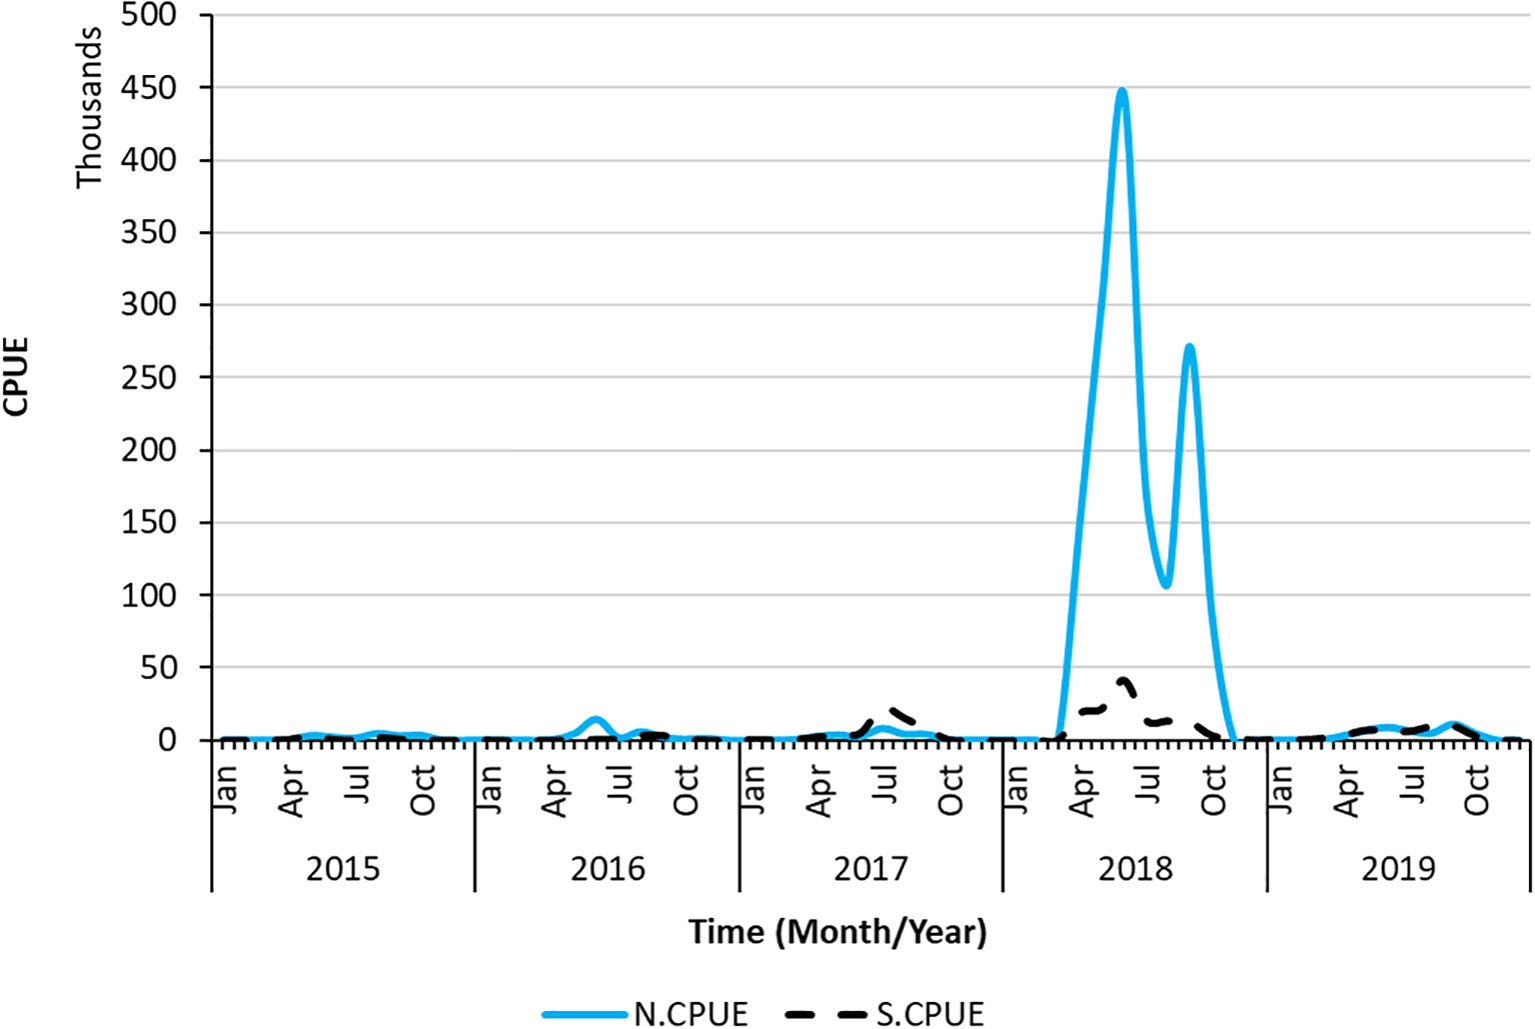
Figure 9 Time series of N.CPUE and S.CPUE data as well as spatiotemporal changes in the sum of S.CPUE.
Catch rates were analyzed by using model-predicted relative abundance maps to investigate temporal and spatial effects as well as the influence of environmental factors on the distribution of swordtip squid (Figure 10). The predicted relative abundance displayed similar trends to catch rates and had significant high correlations with catch rates (R = 0.64).
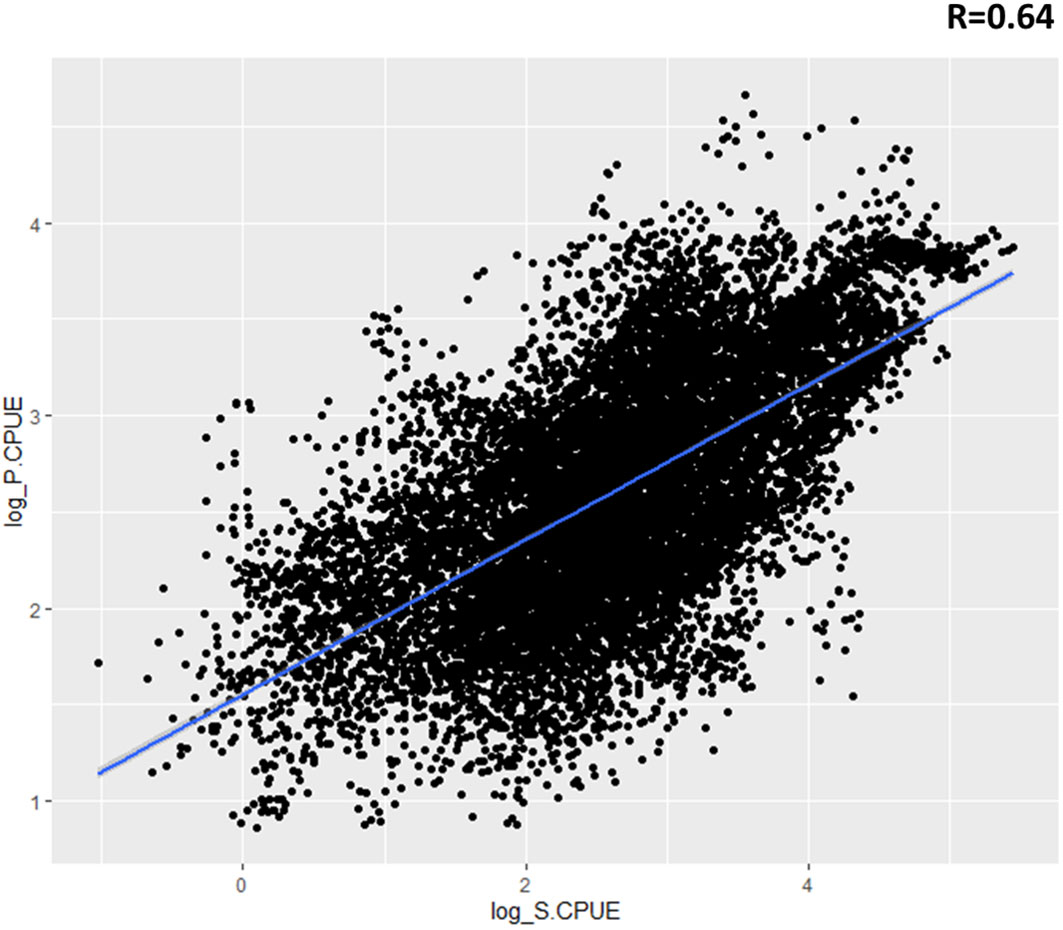
Figure 10 Relationship between standardized catch rate (S.CPUE) of swordtip squid and predicted relative abundance (P.CPUE) of swordtip squid in the study region from 2015 to 2019 by using the selected generalized additive model (GAM).
3.7 Predicted geographical distribution of swordtip squid
Figure 11 displays the monthly mean model-predicted relative abundance in the study region from January to December, with high spatial resolution. Swordtip squid primarily inhabits the shelf north of Taiwan and the Kuroshio front. We observed that from 2015 to 2019, the fishing grounds were primarily located in the northeastern waters of Taiwan, specifically between 25°N and 28°N and between 121.5°E and 125°E. These fishing grounds exhibited both seasonal and annual variations. In spring, the fishing grounds were primarily concentrated at 27–28°N. In late summer and autumn (September–November), they gradually shifted southwestward. During winter, they shifted toward coastal waters. A significant increase in relative abundance was noted in the northern region above 27°N, especially from April to September. However, this abundance decreased from October to March. In August and September, a significant increase in abundance was observed, extending southwestward to encompass the coastal waters of mainland China, and in winter, the fishing grounds were mainly situated in coastal waters. Certain fishing positions were specifically found at approximately 122°E from December to March. The relative abundance of squid was high in northeastern waters of Taiwan during spring and autumn, with a northward shift observed during summer.
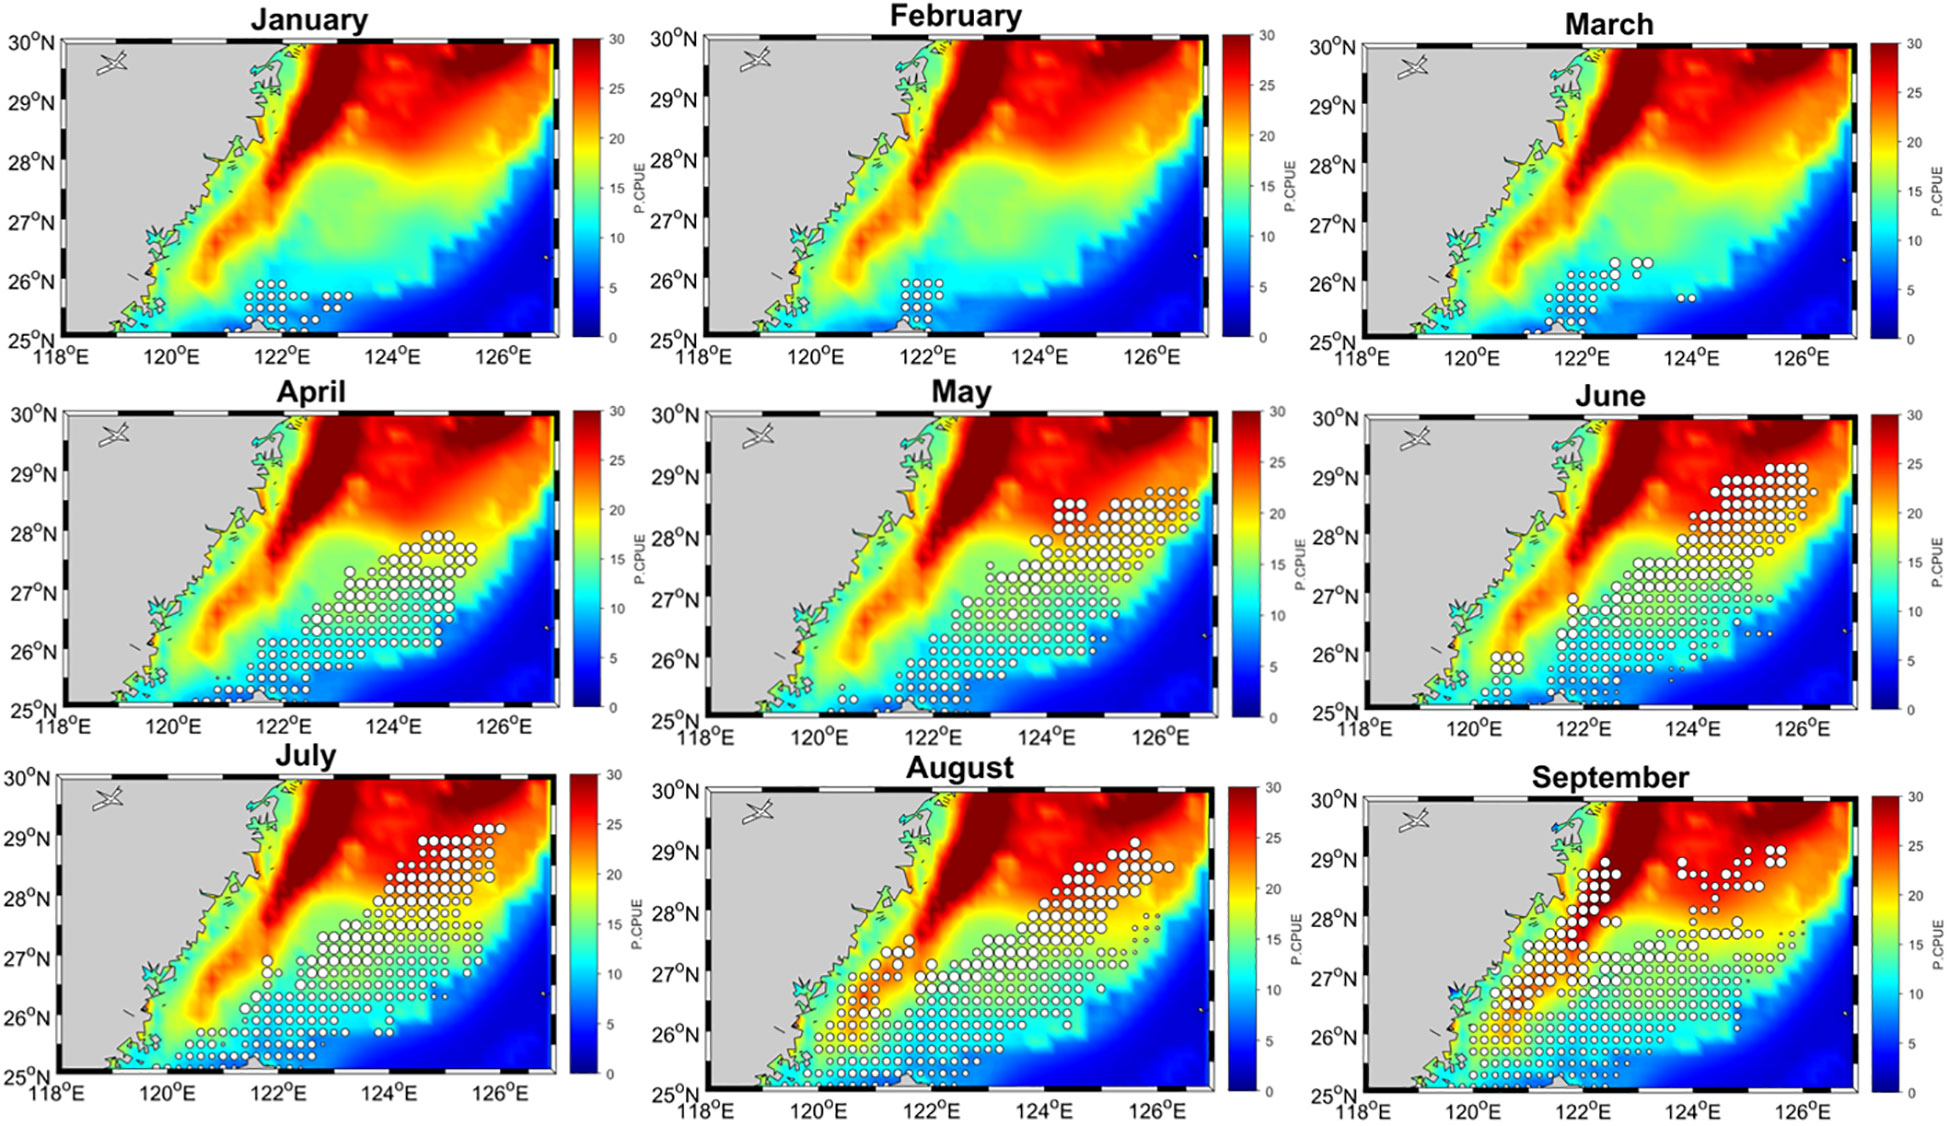
Figure 11 Monthly mean distribution patterns of swordtip squid catch rates (represented by open circles) superimposed on the predicted catch rate (0.1° resolution) in the southern East China Sea from January to December.
4 Discussion
This study modeled the monthly distribution of swordtip squid by using environmental data and climate indices to determine its influence on the catch rate of swordtip squid in Taiwan. The plausible reason for the highest squid total catch in 2018 could be because the coldest phase of the PDO in the same year. This is because negative PDO phase increases mixing of colder, deep ocean waters with warmer surface waters causing more upwelling and higher marine productivity. Previous studies also showed that the PDO and changes in SST in the Northwest Pacific may influence the anchovy population in the central Yellow Sea (Zhou et al., 2015). The main fishing season for swordtip squid occurred between April and September; the peak occurred in June (Figure 1). Meanwhile Figure 6 shows that among seven oceanographic characteristics, SSTB, SSH, SSC, and SST exerted higher influence in GAM analysis. These are the main variables affecting swordtip squid distribution. The influence of monthly six climatic oscillations on the monthly catch rate of swordtip squid was examined, where PDO (31%) exerted the most influence, followed by NPGO (10.8%) and WPO (6.05%) (Figure 3). PDO impacts marine species distribution and abundance, affecting optimal habitats and prey species. It also impacts atmospheric circulation, precipitation patterns, and ocean currents, affecting the structure and dynamics of marine ecosystems. Thus, a reliable index like PDO for species abundance and distribution is crucial to the habitat model. Next, the key environmental variables influencing the habitat preferences of marine species should be identified for ensuring effective fishery management in aquatic ecosystems (Zarkami et al., 2023). Notably, due to the short life span, squid abundance directly depends on the recruitment capacity of the current year, and any changes in environment and food availability will alter the stock status (Vila et al., 2010). Therefore, modeling the potential effects of oceanographic factors on species distribution is crucial for EBFM, as management strategies implemented for one target species, such as swordtip squid, can affect the sustainability of other target (e.g., tuna) or non-target species (Young et al., 2020; Pearman et al., 2020).
The effects of oceanographic factors on swordtip squid are poorly understood. Zhang et al. (2022) reported that three environmental variables affect the neon flying squid habitat in the Northwest Pacific Ocean—SST, seawater temperature at 50-m depth (T50 m), and SSC—in association with anti-cyclonic eddies (warm core). Our data indicated that swordtip squid preferred SSTB ranges of 15–18°C and SST of 24–28°C. Temperature is a dominant factor affecting the distribution of different species of squid (Postuma and Gasalla, 2010; Yu et al., 2015; Yamaguchi et al., 2020a; Fang et al., 2021; Wang et al., 2021; Yamaguchi et al., 2022; Fang et al., 2023; Wang et al., 2023, Yu et al., 2019b, Yu et al., 2022) and fish (Vayghan et al., 2016; Teng et al., 2021; Mammel et al., 2022; Vayghan and Lee, 2022; Zarkami et al., 2023). The SSTB is a crucial environmental component that significantly impacts the distribution, behavior, and ecological dynamics of squid. Studying the correlation between the temperature of the ocean floor and squid may provide significant knowledge for the management of fisheries, conservation initiatives, and forecasts of how squid populations would react to changes in environmental circumstances (Wang et al., 2022). Notably, temperature changes influence the growth and development of the squid reproductive system (Boavida-Portugal et al., 2010; Wang et al., 2013; Pang et al., 2020). Embryo development, hatching, and juveniles’ growth depend on water temperature (Moreno et al., 2012), thus regulating the recruitment capacity of the squid population (Challier et al., 2005) and affecting the CPUE for squid (Wang et al., 2021) and fish stock (Wang et al., 2013; Porcaro et al., 2014). In winter, squid migrates to warmer environments to ensure their feeding and growth in southern Taiwan (Wang et al., 2021; Cheng et al., 2022; Yamaguchi et al., 2022; Fang et al., 2023; Yu et al., 2019c), and this species moves back northward in summer. Overall, seawater temperature strongly influences swordtip squid habitat, growth, maturation, and fishing ground, and this variable should be highly considered in future habitat studies in relation to climate change.
Many studies have used SSH, ocean circulation, and other indices to develop a habitat model for squid (Alabia et al., 2020a; Alabia et al., 2015; Fei et al., 2022; Yu et al., 2019d). In the present study, the optimum SSH range for swordtip squid in the study region varied between 0.4-0.6 m. SSH is linked to ocean’s vertical structure, including the thermocline, which influences nutrient distribution. Changes in SSH can affect the depth of the thermocline, affecting nutrient availability and fish distribution. Upwelling and down-welling processes attract fish to areas with increased food availability and biological productivity. Understanding the relationship between SSH and favorable conditions is crucial for predicting fish distribution and assessing marine ecosystem health (Mondal et al., 2022, Mondal et al., 2023).
SSC reflects the phytoplankton stock and is assumed to have an indirect association with the spatiotemporal distribution of squid species; thus, SSC has been frequently used as an environmental variable in habitat models (Igarashi et al., 2018; Wang et al., 2021; Zhang et al., 2022; Ito et al., 2023). Phytoplankton is a key element of marine primary productivity and is a feeding source of zooplankton and some marine organisms, reflecting the primary productivity level of the sea (Pitchaikani and Lipton, 2016; Bacha et al., 2017). In general, many small pelagic fishes commonly prey on zooplankton such as copepods, which are crucial food sources for juvenile swordtip squid (Yagi et al., 2011; Ito et al., 2023), whereas the main prey of the adult squid is small pelagic fishes. Furthermore, studies have applied primary production data sets in habitat models to evaluate habitat preferences and main fishing grounds in different ecosystem (Liu et al., 2022; Mammel et al., 2022; Mondal et al., 2022; Mondal et al., 2023; Teng et al., 2021; Vayghan and Lee, 2022; Semedi et al., 2023; Zarkami et al., 2023). The fact that climate warming leads to shallowing of the mixed layer, lower phytoplankton bloom, and overall duration (Gittings et al., 2018) can influence the future habitat of aquatic organism must be considered for swordtip squid habitat management.
Moreover, ocean currents have been used to monitor swordtip squid habitat and migration in Pacific Ocean and mainly East China Sea and Taiwan (Yamaguchi et al., 2015; Yamaguchi et al., 2018; Yamaguchi et al., 2019; Yamaguchi et al., 2020a; Li et al., 2021; Yamaguchi et al., 2021; Ito et al., 2023; Li et al., 2023). In this study, the main ocean currents affecting swordtip squid were the Kuroshio Branch Current in the western continental shelf of the East China Sea, China coastal current, and Taiwan Warm Current (Qi et al., 2017; Li et al., 2023). Currents may affect the life span of cephalopods through variations in water temperature and salinity (O'Dor et al., 2002; Wang et al., 2021), thus influencing fish migration and feeding (Brodersen et al., 2008). In addition, currents aid in the dispersion of fertilized eggs and paralarva, which have weak active swimming ability in their early life, through the upper and middle layers of ocean, thus enhancing their early-stage development (Yamaguchi et al., 2018; Li et al., 2021; Li et al., 2023). Monsoon greatly affected the seasonal variations of the strength of different ocean currents, especially in seasonal transition stages (Qi et al., 2017), and influenced the paralarva of cephalopods as they passively transitioned through the planktonic state. Consistent with our results, Wang et al. (2021) reported high CPUE in areas with a velocity between 0.2–0.3 m s-1 for ocean currents, indicating that these areas were suitable habitats. Overall, the characteristics and seasonal variations of the currents affected the migration routes of fishing groups (Yamaguchi et al., 2020a; Yamaguchi et al., 2021). Li et al. (2023) provided a comprehensive discussion of the effects of the currents on the seasonal migration routes of swordtip squid. However, unsuitable current velocity or the physicochemical properties of ocean currents may result in damage to eggs and paralarva, affecting the early growth and development of larva (Yamaguchi et al., 2021) or increasing energy consumption in adult squids.
Climate warming has numerous effects on the marine environment, inducing rapid changes from the phytoplankton scale (Gittings et al., 2018; Lewis et al., 2020) to the scale of apex predators (Erauskin-Extramiana et al., 2019; Mondal, et al., 2023) and mammals (Silber et al., 2017; Albouy et al., 2020), finally triggering the global reorganization of marine life (Alabia et al., 2020a). In this study, we observed that the climatic oscillations PDO, NPGO, and WPO exerted significant influence, making them a potential sign of the effects of climate change in Pacific Ocean on the standardized CPUE for swordtip squid. Increasing research efforts in ocean and fishery sciences can lead to a better understanding of how climate change can influence marine species at different levels, such as their physiology (Farrell et al., 2009; Hollowed et al., 2013), distribution (Kleisner et al., 2017; Pinsky et al., 2018), and migration patterns (Dufour et al., 2010), finally affecting ecology dynamics (Tamario et al., 2019; Hansen et al., 2020), fishery production (Plagányi, 2019), and marine biodiversity (Worm and Lotze, 2021). These consequences could decrease the efficacy of marine resource management policies, likely also challenging the efficacy of single-species management models (Pentz and Klenk, 2023). Therefore, the impact of climate change extends far beyond the marine environment and the fishery sector to food systems and food security (Dawson et al., 2016; Myers et al., 2017), agricultural production (Müller et al., 2011), national security and geopolitics (Greaves, 2019), global biodiversity (Nunez et al., 2019), and many others aspects not yet discovered. Crozier et al. (2021) stated that the population of early-life-stage salmon will decline rapidly in response to climate change. Huang et al. (2021) also reviewed the effects of climate change on fish growth and concluded its negative impact at both global and local scales. Future poleward shifts of boreal species in response to climate change and changes in marine biodiversity by century end (2076–2100) have also been reported (Alabia et al., 2020b), where a PDO shift significantly affects the favorable foraging habitat of large oceanic squid (Alabia et al., 2020b). Therefore, habitat modeling of swordtip squid requires the implementation of plans of action by managers and stakeholders to balance future commercial fishery production where stock management and fishing limitation plans can be defined by considering climate scenarios. In 2008, Di Lorenzo et al. (2008) developed a correlation between the NPGO index and changes in salinity, nitrate, and SSC concentrations. This association indicates a connection between the NPGO index and fluctuations in winds that promote upwelling. Prior research has shown robust correlations between fish catches and climate indicators that impact ocean productivity and eddy activity, including NPGO, PDO, and WPO. They have significant biological impacts in the high and mid-latitude regions of the Northeast Pacific and Northwest Pacific.
To address the urgent need for more ambitious measures to prevent harmful climate change, the Sustainable Development Goals (SDGs) pertaining to climate change have been established, along with the inclusion of climate change as a driver of disaster risk (Diz et al., 2019). Humans benefit from a healthy ocean in many ways, such as the supply of food and raw materials, control over regional climates, development and job opportunities, and the preservation of culturally significant locations (Lynch et al., 2020. The SDGs comprise a broad range of direct objectives that can be accomplished through the current study, including the mitigation and sustainable use of marine resources (SDG 14) and the establishment of regulations for climate change adaptation (SDG 13). Indirect objectives include the eradication of hunger and poverty (SDG 1), among many others.
5 Conclusion
This study on swordtip squid in Taiwan’s waters used remote sensing data, climate indices, and catch data to model their habitat preferences. Four oceanographic characteristics, including bottom sea temperature, sea surface height, and sea surface chlorophyll, were found to affect distribution. The study also considered six climatic oscillations, with Pacific Decadal Oscillation being the most significant. The findings suggest that habitat trend modeling could help establish sustainable fisheries and food supplies management strategies. The study emphasizes the importance of considering habitat transformation and climate change for the sustainability of ocean resources from social and ecological perspectives. Adaptive stock research based on habitat trend association can help reduce bias and enable sustainable fishery management.
Data availability statement
The raw data supporting the conclusions of this article will be made available by the authors, without undue reservation.
Author contributions
AH: Conceptualization, Supervision, Validation, Visualization, Writing – review & editing. AR: Methodology, Project administration, Software, Writing – original draft. SM: Conceptualization, Data curation, Formal analysis, Validation, Visualization, Writing – review & editing. M-AL: Funding acquisition, Investigation, Project administration, Resources, Supervision, Writing – review & editing.
Funding
The author(s) declare financial support was received for the research, authorship, and/or publication of this article. This study was sponsored partly by a research grant from the National Science and Technology Council of Taiwan (NSTC 112-2611-M-019 -021 and 112-2811-M-019 -004) and the Fisheries Agency of the Ministry of Agriculture, Executive Yuan, ROC.
Acknowledgments
The first author (AH) thanks Iran’s National Elites Foundation and Urmia University. This manuscript was edited by Wallace Academic Editing.
Conflict of interest
The authors declare that the research was conducted in the absence of any commercial or financial relationships that could be construed as a potential conflict of interest.
Publisher’s note
All claims expressed in this article are solely those of the authors and do not necessarily represent those of their affiliated organizations, or those of the publisher, the editors and the reviewers. Any product that may be evaluated in this article, or claim that may be made by its manufacturer, is not guaranteed or endorsed by the publisher.
References
Agnew D. J., Hill S., Beddington J. R. (2000). Predicting the recruitment strength of an annual squid stock: Loligo gahi around the Falkland Islands. Can. J. Fisheries Aquat. Sci. 57 (12), 2479–2487. doi: 10.1139/f00-240
Alabia I. D., Molinos J. G., Saitoh S.-I., Hirata T., Hirawake T., Mueter F. J. (2020a). Multiple facets of marine biodiversity in the Pacific Arctic under future climate. Sci. Total Environ. 744, 140913. doi: 10.1016/j.scitotenv.2020.140913
Alabia I. D., Saitoh S.-I., Igarashi H., Ishikawa Y., Imamura Y. (2020b). Spatial habitat shifts of oceanic cephalopod (Ommastrephes bartramii) in oscillating climate. Remote Sens. 12 (3), 521. doi: 10.3390/rs12030521
Alabia I. D., Saitoh S.-I., Mugo R., Igarashi H., Ishikawa Y., Usui N., et al. (2015). Seasonal potential fishing ground prediction of neon flying squid (Ommastrephes bartramii) in the western and central North Pacific. Fisheries Oceanography 24 (2), 190–203. doi: 10.1111/fog.12102
Albouy C., Delattre V., Donati G., Frölicher T. L., Albouy-Boyer S., Rufino M., et al. (2020). Global vulnerability of marine mammals to global warming. Sci. Rep. 10 (1), 548. doi: 10.1038/s41598-019-57280-3
Alfonso S., Gesto M., Sadoul B. (2021). Temperature increase and its effects on fish stress physiology in the context of global warming. J. Fish Biol. 98 (6), 1496–1508. doi: 10.1111/jfb.14599
Andrews A. J., Pampoulie C., Di Natale A., Addis P., Bernal-Casasola D., Aniceti V., et al. (2023). ). Exploitation shifted trophic ecology and habitat preferences of Mediterranean and Black Sea bluefin tuna over centuries. Fish Fisheries 24 (6), 1067–1083. doi: 10.1111/faf.12785
Arkhipkin A. I., Rodhouse P. G., Pierce G. J., Sauer W., Sakai M., Allcock L., et al. (2015). World squid fisheries. Rev. Fisheries Sci. Aquaculture 23 (2), 92–252. doi: 10.1080/23308249.2015.1026226
Arneth A., Shin Y.-J., Leadley P., Rondinini C., Bukvareva E., Kolb M., et al. (2020). Post-2020 biodiversity targets need to embrace climate change. Proc. Natl. Acad. Sci. 117 (49), 30882–30891. doi: 10.1073/pnas.2009584117
Auber A., Travers-Trolet M., Villanueva M. C., Ernande B. (2015). Regime shift in an exploited fish community related to natural climate oscillations. PloS one 10 (7), e0129883.
Bacha M., Jeyid M. A., Vantrepotte V., Dessailly D., Amara R. (2017). Environmental effects on the spatio-temporal patterns of abundance and distribution of Sardina pilchardus and sardinella off the Mauritanian coast (North-West Africa). Fisheries Oceanography 26 (3), 282–298. doi: 10.1111/fog.12192
Báez J. C., Czerwinski I. A., Ramos M. L. (2020). Climatic oscillations effect on the yellowfin tuna (Thunnus albacares) Spanish captures in the Indian Ocean. Fisheries Oceanography 29 (6), 572–583. doi: 10.1111/fog.12496
Bani A., Haghi Vayghan A., NaserAlavi M. (2016). The effects of salinity on reproductive performance and plasma levels of sex steroids in Caspian kutum Rutilus frisii kutum. Aquaculture Res. 47 (10), 3119–3126. doi: 10.1111/are.12762
Barman K. K., Bora S. N. (2021). Scattering and trapping of water waves by a composite breakwater placed on an elevated bottom in a two-layer fluid flowing over a porous sea-bed. Appl. Ocean Res. 113, 102544. doi: 10.1016/j.apor.2021.102544
Barman K. K., Chanda A., Tsai C. C. (2023). A mathematical study of a two-layer fluid flow system in the presence of a floating breakwater in front of VLFS. Appl. Math. Model 122, 706–730. doi: 10.1016/j.apm.2023.06.017
Boavida-Portugal J., Moreno A., Gordo L., Pereira J. (2010). Environmentally adjusted reproductive strategies in females of the commercially exploited common squid Loligo vulgaris. Fisheries Res. 106 (2), 193–198. doi: 10.1016/j.fishres.2010.06.002
Brodersen J., Nilsson P. A., Ammitzbøll J., Hansson L.-A., Skov C., Brönmark C. (2008). Optimal swimming speed in head currents and effects on distance movement of winter-migrating fish. PloS One 3 (5), e2156. doi: 10.1371/journal.pone.0002156
Challier L., Royer J., Pierce G. J., Bailey N., Roel B., Robin J.-P. (2005). Environmental and stock effects on recruitment variability in the English Channel squid Loligo forbesi. Aquat. Living Resour. 18 (4), 353–360. doi: 10.1051/alr:2005024
Chanda A., Bora S. N. (2020). Effect of a porous sea-bed on water wave scattering by two thin vertical submerged porous plates. Eur. J. Mechanics-B/Fluids 84, 250–261. doi: 10.1016/j.euromechflu.2020.06.009
Chanda A., Pramanik S. (2023). Effects of a thin vertical porous barrier on the water wave scattering by a porous breakwater. Phys. Fluids 35 (6), 212001–212015. doi: 10.1063/5.0153109
Chen F. (2016). Survey of mitre squid resource in Minnan-Taiwan bank fishing ground and suggestions for sustainable utilization. Fish. Inform. Strategy 31, 270–277.
Chen J.-Y., Ching T.-Y., Chen C.-S. (2022). Inter-annual variability in growth and maturation of the swordtip squid Uroteuthis edulis in Yilan Bay off northeastern Taiwan. J. Mar. Sci. Technol. 30 (2), 158–171. doi: 10.51400/2709-6998.2573
Chen X. J., Zhao X. H., Chen Y. (2007). Influence of El Niño/La Niña on the western winter–spring cohort of neon flying squid (Ommastrephes bartramii) in the northwestern Pacific Ocean. ICES J. Mar. Sci. 64 (6), 1152–1160. doi: 10.1093/icesjms/fsm103
Cheng Y.-C., Jan S., Chen C.-C. (2022). Kuroshio intrusion and its impact on swordtip squid (Uroteuthis edulis) abundance in the Southern East China sea. Front. Mar. Sci. 9, 810. doi: 10.3389/fmars.2022.900299
Choi J., Son S.-W. (2022). Seasonal-to-decadal prediction of El niño–southern oscillation and pacific decadal oscillation. NPJ Climate Atmospheric Sci. 5 (1). doi: 10.3389/fmars.2022.900299
Crozier L. G., Burke B. J., Chasco B. E., Widener D. L., Zabel R. W. (2021). Climate change threatens Chinook salmon throughout their life cycle. Commun. Biol. 4 (1), 222. doi: 10.1038/s42003-021-01734-w
Dawson T. P., Perryman A. H., Osborne T. M. (2016). Modelling impacts of climate change on global food security. Climatic Change 134, 429–440. doi: 10.1007/s10584-014-1277-y
Di Lorenzo E., Schneider N., Cobb K. M., Franks P. J. S., Chhak K., Miller A. J., et al. (2008). North Pacific Gyre Oscillation links ocean climate and ecosystem change. Geophysical Res. Lett. 35 (8), L0860701–L08607. doi: 10.1029/2007GL032838
Diz D., Morgera E., Wilson M. (2019). Marine policy special issue: SDG synergies for sustainable fisheries and poverty alleviation. Mar. Policy 110, 102860. doi: 10.1016/j.marpol.2017.08.020
Dufour F., Arrizabalaga H., Irigoien X., Santiago J. (2010). Climate impacts on albacore and bluefin tunas migrations phenology and spatial distribution. Prog. Oceanography 86 (1-2), 283–290. doi: 10.1016/j.pocean.2010.04.007
Erauskin-Extramiana M., Arrizabalaga H., Hobday A. J., Cabré A., Ibaibarriaga L., Arregui I., et al. (2019). Large-scale distribution of tuna species in a warming ocean. Global Change Biol. 25 (6), 2043–2060. doi: 10.1111/gcb.14630
Fang Z., Han P., Wang Y., Chen Y., Chen X. (2021). Interannual variability of body size and beak morphology of the squid Ommastrephes bartramii in the North Pacific Ocean in the context of climate change. Hydrobiologia 848 (6), 1295–1309. doi: 10.1007/s10750-021-04528-7
Fang X., Zhang Y., Yu W., Chen X. (2023). Geographical distribution variations of Humboldt squid habitat in the Eastern Pacific Ocean. . Ecosystem Health Sustainability 9, 10. doi: 10.34133/ehs.0010
Farrell A., Eliason E., Sandblom E., Clark T. (2009). Fish cardiorespiratory physiology in an era of climate change. Can. J. Zoology 87 (10), 835–851. doi: 10.1139/Z09-092
Fei Y., Yang S., Fan W., Shi H., Zhang H., Yuan S. (2022). Relationship between the spatial and temporal distribution of squid-jigging vessels operations and marine environment in the North Pacific ocean. J. Mar. Sci. Eng. 10 (4), 550. doi: 10.3390/jmse10040550
Ferreira-Martins D., Coimbra J., Antunes C., Wilson J. (2016). Effects of salinity on upstream-migrating, spawning sea lamprey, Petromyzon marinus. Conserv. Physiol. 4 (1), cov064. doi: 10.1093/conphys/cov064
Gittings J. A., Raitsos D. E., Krokos G., Hoteit I. (2018). Impacts of warming on phytoplankton abundance and phenology in a typical tropical marine ecosystem. Sci. Rep. 8 (1), 2240. doi: 10.1038/s41598-018-20560-5
Gong C., Chen X., Gao F., Yu W. (2021). The change characteristics of potential habitat and fishing season for neon flying squid in the northwest Pacific ocean under future climate change scenarios. Mar. Coast. Fisheries 13 (5), 450–462. doi: 10.1002/mcf2.10170
Greaves W. (2019). Arctic break up: Climate change, geopolitics, and the fragmenting Arctic security region. Arctic Yearbook 2019: Redefining Arctic Secur., 1–17.
Grinsted A., Moore J. C., Jevrejeva S. (2004). Application of the cross wavelet transform and wavelet coherence to geophysical time series. Nonlinear processes geophysics 11 (5/6), 561–566. doi: 10.5194/npg-11-561-2004
Haghi Vayghan A., Fazli H., Ghorbani R., Lee M.-A., Saravi H. N. (2016). Temporal habitat suitability modeling of Caspian shad (Alosa spp.) in the southern Caspian Sea. J. Limnology 75 (1), 210–223. doi: 10.4081/jlimnol.2015.1215
Hansen J. H., Skov C., Baktoft H., Brönmark C., Chapman B. B., Hulthén K., et al. (2020). Ecological consequences of animal migration: Prey partial migration affects predator ecology and prey communities. Ecosystems 23, 292–306. doi: 10.1007/s10021-019-00402-9
Hollowed A. B., Barange M., Beamish R. J., Brander K., Cochrane K., Drinkwater K., et al. (2013). Projected impacts of climate change on marine fish and fisheries. ICES J. Mar. Sci. 70 (5), 1023–1037. doi: 10.1093/icesjms/fst081
Hsieh C. H., Chen C. S., Chiu T. S., Lee K. T., Shieh F. J., Pan J. Y., et al. (2009). Time series analyses reveal transient relationships between abundance of larval anchovy and environmental variables in the coastal waters southwest of Taiwan. Fisheries Oceanography 18 (2), 102–117. doi: 10.1111/j.1365-2419.2008.00498.x
Huang M., Ding L., Wang J., Ding C., Tao J. (2021). The impacts of climate change on fish growth: A summary of conducted studies and current knowledge. Ecol. Indic. 121, 106976. doi: 10.1016/j.ecolind.2020.106976
Hunsicker M. E., Essington T. E., Watson R., Sumaila U. R. (2010). The contribution of cephalopods to global marine fisheries: can we have our squid and eat them too?. Fish and fisheries 11 (4), 421–438.
Igarashi H., Saitoh S. I., Ishikawa Y., Kamachi M., Usui N., Sakai M., et al. (2018). Identifying potential habitat distribution of the neon flying squid (Ommastrephes bartramii) off the eastern coast of Japan in winter. Fisheries Oceanography 27 (1), 16–27. doi: 10.1111/fog.12230
Ito T., Takayama K., Hirose N. (2023). Prediction of potential fishing grounds of swordtip squid (Uroteuthis edulis) based on a physical–biochemical coupled model. Fisheries Oceanography 32 (6), 559–570. doi: 10.1111/fog.12652
Jiajia L., Jintao W., Xinjun C., Lin L., Changtao G. (2020). Spatio-temporal variation of Ommastrephes bartramii resources (winter & spring groups) in Northwest Pacific under different climate modes. 南方 水 产 科 学 16 (2), 62–69. doi: 10.12131/20190175
Jiang L.-Q., Carter B. R., Feely R. A., Lauvset S. K., Olsen A. (2019). Surface ocean pH and buffer capacity: past, present and future. Sci. Rep. 9 (1), 18624. doi: 10.1038/s41598-019-55039-4
Jin Y., Li N., Chen X., Liu B., Li J. (2019). Comparative age and growth of Uroteuthis chinensis and Uroteuthis edulis from China Seas based on statolith. Aquaculture Fisheries 4 (4), 166–172. doi: 10.1016/j.aaf.2019.02.002
Johnson Z. F., Chikamoto Y., Wang S.-Y. S., McPhaden M. J., Mochizuki T. (2020). Pacific decadal oscillation remotely forced by the equatorial Pacific and the Atlantic Oceans. Climate Dynamics 55, 789–811. doi: 10.1007/s00382-020-05295-2
Kleisner K. M., Fogarty M. J., McGee S., Hare J. A., Moret S., Perretti C. T., et al. (2017). Marine species distribution shifts on the US Northeast Continental Shelf under continued ocean warming. Prog. Oceanography 153, 24–36. doi: 10.1016/j.pocean.2017.04.001
Kroeker K. J., Sanford E. (2022). Ecological leverage points: species interactions amplify the physiological effects of global environmental change in the ocean. Annu. Rev. Mar. Sci. 14, 75–103. doi: 10.1146/annurev-marine-042021-051211
Lewis K., Van Dijken G., Arrigo K. R. (2020). Changes in phytoplankton concentration now drive increased Arctic Ocean primary production. Science 369 (6500), 198–202. doi: 10.1126/science.aay8380
Lezama-Ochoa N., Murua H., Hall M., Román M., Ruiz J., Vogel N., et al. (2017). Biodiversity and habitat characteristics of the bycatch assemblages in fish aggregating devices (FADs) and school sets in the eastern Pacific Ocean. Front. Mar. Sci. 4. doi: 10.3389/fmars.2017.00265
Li N., Fang Z., Chen X., Feng Z. (2021). Preliminary study on the migration characteristics of swordtip squid (Uroteuthis edulis) based on the trace elements of statolith in the East China Sea. Regional Stud. Mar. Sci. 46, 101879. doi: 10.1016/j.rsma.2021.101879
Li N., Han P., Wang C., Chen X., Fang Z. (2023). Migration routes of the swordtip squid Uroteuthis edulis in the East China Sea determined based on the statolith trace element information. Hydrobiologia 850 (4), 861–880. doi: 10.1007/s10750-022-05129-8
Liao C.-H., Lee M.-A., Lan Y.-C., Lee K.-T. (2006). The temporal and spatial change in position of squid fishing ground in relation to oceanic features in the northeastern waters of Taiwan. 臺 灣 水 產 學 會 刊 33 (2), 99–113. doi: 10.29822/JFST.200606.0002
Lin D., Zhu K., Qian W., Punt A. E., Chen X. (2020). Fatty acid comparison of four sympatric loliginid squids in the northern South China Sea: Indication for their similar feeding strategy. PloS One 15 (6), e0234250. doi: 10.1371/journal.pone.0234250
Liu S., Liu Y., Li J., Cao C., Tian H., Li W., et al. (2022). Effects of oceanographic environment on the distribution and migration of Pacific saury (Cololabis saira) during main fishing season. Sci. Rep. 12 (1), 13585. doi: 10.1038/s41598-022-17786-9
Lønborg C., Carreira C., Jickells T., Álvarez-Salgado X. A. (2020). Impacts of global change on ocean dissolved organic carbon (DOC) cycling. Front. Mar. Sci. 7. doi: 10.3389/fmars.2020.00466
Lynch A. J., Elliott V., Phang S. C., Claussen J. E., Harrison I., Murchie K. J., et al. (2020). Inland fish and fisheries integral to achieving the Sustainable Development Goals. Nat. Sustainability 3 (8), pp.579–pp.587. doi: 10.1038/s41893-020-0517-6
Mammel M., Lee M.-A., Naimullah M., Liao C.-H., Wang Y.-C., Semedi B. (2023). Habitat changes and catch rate variability for greater amberjack in the Taiwan Strait: The effects of El Niño–southern oscillation events. Front. Mar. Sci. 10. doi: 10.3389/fmars.2023.1024669
Mammel M., Naimullah M., Vayghan A. H., Hsu J., Lee M.-A., Wu J.-H., et al. (2022). Variability in the spatiotemporal distribution patterns of greater amberjack in response to environmental factors in the Taiwan strait using remote sensing data. Remote Sens. 14 (12), 2932. doi: 10.3390/rs14122932
Mendoza-Portillo V., García-De León F. J., von Der Heyden S. (2023). Responses of population structure and genomic diversity to climate change and fishing pressure in a pelagic fish. Global Change Biol 29 (14), 4107–4125. doi: 10.1111/gcb.16732
Mondal S., Lan Y.-C., Lee M.-A., Wang Y.-C., Semedi B., Su W.-Y. (2022). Detecting the feeding habitat zone of albacore tuna (Thunnus alalunga) in the southern Indian Ocean using multisatellite remote sensing data. J. Mar. Sci. Technol. 29 (6), 794–807. doi: 10.51400/2709-6998.2559
Mondal S., Lee M. A., Chen Y.-K., Wang Y.-C. (2023a). Ensemble modeling of black pomfret (Parastromateus Niger) habitat in the Taiwan Strait based on oceanographic variables. PeerJ 11, e14990. doi: 10.7717/peerj.14990
Mondal S., Ray A., Lee M.-A., Boas M. (2023b). Projected changes in spawning ground distribution of mature albacore tuna in the Indian ocean under various global climate change scenarios. J. Mar. Sci. Eng. 11 (8), 1565. doi: 10.3390/jmse11081565
Moreno A., Pierce G., Azevedo M., Pereira J., Santos A. (2012). The effect of temperature on growth of early life stages of the common squid Loligo vulgaris. J. Mar. Biol. Assoc. United Kingdom 92 (7), 1619–1628. doi: 10.1017/S0025315411002141
Müller C., Cramer W., Hare W. L., Lotze-Campen H. (2011). Climate change risks for African agriculture. Proc. Natl. Acad. Sci. 108 (11), 4313–4315. doi: 10.1073/pnas.1015078108
Myers S. S., Smith M. R., Guth S., Golden C. D., Vaitla B., Mueller N. D., et al. (2017). Climate change and global food systems: potential impacts on food security and undernutrition. Annu. Rev. Public Health 38, 259–277. doi: 10.1146/annurev-publhealth-031816-044356
Nunez S., Arets E., Alkemade R., Verwer C., Leemans R. (2019). Assessing the impacts of climate change on biodiversity: is below 2° C enough? Climatic Change 154, 351–365. doi: 10.1007/s10584-019-02420-x
O'Dor R., Adamo S., Aitken J., Andrade Y., Finn J., Hanlon R., et al. (2002). Currents as environmental constraints on the behavior, energetics and distribution of squid and cuttlefish. Bull. Mar. Sci. 71 (2), 601–617.
Pang Y., Chen C.-S., Iwata Y. (2020). Variations in female swordtip squid Uroteuthis edulis life history traits between southern Japan and northern Taiwan (Northwestern Pacific). Fisheries Sci. 86, 1005–1017. doi: 10.1007/s12562-020-01465-7
Pang Y., Chen C.-S., Kawamura T., Iwata Y. (2022). Environmental influence on life-history traits in male squid Uroteuthis edulis with alternative reproductive tactics. Mar. Biol. 169 (3), 33. doi: 10.1007/s00227-022-04017-y
Pearman T. R. R., Robert K., Callaway A., Hall R., Iacono C. L., Huvenne V. A. (2020). Improving the predictive capability of benthic species distribution models by incorporating oceanographic data–Towards holistic ecological modelling of a submarine canyon. Prog. Oceanography 184, 102338. doi: 10.1016/j.pocean.2020.102338
Pearson P. N., Palmer M. R. (2000). Atmospheric carbon dioxide concentrations over the past 60 million years. Nature 406 (6797), 695–699. doi: 10.1038/35021000
Peluso L. M., Mateus L., Penha J., Súarez Y., Lemes P. (2023). Climate change may reduce suitable habitat for freshwater fish in a tropical watershed. Climatic Change 176 (4), 44. doi: 10.1007/s10584-023-03526-z
Pentz B., Klenk N. (2023). Will climate change degrade the efficacy of marine resource management policies? Mar. Policy 148, 105462. doi: 10.1016/j.marpol.2022.105462
Pikitch E. K., Rountos K. J., Essington T. E., Santora C., Pauly D., Watson R., et al. (2014). The global contribution of forage fish to marine fisheries and ecosystems. Fish Fisheries 15 (1), 43–64. doi: 10.1111/faf.12004
Pinsky M. L., Reygondeau G., Caddell R., Palacios-Abrantes J., Spijkers J., Cheung W. W. (2018). Preparing ocean governance for species on the move. Science 360 (6394), 1189–1191. doi: 10.1126/science.aat2360
Pitchaikani J. S., Lipton A. (2016). Nutrients and phytoplankton dynamics in the fishing grounds off Tiruchendur coastal waters, Gulf of Mannar, India. SpringerPlus 5 (1), 1–17. doi: 10.1186/s40064-016-3058-8
Plagányi É. (2019). Climate change impacts on fisheries. Science 363 (6430), 930–931. doi: 10.1126/science.aaw5824
Porcaro R. R., Zani-Teixeira M., d. L., Katsuragawa M., Namiki C., Ohkawara M. H., et al. (2014). Spatial and temporal distribution patterns of larval sciaenids in the estuarine system and adjacent continental shelf off Santos, Southeastern Brazil. Braz. J. Oceanography 62, 149–164. doi: 10.1590/S1679-87592014067606202
Postuma F. A., Gasalla M. A. (2010). On the relationship between squid and the environment: artisanal jigging for Loligo plei at São Sebastião Island (24 S), southeastern Brazil. ICES J. Mar. Sci. 67 (7), 1353–1362. doi: 10.1093/icesjms/fsq105
Qi J., Yin B., Zhang Q., Yang D., Xu Z. (2017). Seasonal variation of the Taiwan Warm Current Water and its underlying mechanism. Chin. J. Oceanology Limnology 35 (5), 1045–1060. doi: 10.1007/s00343-017-6018-4
Ratner B. (2009). The correlation coefficient: Its values range between+ 1/– 1, or do they? J. targeting measurement Anal. marketing 17 (2), 139–142. doi: 10.1057/jt.2009.5
Rodhouse P., Nigmatullin C. M. (1996). Role as consumers. Philos. Trans. R. Soc. London. Ser. B: Biol. Sci. 351 (1343), 1003–1022. doi: 10.1098/rstb.1996.0090
Roper C., Sweeney M., Nauen C. (1984). Cephalopods of the world-FAO species catalogue. FAO Fisheries Synopsis 125 (3), 1–277.
Rouyer T., Fromentin J.-M., Stenseth N. C., Cazelles B. (2008). Analysing multiple time series and extending significance testing in wavelet analysis. Mar. Ecol. Prog. Ser. 359, 11–23. doi: 10.3354/meps07330
Sear D. A., Pattison I., Collins A. L., Newson M. D., Jones J. I., Naden P., et al. (2014). Factors controlling the temporal variability in dissolved oxygen regime of salmon spawning gravels. Hydrological Processes 28 (1), 86–103. doi: 10.1002/hyp.9565
Semedi B., Hardoko H., Dewi C. S. U., Syam’s N. D. S., Diza N. F., Bayuaji G. D. A. P. (2023). Seasonal migration zone of skipjack tuna (Katsuwonus pelamis) in the South Java sea using multisensor satellite remote sensing. J. Mar. Sci. 2023, 1073633. doi: 10.1155/2023/1073633
Silber G. K., Lettrich M. D., Thomas P. O., Baker J. D., Baumgartner M., Becker E. A., et al. (2017). Projecting marine mammal distribution in a changing climate. Front. Mar. Sci. 4. doi: 10.3389/fmars.2017.00413
Smale M. (1996). Cephalopods as prey. IV. Fishes. Philos. Trans. R. Soc. London. Ser. B: Biol. Sci. 351 (1343), 1067–1081. doi: 10.1098/rstb.1996.0094
Suh S., Johnson J. A., Tambjerg L., Sim S., Broeckx-Smith S., Reyes W., et al. (2020). Closing yield gap is crucial to avoid potential surge in global carbon emissions. Global Environ. Change 63, 102100. doi: 10.1016/j.gloenvcha.2020.102100
Tamario C., Sunde J., Petersson E., Tibblin P., Forsman A. (2019). Ecological and evolutionary consequences of environmental change and management actions for migrating fish. Front. Ecol. Evol. 7. doi: 10.3389/fevo.2019.00271
Teng S.-Y., Su N.-J., Lee M.-A., Lan K.-W., Chang Y., Weng J.-S., et al. (2021). Modeling the habitat distribution of acanthopagrus schlegelii in the coastal waters of the eastern Taiwan strait using MAXENT with fishery and remote sensing data. J. Mar. Sci. Eng. 9 (12), 1442. doi: 10.3390/jmse9121442
Torrence C., Compo G. P. (1998). A practical guide to wavelet analysis. Bull. Am. Meteorological Soc. 79 (1), 61–78. doi: 10.1175/1520-0477(1998)079
Torrence C., Webster P. J. (1999). Interdecadal changes in the ENSO–monsoon system. J. Climate 12 (8), 2679–2690. doi: 10.1175/1520-0442(1999)012
Tzeng W.-N., Tseng Y.-H., Han Y.-S., Hsu C.-C., Chang C.-W., Di Lorenzo E., et al. (2012). Evaluation of multi-scale climate effects on annual recruitment levels of the Japanese eel, Anguilla japonica, to Taiwan. PloS One 7 (2), e30805. doi: 10.1371/journal.pone.0030805
Urbina M. A., Glover C. N. (2015). Effect of salinity on osmoregulation, metabolism and nitrogen excretion in the amphidromous fish, inanga (Galaxias maculatus). J. Exp. Mar. Biol. Ecol. 473, 7–15. doi: 10.1016/j.jembe.2015.07.014
Vayghan A. H., Lee M.-A. (2022). Hotspot habitat modeling of skipjack tuna (Katsuwonus pelamis) in the Indian ocean by using multisatellite remote sensing. Turkish J. Fisheries Aquat. Sci. 22 (9), TRJFAS1910701-TRJFAS1910710. doi: 10.4194/TRJFAS19107
Vayghan A. H., Zarkami R., Sadeghi R., Fazli H. (2016). Modeling habitat preferences of Caspian kutum, Rutilus frisii kutum (Kamensky 1901)(Actinopterygii, cypriniformes) in the Caspian sea. Hydrobiologia 766 (1), 103–119. doi: 10.1007/s10750-015-2446-3
Vila Y., Silva L., Torres M., Sobrino I. (2010). Fishery, distribution pattern and biological aspects of the common European squid Loligo vulgaris in the Gulf of Cadiz. Fisheries Res. 106 (2), 222–228. doi: 10.1016/j.fishres.2010.06.007
Wang K.-Y., Chang K.-Y., Liao C.-H., Lee M.-A., Lee K.-T. (2013). Growth strategies of the swordtip squid, Uroteuthis edulis, in response to environmental changes in the southern East China Sea—A cohort analysis. Bull. Mar. Sci. 89 (3), 677–698. doi: 10.5343/bms.2012.1044
Wang J., Cheng Y., Lu H., Chen X., Lin L., Zhang J. (2022). Water temperature at different depths affects the distribution of neon flying squid (Ommastrephes bartramii) in the northwest Pacific Ocean. Front. Mar. Sci. 8. doi: 10.3389/fmars.2021.741620
Wang Y., Han P., Fang Z., Chen X. (2023). Climate-induced life cycle and growth variations of neon flying squid (Ommastrephes bartramii) in the North Pacific Ocean. Aquaculture Fisheries 8 (2), 211–220. doi: 10.1016/j.aaf.2021.08.006
Wang D., Yao L., Yu J., Chen P. (2021). The role of environmental factors on the fishery catch of the squid uroteuthis chinensis in the Pearl River estuary, China. J. Mar. Sci. Eng. 9 (2), 131. doi: 10.3390/jmse9020131
Worm B., Lotze H. K. (2021). “Marine biodiversity and climate change,” in Climate change, (Elsevier) 445–464. doi: 10.1016/B978-0-12-821575-3.00021-9
Yagi M., Takeda T., Matsuyama M., Oikawa S. (2011). Prey capture by paralarvae of the squid Uroteuthis (Photololigo) edulis (Cephalopoda: Loliginidae) in captivity. Aquaculture Sci. 59 (4), 643–647. doi: 10.11233/aquaculturesci.59.643
Yamaguchi T., Aketagawa T., Miyamoto M., Hirose N., Matsuyama M. (2018). The use of statolith analyses and particle-tracking experiments to reveal the migratory route of the swordtip squid (Uroteuthis edulis) caught on the Pacific side of Japan. Fisheries Oceanography 27 (6), 517–524. doi: 10.1111/fog.12270
Yamaguchi T., Aketagawa T., Takayama K., Hirose N., Matsuyama M. (2019). Migratory routes of different sized swordtip squid (Uroteuthis edulis) caught in the Tsushima Strait. Fisheries Res. 209, 24–31. doi: 10.1016/j.fishres.2018.08.008
Yamaguchi T., Kawakami Y., Matsuyama M. (2015). Migratory routes of the swordtip squid Uroteuthis edulis inferred from statolith analysis. Aquat. Biol. 24 (1), 53–60. doi: 10.3354/ab00635
Yamaguchi T., Takayama K., Hirose N. (2021). Quantitative relationships between autumn catches of swordtip squid (Uroteuthis edulis) and oceanic conditions to the east of Tsushima islands. Japan. Am. J. Mar. Sci. 9 (1), 16–25. doi: 10.12691/marine-9-1-4
Yamaguchi T., Takayama K., Hirose N. (2022). Influence of migratory route on early maturation of swordtip squid, Uroteuthis edulis, caught off western Kyushu Island, Japan. Fisheries Res. 249, 106233. doi: 10.1016/j.fishres.2022.106233
Yamaguchi T., Takayama K., Hirose N., Matsuyama M. (2020a). Relationship between empirical water temperature and spring characteristics of swordtip squid (Uroteuthis eduli s) caught in the eastern Tsushima Strait. Mar. Biol. Res. 16 (2), 93–102. doi: 10.1080/17451000.2020.1712420
Yamaguchi T., Takayama K., Hirose N., Matsuyama M. (2020b). The Sea of Amakusa playing the role of a distributor of swordtip squid (Uroteuthis edulis) migrating from the East China Sea to the east and west sides of Japan. Fisheries Res. 225, 105475. doi: 10.1016/j.fishres.2019.105475
Young M. A., Treml E. A., Beher J., Fredle M., Gorfine H., Miller A. D., et al. (2020). Using species distribution models to assess the long-term impacts of changing oceanographic conditions on abalone density in south east Australia. Ecography 43 (7), pp.1052–1064. doi: 10.1111/ecog.05181
Yu W., Chen X., Yi Q., Chen Y., Zhang Y. (2015). Variability of suitable habitat of western winter-Spring cohort for neon flying squid in the Northwest Pacific under anomalous environments. PloS One 10 (4), e0122997. doi: 10.1371/journal.pone.0122997
Yu F., Wang T., Groen T. A., Skidmore A. K., Yang X., Ma K., et al. (2022). Climate and land use changes will degrade the distribution of Rhododendrons in China. Science of the total environment 659, 515–528.
Yu W., Chen X., Zhang Y. (2019c). Seasonal habitat patterns of jumbo flying squid Dosidicus gigas off Peruvian waters. J. Mar. Syst. 194, 41–51. doi: 10.1016/j.jmarsys.2019.02.011
Yu W., Chen X., Zhang Y., Yi Q. (2019d). Habitat suitability modelling revealing environmental-driven abundance variability and geographical distribution shift of winter–spring cohort of neon flying squid Ommastrephes bartramii in the northwest Pacific Ocean. ICES J. Mar. Sci. 76 (6), 1722–1735. doi: 10.1093/icesjms/fsz051
Yu J., Hu Q., Tang D., Chen P. (2019a). Environmental effects on the spatiotemporal variability of purpleback flying squid in Xisha-Zhongsha waters, South China Sea. Mar. Ecol. Prog. Ser. 623, 25–37. doi: 10.3354/meps13026
Yu J., Hu Q., Tang D., Zhao H., Chen P. (2019b). Response of Sthenoteuthis oualaniensis to marine environmental changes in the north-central South China Sea based on satellite and in situ observations. PloS One 14 (1), e0211474. doi: 10.1371/journal.pone.0211474
Yunrong Y., Yuyuan L., Shengyun Y., Guirong W., Yajin T., Qibin F., et al. (2013). Biological characteristics and spatial—temporal distribution of mitre squid, Uroteuthis chinensis, in the Beibu Gulf, South China Sea. J. Shellfish Res. 32 (3), 835–844. doi: 10.2983/035.032.0327
Zarkami R., Bahri P., Fazli H., Vayghan A. H., Pasvisheh R. S. (2023). Use of data-driven models to analyse the habitat preferences of the leaping grey mullet (Chelon saliens, Risso 1810) in the Caspian sea. Regional Stud. Mar. Sci. 65, 103078. doi: 10.1016/j.rsma.2023.103078
Zhang Y., Yu W., Chen X., Zhou M., Zhang C. (2022). Evaluating the impacts of mesoscale eddies on abundance and distribution of neon flying squid in the Northwest Pacific Ocean. Front. Mar. Sci. 9. doi: 10.3389/fmars.2022.862273
Zhou X., Sun Y., Huang W., Smol J. P., Tang Q., Sun L. (2015). The Pacific decadal oscillation and changes in anchovy populations in the Northwest Pacific. J. Asian Earth Sci. 114, 504–511. doi: 10.1016/j.jseaes.2015.06.027
Keywords: climate indices, environment remote sensing, habitat modeling, sustainable fisheries, swordtip squid
Citation: Haghi Vayghan A, Ray A, Mondal S and Lee M-A (2024) Modeling of swordtip squid (Uroteuthis edulis) monthly habitat preference using remote sensing environmental data and climate indices. Front. Mar. Sci. 11:1329254. doi: 10.3389/fmars.2024.1329254
Received: 28 October 2023; Accepted: 02 January 2024;
Published: 22 January 2024.
Edited by:
Stephen J. Newman, Western Australian Fisheries and Marine Research Laboratories, AustraliaReviewed by:
Yeny Nadira Kamaruzzaman, Universiti Malaysia Terengganu, MalaysiaElaine Sabu, REVA University, India
Ayan Chanda, Indian Institute of Technology Kharagpur, India
Copyright © 2024 Haghi Vayghan, Ray, Mondal and Lee. This is an open-access article distributed under the terms of the Creative Commons Attribution License (CC BY). The use, distribution or reproduction in other forums is permitted, provided the original author(s) and the copyright owner(s) are credited and that the original publication in this journal is cited, in accordance with accepted academic practice. No use, distribution or reproduction is permitted which does not comply with these terms.
*Correspondence: Ming-An Lee, malee@mail.ntou.edu.tw; Ali Haghi Vayghan, a.haghi@urmia.ac.ir