
Socioeconomic Determinants of Health and Their Unequal Distribution in Poland


1
Department of Operational Research and Mathematical Economics, The Poznań University of Economics and Business, Al. Niepodległości 10, 61-875 Poznań, Poland
2
Department of Organisation and Healthcare Management, Poznań University of Medical Sciences, ul. Przybyszewskiego 39, 60-356 Poznań, Poland
*
Authors to whom correspondence should be addressed.
Int. J. Environ. Res. Public Health 2021, 18(20), 10856; https://doi.org/10.3390/ijerph182010856
Submission received: 9 August 2021
/
Revised: 10 October 2021
/
Accepted: 13 October 2021
/
Published: 15 October 2021
(This article belongs to the Section Health Economics)
Abstract
:The purpose of this study is to identify inequities in the distribution of socioeconomic determinants of health within Poland and their impact on the health status of Poles, as measured by mortality rate. We hypothesised that (1) there are inequities in the socioeconomic characteristics within geographically defined population groups and (2) some socioeconomic determinants of health have a particularly strong impact on the health status of Poles. Poland is administratively divided into three levels: voivodeships, powiats and gminas. We used a dataset covering all 380 powiats in Poland for the year 2018. We employed a two-stage nested Theil index and Herfindahl–Hirschman Index. In order to identify which of these determinants has the strongest impact on health, we conducted a regression analysis. The study revealed some inequities in the distribution of socioeconomic determinants of health. The mortality rate can be partly understood from variations within voivodeships in the distribution of health determinants. Important national inequalities were found in the case of two determinants, which simultaneously proved their significant impact on Poles’ health in the regression analysis. Thus, type of employment and access to modern infrastructure should be of particular concern for public authorities.
1. Introduction
Health is important for a variety reasons, in particular for individuals’ well-being and ability to pursue different life plans [1]. However, health is quite complex as, according to the World Health Organization, it is “a state of complete physical, mental and social well-being” [2]. The complexity of health is reflected by the production function of health, which was first described by Auster, Leveson and Sarachek (1969) [3]. They examined health (measured by mortality rate) as a function of both medical care and environmental variables [3]. Thus, the health production function describes “the relationship between combinations of medical and non-medical inputs and the resulting output” [4]. Many researchers have used this concept in their studies, but they have also started to employ different variables to explain health status [5]. Thus, many empirical analyses have considered income as one of the main determinants of health, followed by education, food quality, health expenditure, social protection, early childhood development, food insecurity, unemployment and job insecurity, working life conditions, housing, basic amenities and environment, social inclusion and non-discrimination, structural conflict and access to affordable health services of a decent quality [6]. Table 1—based on selected existing studies—shows the diversity of the determinants of health and health outcome measures in use. These analysed variables are actually the conditions in which people are born, grow up, live, work and age; in the literature they are described as the socioeconomic determinants of health [7,8].
The socioeconomic determinants of health can be grouped into five key areas or domains [9]: (1) economic stability; (2) education access and quality; (3) neighbourhood and built environment; (4) social and community context; and (5) health care access and quality.
The first group of socioeconomic determinants applies to economic stability and social status. It includes working conditions, which can provide financial security, social or employment status, social relations, personal development, self-esteem and protection from physical and psychosocial hazards [9]. Unemployment can cause psychosocial stress and can thus have a strong impact on physical and mental health and well-being [10]. In addition, as children age, the relationship between household income and their health becomes more pronounced [11].
Education (access and quality) is the second group of socioeconomic determinants. It includes such factors as education attainment in general, early childhood education and development, high school graduation, enrolment in higher education, language and literacy [7,12]. The positive relationship between more years of education and better health is one of the most fundamental connections in health economics, which originates from Grossman’s health demand model [13]. In addition, it is an empirically well-documented pattern in the literature [14,15,16]. Education improves health, as it increases knowledge, skills, reasoning, effectiveness and other abilities as well as enhancing a sense of personal control that can enable a healthy lifestyle [17,18,19].
The third group of socioeconomic determinants is the quality of one’s neighbourhood and built environment (physical environment). This group includes housing and shelter, transportation and roads, food, air and water quality, sanitation, neighbourhood crime and violence, safety, parks, walkability, and local geography and communities [10]. Homelessness and overcrowding are risk factors of physical and mental health [8,10]. The current model of urbanisation and the lack of balance between rural and urban areas pose many environmental challenges, especially those connected with climate change [12]. Good quality housing requires appropriate heating. Housing with insufficient heat is linked with a number of cardiovascular and respiratory morbidity outcomes, as well as increased incidence of psychological conditions such as depression. Heating also determines the hygrothermal conditions in the house. Inappropriate hygrothermal conditions may favour the proliferation of mites and asthma [20,21,22,23]. By having access to energy, people can have vital health determinants in the house, such as heating and the means to prepare nutritious food [24].
In addition, many empirical studies have shown that people’s perception of the built environment may directly influence mental stress, which has an impact on their well-being and overall health. It can also indirectly influence health through health-related behaviours such as social contact or physical activity [25]. Additionally, active transportation can increase physical activity and thus health [26,27].
The next group of socioeconomic determinants—social and community context (social support networks)—includes community engagement, social integration, support systems, the beliefs of the family and community, customs and traditions, civic participation and discrimination. Having greater support from families, friends and communities is linked to better health [9,28].
The final group of determinants applies to access to and quality of health care, which means access to primary health care, health insurance coverage, health literacy, quality of care and utilisation of health care; these elements are integral in the prevention and treatment of disease and generally influence health [10,29,30].
By forming the conditions of daily life, these socioeconomic determinants influence people’s opportunities to be and stay healthy [31]. Moreover, these socioeconomic determinants of health have varied across space and time over the last few decades. Since they are also under the influence of different socioeconomic processes, some of them are more significant or fundamental than others. For example, the process of urbanisation has improved standards of living, positively influencing health, but negatively impacting lifestyles and lifestyle-related factors, including physical inactivity and unhealthy diets [32]. In addition, deindustrialisation has led to greater levels of socioeconomic deprivation (and associated factors) and has resulted in relatively poor health status among people in deindustrialised areas [33]. The global financial crisis has caused a dramatic transformation of employment in the weakest economies of the Eurozone. The deterioration of working conditions, low pay and periods of prolonged unemployment for most of the working population—especially women—have been observed [34]. Financialisation has exerted significant effects on many aspects of our daily life, such as consumption patterns, housing affordability, employment structure and social conditions, which are relevant to health. Generally, it has contributed to increased income inequalities through different channels [35].
The uneven distribution of socioeconomic determinants contributes to intergroup differences in health outcomes, both within and between societies [31], which is a major obstacle in achieving health justice [36]. Thus, ensuring health equity requires the elimination of unfair and avoidable differences in health among population groups, which are defined economically, socially, geographically or demographically [37,38].
Thus, the unequal allocation of power as well as resources, which appears in unequal social, economic and physical conditions, is recognised as one of the main root causes of health inequity [7,39]. It is mainly derived from the existence of inequalities in other areas of life, such as economic, political or social spheres [40]. This is the result of decision-making processes, policies, social norms and structures, which exist at all levels in society; therefore, effective interventions are required in all sectors [31,41]. Thus, the socioeconomic determinants are modifiable and can be influenced by social, economic and political processes, historical and contemporary policies, law, investment, culture and norms [7]. As socioeconomic determinants affect how people experience the world and the choices they make, bringing about a reduction in their distribution inequities is an important challenge for health policies [42,43].
Therefore, a burgeoning volume of research is focused on the social, economic and environmental determinants of health and their impact on health outcomes, as well as identifying these determinants as the main root cause of many health inequities. Many studies—which have covered different world populations and various ranges of socioeconomic determinants (Table 1)—have shown that people from lower socioeconomic groups have shorter lives and more often suffer from health problems, while people with a quality education, stable employment, safe homes and neighbourhoods and access to preventive services tend to be healthier throughout their lives.
Previous research in the area of socioeconomic inequities in the health of Poles has primarily compared Poland with other countries [44,45]. There are other studies having a limited context, such as those focusing on economic status and gender [46]; education, marital status, employment status or place of residence and their impact on mortality among working-age people [47]; the social determinants of the self-rated health of Polish women and men [48]; and the relation between expenses for health and healthy life expectancy [49]. There have also been a few studies on the socioeconomic determinants of the health of rural inhabitants [50,51].
As reducing health inequities is treated as a matter of social justice and is thus a kind of ethical imperative, the Commission on Social Determinants of Health called on the WHO and all governments “to lead global action on the social determinants of health with the aim of achieving health equity” [12]. In the Polish health care system, both health and equity are important values [52,53], as determined from the WHO constitution and strategy [2] as well as from Article 68 of the Polish Constitution [54]. In addition, one of the strategic objectives of the Polish national health policy, as formulated in the National Health Programme [55], is the elimination of geographical and social inequalities in health.
Therefore, in this study we focus on identifying inequities in the distribution of socioeconomic determinants of health within Poland and the impact of socioeconomic determinants on the health status of Poles, as measured by mortality rate. The aim of this study is to measure the level of inequities in the distribution of socioeconomic determinants of health between geographically defined groups of people in Poland. The hypotheses are as follows:
- (1)
- There are inequities in the socioeconomic characteristics within geographically defined population groups.
- (2)
- Some socioeconomic determinants of health have a particularly strong impact on the health status of Poles.
In order to verify these hypotheses, we used the database of Statistics Poland [56], which determined the final range of socioeconomic variables and the year of research (2018) adopted for the study. Therefore, it was possible to derive the data at the powiat level—the second (out of three) administrative level in Poland—which made it possible to identify the sources of geographical inequities.
As it was conducted on the powiat level, our research fills an existing gap by providing more specific information on the spatial diversity of the Polish population in terms of the socioeconomic determinants of health. The novelty of this research also arises from it being the first time the two-stage nested Theil decomposition method is utilised in the context of the Polish population, allowing national inequity to be decomposed to macro-regions by comparing inequities between voivodeships and within voivodeships.
2. Materials and Methods
Poland is administratively divided into three levels, including 16 voivodeships (provinces), 380 powiats (including 66 cities with powiat status) and 2478 gminas (2018). Each voivodeship consists of powiats, and each powiat consists of gminas.
According to the Nomenclature of Territorial Units for Statistics (NUTS), Poland is divided into 7 macro-regions (NUTS 1), then 17 regions (NUTS 2) and 73 subregions (NUTS 3). Each macro-region consists of regions, and each region consists of subregions.
Voivodeships are conterminous with regions (NUTS 2), with one exception—Mazovian voivodeship—which is split into two NUTS 2 units (regions): Warsaw—capital and Masovian—regional. Thus, all (16) voivodeships can be classified into 7 macro-regions (NUTS 1). The above relations between macro-regions, regions and voivodeships in Poland are presented in the Table 2. Individual macro-regions reflect the economic and social development of various regions in Poland (Supplementary Material).
Thus, the level of unit data is the level of powiats for the purpose of analysing the inequity at the level of macro-regions and then the 16 voivodeships. Data were derived from the Statistics Poland database for 2018 [56]. The scope of the obtained data covered 380 powiats in Poland—i.e., all of them—for the year 2018. Including all the powiats in Poland in the study made it possible to obtain representativeness in the research and the results.
The range of variables and their measures (Table 3), i.e., socioeconomic determinants, were selected based on the analysis of previous studies ([18,19,20,21,22,23,24,25,26,27,28,29] and Table 1) and then determined by the availability of data. They were grouped into economic, education, employment, demography and built environment categories.
First, we determined the descriptive statistics. Analysis of the average and median of the analysed health determinants (Table 4) suggests that in case of most of them (14 out of 17—IN, EDE, EDJH, EA, EI, ES, EF, UR, FR, OR, GS, F, GR, DIS), more than 50% of powiat values had levels lower than the average. Based on the standard deviation and variation, it can be found that the IN variable is characterized by a high level of dispersion.
For the purposes of examining the distribution of the socioeconomic variables in Poland and to determine the drivers of inequity, the Theil index was employed. It was developed by Theil in 1967 and is widely used to measure spatial inequality [88]. The Theil index ranges between 0 and ∞, where zero represents an equal distribution and any higher value represents a higher level of disproportion.
Other commonly used methods to measure the level of inequity in the context of health and health care are the Gini index [38,52,59] and concentration index [57,58,60]. Compared with the Gini coefficient, when estimating regional differences, the Theil index allows sub-groups to be broken down within the context of larger groups. Thus, it is possible to analyse their contribution to the total differences and to identify the main sources of the overall differences [89]. This is an important property of the Theil index measure, as this additive decomposability implies that the aggregate inequality measure can be broken down into inequality within and between any defined population subgroups [90]. The main pitfall of the Theil index is that its values are not always comparable across completely different units, as in case of different nations. If the number and size of groups differ, then limit of the index will differ [91].
Since this article considered the three division scales of macro-region, voivodeship and powiat in Poland, it is more suitable to apply the two-stage nested Theil decomposition method as proposed by Takahiro Akita in 2003 [92]. This two-stage nested Theil index allows us to decompose the national overall inequality into between-macro-regions, between-voivodeships and within-voivodeships. Through such decomposition, the Theil index can comprehensively reflect the multi-scale inequality in the distribution of socioeconomic determinants, with each component explaining a part of overall inequality that is due to differences within and between voivodeships and between macro-regions.
The overall national inequality, T, of a particular socioeconomic variable distribution, based on the powiat level, can be measured using the following formula [92,93]:
where
- Lijk—the particular socioeconomic determinant of health in powiat k in voivodeship j in macro-region i;
- Pijk—the total population (or subpopulation, in case of EDE, EDJH, the children in the appropriate range of age were used as the subpopulation; in case of EA, EI, ES, EF, UR, the working age population was used as the subpopulation; where appropriate) in powiat k in voivodeship j in macro-region i;
- L—the overall national socioeconomic determinant of health;
- P—the overall national population (or subpopulation1, where appropriate).
Then, Tij is defined as the inequity in voivodeship j in macro-region i.
Ti, as the inequality in macro-region i, can be decomposed using the following equation:
where
- Lij—the particular socioeconomic determinant of health in voivodeship j and in macro-region i;
- Pij—the total national population (or subpopulation1, where appropriate) in voivodeship j and in macro-region i;
- Li—the socioeconomic determinant of health in macro-region i;
- Pi —the total national population (or subpopulation1, where appropriate) in macro-region i;
- Twi—measures within-voivodeship inequality;
- Tpi—measures between-voivodeships inequality.
By combining all of the above formulas, the overall national differences, T, can be expressed as follows, which is the final form of the two-stage nested Theil decomposition method equation:
where
- TWP—within-voivodeship component;
- TBP—between-voivodeship component;
- TBR—between-macro-region component.
For the purposes of assessing the level of inequity of the analysed variables, the Herfindahl-Hirschman Index (HHI) [94] was also employed, which allows us to identify the level of inequity in the distribution of the socioeconomic determinants of health. It is commonly used in economics, health services research and other disciplines [95].
The HHI can be defined as the sum of square of the shares of each variable in the overall sum of variables, and it is expressed by the following formula [94]:
where
HHI = ∑ni = 1 (MSi)2
- MSi—the proportion of a percentage of a variable for i-powiats to a percentage of a variable in all powiats;
- n—number of powiats in the macro-region.
The result is often multiplied then by 10,000; the distribution of variable is considered highly concentrated if the value of HHI is greater than 2500, moderately concentrated the HHI value is between 1500 and 2500, and unconcentrated if the HHI is between 100 and 1500 [96].
Then, multiple regression analysis was employed in order to identify the most significant determinants of health at the level of Polish powiats. Mortality rate was adopted as a measure of the health status of the population [97] and incorporated into the regression model as a dependent variable. The mean value of the dependent variable was 10.86, median 10.75, maximum 17.53, minimum 6.45, variance 2.33 and standard deviation 1.53. Distribution of the dependent variable was tested using the chi square test and was found to be normal. The Independent variables initially considered were the above-mentioned 17 determinants of health (see Table 3). In the first step of the analysis, two-sided correlations between each of independent variables and a dependent variable (the mortality rate) were assessed using the Spearman’s rank correlation coefficient. Calculated absolute values of the coefficient are presented in Table 5. As a cut-off point of a significant correlation, the coefficient absolute value of 0.1 was adopted. Six of the independent variables (EDE, EDJH, EF, WS, F, GR) reached the absolute value of the correlation coefficient of less than 0.1 and were excluded from further analysis. The remaining 11 independent variables were included in the preliminary regression model.
The second step of the regression analysis was development of the preliminary multiple linear regression model, containing the independent variables (IN, EA, EI, ES, UR, WAP, FR, OR, SS, GS, DIS) significantly correlated with the mortality rate. The general formula of the regression model is given below:
where: Y—the predicted value of the dependent variable; X1, X2, … Xn—the independent variables; a1, a2, … an—the regression coefficients (slopes) of the independent variables; B—the intercept.
Y = a1X1 + a2X2 + … + anXn + B
The parameters (slopes and an intercept) of the preliminary model were established using the least squares estimation. For each of independent variables, a p-value was calculated employing the t-statistic. The significance level α = 0.05 was adopted. a p-value above 0.05 indicated statistically non-significant variables.
In the next step of the analysis, the preliminary model was refined. Four of the non-significant independent variables (IN, EI, ES, DIS) were excluded. The final model consisted of seven independent variables: EA, UR, WAP, FR, OR, SS, GS. The parameters of the final model (slopes and an intercept) were recalculated using the least squares approach, and t-statistics were employed for calculation of the independent variables’ p-values as well.
Additionally, the final model was tested with regard to statistical independence of the random errors with the use of the Durbin–Watson statistic. According to the D–W distribution tables, a value of the D–W statistic between 1.84 and 2.16 was adopted as an indicator of the absence of residual auto-correlations at a significance level α = 0.05, which means that there is no violation of independence of the random errors in the final regression model.
Calculations of the Theil index and the HHI were done using a free software spreadsheet. Calculation of the regression model was done using STATISTICA software (TIBCO Software Inc., Statistica version 13. (Palo Alto, CA, USA).
3. Results
The Theil index was employed to measure the nationwide equity of the distribution of socioeconomic variables in Poland and the contribution rate of each Polish voivodeship. The Theil index values shown in Table 6 indicate the existence of inequity in the distribution of such variables as GR, EF, F, EA, DIS, GS and ES. The values for these variables range from 0.1230–0.4644, while any value higher than 0 indicates some level of disproportion. In the case of the remaining variables, slight inequity can be observed, but the values are generally below 0.0684.
It can be concluded that at the national level, individual areas in Poland vary in importance in terms of the size of green areas and forests. Some variation in the area of employment structure can be observed, as there is a concentration of employment in finance and agriculture as well as a slight concentration in services. Poland is also characterised by inequity in adapting buildings for people with disabilities and supplying gas to homes.
Table 6 also contains results that show the contribution of three components of overall national inequality (T): the between-macro-region component (TBR), the between-voivodeship component (TBP) and the within-voivodeship component (TWP). In the case of the above-mentioned determinants (GR, EF, F, EA, DIS, GS and ERS), within-voivodeship inequity is largely responsible for their total unequal distribution, since the values of this component are generally higher than the other components (between-voivodeship inequity and between-macro-region inequity).
However, the within-voivodeship component constitutes the main component of overall national inequities for socioeconomic determinants other than the education variables (EDE and EDJH) (see Table 6). In the case of the education variables, the differentiation between voivodeships is mainly responsible for the slight inequities at the national level. Thus, the difference within voivodeships is the main factor leading to national differences in the socioeconomic determinants of health distribution, from a spatial perspective. The results confirm the hypothesis that there is an inequality of the distribution of the socioeconomic determinants of health and that it is caused by within-voivodeship differentiation.
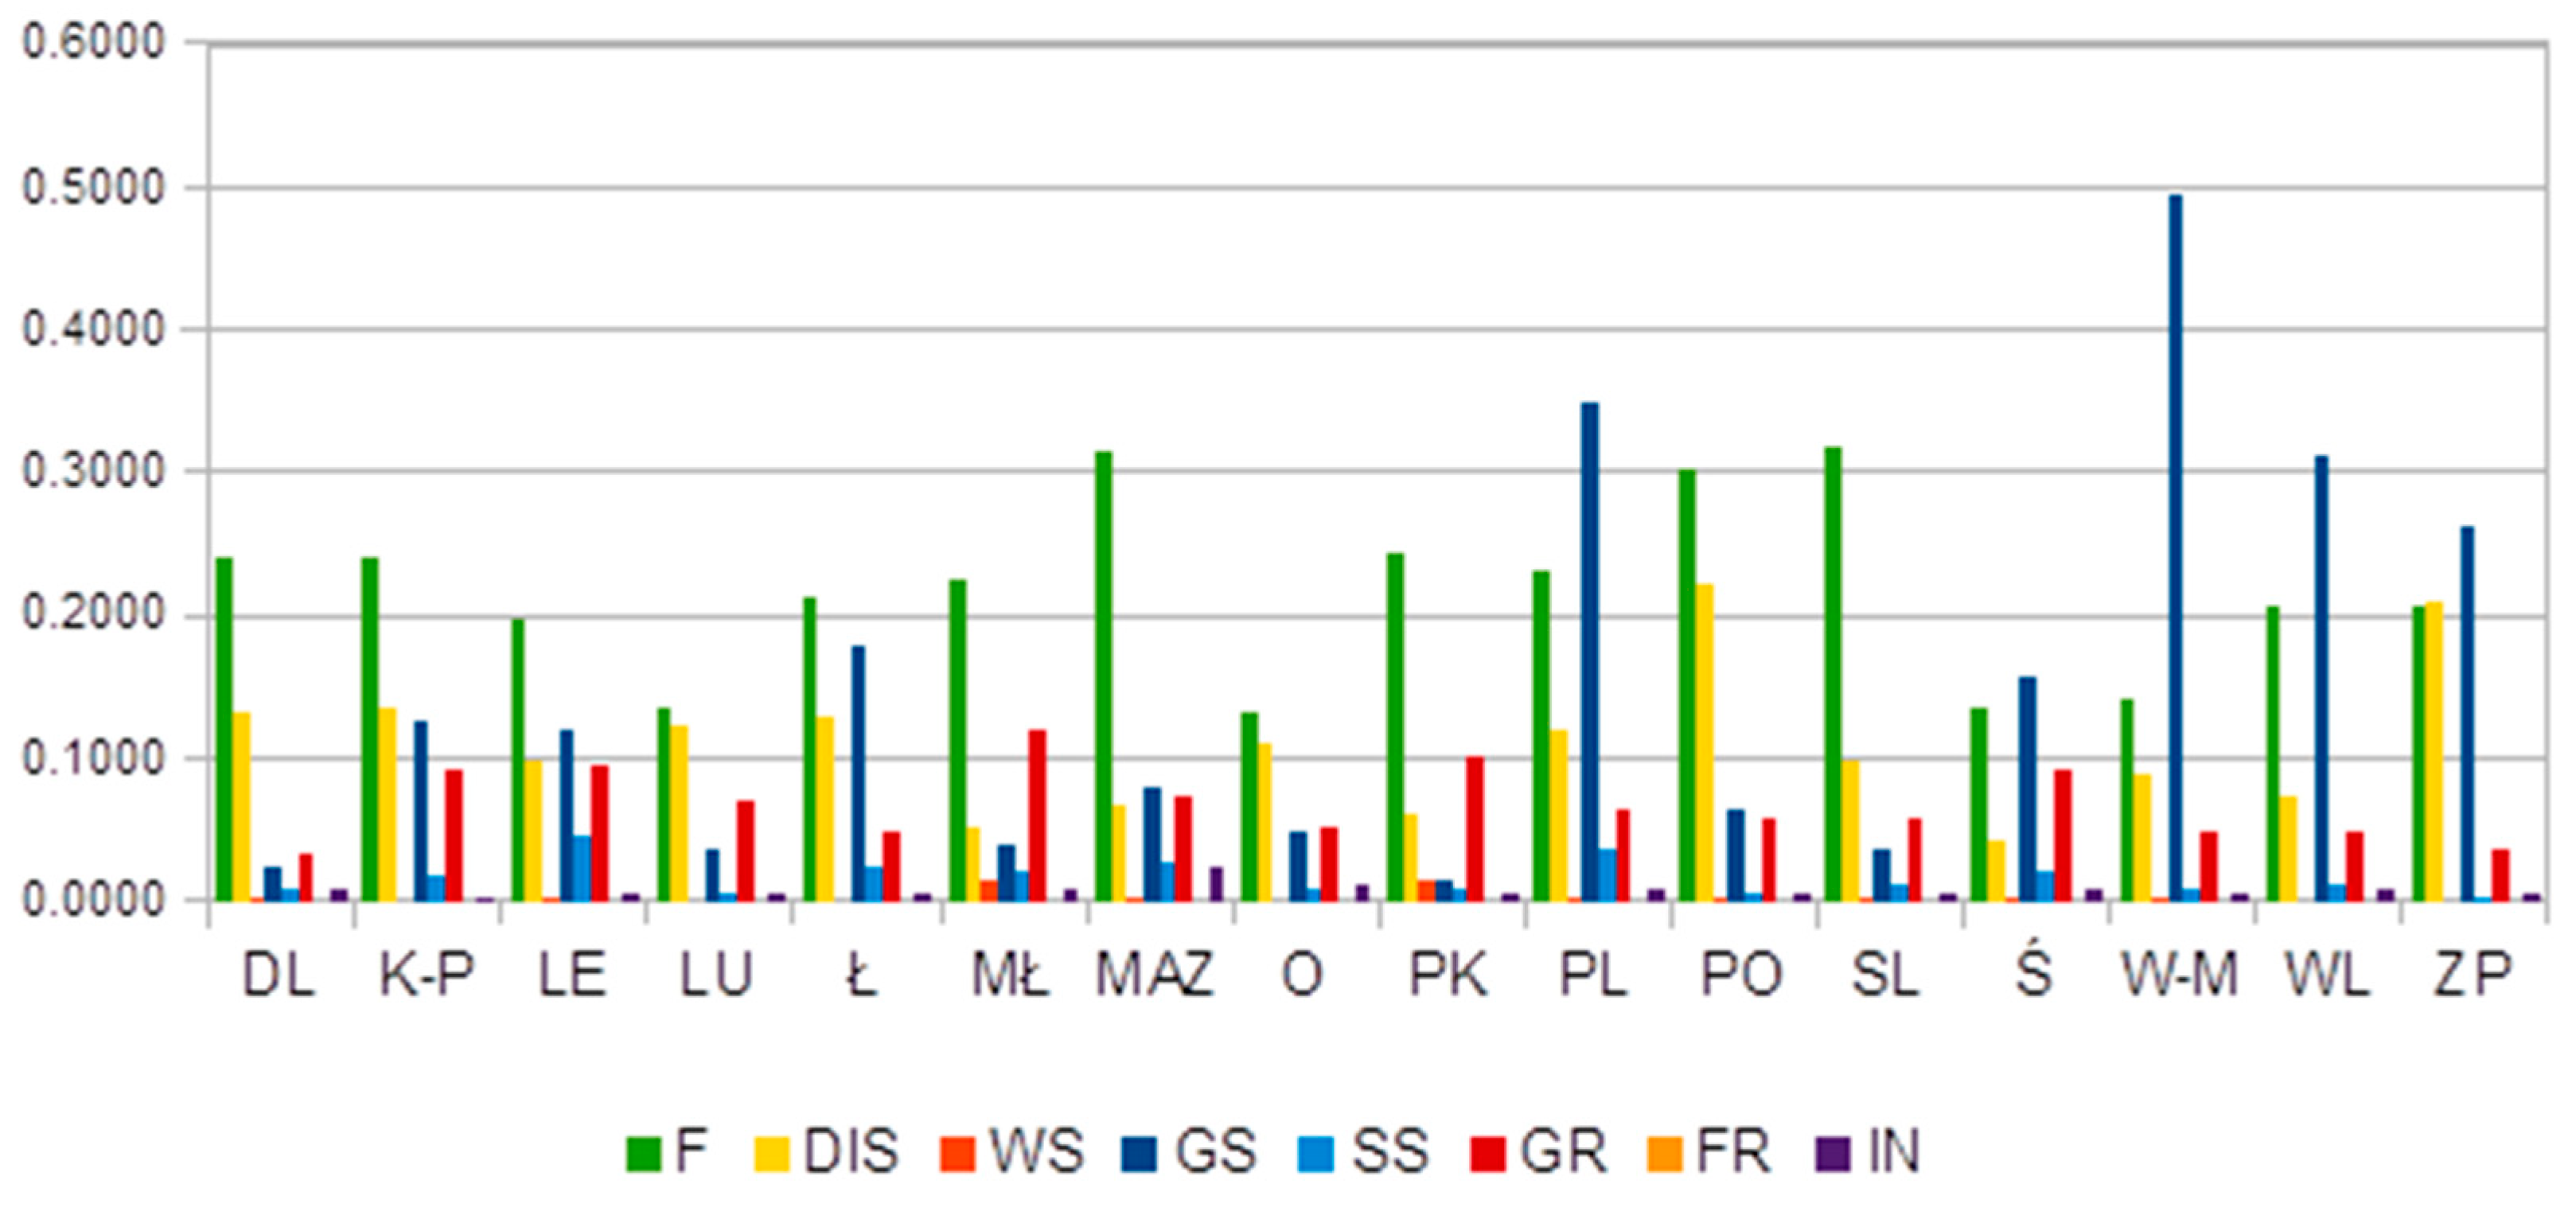
As can be seen in Figure 1, the inequalities within voivodeships—i.e., between powiats—show different degrees of expansion, which led to the polarization of some of the socioeconomic determinants of health in 2018, such as forestation, gas supply, and the level of building adaptation for the disabled. High levels of inequity in the distribution of forests (F) were noted in the case of almost all voivodeships. Podlaskie (PL), Warmian-Masurian (W-M), Wielkopolska (WL) and Zachodniopomorskie (ZP) voivodeships presented some level of inequity in access to the gas supply system. Zachodniopomorskie (ZP) and Pomeranian (PO) voivodeships showed unequal distribution of cultural buildings adapted for the disabled.
In the area of education and the labour market (Figure 2), it is noted that Lower Silesia (DL) presented the highest inequity in the distribution of employees in the finance and services areas between powiats. This could be caused by the high concentration of finance and services companies in Wroclaw—the capital of Lower Silesia. The results present high differentiation in Masovian (MAZ) and Silesian (ŚL) voivodeships, as they show some level of concentration of both agricultural and finance employees.
These results suggest that these identified differences may be a capital city effect and may represent an urban–rural divide, which has been observed in other areas researched in Poland [98,99]. Populations continue to expand in and around many capital cities and urban areas, as they are associated with (perceived) education and/or employment opportunities.
The HHI values for the socioeconomic determinants of health are presented in Table 7. The results present the concentration level of the above determinants and thus their distribution inequities.
Generally, the HHI values indicate a low level of variable concentration, as they are below 1500, especially in the case of the four macro-regions: south, north-west, north and east. If the HHI values are between 100 and 1500, then the particular feature is unconcentrated and is considered equally distributed.
There is one exception, as the distribution of employment in the financial sector (EF) demonstrated moderate concentration in the south and north macro-regions (the values were between 1500 and 2500). The south-west and central macro-regions were characterised by moderate concentrations of most variables, apart from the employment rate in finance, which showed a high level of concentration (the values were greater than 2500). This high level of EF concentration, and such inequities in its distribution between macro-regions, may be due to the existence of large, fast-growing economic and financial city centres, such as Wrocław (south-west) and Łódź (central).
The Masovian macro-region was characterised by moderate concentration in the case of old-age dependency ratio and employment rate in both agriculture and industry (the values ranged from 1500 to 2500) and a high level of inequity in terms of the remaining socioeconomic variables (the values were greater than 2500). This may be due to the fast-growing capital of Poland, Warsaw, which is surrounded by relatively few developed areas.
Initially, the 17 socioeconomic determinants of health listed in Table 3 were considered potential independent variables in a multiple linear regression analysis. Eleven of the determinants had a Spearman’s rank correlation coefficient of over 0.1 and had sufficient two-sided correlation with mortality rate and were thus used for the construction of the preliminary regression model. These were IN, EA, EI, ES, UR, WAP, FR, OR, SS, GS and DIS. The parameters (slopes and an intercept) of the preliminary model are presented in Table 8. An r2 value of 0.7906 indicates that this model describes about 79% of the variability in the mortality rate. Based on the t statistics, p-values for each independent variable were calculated; these are presented in Table 8.
Five of the independent variables (IN, EA, EI, ES and DIS) were statistically non-significant (a p-value above 0.05). Four of them (IN, EI, ES and DIS) were excluded from further analysis, so the final regression model was constructed with seven independent variables: EA, UR, WAP, FR, OR, SS and GS. The independent variable slopes and the intercept in the final model are presented in Table 8. The r2 value for the final model was 0.7220, which means that this model describes about 72% of the variability of the dependent variable (the mortality rate). In the final model, the p-value for all independent variables was below 0.05, indicating their statistical significance. A test of statistical independence of the random errors in the final model was done with the use of the Durbin–Watson statistic. The obtained value of the D–W statistic was 1.86, which means that at a significance level α = 0.05, no residual auto-correlations occurred, and thus the model has good diagnostic features.
4. Discussion
This study identified inequities in the distribution of socioeconomic determinants of health between geographically defined populations. It demonstrates that in Poland, as a result of their geographic status, people do not have equal opportunity to achieve their full health potential. The results confirmed that voivodeships are quite heterogeneous in terms of the distribution of the socioeconomic determinants of health. This implies the existence of inequities in the distribution of these determinants. The main risk factors of health inequity are observed in the conditions of the built environment and employment. Discrepancies in access to green areas, forests and the gas supply system, as well as the levels of employment in agriculture and finance, were found.
The selection of the powiat-level unit and the two-stage Theil index method allowed the identification of the level of national inequality in the distribution of the socioeconomic determinants of health in Poland. Moreover, these findings showed that this inequality across the country and in all macro-regions was decomposable and that the inequalities within voivodeships also represent an important part of national inequalities.
The research only partly confirmed the existence of a high disproportion between eastern Poland (colloquially called Poland B) and western Poland (Poland A), which was recognised in other studies [100]. The within-voivodeship component constitutes the main component of overall national inequities, while the between-voivodeship component is only responsible for some national inequity in the case of the education variables (EDE and EDJH). In addition, the most diversified voivodeships are located in both the east and west of Poland.
In addition, the values of HHI revealed that one macro-region in Poland—Masovia—was characterised by a high concentration of most of the health determinants. The Masovian macro-region contains the capital city, and such variation in the distribution of socioeconomic variables could be caused by different rates of development, leading to the growth of large centres and to increasingly poor surrounding areas, where there is no rapid economic growth [101].
Likewise, the south-west and central macro-regions were characterised by moderate concentrations of most variables. When we compare this result with those of Ucieklak-Jeż and Bem [51], who found that rural areas were homogeneous in terms of the analysed sociodemographic determinants of health, we suspect that the concentration of particular health determinants in urban areas could also have been the main reason for the variability among voivodeships or macro-regions. However, further research is required, as Ucieklak-Jeż and Bem [51] employed slightly different ranges of health determinants.
The low level of most socioeconomic variable concentrations, which was recognised in the case of the south, north-west and north macro-regions, can be explained by historical factors, which many publications have described as a mechanism that still maintains regional disparity in Poland [102,103]. The period of partitions, in particular, contributed to differences in socioeconomic development and social resources in individual regions in Poland that still exist today. This period contributed to the diversification of the behavioural characteristics of the population of the particular partitions.
Historical factors, therefore, caused regional differentiation in the importance awarded to local ties and economic attitudes [104], which, today, could favour equality or eliminate inequalities. The populations of the north and north-west macro-regions are characterised by greater entrepreneurship and a rational approach as well as greater economic activity, while the south of Poland is characterised by a high level of localism. As the northern and southern parts of Poland demonstrate similar levels of concentration in most socioeconomic determinants—lower than those of the other macro-regions—these results cannot be explained by variability in epidemiology [105]. Further research is required.
Based on correlation and multiple regression analysis, only some of the 17 socioeconomic determinants of health taken into consideration proved to have a significant impact on the mortality rate of the Polish population. Six of the independent variables (EDE, EDJH, EF, WS, F and GR) were weakly correlated with the mortality rate (the absolute values of the correlation coefficient were less than 0.1). The remaining 11 independent variables (IN, EA, EI, ES, UR, WAP, FR, OR, SS, GS and DIS) were had significant two-sided correlation with the mortality rate and were used in the preliminary regression model. This model showed good predictive value and explained about 79% of the variability in the mortality rate.
Nevertheless, not all independent variables in the preliminary model were statistically significant. The p-values calculated for four variables (IN, EI, ES and DIS) were much higher than the adopted α = 0.05 (0.482, 0.561, 0.685 and 0.553, respectively), which means that their potential ability to predict the mortality rate value is uncertain, despite being sufficiently correlated with the dependent variable.
In order to improve the regression model, these four variables were excluded from the final model. The final regression model consisted of seven independent variables: EA, UR, WAP, FR, OR, SS and GS. This model explained about 72% of the variability in the mortality rate, which is slightly less than in the preliminary model, but still represents good predictive value. For all independent variables, the p-values were less than 0.05, and their impact on the mortality rate could be perceived as being statistically significant. Based on the final regression model, four of the socioeconomic health determinants that were used had a positive influence on health status (they had negative regression slopes) and reduced the mortality rate: EA, FR, SS and GS. Three of the independent variables in the final model (UR, WAP and OR) had positive slopes. They increased the mortality rate and could be treated as risk factors of a deterioration in health status. In particular, the positive correlation between WAP and an increased mortality rate in the regression model requires further, focussed research. The within-country inequalities among these seven significant socioeconomic determinants of health identified in the Polish population could be particularly important to explain potential differences in health status at the powiat level. In the case of two significant determinants (EA and GS), the Theil index analysis indicated important national inequalities. These two determinants should not be interpreted too literally. EA can be treated more as an indicator of employment type (such as work in a healthy environment near one’s residence that lacks strong subordination in the chain of command), while GS can be seen as an estimator of infrastructure development (such as modern infrastructure with no significant negative impact on the human environment and health due to low dust emission). These results could mean that socioeconomic determinants related to employment type and infrastructure development should be of special concern in improving the health status equity of the Polish population, inducing actions to facilitate equal access to modern ecological infrastructure and to make an active workforce market policy that prioritizes equal access to jobs without consequences for workers’ health.
The study led to the identification of the voivodeships that suffer the most from internal differentiation in the distribution of the socioeconomic determinants of health. In the case of access to gas supply, the Podlaskie (PL), Warmian-Masurian (W-M), Wielkopolska (WL) and Zachodniopomorskie (ZP) voivodeships presented some level of inequity. In addition, high differentiation between the Masovian (MAZ) and Silesian (ŚL) voivodeships was observed, as concentrations of both agricultural and financial employees were found. Thus, studies similar to this one could be used to support policymakers and local governments as well as other stakeholders responsible for creating public regional policy.
Because many of these health differences are caused by decision-making processes, policies, social norms and structures, which exist at all levels in society, these results show the direction of changes that should be undertaken, especially in the Masovian macro-region. This study reveals that analysing variations in inequalities in the distribution of socioeconomic determinants of health within a country can help to identify entry points for policy. In this study, we proposed the two-stage nested Theil index to measure inequities in the socioeconomic determinants in Poland. This allowed analysis to be made at different statistical and administrative levels.
5. Conclusions
By using a dataset that covers all macro-regions in Poland in 2018, using the two-stage nested Theil index and conducting regression analysis, our results suggest that mortality rate (as an estimator of a population’s health status) can be understood, in part, as the product of within-country variations in the distribution of inequalities of socioeconomic variables.
These findings provide new evidence in this area, which is a current and developing global topic, and can add supporting arguments in the discussion of the future shape of social and health policy. This study contributes to science in a few ways. We provide new evidence in the area of socioeconomic determinants of health, underlying the importance of the health inequities as a result of unequal distribution of the gas supply and employment in agriculture. We also propose the use of the two-stage nested Theil index for inequity measures of the socioeconomic determinants of health in Poland.
The limitations of the research arise from the range of available data. It would be valuable for Statistics Poland to collect and provide wider and comparable data in this area. The main direction for further research is to focus on policies that foster inequities at all levels (including organisations, communities, powiats, voivodeships, macro-regions and the nation) and elements of the built environment that are critical drivers of inequity. Furthermore, descriptive work should aim to identify priority areas for explanatory and interventional studies.
Supplementary Materials
The following are available online at https://www.mdpi.com/article/10.3390/ijerph182010856/s1, Territorial structure.
Author Contributions
Conceptualization, J.R. and M.J.; Methodology, J.R. and M.J.; Software, J.R. and M.J.; Validation, J.R. and M.J.; Formal analysis, J.R. and M.J.; Investigation, J.R. and M.J.; Resources, J.R.; Data curation, J.R.; Writing—original draft preparation, J.R. and M.J., Writing—review and editing, J.R. and M.J.; Visualization, J.R. and M.J.; Supervision, J.R. and M.J.; Project administration, J.R. and M.J. All authors have read and agreed to the published version of the manuscript.
Funding
This research received no external funding.
Institutional Review Board Statement
Not applicable.
Informed Consent Statement
Not applicable.
Data Availability Statement
The data presented in this study are available on request from the corresponding author.
Conflicts of Interest
The authors declare no conflict of interest.
References
- Voight, K.; Wester, G. Relational equality and health. Soc. Philos. Policy 2015, 31, 204–229. [Google Scholar] [CrossRef] [Green Version]
- Constitution of the World Health Organization. Available online: https://www.who.int/governance/eb/who_constitution_en.pdf (accessed on 10 February 2021).
- Auster, R.; Leveson, I.; Sarachek, D. The Production of Health, an Exploratory Study. J. Hum. Resour. 1969, 4, 411–436. [Google Scholar] [CrossRef]
- Or, Z. Determinants of Health Outcomes in Industrialized Countries: A Pooled, Cross-Country, Time-Series Analysis; OECD Economic Studies: Paris, France, 2000; Volume 30, pp. 53–67. [Google Scholar]
- Bayati, M.; Akbarian, R.; Kavosi, Z. Determinants of Life Expectancy in Eastern Mediterranean Region: A Health Production Function. Int. J. Health Policy Manag. 2013, 1, 57–61. [Google Scholar] [CrossRef] [PubMed] [Green Version]
- World Health Organisation. Social Determinants of Health. Overview. Available online: https://www.who.int/health-topics/social-determinants-of-health#tab=tab_1 (accessed on 13 January 2021).
- Baciu, A.; Negussie, Y.; Geller, A.; Weinstein, J.N. National Academies of Sciences, Engineering, and Medicine, 2017. In Communities in Action: Pathways to Health Equity. 3, The Root Causes of Health Inequity; National Academies Press (US): Washington, DC, USA, 2017. Available online: https://www.ncbi.nlm.nih.gov/books/NBK425845/ (accessed on 20 December 2020).
- Naik, Y.; Baker, P.; Walker, I.; Tillmann, T.; Bash, K.; Quantz, D.; Hillier-Brown, F. The macro-economic determinants of health and health inequalities- umbrella review protocol. Syst. Rev. 2017, 6, 222. [Google Scholar] [CrossRef] [Green Version]
- CDC Social Determinatns on Health. Available online: https://www.cdc.gov/socialdeterminants/index.htm (accessed on 13 January 2021).
- Australian Institute of Health and Welfare. Social Determinans of Health. Available online: https://www.aihw.gov.au/reports/australias-health/social-determinants-ofhealth (accessed on 20 January 2021).
- Case, A.; Lubotsky, D.; Paxson, C. Economic status and health in childhood: The origins of the gradient. Am. Econ. Rev. 2002, 92, 1308–1334. [Google Scholar] [CrossRef] [Green Version]
- World Health Organization. Commission on Social Determinants of Health. Closing the Gap in a Generation: Health Equity Through Action on the Social Determinants of Health. 2008. Available online: http://www.who.int/social_determinants/thecommission/finalreport/en/ (accessed on 11 December 2020).
- Grossman, M. The Demand for Health: A Theoretical and Empirical Investigation; Columbia University Press for the National Bureau of Economic Research: New York, NY, USA, 1972. [Google Scholar]
- Zajacova, A.; Lawrence, E.M. The relationship between education and health: Reducing disparities through a contextual approach. Ann. Rev. Public Health 2018, 39, 273–289. [Google Scholar] [CrossRef] [PubMed] [Green Version]
- Deaton, A. Policy implications of the gradient of health and wealth. Health Aff. 2002, 21, 13–30. [Google Scholar] [CrossRef] [Green Version]
- Grossman, M. The Relationship between Health and Schooling: What′s New? National Bureau of Economic Research: Cambridge, MA, USA, 2015; Working Paper No 21609. [Google Scholar]
- Mirowsky, J.; Ross, C.E. Education, learned effectiveness and health. Lond. Rev. Educ. 2005, 3, 205–220. [Google Scholar]
- Raghupatji, V.; Raghupatji, W. The influence of education on health: An empirical assessment of OECD countries for the period 1995–2015. Arch. Public Health 2000, 78, 20. [Google Scholar] [CrossRef] [Green Version]
- Feinstein, L.; Sabatés, R.; Anderson, T.M.; Sorhaindo, A.; Hammond, C. What are the Effects of Education on Health. In Measuring the Effects of Education on Health and Civic Engagement: Proceedings of the Copenhagen Symposium; OECD: Paris, France, 2006; pp. 171–354. [Google Scholar]
- WHO. Report of the WHO Technical Meeting on Quantifying Disease from Inadequate Housing; World Health Organization, European Centre for Environment and Health: Copenhagen, Danemark, 2006; pp. 48–69. [Google Scholar]
- Jacobs, D.E.; Wilson, J.; Dixon, S.L.; Smith, J.; Evens, A. The relationship of housing and population health: A 30-year retrospective analysis. Environ. Health Perspect. 2009, 117, 597–604. [Google Scholar] [CrossRef] [Green Version]
- Keith, S.W.; Redden, D.T.; Katzmarzyk, P.T.; Boggiano, M.M.; Hanlon, E.C.; Benca, R.M. Putative contributors to the secular increase in obesity: Exploring the roads less traveled. Int. J. Obes. 2006, 30, 1585–1594. [Google Scholar] [CrossRef] [Green Version]
- Krieger, J.; Higgins, D.L. Housing and health: Time again for public health action. Am. J. Public Health 2002, 92, 758–768. [Google Scholar] [CrossRef]
- Albrecht, D.; Bhattacharyya, S. Social Determinants of Health. Energy: Shared Interests in Sustainable Development and Energy Services; World Health Organization: Geneva, Switzerland, 2013; p. 2. [Google Scholar]
- Pinter-Wollman, N.; Jelić, A.; Wells, N.M. The impact of the built environment on health behaviours and disease transmission in social systems. Philos. Trans. R Soc. Lond. B Biol. Sci. 2018, 373, 20170245. [Google Scholar] [CrossRef]
- Smith, M.; Hosking, J.; Woodward, A.; Witten, K.; MacMillan, A.; Field, A.; Baas, P.; Mackie, H. Systematic literature review of built environment effects on physical activity and active transport–an update and new findings on health equity. Int. J. Behav. Nutr. Phys. Act. 2017, 14, 158. [Google Scholar] [CrossRef]
- Laddu, D.; Paluch, A.E.; LaMonte, M.J. The role of the built environment in promoting movement and physical activity across the lifespan: Implications for public health. Prog. Cardiovasc. Dis. 2021, 64, 33–40. [Google Scholar] [CrossRef] [PubMed]
- World Health Organisation. Social Determinants of Health. In Practice. Available online: https://www.who.int/health-topics/social-determinants-of-health#tab=tab_ (accessed on 28 January 2021).
- Wagstaff, A. Econometric Studies in Health Economics: A Survey of the Brithis Literature. J. Health Econ. 1989, 8, 1–51. [Google Scholar] [CrossRef]
- Healthy People U.S. Department of Health and Human Services, Office of Disease Prevention and Health Promotion. Social Determinants of Health. Available online: https://health.gov/healthypeople/objectives-and-data/social-determinants-health (accessed on 8 February 2021).
- World Health Organisation. Organisation for Europe. Health Topics. Social Determinants. Available online: https://www.euro.who.int/en/health-topics/health-determinants/socialdeterminants (accessed on 12 January 2021).
- Graham, H.; White, P.C.L. Social determiannts and lifestyles: Integrating environmental and public health perspectives. Public Health 2016, 141, 270–278. [Google Scholar] [CrossRef] [PubMed]
- Walsh, D.; Taulbut, M.; Hanlon, P. The aftershock of deindustrialization—Trends in mortality in Scotland and other parts of post-industrial Europe. Eur. J. Public Health 2010, 20, 58–64. [Google Scholar] [CrossRef] [Green Version]
- Daskalaki, M.; Fotaki, M.; Simosi, M. The gendered impact of the financial crisis: Struggles over social reproduction in Greece. Environ. Plan. A Econ. Space 2021, 53, 741–762. [Google Scholar] [CrossRef]
- Gouzoulis, G.; Galanis, G. The impact of financialisation on public health in times of COVID-19 and beyond. Sociol. Health Ilness 2021, 43, 1328–1334. [Google Scholar] [CrossRef]
- Moghaddasi, H. E-health equity: Current perspectives. J. Int. Soc. Telemed. e-Health 2017, 5, e9 (1–8). [Google Scholar]
- World Health Organisation. Equity. Available online: https://www.who.int/healthsystems/topics/equity/en/ (accessed on 10 January 2021).
- Rój, J. Inequality in the Distribution of Healthcare Human Resources in Poland. Sustainability 2020, 12, 2043. [Google Scholar] [CrossRef] [Green Version]
- Mackenbach, J.P.; Bopp, M.; Deboosere, P.; Kovacs, K.; Leinsalu, M.; Martikainen, P.; de Gelder, R. Determinants of the magnitude of socioeconomic inequalities in mortality: A study of 17 European countries. Health Place 2017, 47, 44–53. [Google Scholar] [CrossRef] [PubMed]
- Rueda, S. Health Inequalities among Older Adults in Spain: The Importance of Gender, the Socioeconomic Development of the Region of Residence, and Social Support. Women′s Health Issues 2012, 22, e483–e490. [Google Scholar] [CrossRef] [PubMed]
- Marmot, M. Social determinants of health inequalities. Lancet 2005, 365, 1099–1104. [Google Scholar] [CrossRef]
- McCartney, G.; Collins, C.; Mackenzie, M. What (or who) causes health inequalities: Theories, evidence and implications. Health Policy 2013, 113, 221–227. [Google Scholar] [CrossRef] [PubMed]
- Kunst, A.E. Describing socioeconomic inequalities in health in European countries: An overview of recent studies. Rev. d′Épidémiol. St. Publique 2007, 55, 3–11. [Google Scholar] [CrossRef]
- World Health Organization. Regional Office for Europe. In Social Inequalities in Health in Poland; WHO Regional Office for Europe: Copenhagen, Denmark, 2012; Available online: https://apps.who.int/iris/handle/10665/107306 (accessed on 10 November 2020).
- Duch, D.; Sokołowska, M. Health inequalities in Poland. Soc. Sci. Med. 1990, 31, 343–350. [Google Scholar] [CrossRef]
- Laskowska, I. Socio-Economic Inequalities in Health-Measurement Problems and the Results of Analyses for Poland. Folia Oeconomica Stetin. 2012, 10, 92–102. [Google Scholar] [CrossRef] [Green Version]
- Pikala, M.; Maniecka-Bryła, I. Socioeconomic inequalities in mortality due to all causes in the working age population of Poland in 2002 and 2011. Med. Pr. 2017, 68, 771–778. [Google Scholar] [CrossRef] [Green Version]
- Piłat, A.; Wilga, M.; Zawisza, K. Social determinants of Self-Rated Health among Polish women and men—Results from the COURAGE in Europe project. Zdr. Publiczne Zarz. 2019, 17, 90–99. [Google Scholar] [CrossRef]
- Ucieklak-Jeż, P. Diversification of the Healthy Life Expectancy (HLE) and the Factors Affecting It. In Prace Naukowe Uniwersytetu Ekonomicznego we Wrocławiu; UE Wrocław: Wrocław, Poland, 2009; pp. 102–119. [Google Scholar]
- Ucieklak-Jeż, P.; Bem, A. Social Determinants of Health (SDH) in the Evaluation of Health Inequities of the Inhabitants of Rural Areas in Poland. In Przedsiębiorczość I Zarządzanie 20 (3). Współczesne Problemy Społeczne i Ekonomiczne—Próba Oceny i Pomiaru; Społeczna Akademia Nauk: Łódź, Poland, 2019; pp. 171–183. [Google Scholar]
- Ucieklak-Jeż, P.; Bem, A. Does ″Rural″ Always Mean the Same? Macrosocial Determinants of Rural Populations′ Health in Poland. Int. J. Environ. Res. Public Health 2021, 17, 397. [Google Scholar] [CrossRef] [Green Version]
- Rój, J.; Jankowiak, M. Assessment of Equity in Access to Percutaneous Coronary Intervention (PCI) Centres in Poland. Healthcare 2020, 8, 71. [Google Scholar] [CrossRef] [PubMed] [Green Version]
- Jankowiak, M.; Rój, J. Regional Variability in the Access to Cardiac Rehabilitation in Poland. Healthcare 2020, 8, 468. [Google Scholar] [CrossRef] [PubMed]
- Dziennik Ustaw. The Constitution of the Republic of Poland of 2nd April. In Dziennik Ustaw No 78, Item 483; Dziennik Ustaw: Warszawa, Poland, 1997. [Google Scholar]
- Projekt Rozporządzenia Rady Ministrów w Sprawie Narodowego Programu Zdrowia na lata 2021–2025. 2020. Available online: https://legislacja.rcl.gov.pl/projekt/ (accessed on 8 November 2020).
- Statistics Poland (Główny Urząd Statystyczny). 2018. Available online: https://stat.gov.pl (accessed on 5 November 2020).
- Zhou, Z.; Fang, Y.; Zhou, Z.; Li, D.; Wang, D.; Li, Y.; Lu, L.; Gao, J.; Chen, G. Assessing Income_Related Health Inequality and Horizontal Inequity in China. Social Indicators Research. Int. Interdiscip. J. Qual. Life Meas. 2017, 132, 241–256. [Google Scholar]
- Barraza-Lloréns, M.; Panopoulou, G.; Díaz, B.Y. Income-related inequalities and inequities in health and health care utilization in Mexico, 2000–2006. Pan Am. J. Public Health 2013, 33, 122–130. [Google Scholar] [CrossRef] [PubMed] [Green Version]
- Chauvel, L.; Leist, A.K. Socioeconomic hierarchy and health gradient in Europe: The role of income inequality and of social origins. Int. J. Equity Health 2015, 14, 132. [Google Scholar] [CrossRef] [Green Version]
- Vásquez, F.; Paraje, G.; Estay, M. Income-related inequality in health and health care utilization in Chile, 2000–2009. Pan Am. J. Public Health 2013, 33, 98–106. [Google Scholar] [CrossRef] [PubMed] [Green Version]
- Chiu, S.Y.R.; Yang, Z. Influence of family income and medical insurance coverage on health-related quality of life and optimism in cancer patients at a Hong Kong private hospital: A cross-sectional study. Psychooncology 2019, 28, 1971–1977. [Google Scholar] [CrossRef]
- Wang, R.; Liu, Y.; Lu, Y.; Zhang, J.; Liu, P.; Yao, Y.; Grekousis, G. Perceptions of built environment and health outcomes for older Chinese in Beijing: A big data approach with street view images and deep learning technique. Comput. Environ. Urban Syst. 2019, 78, 101386. [Google Scholar] [CrossRef]
- Dilmaghani, M. The causal effects of education on health over the life course: Evidence from Canada. Public Health 2020, 186, 170–177. [Google Scholar] [CrossRef]
- Basu, A.; Jones, A.M.; Dias, P.R. Heterogeneity in the impact of type of schooling on adult health and lifestyle. J. Health Econ. 2018, 57, 1–14. [Google Scholar] [CrossRef] [Green Version]
- Petrovic, D.; de Mestral, C.; Bochud, M.; Bartley, M.; Kivimäki, M.; Vineis, P.; Mackenbach, J.; Stringhini, S. The contribution of health behaviors to socioeconomic inequalities in health: A systematic revie. Prev. Med. 2018, 113, 15–31. [Google Scholar] [CrossRef] [Green Version]
- Øvrum, A.; Gustavsen, G.W.; Rickertsen, K. Age and socioeconomic inequalities in health: Examining the role of lifestyle choices. Adv. Life Course Res. 2014, 19, 1–13. [Google Scholar] [CrossRef] [PubMed]
- Kabaya, K. Empirical analysis of associations between health expenditure and forest environments: A case of Japan. Ecol. Econ. 2021, 181, 106927. [Google Scholar] [CrossRef]
- Hanibuchi, T.; Nakaya, T.; Honjo, K. Trends in socioeconomic inequalities in selfrated health, smoking, and physical activity of Japanese adults from 2000 to 2010. SSM Popul. Health 2016, 2, 662–673. [Google Scholar] [CrossRef] [PubMed] [Green Version]
- Lyu, Y.; Forsyth, A.; Worthington, S. Built Environment and Self-Rated Health: Comparing Young, Middle-Aged, and Older People in Chengdu, China. Health Environ. Res. Des. J. 2021, 14, 229–246. [Google Scholar] [CrossRef]
- Amerio, A.; Brambilla, A.; Morganti, A.; Aguglia, A.; Bianchi, D.; Santi, F.; Costantini, L.; Odone, A.; Costanza, A.; Signorelli, C.; et al. COVID-19 Lockdown: Housing Built Environment’s Effects on Mental Health. Int. J. Environ. Res. Public Health 2020, 17, 5973. [Google Scholar] [CrossRef] [PubMed]
- Hone, T.; Mirelman, A.J.; Rasella, D.; Paes-Sousa, R.; Barreto, M.L.; Rocha, R.; Millett, C. Effect of economic recession and impact of health and social protection expenditures on adult mortality: A longitudinal analysis of 5565 Brazilian municipalities. Lancet Glob. Health 2019, 7, e1575–e1583. [Google Scholar] [CrossRef]
- Alaei, K.; Akgüngör, S.; Chao, W.-F.; Hasan, S.; Marshall, A.; Schultz, E.; Alaei, A. Cross-country analysis of correlation between protection of women’s economic and social rights, health improvement and sustainable development. BMJ Open 2019, 9, e021350. [Google Scholar] [CrossRef] [PubMed] [Green Version]
- Ajide, K.B.; Alimi, O.Y. The Conditioning Role of Institutions in Environment- Health Outcomes Nexus in Africa. Int. Econ. J. 2020, 34, 634–663. [Google Scholar] [CrossRef]
- Krueger, P.M.; Rogers, R.G.; Hummer, R.A.; Leclere, F.B.; Bond Huie, S.A. Socioeconomic Status and Age: The Effect of Income Sources and Portfolios on U.S. Adult Mortality. Sociol. Forum 2003, 18, 465. [Google Scholar] [CrossRef]
- Buttazzoni, A.; Doherty, S.; Minaker, L. How Do Urban Environments Affect Young People’s Mental Health? A Novel Conceptual Framework to Bridge Public Health, Planning, and Neurourbanism. Public Health Rep. 2021. [Google Scholar] [CrossRef]
- Kim, M.; Woo, B.; Kim, H.-J.; Yi, E.; Hong, S. Examining Housing Environments and Health Status of Older Adults with Physical Disabilities in South Korea. J. Aging Soc. Policy 2021, 1–15. [Google Scholar]
- Lei, L.; Lin, Z. From traditional and socialist work-unit communities to commercial housing: The association between neighborhood types and adult health in urban China. Chin. Sociol. Rev. 2021, 53, 254–284. [Google Scholar] [CrossRef] [PubMed]
- Tsalta-Mladenov, M.; Andonova, S. Health-related quality of life after ischemic stroke: Impact of sociodemographic and clinical factors. Neurol. Res. 2021, 43, 553–561. [Google Scholar] [CrossRef] [PubMed]
- Wirayuda, A.A.B.; Chan, M.F. A Systematic Review of Sociodemographic, Macroeconomic, and Health Resources Factors on Life Expectancy. Asia Pac. J. Public Health 2021, 33, 1010539520983671. [Google Scholar] [CrossRef]
- Sleight, A.G.; Lyons, K.D.; Vigen, C.; Macdonald, H.; Clark, F. The association of health-related quality of life with unmet supportive care needs and sociodemographic factors in low-income Latina breast cancer survivors: A single-centre pilot study. Disabil. Rehabil. 2019, 41, 3151–3156. [Google Scholar] [CrossRef]
- Åström, M.; Persson, C.; Lindén-Boström, M.; Rolfson, O.; Burström, K. Population health status based on the EQ-5D-Y-3L among adolescents in Sweden: Results by sociodemographic factors and self-reported comorbidity. Qual. Life Res. M Int. J. Qual. Life Asp. Treat. Care Rehabil. 2018, 27, 2859–2871. [Google Scholar] [CrossRef] [Green Version]
- Nigusso, F.T.; Mavhandu-Mudzusi, A.H. Health-related quality of life of people living with HIV/AIDS: The role of social inequalities and disease-related factors. Health Qual. Life Outcomes 2021, 19, 63. [Google Scholar] [CrossRef]
- Aistov, A.; Aleksandrova, E.; Gerry, C.J. Voluntary Private Health Insurance, Health- Related Behaviours and Health Outcomes: Evidence from Russia. Eur. J. Health Econ. 2021, 22, 281–309. [Google Scholar] [CrossRef] [PubMed]
- Kim, Y.; Schneider, T.; Faß, E.; Lochbaum, M. Personal social capital and self-rated health among middle-aged and older adults: A cross-sectional study exploring the roles of leisure-time physical activity and socioeconomic status. BMC Public Health 2021, 21, 48. [Google Scholar] [CrossRef]
- Dunn, J.R.; Walker, J.D.; Graham, J.; Weiss, C.B. Gender Differences in the Relationship between Housing, Socioeconomic Status, and Self-Reported Health Status. Rev. Environ. Health 2021, 19, 177–196. [Google Scholar] [CrossRef]
- Miura, K.; Takamori, A.; Hamazaki, K.; Tsuchida, A.; Tanaka, T.; Origasa, H.; Inadera, H. Dietary patterns during pregnancy and health-related quality of life: The Japan Environment and Children′s Study. PLoS ONE 2020, 5, e0236330. [Google Scholar] [CrossRef] [PubMed]
- Kim, J.-H.; Park, E.-C. Impact of socioeconomic status and subjective social class on overall and health-related quality of life. BMC Public Health 2015, 15, 783. [Google Scholar] [CrossRef] [PubMed] [Green Version]
- Theil, H. Economics and Information Theory; North–Holland: Amsterdam, The Netherlands, 1967. [Google Scholar]
- Liu, X.; Yang, X.; Guo, R. Regional Differences in Fossil Energy-Related Carbon Emissions in China′s Eight Economic Regions: Based on the Theil Index and PLS-VIP Method. Sustainability 2020, 12, 2576. [Google Scholar] [CrossRef] [Green Version]
- Muszyńska, J.; Oczki, J.; Wędrowska, E. Income inequality in Poland and the United Kindgdom decomposition of the Theil index. Folia Oeconomica Stetin. 2018, 18, 108–122. [Google Scholar] [CrossRef] [Green Version]
- Hale, T. The Theoretical Basics of Popular Inequality Measures, University of Texas Inequality Project. 2006. Available online: http://utip.gov.utexas.edu/tutorials/theo_basic_ineq_measures.doc (accessed on 20 September 2021).
- Akita, T. Decoomposing regional income inequality in China and Indonesia using two-stage nested Theil decomposition method. Ann. Reg. Sci. 2003, 37, 55–77. [Google Scholar] [CrossRef]
- Wu, Y.; Song, Y.; Yu, T. Spatial Differences in China′s Population Aging and Influencing Factors: The Perspectives of Spatial Dependence and Spatial Heterogeneity. Sustainability 2019, 11, 5959. [Google Scholar] [CrossRef] [Green Version]
- Baker, L.C. Measuring Competition in Health Care Markets. Health Serv. Res. 2001, 36, 223–251. [Google Scholar]
- Rój, J. Competition measurement of hospitals in Poland. The Herfindahl-Hirschman Index approach. Ekonomika 2016, 95, 166–181. [Google Scholar] [CrossRef] [Green Version]
- Cutler, D.M.; Morton, F.S. Hospitals, Market Share, and Consolidation. JAMA 2013, 310, 1964–1970. [Google Scholar] [CrossRef] [PubMed]
- Jankowiak, M. The EU Member States′ national healthcare systems compared using the single synthetic index. Econ. Bus. Rev. 2021, 7, 37–49. [Google Scholar] [CrossRef]
- Bem, A.; Siedlecki, R.; Prędkiewicz, P.; Gazzola, P.; Ryszawska, B.; Ucieklak-Jeż, P. Hospitals′ Financial Health in Rural and Urban Areas in Poland: Does It Ensure Sustainability? Sustainability 2019, 11, 1932. [Google Scholar] [CrossRef] [Green Version]
- Ucieklak-Jeż, P.; Bem, A. Dostępność opieki zdrowotnej na obszarach wiejskich w Polsce (Availability of health care in rural areas in Poland). Probl. Drob. Gospod. Rol. Probl. Small Agric. Hold. 2017, 4, 117–131. [Google Scholar]
- Pantyley, V. Health inequalities among rural and urban population of Eastern Poland in the context of sustainable development. Ann. Agric. Environ. Med. 2017, 24, 477–483. [Google Scholar] [CrossRef]
- Opolski, K.; Dwórznik, M. Zróżnicowanie w rozwoju regionlanym (dylematy I argumenty). MAZOWSZE Studia Reg. 2012, 9, 11–26. [Google Scholar]
- Gorzelak, G. “Twarde” i “miękkie” metody badania struktur regionalnych. In Teoretyczne i Aplikacyjne Wyzwania Współczesnej Geografii Społecznoekonomicznej, ″Studia KPZK PAN″; Churski, P., Ed.; PWN: Warszawa, Poland, 2018; pp. 173–184. [Google Scholar]
- Gorzelak, G.; Smętkowski, M. Rozwój Regionalny, Polityka Regionalna; Forum Obywatelskiego Rozwoju: Warszawa, Poland, 2019. [Google Scholar]
- Bartkowski, J. Tradycja zaborów a współczesne zachowania społeczne w Polsce. In Oblicza Lokalności: Tradycja i Współczesność; Kurczewska, J., Ed.; Wydawnictwo. IFIS PAN: Warsaw, Poland, 2004; pp. 267–302. [Google Scholar]
- Virchow, R.C. Report on the typhus epidemic in Upper Silesia. Am. J. Public Health 2006, 96, 2102–2105. [Google Scholar] [CrossRef]
Figure 1.
Within-voivodeship inequality. Source: Authors’ calculations.

Figure 2.
Within-voivodeship inequality. Source: Author’s calculation. Legend for Fig 1 and 2: (DL)—Lower Silesian, (K-P)—Kuyavian-Pomeranianranian, (LE)—Lubelskie, (LU)—Lubuskie, (Ł)—Łódż, (MŁ)—Lesser Poland, (O)—Opole, (PK)—Podkarpackie, (PL)—Podlaskie, (PO)—Pomeranian, (ŚL)—Silesian, (ŚW)—Świetokrzyskie, (W-M)—Warmian-Masurian, (WL)—Wielkopolska, (ZP)—Zachodniopomorskie, (MAZ)—Masovian, (W-stoł)—Warsaw—Capital, (MAZ_R)—Masovian—regional.


Table 1.
Selected existing research on the socioeconomic determinants of health.
| Author(s) of Research | Health-Outcome Measures | Examined Socioeconomic Determinants |
|---|---|---|
| Zhou, Z., Fang, Y., Zhou, Z., Li, D., Wang, D., Li, Y., Lu, L., Chen, J.G.G. [57]. | Health-related quality of life. | Income/urban and rural/educational status. |
| Barraza-Lloréns, M., Panopoulou, G., Díaz, B.Y. [58]. | Self-assessed health, physical limitations, and chronic illness. | Three standard-of-living measures: household income, wealth, and expenditure. Area of residence, geographic region, education, employment, ethnicity, and health insurance. |
| Chauvel, L., Leist, A.K. [59]. | Self-rated health. | Income, education, occupation. |
| Vásquez, F., Paraje, G., and Estay, M. [60]. | Self-assessed health status and physical limitations. | Ethnicity, employment status, health insurance, and region of residence. |
| Chiu, S.Y.R., Yang, Z. [61]. | Health-related quality of life. | Family income, medical insurance coverage. |
| Wang, R., Liu, Y., Lu, Y., Zhang, J., Liu, P., Yao, Y., Grekousis, G. [62]. | Mental health indicators—depression and anxiety, the physical health indicators—the self-rated health condition (SRH) and chronic diseases. | Six perceptual attributes of the built environment: wealth, safety, liveliness, depression, bore and beauty. |
| Dilmaghani, M. [63]. | Self-rated health. | Education, gender. |
| Basu, A., Jones, A.M., Dias, P.R. [64]. | Depression and cigarette smoking. | Schooling systems. |
| Petrovic, D., de Mestral, C., Bochud, M., Bartley, M., Kivimäki, M., Vineis, P., Mackenbach, J., Stringhini, S. [65]. | Cardiometabolic disorders, mortality. | Health behaviours: smoking, alcohol consumption, physical activity and diet. |
| Øvrum, A., Gustavsen, G.W., Rickertsen, K. [66]. | Self-assessed health. | Income, education. |
| Kabaya, K. [67]. | Health spending. | Forest environments. |
| Hanibuchi, T., Nakaya, T., Honjo, K. [68]. | Health-related outcome—self-rated health (SRH), smoking, physical activity. | Income, education, occupation, and subjective social class identification. |
| Lyu, Y., Forsyth, A., and Worthington, S. [69]. | Self-rated health. | Built environment—types of living buildings, having a household smoker, weekly exercise. |
| Amerio, A., Brambilla, A., Morganti, A., Aguglia, A., Bianchi, D., Santi, F., Costantini, L., Odone, A., Costanza, A., Signorelli, C., Serafini, G., Amore, M., Capolongo, S. [70]. | Mental health—depression. | Housing design. |
| Hone, T., Mirelman, A.J., Rasella, D., Paes-Sousa, R., Barreto, M.L., Rocha, R., Millett, C. [71]. | Mortality. | Social protection expenditure. |
| Alaei, K., Akgüngör, S., Chao, W.-F., Hasan, S., Marshall, A., Schultz, E., Alaei, A. [72]. | Mortality rate under 5, mortality rate neonatal, immunisation of diphtheria, pertussis and tetanus (DPT), immunisation of measles, lifetime risk of maternal death (%), life expectancy at birth. | Protection of women’s economic and social rights (WESR): - Physical Integrity Index- Empowerment Rights Index - Women’s Political Rights - Independence of the Judiciary |
| Ajide, K.B., Alimi, O.Y. [73]. | Human life longevity, infant deaths. | Carbon emission. |
| Krueger, P.M., Rogers, R.G., Hummer, R.A., Leclere, F.B., Bond Huie, S.A. [74]. | Mortality rate. | Income, age. |
| Buttazzoni, A., Doherty, S., and Minaker, L. [75]. | Mental health—depression. | Urbanization. |
| Kim, M., Woo, B., Kim, H.-J., Yi, E., Hong, S. [76]. | Perceived stress, depressive symptoms, suicidal ideation, and life satisfaction. | Housing environment—home ownership and perceived house accessibility. |
| Lei, L., Lin, Z. [77]. | Self-rated health. | Neighbourhood types, social cohesion, availability of social institutions in the residents’ committees, water quality. |
| Tsalta-Mladenov, M., Andonova, S. [78]. | Health-related quality of life. | Age, sex, education, working activity. |
| Wirayuda, A.A.B., Chan, M.F. [79]. | Life expectancy. | Infant mortality rate, literacy rate, education level, socioeconomic status, population growth, gender, gross domestic product, income level, unemployment rate, inflation rate, smoking rate, pollution, vaccinations, health care resources, health care facilities, the number of the health care professionals, public health expenditure. |
| Sleight, A.G., Lyons, K.D., Vigen, C., Macdonald, H., Clark, F. [80]. | Health-related quality of life. | Income. |
| Åström, M., Persson, C., Lindén-Boström, M., Rolfson, O., Burström, K. [81]. | Health-related quality of life. | Sex, age, self-reported comorbidity, parents’ occupational status. |
| Nigusso, F.T., Mavhandu-Mudzusi, A.H. [82]. | Health-related quality of life, Global Physical Health, Global Mental Health. | Gender, age, unemployment, household food insecurity and co-morbidities. |
| Aistov, A., Aleksandrova, E., Gerry, C.J. [83]. | Self-assessed health. | Supplemental health insurance and the utilization of health care; health behaviours: visits to doctor, cigarette and alcohol consumption, physical exercise, body mass index; monthly salary, education, chronic disease, if household has children under 3 years, gender, place of living. |
| Kim, Y., Schneider, T., Faß, E., Lochbaum, M. [84]. | Self-rated health. | Education, household income levels. |
| Dunn, J.R., Walker, J.D., Graham, J., Weiss, C.B. [85]. | Self-reported health. | Social support, type of housing, gender. |
| Miura, K., Takamori, A., Hamazaki, K., Tsuchida, A., Tanaka, T., Origasa, H., Inadera, H. [86]. | Health-related quality of life. | Dietary pattern. |
| Kim, J.-H., Park, E.-Ch. [87]. | Health-related quality of life, overall quality of life. | Household income, education levels. |
Source: Authors’ study.
Table 2.
Relations between macro-regions, regions and voivodeships in Poland.
| Macro-Region (NUTS 1) | Region (NUTS 2) | Voivodeship |
|---|---|---|
| South-West | Lower-Silesian (DL) Opole (O) | Lower-Silesian (DL) Opole (O) |
| South | Lesser Poland (MŁ) Silesian (ŚL) | Lesser Poland (MŁ) Silesian (ŚL) |
| North-West | Lubuskie (LU) Wielkopolska (WL) Zachodniopomorskie (ZP) | Lubuskie (LU) Wielkopolska (WL) Zachodniopomorskie (ZP) |
| North | Kuyavian-Pomeranianranian (K-P) Warmian-Masurian (W-M) Pomeranian (PO) | Kuyavian-Pomeranianranian(K-P) Warmian-Masurian (W-M) Pomeranian (PO) |
| Central | Łódż (Ł) Świętokrzyskie (ŚW) | Łódż (Ł) Świętokrzyskie (ŚW) |
| East | Lubelskie (LE) Podkarpackie (PK) Podlaskie (PL) | Lubelskie (LE) Podkarpackie (PK) Podlaskie (PL) |
| Masovian | Warsaw- capital (W-Stoł) Masovian-regional (MAZ_R) | Masovian (MAZ) |
Source: Statistics Poland.
Table 3.
Socioeconomic determinants of health.
| Category | Variable | Description |
|---|---|---|
| Economic | IN—Income of powiat | Total income of powiat in PLN per capita |
| Education | EDE—Gross scholarization ratios for elementary level | The number of pupils enrolled in elementary school to the number of pupils who qualify for elementary education. |
| EDJH—Gross scholarization ratios for junior high level | The number of pupils enrolled in junior high school to the number of pupils who qualify for junior high school education. | |
| Employment | EA—Employment rate in agriculture | The percentage of the population aged 15–64 working in agriculture, forestry, hunting and fishing. |
| EI—Employment rate in industry | The percentage of the population aged 15–64 working in industry and construction. | |
| ES—Employment rate in services | The percentage of the population aged 15–64 working in the trades, repairing of vehicles, transport and the warehouse industry, accommodation and catering and information and communication. | |
| EF—Employment rate in financial sector | The percentage of the population aged 15–64 working in the financial and insurance sector and real estate market. | |
| UR—Unemployment rate | The number of unemployed people as a percentage of the labour force. | |
| WAP—Working-age population | The percentage of the working-age population. | |
| Demography | FR—Feminization ratio | Females per 100 males. |
| OR—Old-age dependency ratio | Population in the post-production age to 100 people of working age. | |
| Built environment | WS—Water supply | The percentage of people using the water supply system. |
| SS—Sewage system | The percentage of people using the sewage system. | |
| GS—Gas supply | The percentage of people using a gas supply system. | |
| F—Forest area | Forest area in hectares per capita. | |
| GR—Green area other than forest | Green area (parks, lawns, etc.) in hectares per capita. | |
| DIS—Cultural buildings adapted for the disabled | Cultural buildings adapted for the disabled per 1 square km. |
Source: Authors’ study.
Table 4.
Descriptive statistics of socioeconomic determinants of health in Poland.
| Mean | Median | Max. | Min. | Std.dev. | Variance | |
|---|---|---|---|---|---|---|
| IN—Income of powiat | 4958.0250 | 4691.6984 | 9564.0381 | 3743.9767 | 837.5420 | 70,1476.6483 |
| EDE—Gross scholarization ratios for elementary level | 0.9409 | 0.9401 | 1.1260 | 0.7605 | 0.0571 | 0.0033 |
| EDJH—Gross scholarization ratios for junior high level | 0.9916 | 0.9809 | 1.4000 | 0.6032 | 0.1041 | 0.0108 |
| EA—Employment rate in agriculture | 0.1338 | 0.1011 | 0.5023 | 0.0008 | 0.1080 | 0.0117 |
| EI—Employment rate in industry | 0.1350 | 0.1228 | 0.7757 | 0.0190 | 0.0760 | 0.0058 |
| ES—Employment rate in service sector | 0.0782 | 0.0610 | 1.2904 | 0.0153 | 0.0769 | 0.0059 |
| EF—Employment rate in financial sector | 0.0104 | 0.0068 | 0.3084 | 0.0016 | 0.0187 | 0.0003 |
| UR—Unemployment rate | 0.0481 | 0.0439 | 0.1435 | 0.0110 | 0.0230 | 0.0005 |
| WAP—Working-age population | 0.6106 | 0.6122 | 0.6444 | 0.5580 | 0.0133 | 0.0002 |
| FR- Feminization ratio | 0.5114 | 0.5096 | 0.5442 | 0.4892 | 0.0091 | 0.0001 |
| OR—Old-age dependency ratio | 0.2084 | 0.2060 | 0.3147 | 0.1386 | 0.0250 | 0.0006 |
| WS—Water supply | 0.9133 | 0.9477 | 1.0000 | 0.2264 | 0.1016 | 0.0103 |
| SS—Sewage supply | 0.6446 | 0.6529 | 0.9999 | 0.1274 | 0.1927 | 0.0371 |
| GS—Gas supply | 0.5028 | 0.4234 | 9.7775 | 0.0000 | 0.7342 | 0.5391 |
| F—Forest area | 0.3550 | 0.2606 | 3.6629 | 0.0005 | 0.3968 | 0.1574 |
| GR—Green area other than forest | 0.0033 | 0.0029 | 0.0160 | 0.0002 | 0.0022 | 0.0000 |
| DIS—Cultural buildings adapted for the disabled | 0.0001 | 0.0001 | 0.0005 | 0.0000 | 0.0001 | 0.0000 |
Source: Authors’ calculations.
Table 5.
Correlations between independent variables and the mortality rate.
| Independent Variable | Spearman’s Rank Correlation Coefficient (Absolute Value) | Significant Correlation? |
|---|---|---|
| IN—Income of powiat | 0.19 | Yes |
| EDE—Gross scholarization ratios for elementary level | 0.05 | No |
| EDJH—Gross scholarization ratios for junior high level | 0.06 | No |
| EA—Employment rate in agriculture | 0.12 | Yes |
| EI—Employment rate in industry | 0.21 | Yes |
| ES—Employment rate in services sector | 0.15 | Yes |
| EF—Employment rate in financial sector | 0.05 | No |
| UR—Unemployment rate | 0.20 | Yes |
| WAP—Working-age population | 0.39 | Yes |
| FR—Feminization ratio | 0.18 | Yes |
| OR—Old-age dependency ratio | 0.65 | Yes |
| WS—Water supply | 0.02 | No |
| SS—Sewage supply | 0.23 | Yes |
| GS—Gas supply | 0.22 | Yes |
| F—Forest area | 0.01 | No |
| GR—Green area other than forest | 0.04 | No |
| DIS—Cultural buildings adapted for the disabled | 0.16 | Yes |
Source: Authors’ calculations.
Table 6.
National overall and component inequality of socioeconomic determinants of health distribution.
Table 6.
National overall and component inequality of socioeconomic determinants of health distribution.
| Variable | TWP | TBP | TBR | T |
|---|---|---|---|---|
| IN—Income of powiat | 0.0091 | 0.0003 | 0.0019 | 0.0113 |
| EDE—Gross scholarization ratios for elementary level | 0.0009 | 0.0140 | 0.0003 | 0.0151 |
| EDJH—Gross scholarization ratios for junior high level | 0.0029 | 0.0150 | 0.0003 | 0.0182 |
| EA—Employment rate in agriculture | 0.1466 | 0.0393 | 0.0442 | 0.2300 |
| EI—Employment rate in industry | 0.0393 | 0.0235 | 0.0047 | 0.0675 |
| ES—Employment rate in service sector | 0.0996 | 0.0185 | 0.0118 | 0.1299 |
| EF—Employment rate in financial sector | 0.2439 | 0.0180 | 0.0579 | 0.3198 |
| UR—Unemployment rate | 0.0344 | 0.0238 | 0.0101 | 0.0684 |
| WAP—Working-age population | 0.0001 | 0.0000 | 0.0000 | 0.0001 |
| FR—Feminization ratio | 0.0007 | 0.0000 | 0.0000 | 0.0007 |
| OR—Old-age dependency ratio | 0.0033 | 0.0003 | 0.0004 | 0.0040 |
| WS—Water supply | 0.0025 | 0.0003 | 0.0003 | 0.0031 |
| SS—Sewage supply | 0.0152 | 0.0012 | 0.0012 | 0.0175 |
| GS—Gas supply | 0.1491 | 0.0203 | 0.0068 | 0.1762 |
| F—Forest area | 0.1754 | 0.0237 | 0.0405 | 0.2396 |
| GR—Green area other than forest | 0.4505 | 0.0062 | 0.0077 | 0.4644 |
| DIS—Cultural buildings adapted for the disabled | 0.1087 | 0.0063 | 0.0081 | 0.1230 |
Source: Authors’ calculations.
Table 7.
The HHI values for the socioeconomic determinants of health in Poland in 2018.
| Variable/Macro-Region | South-West | South | North-West | North | Central | East | Masovian |
|---|---|---|---|---|---|---|---|
| IN—Income of powiat | 1536 | 787 | 876 | 967 | 1604 | 997 | 2633 |
| EDE—Gross scholarization ratios for elementary level | 1480 | 754 | 894 | 890 | 1508 | 985 | 1668 |
| EDJH—Gross scholarization ratios for junior high level | 1465 | 751 | 884 | 880 | 1517 | 977 | 1647 |
| EA—Employment rate in agriculture | 1725 | 1276 | 1282 | 903 | 1951 | 1027 | 1439 |
| EI—Employment rate in industry | 1540 | 803 | 984 | 906 | 1600 | 1115 | 1782 |
| ES—Employment rate in service sector | 2059 | 1022 | 986 | 1408 | 1957 | 1153 | 3952 |
| EF—Employment rate in financial sector | 3365 | 1667 | 1458 | 1810 | 3176 | 1378 | 7518 |
| UR—Unemployment rate | 1514 | 756 | 965 | 875 | 1646 | 985 | 3059 |
| WAP—Working-age population | 1469 | 750 | 874 | 887 | 1526 | 978 | 3252 |
| FR—Feminization ratio | 1476 | 755 | 873 | 902 | 1538 | 983 | 3282 |
| OR—Old-age dependency ratio | 1491 | 774 | 866 | 948 | 1578 | 986 | 1924 |
| WS—Water supply | 1471 | 785 | 874 | 902 | 1541 | 1002 | 3289 |
| SS—Sewage supply | 1503 | 801 | 863 | 967 | 1749 | 1030 | 3484 |
| GS—Gas supply | 1579 | 817 | 938 | 1205 | 2493 | 1303 | 3637 |
| F—Forest area | 1901 | 1033 | 1213 | 1074 | 2055 | 1027 | 1559 |
| GR—Green area other than forest | 1637 | 974 | 903 | 1055 | 1927 | 1208 | 2831 |
| DIS—Cultural buildings adapted for the disabled | 1635 | 852 | 1028 | 901 | 1664 | 1010 | 1454 |
Source: Authors’ calculations.
Table 8.
Parameters of the regression models.
| Independent Variable | Preliminary Model | Final Model | ||
|---|---|---|---|---|
| a | p-Value | a | p-Value | |
| IN—Income of powiat | 0.0002 | 0.482 | ||
| EA—Employment rate in agriculture | −0.0117 | 0.194 | −0.0215 | <0.001 |
| EI—Employment rate in industry | 0.0057 | 0.561 | ||
| ES—Employment rate in service sector | 0.0057 | 0.685 | ||
| UR—Unemployment rate | 0.0511 | 0.027 | 0.0427 | 0.049 |
| WAP—Working-age population | 0.1704 | 0.003 | 0.2173 | <0.001 |
| FR—Feminization ratio | −0.0653 | 0.026 | −0.0940 | <0.001 |
| OR—Old-age dependency ratio | 0.3536 | < 0.001 | 0.3567 | <0.001 |
| SS—Sewage supply | −0.0285 | < 0.001 | −0.0356 | <0.001 |
| GS—Gas supply | −0.0120 | < 0.001 | −0.0119 | <0.001 |
| DIS—Cultural buildings adapted for the disabled | −364.3296 | 0.553 | ||
| Intercept | −2.6892 | −1.5577 | ||
| R square | 0.7906 | 0.7220 | ||
Source: Authors’ calculations.
Publisher’s Note: MDPI stays neutral with regard to jurisdictional claims in published maps and institutional affiliations. |
© 2021 by the authors. Licensee MDPI, Basel, Switzerland. This article is an open access article distributed under the terms and conditions of the Creative Commons Attribution (CC BY) license (https://creativecommons.org/licenses/by/4.0/).
Share and Cite
MDPI and ACS Style
Rój, J.; Jankowiak, M. Socioeconomic Determinants of Health and Their Unequal Distribution in Poland. Int. J. Environ. Res. Public Health 2021, 18, 10856. https://doi.org/10.3390/ijerph182010856
AMA Style
Rój J, Jankowiak M. Socioeconomic Determinants of Health and Their Unequal Distribution in Poland. International Journal of Environmental Research and Public Health. 2021; 18(20):10856. https://doi.org/10.3390/ijerph182010856
Chicago/Turabian StyleRój, Justyna, and Maciej Jankowiak. 2021. "Socioeconomic Determinants of Health and Their Unequal Distribution in Poland" International Journal of Environmental Research and Public Health 18, no. 20: 10856. https://doi.org/10.3390/ijerph182010856
Note that from the first issue of 2016, this journal uses article numbers instead of page numbers. See further details here.