
Monitoring the Spatiotemporal Evolution of the Green Dam in Djelfa Province, Algeria


1
Department of Landscape Protection and Environmental Geography, University of Debrecen, Egyetem tér 1, 4032 Debrecen, Hungary
2
Department of Geography and Regional Planning, University of Larbi Ben M’hidi Oum El Bouaghi, Oum el Bouaghi 04000, Algeria
3
Department of Natural Geography and Geoinformatics, University of Debrecen, Egyetem tér 1, 4032 Debrecen, Hungary
4
Department of Social Geography and Regional Development, University of Debrecen, Egyetem tér 1, 4032 Debrecen, Hungary
*
Author to whom correspondence should be addressed.
Sustainability 2021, 13(14), 7953; https://doi.org/10.3390/su13147953
Submission received: 1 June 2021
/
Revised: 28 June 2021
/
Accepted: 7 July 2021
/
Published: 16 July 2021
(This article belongs to the Section Environmental Sustainability and Applications)
Abstract
:Green walls and green dams are increasingly being considered as part of many national and international desertification initiatives. This paper studies the spatiotemporal evolution of the green dam in the Moudjbara region (Djelfa Province, Algeria), from 1972 to 2019, by using Landsat imagery, Land Change Modeler, and OpenLand package. The future evolution of pine plantations, for the year 2029, was also forecasted, based on an anthropogenic scenario (i.e., anthropogenic pressure is the main driver of the green dam destruction). Our findings revealed that the green dam project was successful for a few years, but, after that, pine plantations deteriorated significantly, due to forest harvesting, livestock overgrazing, and the proliferation of the pine caterpillar processionary, which destroyed most of the reforestation. Land change modeler predicted a huge degradation of pine plantations for the year 2029, and if the deforestation continues at the same rate, the green dam in the Moudjbara region will disappear during the next few decades. Being aware of this threat, the Algerian authorities are now planning to reforest more than 1.2 million ha under the latest rural renewal policy, by introducing new principles related to sustainable development, fighting desertification, and climate change adaptation. We strongly recommend moving away from the singular tree planting focus, to diversifying desertification control methods.
1. Introduction
Land degradation and desertification (LDD) are the main reasons for the rapid changes that are affecting the majority of the earth’s drylands, resulting in an overall loss of habitats and changes in vegetation cover, plant composition and diversity, hydrologic conditions, and soil properties [1]. Moreover, LDD, in the developing countries, in particular, is considered one of the key drivers of many social, ecological, and economic problems [2] Today, regions such as North Africa, Sahel, the Middle East, and China are suffering from LDD that is decreasing land productivity and exacerbating poverty, which could jeopardize the livelihoods of the local people in these countries [3]. The assessment of land degradation mitigation programs, therefore, looks to be essential, as it may offer land managers and decision-makers crucial insights [2].
Anthropogenic revegetation has been regarded as the most effective way to reverse LDD worldwide [4,5]. Particularly, green walls and green dams are increasingly being considered as part of many national and international desertification initiatives [6,7,8], with the main aim of preventing sand encroachment in dryland. However, while the afforestation programs that have been carried out in China (e.g., Grain for Green program, and Three-North Shelterbelt Project) have been widely studied, and their outcomes have been assessed, and consisted of the reduction in the amount of degraded land by 12,120 km2 and a decrease in the average annual occurrence of sandstorms by 20.3%, between 2009 and 2014 [6,9], the reforestation programs that have been carried out in the arid Sahel (i.e., the Great Green Wall of the Sahara and the Sahel) and North Africa (i.e., the green dam) have been seldomly researched, and their outcomes have been poorly examined [6,10].
The Algerian regions bordering the Sahara desert (High Plains) have undergone rapid LDD for decades [11]. Numerous researchers have used remote sensing imagery to study LDD in this sensitive ecosystem [12,13,14,15,16], and have found that most of the studied regions have undergone dramatic land degradation. In addition to sandstorms, the LDD phenomenon is triggered by the expansion of cultivated land in marginal areas, urban expansion, and livestock overgrazing [16,17,18]. Being fully aware of the severity of the LDD issue, since independence, the Algerian authorities have put several programs into operation to combat desertification [19]. The green dam project was, without any doubt, the most important action that was implemented within the framework of these programs. The project extends across arid and semi-arid zones, between the 300 mm and 200 mm isohyets. It is a 3 M ha band of plantations, running from east to west. It is over 1200 km long (from the Algerian–Moroccan border, to the Algerian–Tunisian border), and has an average width of about 20 km. Initially, it was intended to stop the advance of the desert towards the north of the country, particularly aiming at conserving natural resources, improving the living conditions of residents, and avoiding their exodus to urban areas [18,20,21,22]. The green dam inspired many African countries to build “the Great Green Wall of the Sahara and the Sahel”, to combat LDD and biodiversity loss, and to reduce climate change impacts and poverty [20,21].
Authors who studied the Algerian green dam [11,23,24,25,26] have emphasized its limited success in achieving the planned goals, mainly because of the lack of planning, livestock overgrazing, and non-involvement of the local population in the project. In this context, this research studies the evolution of the green dam in the Moudjbara region (Djelfa Province), from its establishment in 1972 until now, by using remote sensing data. The future evolution of pine plantations is also forecasted based on an anthropogenic scenario (i.e., anthropogenic pressure is the main driver of the green dam changes). The research aims also to identify the main driving forces of green dam destruction in recent decades. Overall, we hypothesize that the total area occupied by pine plantations has been decreasing since their establishment, due to human pressure, mainly overgrazing and land-use changes (i.e., extensive cereal cultivation in pasture land). We also expect a vanishment of the green dam in the next few decades if its deterioration continues at the same rates.
2. Materials and Methods
2.1. Study Area
The study area “Moudjbara” is located in the southeastern part of Djelfa Province, which in turn is situated in the Saharan Atlas, nearly 300 km south of the capital Algiers (Figure 1). Between the latitude 34°41′33.23″ N and 34°31′3.19″ N, and longitude 3°19′36.64″ E and 3°23′0.26″ E with a surface of 10,000 ha, the area is characterized by a slightly rugged flat terrain with relatively homogeneous relief at an altitude ranging between 1200 and 1400 m. The soils of the area are dominated by little evolved and shallow rendzine. The climate is semi-arid with cold and harsh winters (the average minimum temperature of the coldest month is 0.1 °C), and hot and dry summers (the average maximum temperature of the warmest month is 33.8 °C). There is, therefore, a sharp thermal contrast between seasons, as winters are cold and summers are warm. Mean rainfall is 300 mm [20] and, since 1972, a drying climate trend has been noted [19]. It is worth noting that this zone is considered a gateway to the Great Sahara, which makes it a region of major importance in fighting against desertification and protecting soil against wind erosion. Moudjbara was the first perimeter to be afforested using Aleppo pine (Pinus halepensis) in 1972 within the framework of the green dam project. The plantations were established near the existing natural Aleppo pine forests. In addition to natural and planted Aleppo pine forests, the area also includes urban zones (the town of Djelfa and its suburban areas), croplands used mainly for cereal production and degraded steppe pasture land dominated by Stipa tenacissima, Artemisia herba-alba and Lygeum spartum used for livestock grazing.
2.2. Data Collection
For monitoring green dam evolution and changes in our study area during the following time intervals: 1972–1989, 1989–1999, 1999–2009, and 2009–2019, we used Landsat images with 30 m resolution. Five temporal datasets (see Table 1) were acquired from the US Geological Survey. We chose Landsat because it provides the longest archive of images [27], dating as far back as the early 1970s. Besides, the Landsat MSS data set has four spectral bands (4–7) with a spatial resolution of 60 m. Landsat TM data set has seven spectral bands with a spatial resolution of 30 m, and the Landsat 8 OLI data set has nine spectral bands (2–7) with a spatial resolution of 30 m. We used good quality and cloud-free scenes for the realization of LULC maps. Except for the 1972 images, which were taken in September because of the unavailability of cloud-free images in the same season, all Landsat images (1989, 1999, 2009, and 2019 images) were taken in July, which allows comparison of the resulting LULC maps.
2.3. Image Preprocessing and Classification
The acquired images were initially subject to radiometric calibration to convert digital numbers to the top of atmosphere radiance (i.e., converting pixels values to spectral radiance and reflectance). By using the FLAASH tool in the ENVI 5.3 (Exelis Visual Information Solutions, Boulder, CO, USA) we then performed atmospheric correction, which consists of the conversion of the top of atmospheric values that were generated from radiometric calibration to the bottom of the atmosphere reflectance (surface reflectance) and to remove the atmospheric effects to obtain the reflectance of ground images. Finally, all images were clipped out according to the vector of the study area and projected in ArcGIS 10.8.1 (Environmental Systems Research Institute, Redlands, CA, USA).
There are various techniques for classifying satellite imagery to generate LULC maps. Among the existing techniques, supervised classification is an image-processing method regularly used to detect changes in land surface features in different multi-spectral global datasets [28,29]. In this study, we applied the supervised classification method using a maximum likelihood classifier (MLC) in ArcGIS 10.8.1 (Environmental Systems Research Institute, Redlands, CA, USA) to classify the acquired Landsat images. The MLC technique depends on the likelihood that each pixel fits in a particular class based on a normal distribution of each band’s data in the classification [30,31,32]. The first step in the classification process is to create training samples. In this study, training samples were created from high-resolution Google Earth aerial photographs by digitalizing at least 20 polygons for each one of the five LULC classes considered in this study, which included degraded steppes (degraded steppe pasture land dominated by Stipa tenacissima, Artemisia herba-alba and Lygeum spartum used for livestock grazing), urban areas (the town of Djelfa and its suburban areas), crops (croplands used mainly for cereal production), dense plantations and natural forests (natural forests and dense plantations of Aleppo pine), and open plantations (Aleppo pine plantations planted within the framework of the green dam project). It is worth stating that the separation of natural forests and dense plantations of Aleppo pine was impossible, so these two classes were grouped into one LULC class. The low number of LULC classes included in this study made the classification procedure easy for the green dam monitoring study.
2.4. Accuracy Assessment
Accuracy assessment is very useful for individual classification when the resulting data are used for change detection analysis [27]. To assess the classification accuracy of the resulting maps, over 150 random points (validation samples) were created on the study area on each classified map for the five LULC classes using ArcGIS 10.8.1 (Environmental Systems Research Institute, Redlands, CA, USA). The validation data were derived through the interpretation of high-resolution Google Earth aerial photographs close to the date of the acquisition of the images. Kappa coefficient and overall accuracy were computed for the resulting LULC maps based on confusion matrices.
2.5. LULC Changes Analysis and Prediction of the Future Scenario for the Year 2029
Chronological series of LULC maps are required to understand the range, types, and spatial configuration of changes that have occurred to a specific site, and to understand what drives those changes as well as to predict future changes. To identify spatially explicit LULC change in the Moudjbara region, we used the Land Change Modeler (LCM) tool and the OpenLand package in Idrisi TerrSet 18.7 (Clark Labs, Worcester, MA, USA) and R 4.0.3 (R Foundation for Statistical Computing, Vienna, Austria), respectively. The LCM is the most widely used spatial model for LULC change analysis and for predicting future scenarios [33], and OpenLand implements a complete intensity analysis including tools for the generation of standardized multilevel output graphics [34]. Change analysis was performed for the following time intervals: 1972–1989, 1989–1999, 1999–2009, and 2009–2019, with the aim of (1) quantifying LULC changes in each time interval, (2) assessing whether the size and annual rate of change differ over periods by comparing the observed rates to the uniform rate (i.e., the rate that would occur if the annual changes were spread evenly over the entire time extent), and (3) scrutinizing the spatiotemporal evolution of the green dam project in the study area (i.e., quantifying gains, losses, and net changes in pine plantations in each time interval).
The future evolution of pine plantations in the Moudjbara region for the year 2029 was also forecast using LCM, based on the following steps: (1) we grouped all the transitions from pine plantations (i.e., dense-cover or low-cover pine plantations) to other LULC classes (i.e., degraded steppes, urban areas, and croplands) in one sub-model, assuming that the underlying drivers of these changes are the same (i.e., the anthropogenic pressure); (2) based on their potential in explaining the changes, i.e., pine plantation destruction, the following explanatory variables were used: digital elevation model (DEM), distance from croplands, distance from steppes, distance from roads, and distance from urban areas (we used Cramer’s V coefficient to test the significance of each variable); (3) after selecting the suitable set of explanatory variables, transitions were modeled in LCM using an Artificial Neural Network (ANN) approach based on multi-layer perceptron (MLP); (4) change prediction was executed based on the Markov chain, and the calibration periods from 1999 and 2009 were used to perform the modeling for 2019; (5) after evaluating the accuracy and skill measure of the modeling, the developed model and the maps for 2009 and 2019 were used to estimate the changes in pine plantations for the year 2029.
2.6. Temporal Changes in Human Population and Livestock Numbers
In this study, the temporal changes in human population and livestock numbers, mainly sheep and cattle, within Djelfa Province were used as indicators for reconstructing past changes in land use and for indirectly assessing changes in human pressure on the green dam. Demographic and livestock data were obtained from the Office for National Statistics (ONS; https://www.ons.dz/ [accessed on 29 Jun 2021]) and the Ministry of Agriculture and Rural Development (MARD; http://madrp.gov.dz/ [accessed on 29 Jun 2021]), respectively. The prediction of human population size and livestock numbers for the year 2030 was also calculated, by using the mean annual growth rate (3.3%) of the period 2008–2018 in the case of human population and the power function in the case of livestock.
3. Results
3.1. Accuracy Assessment and LULC Changes
The accuracy assessment of the LULC maps of the five temporal periods is shown in Table 2. The overall accuracy ranged from 75.5% to 94%, and the Kappa from 64% to 89.9%. The 2019 LULC map had the highest overall accuracy (94%) and Kappa (89.9%), whereas the 1989 LULC map had the lowest overall accuracy (75.5%) and Kappa (64.1%).
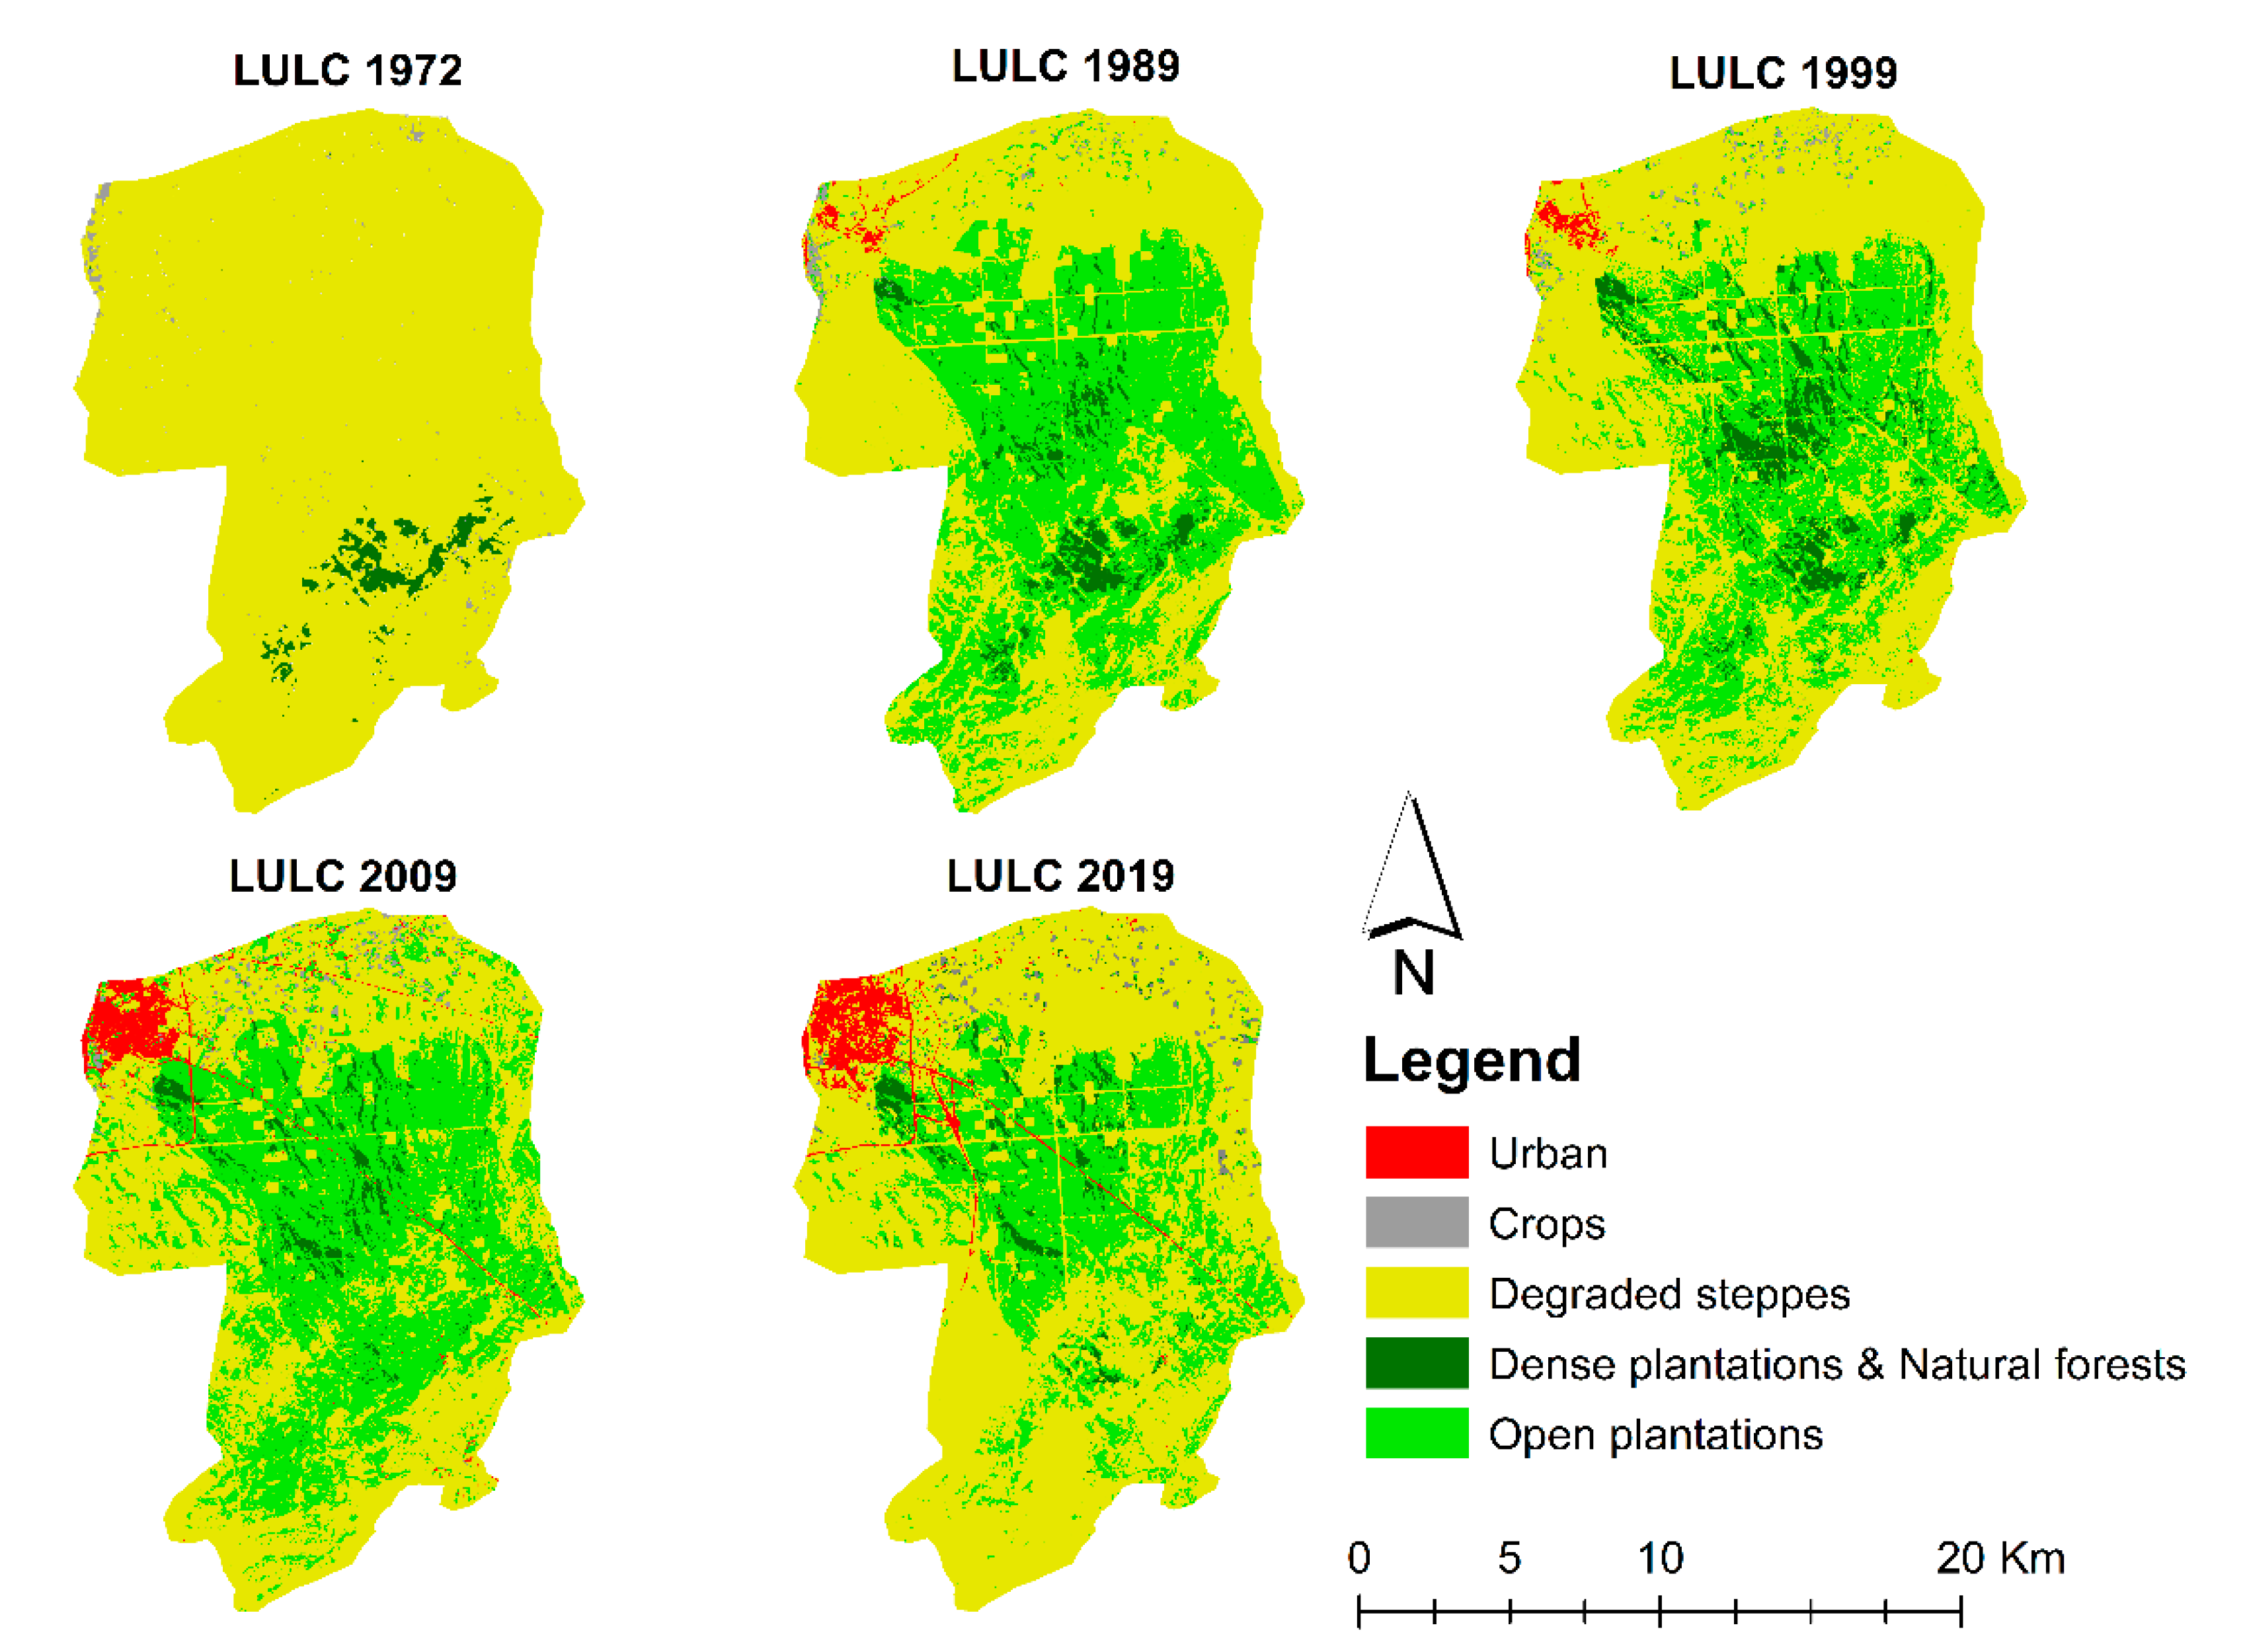
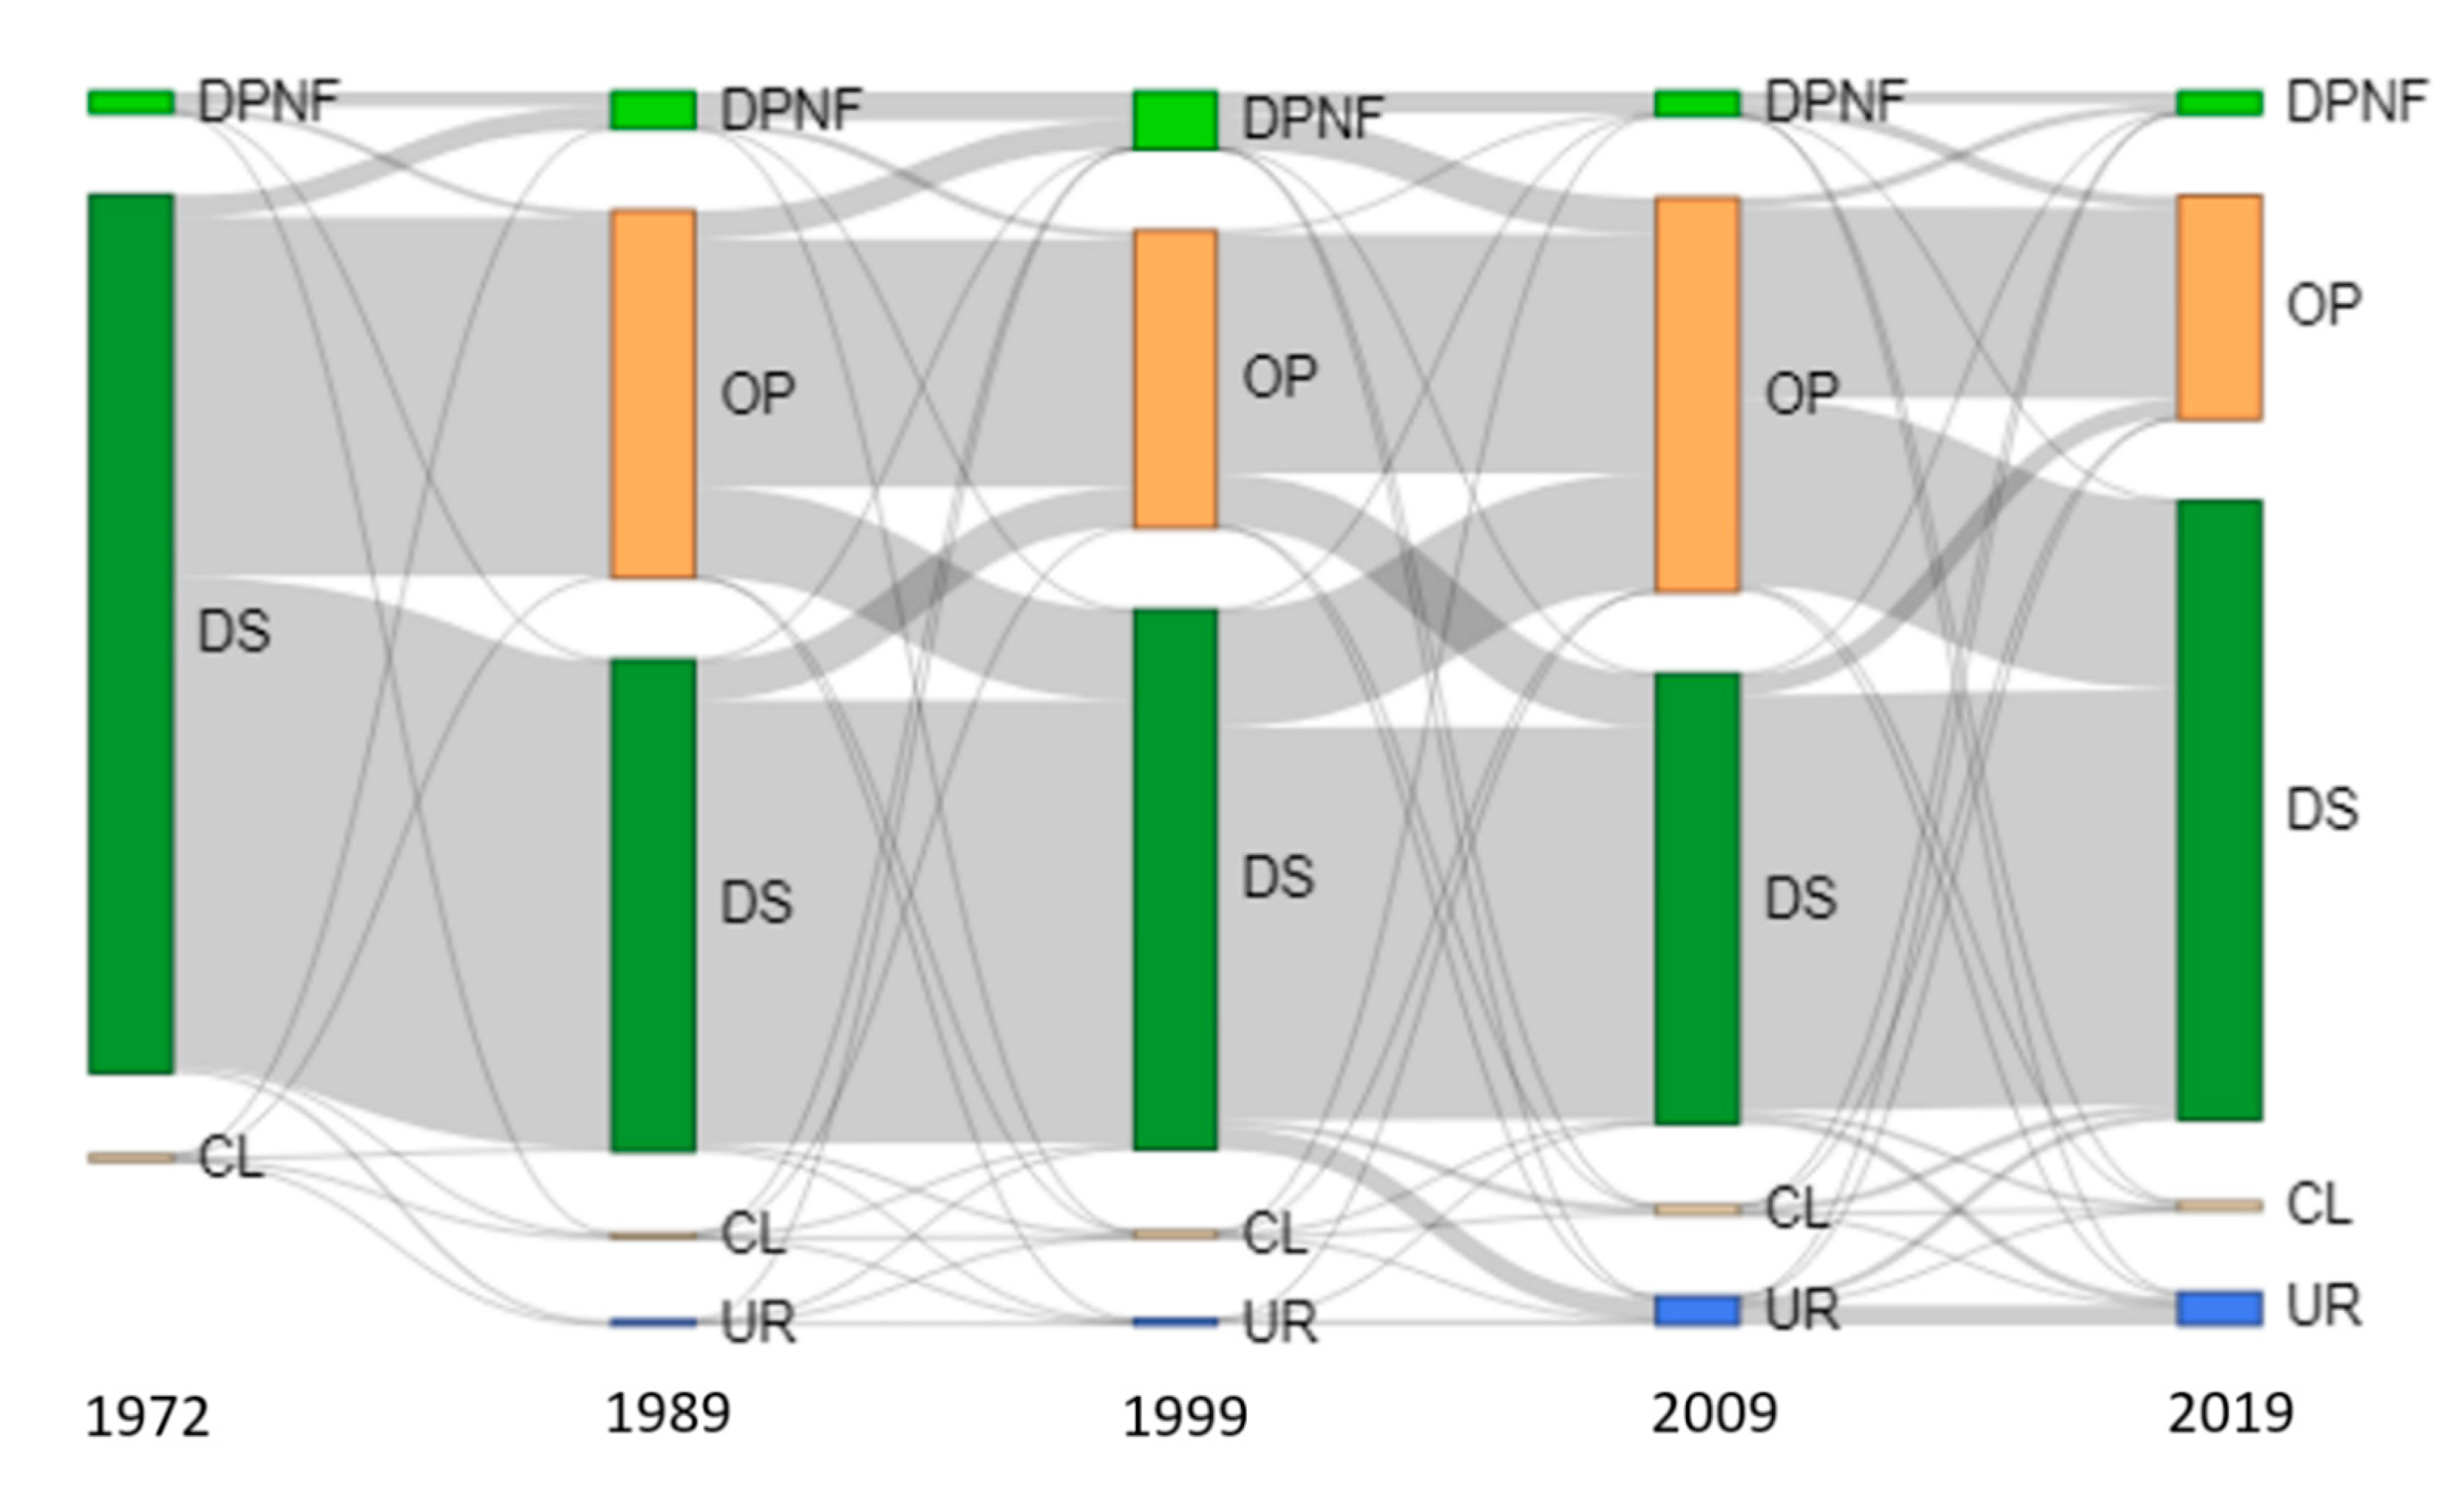
The LULC change analysis results clarify the historical change and give us a clear statement about the land use practice in different years and the dynamic change in each cover class. The spatial distribution of the five LULC classes (degraded steppes, crops, urban, dense plantations and natural forests, and open plantations) during the five-time periods 1972, 1989, 1999, 2009, and 2019 are presented in Figure 2, and the statistics (including the changes from one period to another) are shown in Table 3. The results show that both negative and positive changes occurred in the LULC pattern of the Moudjbara region over the last 47 years. In 1972, most of the study area was occupied by degraded steppes, and by 1989, a great part of the degraded steppes had converted to open plantations, as a result of the afforestation within the framework of the green dam project (Table 3, Figure 3). Open plantations had a massive increase, from non-existing in 1972 to 10345 ha in 1989, before decreasing between 1989 and 1999, and increasing between 1999 and 2009, by −19.9% and 33.6%, respectively (Table 3, Figure 3). Between 2009 and 2019, open plantations showed a massive drop (−43%), from 11074 ha to 6303 ha (Table 3, Figure 3). The area occupied by dense plantations and natural forests increased linearly between 1972 and 1999, from 585 ha to 1615.65 ha, and then decreased linearly to 626.6 ha in 2019 (Table 3, Figure 3). The surface of the urban area grew from 0 ha in 1972 to 117.20 ha in 1989, and 151.7 ha in 1999, accounting for 117% in 1989 and 29.5% in 1999 (Table 3, Figure 3). The urban area kept growing, to reach 776.5 ha (an increase of 412%) in 2009 and 910.4 ha (an increase of 17%) in 2019 (Table 3, Figure 3). The area of the cropland declined from 157 ha (−15.3%) in 1972 to 133 ha in 1989, then grew linearly to reach 174 ha (31%) in 1999 and 236.3 ha (35.7%) in 2009, before decreasing slightly to 235.5 ha (−0.34%) in 2019 (Table 3, Figure 3). The area of the degraded steppes showed a non-linear evolution during the time intervals studied. During the first time interval (1972–1989), this LULC class shrunk by −44.08%, from 24,626.62 ha to 13,770.76 ha, then expanded by 9.94% during the second time interval (1989–1999), to reach 15,139.31 ha (Table 3, Figure 3). The area of the degraded steppes declined by −16.50% between 1999 and 2009 and then increased (+36.81) to reach 17,293.83 ha in 2019 (Table 3, Figure 3).
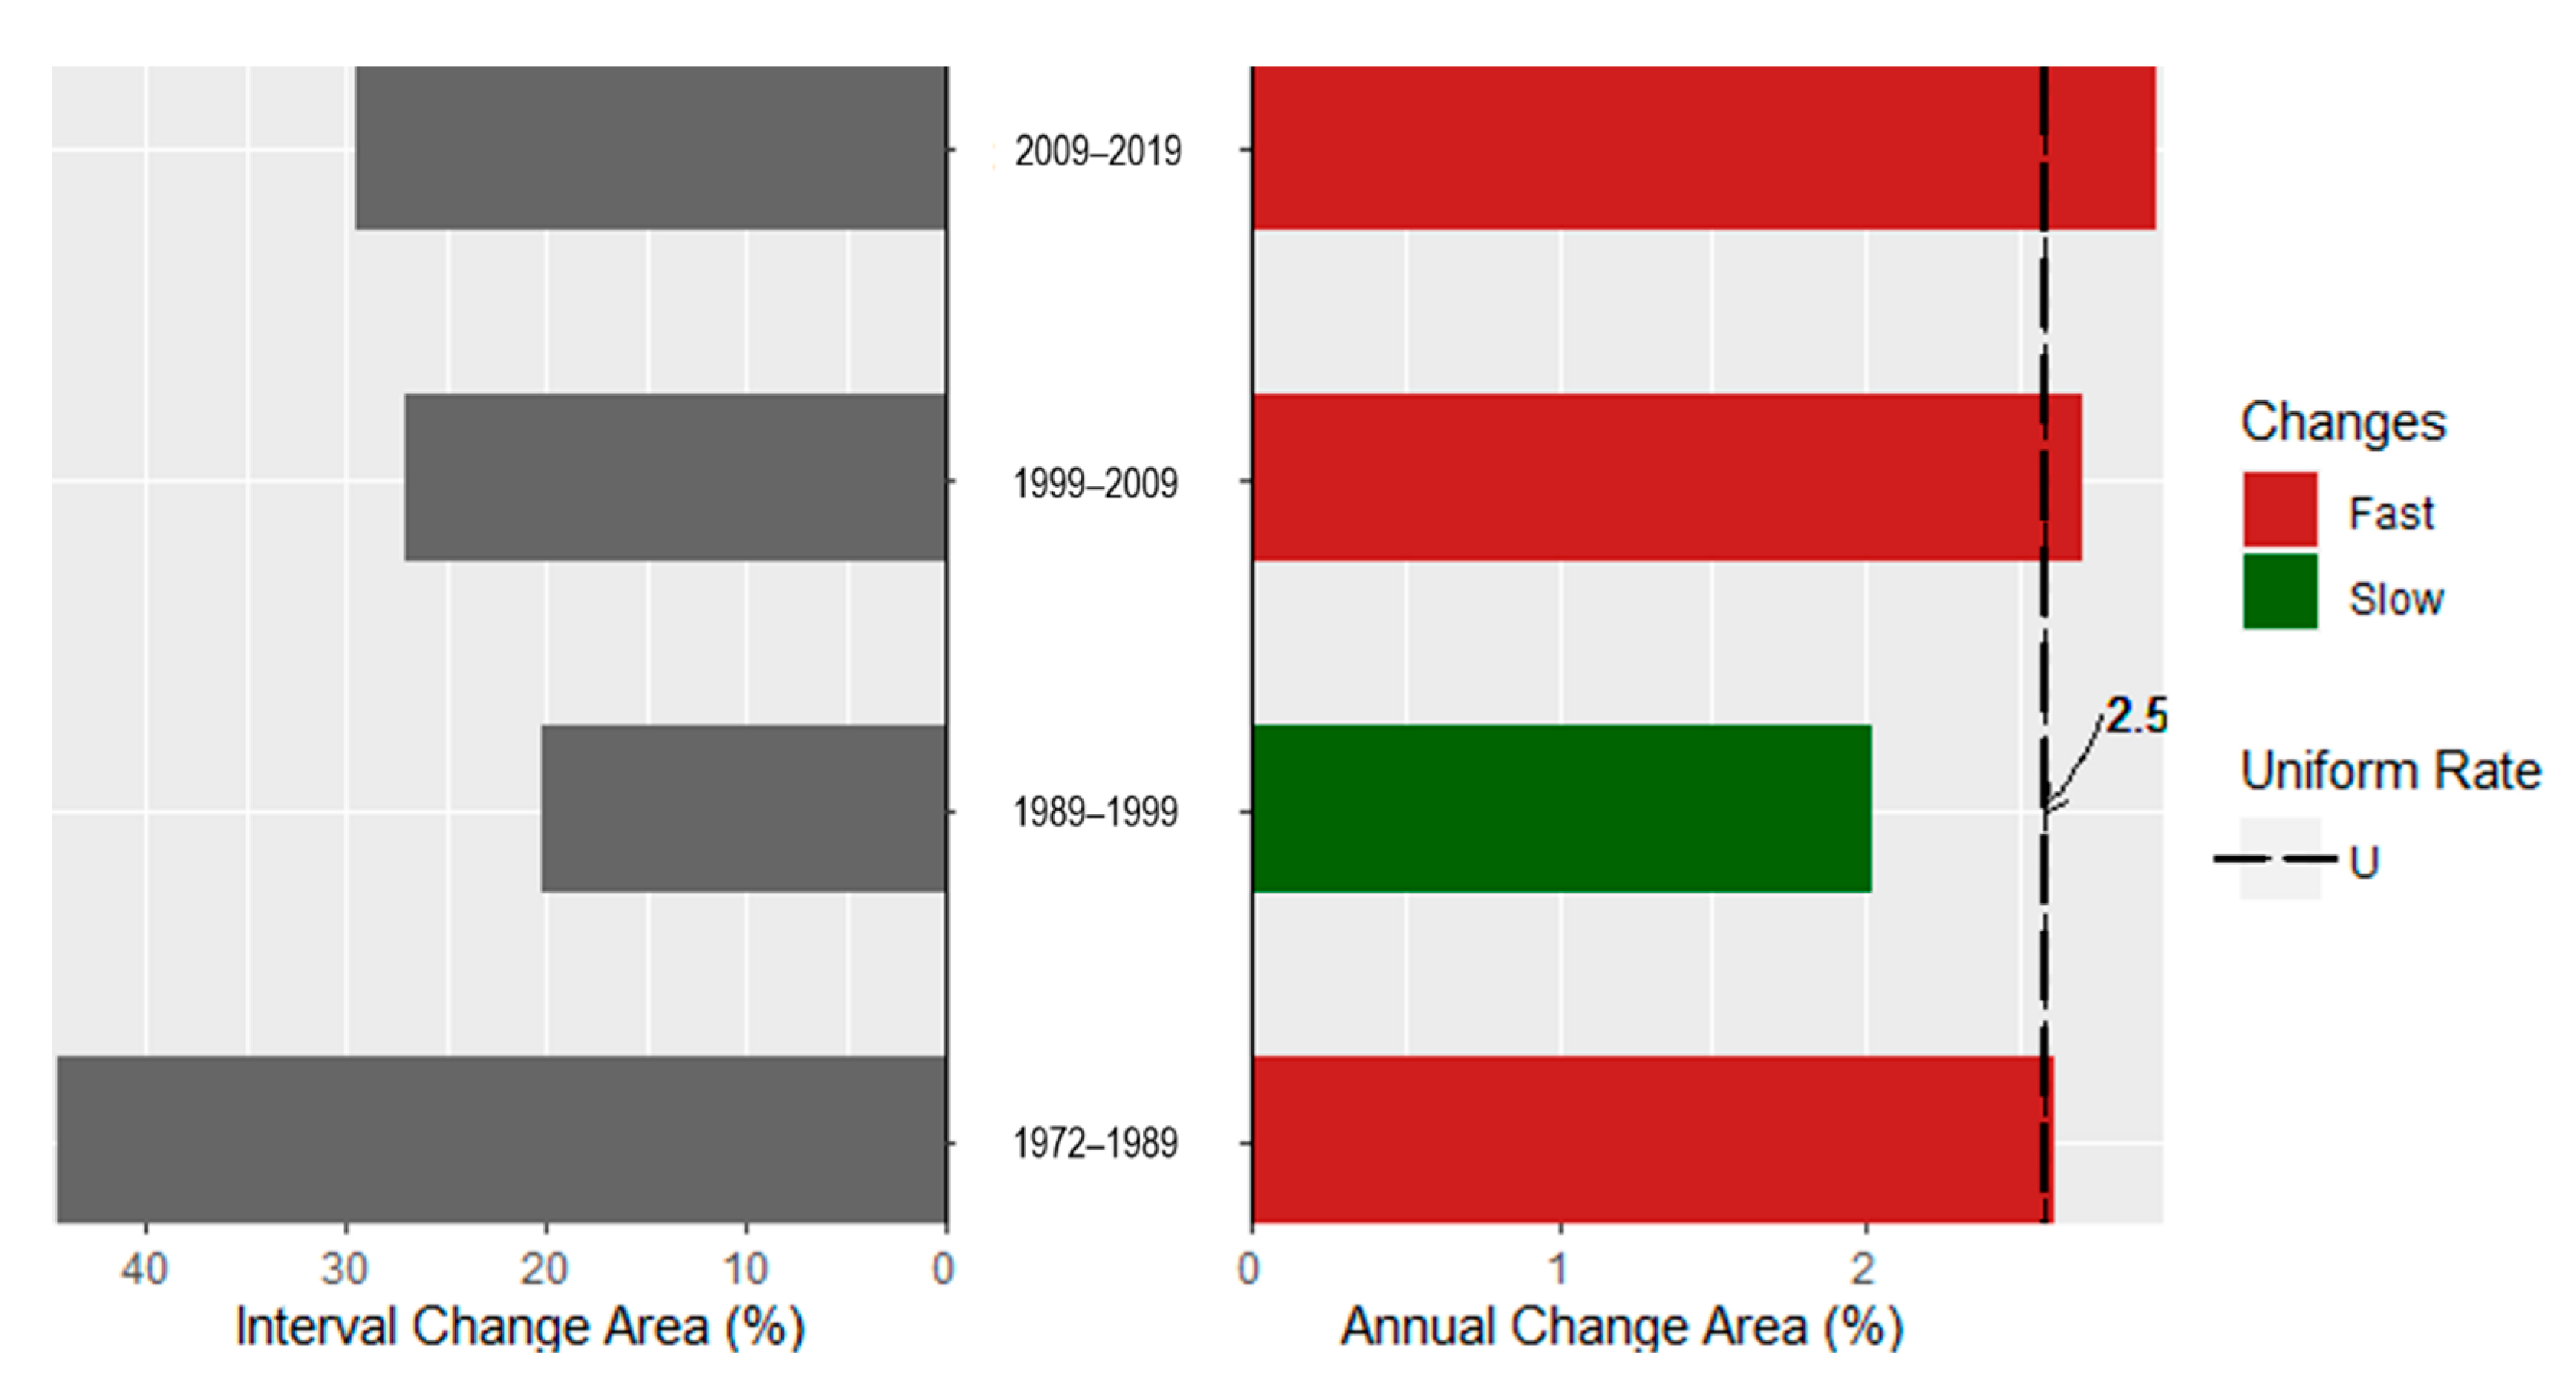
Figure 4 shows that the rate of LULC change is not perfectly stationary during the studied time intervals, because the bars on the right do not all equal the uniform line. The left side of Figure 4 shows that the size of the change during the second time interval (1989–1999) is the smallest. However, the size of the change during the first time interval (1972–1989) is the greatest, and its duration is the longest (17 years). The right side of Figure 4 shows that the annual rate of LULC change was slower in the second time interval (1989–1999) compared to the other time intervals, and the rate of LULC change became fast in 1999.
3.2. Green Dam Evolution during the Last 47 Years and Its Future Projection by the Year 2029
Firstly, we should note that the green dam in the Moudjbara region includes all open plantations and a great portion of dense plantations and natural forests. The results clearly show both losses and gains in these two LULC classes during the studied periods (Figure 5). During the first period, 1972–1989, the open plantations gained approximately 10,000 ha, which had been occupied by degraded steppes; during the same period, the transition of dense plantations and natural forests gained 600 ha on the degraded steppes and lost about 200 ha, which became open plantations (Figure 6). During the second period, between 1989 and 1999, the open plantations lost about 2000 ha, which was replaced by degraded steppes and reinforced by dense plantations, which had almost 600 ha of net gain during that period (Figure 6). Throughout the third period, 1999–2009, the open plantations had almost 2700 ha of net gain; this change was at the expense of degraded steppes and dense plantations, which lost practically 900 ha (Figure 6). From 2009 to 2019, the open plantations lost more than 4000 ha, which became degraded steppes (Figure 6). Land change modeler predicted a huge loss, of more than 2000 ha, in the area of the open plantations, by 2029, which will be converted to degraded steppes (Figure 6). Figure 7 reveals a nonlinear evolution of the area occupied by open plantations between 1972 and 2019, and the land change modeler predicted a huge degradation of open plantations by the year 2029; if deforestation continues at the same rate, open plantations will disappear in the Moudjbara region during the next few decades. Whereas, the area occupied by dense plantations and natural forests remain almost stable during the studied time intervals.
3.3. Evolution of Human Population and Livestock Numbers
The human population of Djelfa Province has increased exponentially between 1996 and 2018 and will continue increasing until it reaches a value of more than two million inhabitants in 2030 (Figure 8). Similarly, the livestock numbers have increased markedly between 1998 and 2020 (Figure 8). Between 2020 and 2030, the increase in livestock numbers will continue with the same rate, and the power function predicted a value of more than five million heads in 2030 (Figure 8).
4. Discussion
The spatiotemporal dynamics of LULC in the Moudjbara region experienced both negative and positive changes during the five-time intervals studied. The rate of the LULC change was not stationary during the studied time intervals. The intensity of the LULC change was slow in the first and second time intervals and became relatively fast from 1999. Likewise, our results revealed a nonlinear evolution of the area that was occupied by pine plantations between 1972 and 2019 and predicted a huge degradation of the green dam by the year 2029.
Our findings showed that during the first period of study (1972–1989), the area of the Moudjbara gained a huge extent of pine plantations (the natural forest was the central point for plantations), which replaced the steppe pasture lands. Although the increase in pine forests (mainly the planted ones) is a positive change, it is worth highlighting some flaws of this anthropogenic revegetation. The first error was the conversion of the steppe pasture lands, where the natural vegetation of Artemisia herba-alba, Lygeum spartum, Stipa tenacissima, and many other plants have adapted to the harsh climatic conditions, and that constitutes, in itself, a natural barrier against LDD. Another issue was the lack of integration of the local populations; the project did not allow the local populations to adopt it as a complementary initiative to their socio-economic way of life, which is based mainly on livestock farming [12,28]. Many pastoralists opposed the establishment of these plantations, which led to the emergence of permanent conflicts that lasted for a long time [7].
Although many efforts were made, during the second period (1989–1999), to improve the quality of reforestation and the application of other operations, such as dune fixation and track openings [29], the total area of the pine plantations decreased sharply. This degradation was mainly due to the expansion of croplands (pine plantations were harvested at some locations to increase the amount of arable land, especially for the cultivation of cereals), livestock overgrazing, and phytophagous attacks [35]. It should be noted that the use of monospecific stands of Aleppo pine has resulted in the proliferation of pine caterpillar processionary, which has destroyed most of the reforestations [6,36,37]. Furthermore, in many sites, the trees were planted on encrusted soils that impeded the penetrability of their roots, and, as a consequence, led to the development of dwarf trees.
The third period, between 1999 and 2009, was characterized by a notable increase in the area occupied by open plantations, but also by a decrease in dense plantations, due to human pressure on the territory (i.e., tree cutting for timber and fuelwood provision), or due to their direct use as a sylvo-pastoral system. The expansion of plantations during that period was mainly due to the reforestation program that was carried out by the General Directorate of Forests (DGF) in 2000, within the framework of the National Reforestation Plan (PNR). The PNR was characterized by the diversification of actions, ranging from reforestation to improving steppic rangelands by regulating livestock farming.
Our findings revealed a massive loss in pine plantations between 2009 and 2019, and most of the lost areas were converted to degraded steppes. To satisfy the need for increasing the number of livestock, pine plantations were completely harvested in some locations, to increase the area of pastures. In other locations, and as cited above, pine plantations were used as a sylvo-pastoral system, with a high livestock grazing pressure. Long-term overgrazing, coupled with prolonged cyclical droughts [38], has hampered the natural regeneration of these plantations. It is also worth noting that this period, in particular, was characterized by a widespread occurrence of fires and a huge proliferation of the pine caterpillar processionary, which led to the disappearance of large areas of the green dam.
Based on the anthropogenic scenario, i.e., where anthropogenic pressure is the main driver of the green dam destruction, our model predicted a loss of a huge amount of pine plantations in the Moudjbara region during the next decade. This finding is in line with the study by [28], who found only traces of the green dam, formed by a few bands of puny Aleppo pines that were scattered over a desertified area.
5. Conclusions
This paper has presented a study of LULC changes and their effect on the Moudjbara plantations during the last 47 years (from 1972 to 2019), using freely available data (Landsat imagery) and geographic information systems. The findings revealed that the green dam project was effective for a few years and, after this period, pine plantations underwent a considerable deterioration due to forest clearing, livestock overgrazing, and the proliferation of the pine caterpillar processionary, which has destroyed much of the reforestation. Our analysis also predicted that if the degradation continues at the same rate, the green dam project will disappear during the next few decades, in the analyzed region. Being aware of the threat of the destruction of the green dam, the General Directorate of Forests (DGF) is currently planning to reforest more than 1.2 million ha in the region, under the latest rural renewal policy, by introducing new principles related to sustainable development, fighting desertification, and climate change adaptation. Today, the DGF has learnt lessons from former programs, and plantations with monospecific stands are barred.
In our opinion, for effective control of LDD in Algeria, the institutional approach has to be reviewed and science has to play a more important role in guiding policies. The authorities should care about what people want and what nature needs. The focus only on tree planting often does not serve the livelihood demands of the local people, and the use of this practice as a key approach to stop the encroachment of sand on dryland where trees do not naturally grow, and where shrubs or grass are the native and natural land, needs to be reviewed since woody vegetation encroachment could affect the functioning of this fragile ecosystems. Scientific research has demonstrated that natural recovery is much more effective in restoring degraded arid steppes [38,39]. Hence, we strongly recommend moving away from the singular tree planting focus to diversifying desertification control methods. In this context, the application of dune stabilization methods (including mechanical, chemical and biological methods) is effective in reducing sand and dust storms [40,41,42]. Likewise, the implementation of sustainable grazing management practices, such as “grazing exclusion”, is necessary to enable the natural recovery of the degraded steppes [38,39].
Author Contributions
Conceptualization, R.B., G.S. and Y.K.; methodology, R.B. and Y.K.; software, R.B. and Y.K.; validation, R.B., G.S. and Y.K.; formal analysis, R.B. and Y.K.; resources, G.S., G.N., B.A.; data curation, R.B. and Y.K.; writing—original draft preparation, R.B.; writing—review and editing, Y.K., G.S., G.N. and B.A.; supervision, Y.K., G.S. and G.N.; funding acquisition, G.S. and G.N. All authors have read and agreed to the published version of the manuscript.
Funding
Project No. TKP2020-IKA-04 has been implemented with the support provided by the National Research, Development and Innovation Fund of Hungary, financed under the 2020-4.1.1-TKP2020 funding scheme.
Institutional Review Board Statement
Not applicable.
Informed Consent Statement
Not applicable.
Data Availability Statement
Data produced and processed in this study are included in the published article. Datasets can be acquired from the corresponding author for appropriate purposes.
Conflicts of Interest
The authors declare no conflict of interest.
References
- Hishe, H.; Giday, K.; Van Orshoven, J.; Muys, B.; Taheri, F.; Azadi, H.; Feng, L.; Zamani, O.; Mirzaei, M.; Witlox, F. Analysis of land use land cover dynamics and driving factors in Desa’a forest in Northern Ethiopia. Land Use Policy 2021, 101, 105039. [Google Scholar] [CrossRef]
- Amiraslani, F. Multi-stakeholder and multi-level interventions to tackle climate change and land degradation: The case of Iran. Sustainability 2018, 10, 2000. [Google Scholar] [CrossRef] [Green Version]
- Mirzabaev, A.; Wu, J. Chapter 3: Desertification. Available online: https://www.ipcc.ch/site/assets/uploads/sites/4/2020/05/Chapter-3_FINAL.pdf (accessed on 17 May 2021).
- Du, L.; Zeng, Y.; Ma, L.; Qiao, C.; Wu, H.; Su, Z.; Bao, G. Effects of anthropogenic revegetation on the water and carbon cycles of a desert steppe ecosystem. Agric. For. Meteorol. 2021, 300, 108339. [Google Scholar] [CrossRef]
- Zhang, Z.; Huisingh, D. Combating desertification in China: Monitoring, control, management and revegetation. J. Clean. Prod. 2018, 182, 765–775. [Google Scholar] [CrossRef]
- Mirzabaev, A.; Wu, J.; Evans, J.; Garcia-Oliva, F.; Hussein, I.A.G.; Iqbal, M.H.; Kimutai, J.; Knowles, T.; Meza, F.; Nedjroaoui, D.; et al. Desertification—PhilPapers. Available online: https://philpapers.org/rec/NGCD (accessed on 6 May 2021).
- Goffner, D.; Sinare, H.; Gordon, L.J. The great green wall for the Sahara and the Sahel initiative as an opportunity to enhance resilience in Sahelian landscapes and livelihoods. Reg. Environ. Chang. 2019, 19, 1417–1428. [Google Scholar] [CrossRef] [Green Version]
- Romano, N.; Lignola, G.P.; Brigante, M.; Bosso, L.; Chirico, G.B. Residual life and degradation assessment of wood elements used in soil bioengineering structures for slope protection. Ecol. Eng. 2016, 90, 498–509. [Google Scholar] [CrossRef]
- Wang, F.; Pan, X.; Wang, D.; Shen, C.; Lu, Q. Combating desertification in China: Past, present and future. Land Use Policy 2013, 31, 311–313. [Google Scholar] [CrossRef]
- Benjaminsen, T.A.; Hiernaux, P. From desiccation to global climate change: A history of the desertification narrative in the west african sahel, 1900–2018. Glob. Environ. 2019, 12, 206–236. [Google Scholar] [CrossRef]
- Mourad, M.B. Le Barrage Vert en Tant Que Patrimoine Naturel National et Moyen de Lutte Contre la Désertification. Available online: http://www.fao.org/3/xii/0301-b3.htm (accessed on 19 April 2021).
- Hirche, A.; Salamani, M.; Abdellaoui, A.; Benhouhou, S.; Valderrama, J.M. Landscape changes of desertification in arid areas: The case of south-west Algeria. Environ. Monit. Assess. 2011, 179, 403–420. [Google Scholar] [CrossRef]
- Martínez-Valderrama, J.; Ibáñez, J.; Del Barrio, G.; Alcalá, F.J.; Sanjuán, M.E.; Ruiz, A.; Hirche, A.; Puigdefábregas, J. Doomed to collapse: Why Algerian steppe rangelands are overgrazed and some lessons to help land-use transitions. Sci. Total Environ. 2018, 613–614, 1489–1497. [Google Scholar] [CrossRef]
- Des, D.; Du, C. Etude diachronique des conditions du milieu et de la végétation d’une zone steppique (2001–2015): Cas de la Wilaya de Djelfa (Algérie). Egypt. J. Environ. Chang. 2020, 12, 33–47. [Google Scholar] [CrossRef]
- Zegrar, A.; Mahi, H.; Hassani, S.A.; Karoui, S. Impact of climate and analysis of desertification processes in semi arid land in Algeria: Using data of Alsat and LANDSAT. Int. Arch. Photogramm. Remote Sens. Spat. Inf. Sci. ISPRS Arch. 2015, 40, 883–887. [Google Scholar] [CrossRef] [Green Version]
- Nedjraoui, D.; Bedrani, S. Desertification in the Algerian steppe: Causes, impacts and actions in the fight. Vertigo Rev. Électron. Sci. Environ. 2002, 8, 1–15. [Google Scholar]
- Le Houérou, H.N. Agroforestry and sylvopastoralism to combat land degradation in the Mediterranean Basin: Old approaches to new problems. Agric. Ecosyst. Environ. 1990, 33, 99–109. [Google Scholar] [CrossRef]
- Aidoud, A.; Touffet, J. La régression de l’alfa (Stipa tenacissima L.), graminée pérenne, un indicateur de désertification des steppes algériennes. Sci. Chang. Planétaires Sécheresse 1996, 7, 187–193. [Google Scholar]
- Adair, P. Rétrospective de la réforme agraire en Algérie (1972–1982). Tiers. Monde. 1983, 24, 153–168. [Google Scholar] [CrossRef]
- Bourbouze, A. Systèmes d’élevage et production animale dans les steppes du nord de l’Afrique: Une relecture de la société pastorale du Maghreb. Sécheresse 2006, 17, 31–39. [Google Scholar]
- Aïdoud, A.; Le Floch, E.; Le Houérou, H.N. Les steppes arides du nord de l’Afrique. Sécheresse 2006, 17, 19–30. [Google Scholar]
- Dalila, N.; Slimane, B. La désertification dans les steppes algériennes: Causes, impacts et actions de lutte. VertigO 2008, 8. [Google Scholar] [CrossRef]
- Bensaïd, S. Bilan critique du barrage vert en Algérie. Sécheresse 1995, 6, 247–255. [Google Scholar]
- Merdas, S.; Boulghobra, N.; Lakhdari, F. The green dam in Algeria as a tool to combat desertification. Planet@Risk 2015, 3, 68–71. [Google Scholar]
- Bensouiah, R. Politique forestière et lutte contre la désertification en Algérie: Du barrage vert au PNDA. Forêt Méditerranéenne 2004, 25, 191–198. [Google Scholar]
- Benalia, S. The green barrier in Algeria: Actual situation and development prospect. In Proceedings of the XXXVII CIOSTA & CIGR Section V Conference, Palermo, Italy, 13–15 June 2009; pp. 2163–2166. [Google Scholar]
- Phinzi, K.; Ngetar, N.S. Land use/land cover dynamics and soil erosion in the Umzintlava catchment (T32E), Eastern Cape, South Africa. Trans. R. Soc. S. Afr. 2019, 74, 223–237. [Google Scholar] [CrossRef]
- Weng, Q. Land use change analysis in the Zhujiang Delta of China using satellite remote sensing, GIS and stochastic modelling. J. Environ. Manag. 2002, 64, 273–284. [Google Scholar] [CrossRef] [PubMed] [Green Version]
- Taylor, P.; Bailly, J.S.; Arnaud, M.; Puech, C. Boosting: A classification method for remote sensing. Int. J. Remote Sens. 2007, 28, 37–41. [Google Scholar] [CrossRef]
- Richards, J.; Richards, J. Remote Sensing Digital Image Analysis; Springer: Berlin/Heidelberg, Germany, 1999. [Google Scholar]
- Alipbeki, O.; Alipbekova, C.; Sterenharz, A.; Toleubekova, Z.; Aliyev, M.; Mineyev, N.; Amangaliyev, K. A spatiotemporal assessment of land use and land cover changes in peri-urban areas: A case study of Arshaly district, Kazakhstan. Sustainability 2020, 12, 1556. [Google Scholar] [CrossRef] [Green Version]
- Liu, X.; Skidmore, A.K.; Oosten, H. Van Integration of classification methods for improvement of land-cover map accuracy. ISPRS J. Photogramm. Remote Sens. 2002, 56, 257–268. [Google Scholar] [CrossRef]
- Eastman, J. IDRISI Taiga: Guide to GIS and Image Processing Volume—Manual Version 16.02; Clark Labs Clark University: Worcester, MA, USA, 2009; p. 325. [Google Scholar]
- Exavier, R.; Zeilhofer, P. OpenLand: Software for quantitative analysis and visualization of land use and cover change. R J. 2020, 12, 372–387. [Google Scholar] [CrossRef]
- Khaouani, B.; Hirche, A.; Salamani, M. Ecological dynamics of the green dam by remote sensing: The case of moudjbara (Djelfa, Central Algeria). PONTE Int. J. Sci. Res. 2019, 75, 116–132. [Google Scholar] [CrossRef]
- You, Y.; Zhou, J.; Wang, Y. “Chinese Mode” of combating desertification. IOP Conf. Ser. Earth Environ. Sci. 2020, 435, 012033. [Google Scholar] [CrossRef]
- Benabdeli, K. Premiers résultats dendrométriques des plantations de pin d’Alep (Pinus halepensis mill.) dans le barrage vert (zone d’Aflou, Algérie). Ecol. Mediterr. 1998, 24, 43–51. [Google Scholar] [CrossRef]
- Kouba, Y.; Merdas, S.; Mostephaoui, T.; Saadali, B.; Chenchouni, H. Plant community composition and structure under short-term grazing exclusion in steppic arid rangelands. Ecol. Indic. 2021, 120, 106910. [Google Scholar] [CrossRef]
- Merdas, S.; Kouba, Y.; Mostephaoui, T.; Farhi, Y.; Chenchouni, H. Livestock grazing-induced large-scale biotic homogenization in arid Mediterranean steppe rangelands. Land Degradat. Dev. 2021. [Google Scholar] [CrossRef]
- Rammal, M.M.; Jubair, A.A. Sand dunes stabilization using silica gel and cement kiln dust. Al-Nahrain J. Eng. Sci. 2015, 18, 179–191. [Google Scholar]
- Sun, X.; Miao, L.; Wang, H.; Yin, W.; Wu, L. Mineralization crust field experiment for desert sand solidification based on enzymatic calcification. J. Environ. Manag. 2021, 287, 112315. [Google Scholar] [CrossRef] [PubMed]
- Zhang, J.; Zhang, Y.; Fan, D.; Qin, S.; Jia, X.; Wu, B.; Chen, N.; Gao, H.; Zhu, L. Effects of sand dune stabilization on the spatial pattern of artemisia ordosica population in Mu Us desert, northwest China. PLoS ONE 2015, 10, e0129728. [Google Scholar] [CrossRef] [PubMed]
Figure 1.
The geographic setting of the study area (a); digital elevation model (DEM) of the study area (b) and three photographs showing the current state of the green dam in different sites over the study area (c).
Figure 1.
The geographic setting of the study area (a); digital elevation model (DEM) of the study area (b) and three photographs showing the current state of the green dam in different sites over the study area (c).

Figure 2.
LULC classified maps of the Moudjbara region for the five studied years (1972, 1989, 1999, 2009, and 2019).
Figure 2.
LULC classified maps of the Moudjbara region for the five studied years (1972, 1989, 1999, 2009, and 2019).

Figure 3.
Sankey diagram illustrating LULC changes between 1972 and 2019 in the Moudjbara region; all links and nodes are displayed proportionately to absolute hectares. DPNF, dense plantations and natural forests; OP, open plantations; DS, degraded steppes; CL, crops; and UR, urban.
Figure 3.
Sankey diagram illustrating LULC changes between 1972 and 2019 in the Moudjbara region; all links and nodes are displayed proportionately to absolute hectares. DPNF, dense plantations and natural forests; OP, open plantations; DS, degraded steppes; CL, crops; and UR, urban.

Figure 4.
Time-intensity analysis for the four studied time intervals (1972–1989, 1989–1999, 1999–2009, and 2009–2019) showing how the size and speed of change vary across time intervals. Bars that extend to the left of zero show the area of overall change in each interval, while bars that extend to the right of zero show the intensity of the annual area of change within each time interval. Uniform rate (U) refers to the rate that would occur if the annual changes were spread evenly over the entire time extent.

Figure 5.
Gains and losses in open plantations, and dense plantations and natural forests in the Moudjbara region during the studied time intervals, (a) 1972–1989, (b) 1989–1999, (c) 1999–2009, (d) 2009–2019, and (e) 2019–2029.
Figure 5.
Gains and losses in open plantations, and dense plantations and natural forests in the Moudjbara region during the studied time intervals, (a) 1972–1989, (b) 1989–1999, (c) 1999–2009, (d) 2009–2019, and (e) 2019–2029.

Figure 6.
Contribution to net change (gain and loss) in open plantations, and dense plantations and natural forests during the five studied time intervals in the Moudjbara region.
Figure 6.
Contribution to net change (gain and loss) in open plantations, and dense plantations and natural forests during the five studied time intervals in the Moudjbara region.

Figure 7.
Temporal evolution of the areas occupied by open plantations, and dense plantations and natural forests in the Moudjbara region. The two distributions were best fitted by a quadratic polynomial function.
Figure 7.
Temporal evolution of the areas occupied by open plantations, and dense plantations and natural forests in the Moudjbara region. The two distributions were best fitted by a quadratic polynomial function.

Figure 8.
Evolution of the size of the human population (a), and the number of livestock (sheep and goats) (b) in the study area. Future prediction for the year 2030 was calculated using the mean annual growth rate (3.3%) of the period 2008–2018 in the case of population size, and the power function in the case of livestock number.


Table 1.
Spatial resolution, spectral characteristics and date of acquisition of the Landsat images used in this study.
Table 1.
Spatial resolution, spectral characteristics and date of acquisition of the Landsat images used in this study.
| Satellite | Sensor | Resolution | Path/Row | Spectral Bands | Wavelength (nm) | Acquisition Date |
|---|---|---|---|---|---|---|
| Landsat | MSS | 60 m | 195/36 | Green | 500–600 | 13 September 1972 |
| Red | 600–700 | |||||
| Infrared 1 | 700–800 | |||||
| Infrared 2 | 800–1100 | |||||
| Landsat | TM | 30 m | 195/36 | Blue | 450–520 | 5 July 1989 |
| Green | 520–600 | |||||
| Red | 630–690 | |||||
| Near-infrared 1 | 760–900 | |||||
| Near-infrared 2 | 1550–1750 | |||||
| Mid-infrared | 2080–2350 | |||||
| Landsat | ETM+ | 30 m | 195/36 | Blue | 450–520 | 9 July 1999 |
| Green | 520–600 | |||||
| Red | 630–690 | |||||
| Near-infrared 1 | 760–900 | |||||
| Near-infrared 2 | 1550–1750 | |||||
| Mid-infrared | 2080–2350 | |||||
| Landsat | TM | 30 m | 195/36 | Blue | 450–520 | 28 July 2009 |
| Green | 520–600 | |||||
| Red | 630–690 | |||||
| Near-infrared 1 | 760–900 | |||||
| Near-infrared2 | 1550–1750 | |||||
| Mid-infrared | 2080–2350 | |||||
| Landsat | OLI-TIRS | 30 m | 195/36 | Coastal aerosol | 430–450 | 24 July 2019 |
| Blue | 450–510 | |||||
| Green | 530–590 | |||||
| Red | 640–670 | |||||
| Near-infrared | 850–880 | |||||
| Short-wave infrared 1 | 1570–1650 | |||||
| Short-wave infrared 2 | 2210–2290 | |||||
| Cirrus | 1360–1380 |
Table 2.
Assessment of classification accuracy. Overall accuracies and Kappa statistics of the five LULC maps. PA, producer’s accuracy (%); UC, user’s accuracy (%).
Table 2.
Assessment of classification accuracy. Overall accuracies and Kappa statistics of the five LULC maps. PA, producer’s accuracy (%); UC, user’s accuracy (%).
| Classes | 1972 | 1989 | 1999 | 2009 | 2019 | |||||
|---|---|---|---|---|---|---|---|---|---|---|
| PA | UC | PA | UC | PA | UC | PA | UC | PA | UC | |
| Dense plantations and natural forest | 80 | 88.8 | 10 | 100 | 80 | 100 | 80 | 100 | 100 | 100 |
| Open plantations | 78.3 | 74.6 | 91.6 | 89.7 | 80.4 | 94.2 | 100 | 100 | ||
| Degraded steppes | 90 | 96.7 | 70 | 43.7 | 91.1 | 92 | 90.6 | 89.8 | 100 | |
| Urban | 76.8 | 100 | 80 | 66.6 | 80 | 33.3 | 100 | 98.9 | ||
| Crops | 70 | 41 | 60 | 26 | 80 | 80 | 100 | 83.3 | 100 | 100 |
| Overall accuracy | 0.88 | 0.75 | 0.89 | 0.87 | 0.94 | |||||
| Overall Kappa | 0.64 | 0.64 | 0.82 | 0.80 | 0.89 | |||||
Table 3.
LULC changes analysis in the Moudjbara region from 1972 to 2029.
| LULC Class | 1972 | 1989 | 1999 | 2009 | 2019 | ||||
|---|---|---|---|---|---|---|---|---|---|
| Area (ha) | Area (ha) | C (%) | Area (ha) | C (%) | Area (ha) | C (%) | Area (ha) | C (%) | |
| Crops | 157.01 | 132.91 | −15.35 | 174.17 | +31.05 | 236.36 | +35.71 | 235.55 | −0.34 |
| Degraded steppes | 24,626.62 | 13,770.76 | −44.08 | 15,139.31 | +9.94 | 12,640.89 | −16.5 | 17,293.83 | +36.81 |
| Dense plantations and natural forests | 585.48 | 1003.26 | +71.36 | 1615.65 | +61.04 | 641.35 | −60.3 | 626.62 | −2.3 |
| Open plantations | 0 | 10,344.99 | +10,344.99 | 8288.23 | −19.88 | 11,073.97 | +33.61 | 6302.66 | −43.09 |
| Urban | 0 | 117.2 | +117.20 | 151.75 | +29.48 | 776.54 | +411.73 | 910.46 | +17.25 |
Publisher’s Note: MDPI stays neutral with regard to jurisdictional claims in published maps and institutional affiliations. |
© 2021 by the authors. Licensee MDPI, Basel, Switzerland. This article is an open access article distributed under the terms and conditions of the Creative Commons Attribution (CC BY) license (https://creativecommons.org/licenses/by/4.0/).
Share and Cite
MDPI and ACS Style
Benhizia, R.; Kouba, Y.; Szabó, G.; Négyesi, G.; Ata, B. Monitoring the Spatiotemporal Evolution of the Green Dam in Djelfa Province, Algeria. Sustainability 2021, 13, 7953. https://doi.org/10.3390/su13147953
AMA Style
Benhizia R, Kouba Y, Szabó G, Négyesi G, Ata B. Monitoring the Spatiotemporal Evolution of the Green Dam in Djelfa Province, Algeria. Sustainability. 2021; 13(14):7953. https://doi.org/10.3390/su13147953
Chicago/Turabian StyleBenhizia, Ramzi, Yacine Kouba, György Szabó, Gábor Négyesi, and Behnam Ata. 2021. "Monitoring the Spatiotemporal Evolution of the Green Dam in Djelfa Province, Algeria" Sustainability 13, no. 14: 7953. https://doi.org/10.3390/su13147953
Note that from the first issue of 2016, this journal uses article numbers instead of page numbers. See further details here.