
Exploring the Efficiency of Future Multimodal Networks: A Door-to-Door Case in Europe


1
Amsterdam School of International Business, Amsterdam University of Applied Sciences, 1102 CV Amsterdam, The Netherlands
2
Aviation Academy, Amsterdam University of Applied Sciences, 1091 GC Amsterdam, The Netherlands
3
CIRA, Italian Aerospace Research Center, 81043 Capua, Italy
*
Authors to whom correspondence should be addressed.
Sustainability 2022, 14(20), 13621; https://doi.org/10.3390/su142013621
Submission received: 2 August 2022
/
Revised: 25 September 2022
/
Accepted: 18 October 2022
/
Published: 20 October 2022
(This article belongs to the Special Issue Sustainability in Air Transport and Multimodality)
Abstract
:It is expected that future transportation technologies will positively impact how passengers travel to their destinations. Europe aims to integrate air transport into the overall multimodal transport network to provide better service to passengers, while reducing travel time and making the network more resilient to disruptions. This study presents an approach that investigates these aspects by developing a simulation platform consisting of different models, allowing us to simulate the complete door-to-door trajectory of passengers. To address the future potential, we devised scenarios considering three time horizons: 2025, 2035, and 2050. The experimental design allowed us to identify potential obstacles for future travel, the impact on the system’s resilience, and how the integration of novel technology affects proxy indicators of the level of service, such as travel time or speed. In this paper, we present for the first time an innovative methodology that enables the modelling and simulation of door-to-door travel to investigate the future performance of the transport network. We apply this methodology to the case of a travel trajectory from Germany to Amsterdam considering a regional and a hub airport; it was built considering current information and informed assumptions for future horizons. Results indicate that, with the new technology, the system becomes more resilient and generally performs better, as the mean speed and travel time are improved. Furthermore, they also indicate that the performance could be further improved considering other elements such as algorithmic governance.
1. Introduction
According to the United Nations [1], by 2100, the world population is expected to reach approximately 10 billion people, and by 2050, more than 68% of the worldwide population will live in urban areas. To serve future mobility needs, physical infrastructure, transport systems, traffic management, operational processes, and information systems will be seamlessly integrated [2]. Furthermore, to efficiently move passengers between different means of transport, various systems that support passenger transfer between various modes of transport, such as park-and-ride [3] and shared mobility systems [4], among others, should work efficiently and be integrated with other travel support systems.
To explore how such integration and emerging transport technologies influence passengers’ journeys, this work presents a study on how future multimodal transportation networks will impact passenger travel. The work is based on the concept of operations developed in the X-TEAM D2D project [5,6,7,8], where the authors were focused on modelling the concept of operations for the multimodal network.
The article continues as follows: Section 2 presents the important and related work. In Section 3, we summarise the concept of the multimodal network evolution towards 2050. In Section 4, we present the methodology developed for this study. Section 5 presents the characteristics of the passengers considered in the study. The experimental design and results are presented and described in Section 6 and Section 7, correspondingly, and then conclusions, limitations, and future work are presented in Section 8.
2. Related Work
According to the European Commission [9], “multimodal transport” describes the use of various modes (or means) of transport during the same journey. This concept concerns both freight and passenger transport. It is expected that multimodal passenger transport benefits from the strengths of different modes that, combined, can provide people with more efficient transport solutions. When fully implemented, the multimodal transportation network should decrease road congestion and climate impact, making the whole sector safer and more cost-efficient. Ultimately, multimodality is expected to help creating a sustainable, integrated transport system [9]. Besides contributing to the sustainable development goals, multimodal transportation has been proven to contribute significantly to the economic development of urban territories [10,11,12].
Regarding door-to-door (D2D) travel, it is frequently studied from different points of view. Researchers have explored different angles of D2D travel. Some focused on the purpose of the trip [13], while others focused on population density, regional accessibility, the walkability index, and network density, among other aspects [14]. Other works focused on the service quality of transport systems. Some studies explored the usability of mobile services to improve the passenger experience, promote sustainable travel choices [15], understand travel behaviour [16], and measure users’ satisfaction [17]. These works indicated that mobile communication could play a crucial role in integrating different services into one, offering multimodal transport opportunities to passengers. This is possible thanks to the ability of 5G and future expected 6G communication to support much faster data transfers related to multiple users compared to current mobile generation communications. Such an increase in data transfer capacity is a mandatory enabler for integrating different transportation means into an integrated multimodal system because such integration strongly depends upon the possibility of sharing passenger and infrastructure data from different transportation means. In addition, the indicated studies emphasised that mobile devices are the most eligible means to collect passengers’ preferences data and allow users to communicate their preferences and perform their selections actively.
In the scope of D2D travel in one urban area, passenger satisfaction in railways [18,19,20], taxis [21], buses, and other forms of urban public transport [22,23,24,25,26,27,28,29] were extensively studied and discussed. A few studies explored connections between different urban areas in the form of transport combinations [30], high-speed trains [31], air travel [32,33], and air taxis [34]. Nonetheless, they do not always consider international travel with a door-to-door focus. In addition, none of the existing studies was also able to consider the integration of future available transportation means, such as Urban Air Mobility (UAM), inherently resulting in limited scope with respect to the consideration of such a possibility among the possible multimodality choices, which will become real in the next few decades.
European countries envision connecting different parts of the continent through a sustainable multimodal transport system that seamlessly joins all modes of travel, including air travel [35,36]. Such a multimodal travel network requires efficient and convenient planning and governance services. Based on EU regulation 2010/40/EU, the development of such a system evolves gradually and already includes several studies of potential IT architectures and service concepts to enable connectivity [37,38,39,40,41,42].
The organisational aspect of the multimodal network is also a relevant aspect to study. In line with the EU’s Strategic Transport Research and Innovation Agenda [43], various studies explored the conceptual side of multimodal networks. Several projects, such as IMHOTEP and TRANSIT, proposed a concept of operations for collaborative decision making between airport operators and feeder transport stakeholders, including local transport authorities, traffic agencies, transport operators, and mobility service providers, providing travellers with a genuine door-to-door service [44,45,46,47]. Other efforts focused on performance measurements, mobility data analysis methods, and transport simulation tools for such a multimodal system [5,48,49]. The limitations of such studies are that, as others previously indicated, they do not consider transport integration in a multimodal way by including UAM as a crucial future actor. The resulting performance analysis, therefore, addresses multimodal networks lacking the possibility of efficiently exploiting the vertical domain in the urban environment.
The research done so far identified different issues present in the existing multimodal transport networks; some work revealed the speed ineffectiveness of public transport feeding European airports compared to private cars and taxis [50]. Another study revealed that by 2035 the passenger type, origin, available travel budget, and travel distance would also need to be considered when thinking about future D2D travel [51].
As discussed above, the topic of multimodal and D2D travelling has gained a lot of attention in the scientific community. Nevertheless, there are no studies on the performance of future transport systems considering the complete trajectory of the passengers (which could give insight into how passengers could benefit in the future from new transport technology). Furthermore, despite many research initiatives on multimodal transportation, supported by programs such as Horizon 2020, there are no studies on how such a multimodal transport network would affect passenger travel D2D from one country to another and whether 4 h D2D travel within Europe is feasible. This work aims to fill these gaps by presenting an innovative approach that enables the modelling and simulation of the complete D2D passenger journey, while incorporating novel technology as the time horizons change.
3. Conceptual Design of a Multimodal Network in 2025, 2035, and 2050
To explore how passenger journeys will change with the implementation of multimodal networks throughout Europe, we transferred the concept of operations (ConOps) of such a system into a simulation platform that allows us to estimate its performance. The evaluated ConOps was the one developed by the X-TEAM D2D project [5,6,7,8]. The details of the ConOps and its background analysis can be found in [52,53,54,55,56]. In particular, in these documents, the outcome of the project is reported, addressing: the definition of the future reference scenario for integrated multimodal transport and the related use cases [52], the incremental design of the ConOps for the integration of the different transport infrastructures [53,54], and the incremental design of the ConOps for the integration of the different transport services under a Mobility as a Service (MaaS) approach [55,56]. A summary describing the relevant elements is presented in the following sections.
3.1. System Outline in 2025
According to the review made by the X-TEAM project [52,53,54,55,56], in 2025, electric vertical take-off and landing aircraft (eVTOL) for Urban Air Mobility (UAM) operation will be implemented. On some routes, UAM will be implemented only for testing and demonstration. It will be managed with procedures and technologies available within the current Air Traffic Management (ATM) paradigm (either local or international). New mobility services (NMS), such as car sharing, ride hailing, bike sharing, e-scooters, and e-bikes, will gain user interest and obtain a significant share in the transport system. First light of Mobility as a Service (MaaS) and options such as single tickets with an optimised price considering different travel costs, integrated tickets, and their interoperability (flexible in case of disruptions) will be available in some areas.
Currently, there is still a lack of tools for exchanging and using data between the different transport modes in the immediate future. The efficiency of the transport process still depends on the passenger’s ability to manage their journey. Unfortunately, ATM operations have not yet become passenger-centric, partly because performance targets did not consider the impact on passengers. In addition, the complexity of the ATM network does not allow the desired response in the event of a disruption. The existing ATM works with a well-established and proven safety management system but does not allow for rapid reactions and implementations. In contrast, U-Space is innovative and fast, but its security and robustness are not yet defined or validated.
The fact that airspace will be shared between manned and unmanned aircraft when U-Space is introduced makes it necessary to identify and confirm the roles of U-Space and ATM in terms of airspace and traffic management responsibilities and functions. Although these services will likely need to interact, there must be no overlap of conflicting or incompatible services or areas of responsibility. By 2025, conformance monitoring will rely on currently available Air Traffic Management Communication, Navigation, and Surveillance (ATM CNS) capabilities and ATM and regulatory reporting mechanisms.
By 2025, there will be an opportunity to increase surveillance and communications coverage by implementing systems such as Automatic Dependent Surveillance–Broadcast (ADS-B) and other communications infrastructure. ADS-B does not necessarily scale well with high traffic density, and coverage is possibly insufficient for all phases of flight. On-board UAM vehicle systems will be able to collect and disseminate additional information that can be used to inform conformance monitoring.
MaaS will only be available in some regional areas for a part of the transport modes. The extension of the C-ITS strategy for Cooperative Intelligent Transport Systems will promote international cooperation with other major regions of the world on all aspects of cooperative, connected, and automated vehicles and will decisively advance further development of a Traffic Information System.
Urban transport (light rail, metro, trams, and regional commuter trains) is still characterised by a diversified landscape. At least a certain convergence in architectures and systems can be observed. In some cases, these points are linked to the safety of urban transport systems. In this context, “safety” is anything dealing with the methods and techniques used to prevent accidents. “Security” is concerned with protecting people and the system from criminal acts. Thus, a coherent and coordinated hazard and risk analysis will be established and agreed security requirements will be defined for the security-relevant functions of an urban-managed transport system.
3.2. System Outline in 2035
By this year, ATM will require new procedures and technologies not currently in use and will introduce Urban Air Traffic Management (UATM) Services to support UAM operations. These services will vary in type and maturity, from initial procedures and services to full implementation. Depending on the region, it will not be possible to reduce the workload of air traffic control (ATC) with the available resources. Trials of new procedures and technologies will be needed during 2025 to support the case for 2035 operations.
In 2035, a new ATM model will emerge with the support of new technologies and standards. Fundamental to this will be ATM Data Services Providers (ADSP) support. The terrestrial component of air-to-ground communications will require high bandwidths. The new architecture will allow resource sharing across the network and more stable service delivery to all airspace users.
The Advanced U-Space services will be operational across Europe. In contrast to 2025, passengers preparing for an intermodal journey in 2035 can use a U-Space service for their journey.
By 2035, conformance monitoring will provide an ongoing set of information to manage the operational safety risk of UAM operations. There will be an opportunity to increase surveillance and communications coverage for all stakeholders (including the pilot) by implementing current and new communications and surveillance infrastructure (e.g., new cooperative surveillance technology).
3.3. System Outline in 2050
According to the X-TEAM project, for the 2050 time horizon, multimodal travel is characterised by a full range of services. The management systems will bring traffic management to a much higher level than the previous horizons.
By 2050, a highly automated ATM system with all-weather operation and a higher safety level will be available. It will cover service- and passenger-oriented management, relying on high connectivity, automation, and digitalisation.
Complete U-space services will be available. C-ITS traffic systems will use all aspects of cooperative, connected, and automated vehicles. The collected data will bring the traffic information system to a robust level. In addition, strategic planning of traffic flows will be improved, reducing the imbalance between capacity and demand. Based on accurate and complete data, changes and disruptions can be resolved without loss of travel time. Mobility as a Service will be possible for every traveller for door-to-door travel, including the flight segment.
4. Modelling Methodology
To translate the ConOps into a quantifiable design, we developed the case study considering two regions and their transport networks. As the project was looking into the far future, and we wanted to assess the complete D2D journey, we used a multi-layered simulation framework approach, since it was the only available technique that enabled us to consider the most relevant aspects of the travel, such as distances, speed, locations, capacity, network structure, and most importantly, the variability inherent to any dynamic system.
We modelled and simulated how passengers could travel from one town to another in different European countries. The selected regions are based on two types of airports:
- Regional airport—a non-hub airport without transfer traffic [57]. Hannover airport in Germany was taken as the base case. In this paper, this airport is referred to as APT-R.
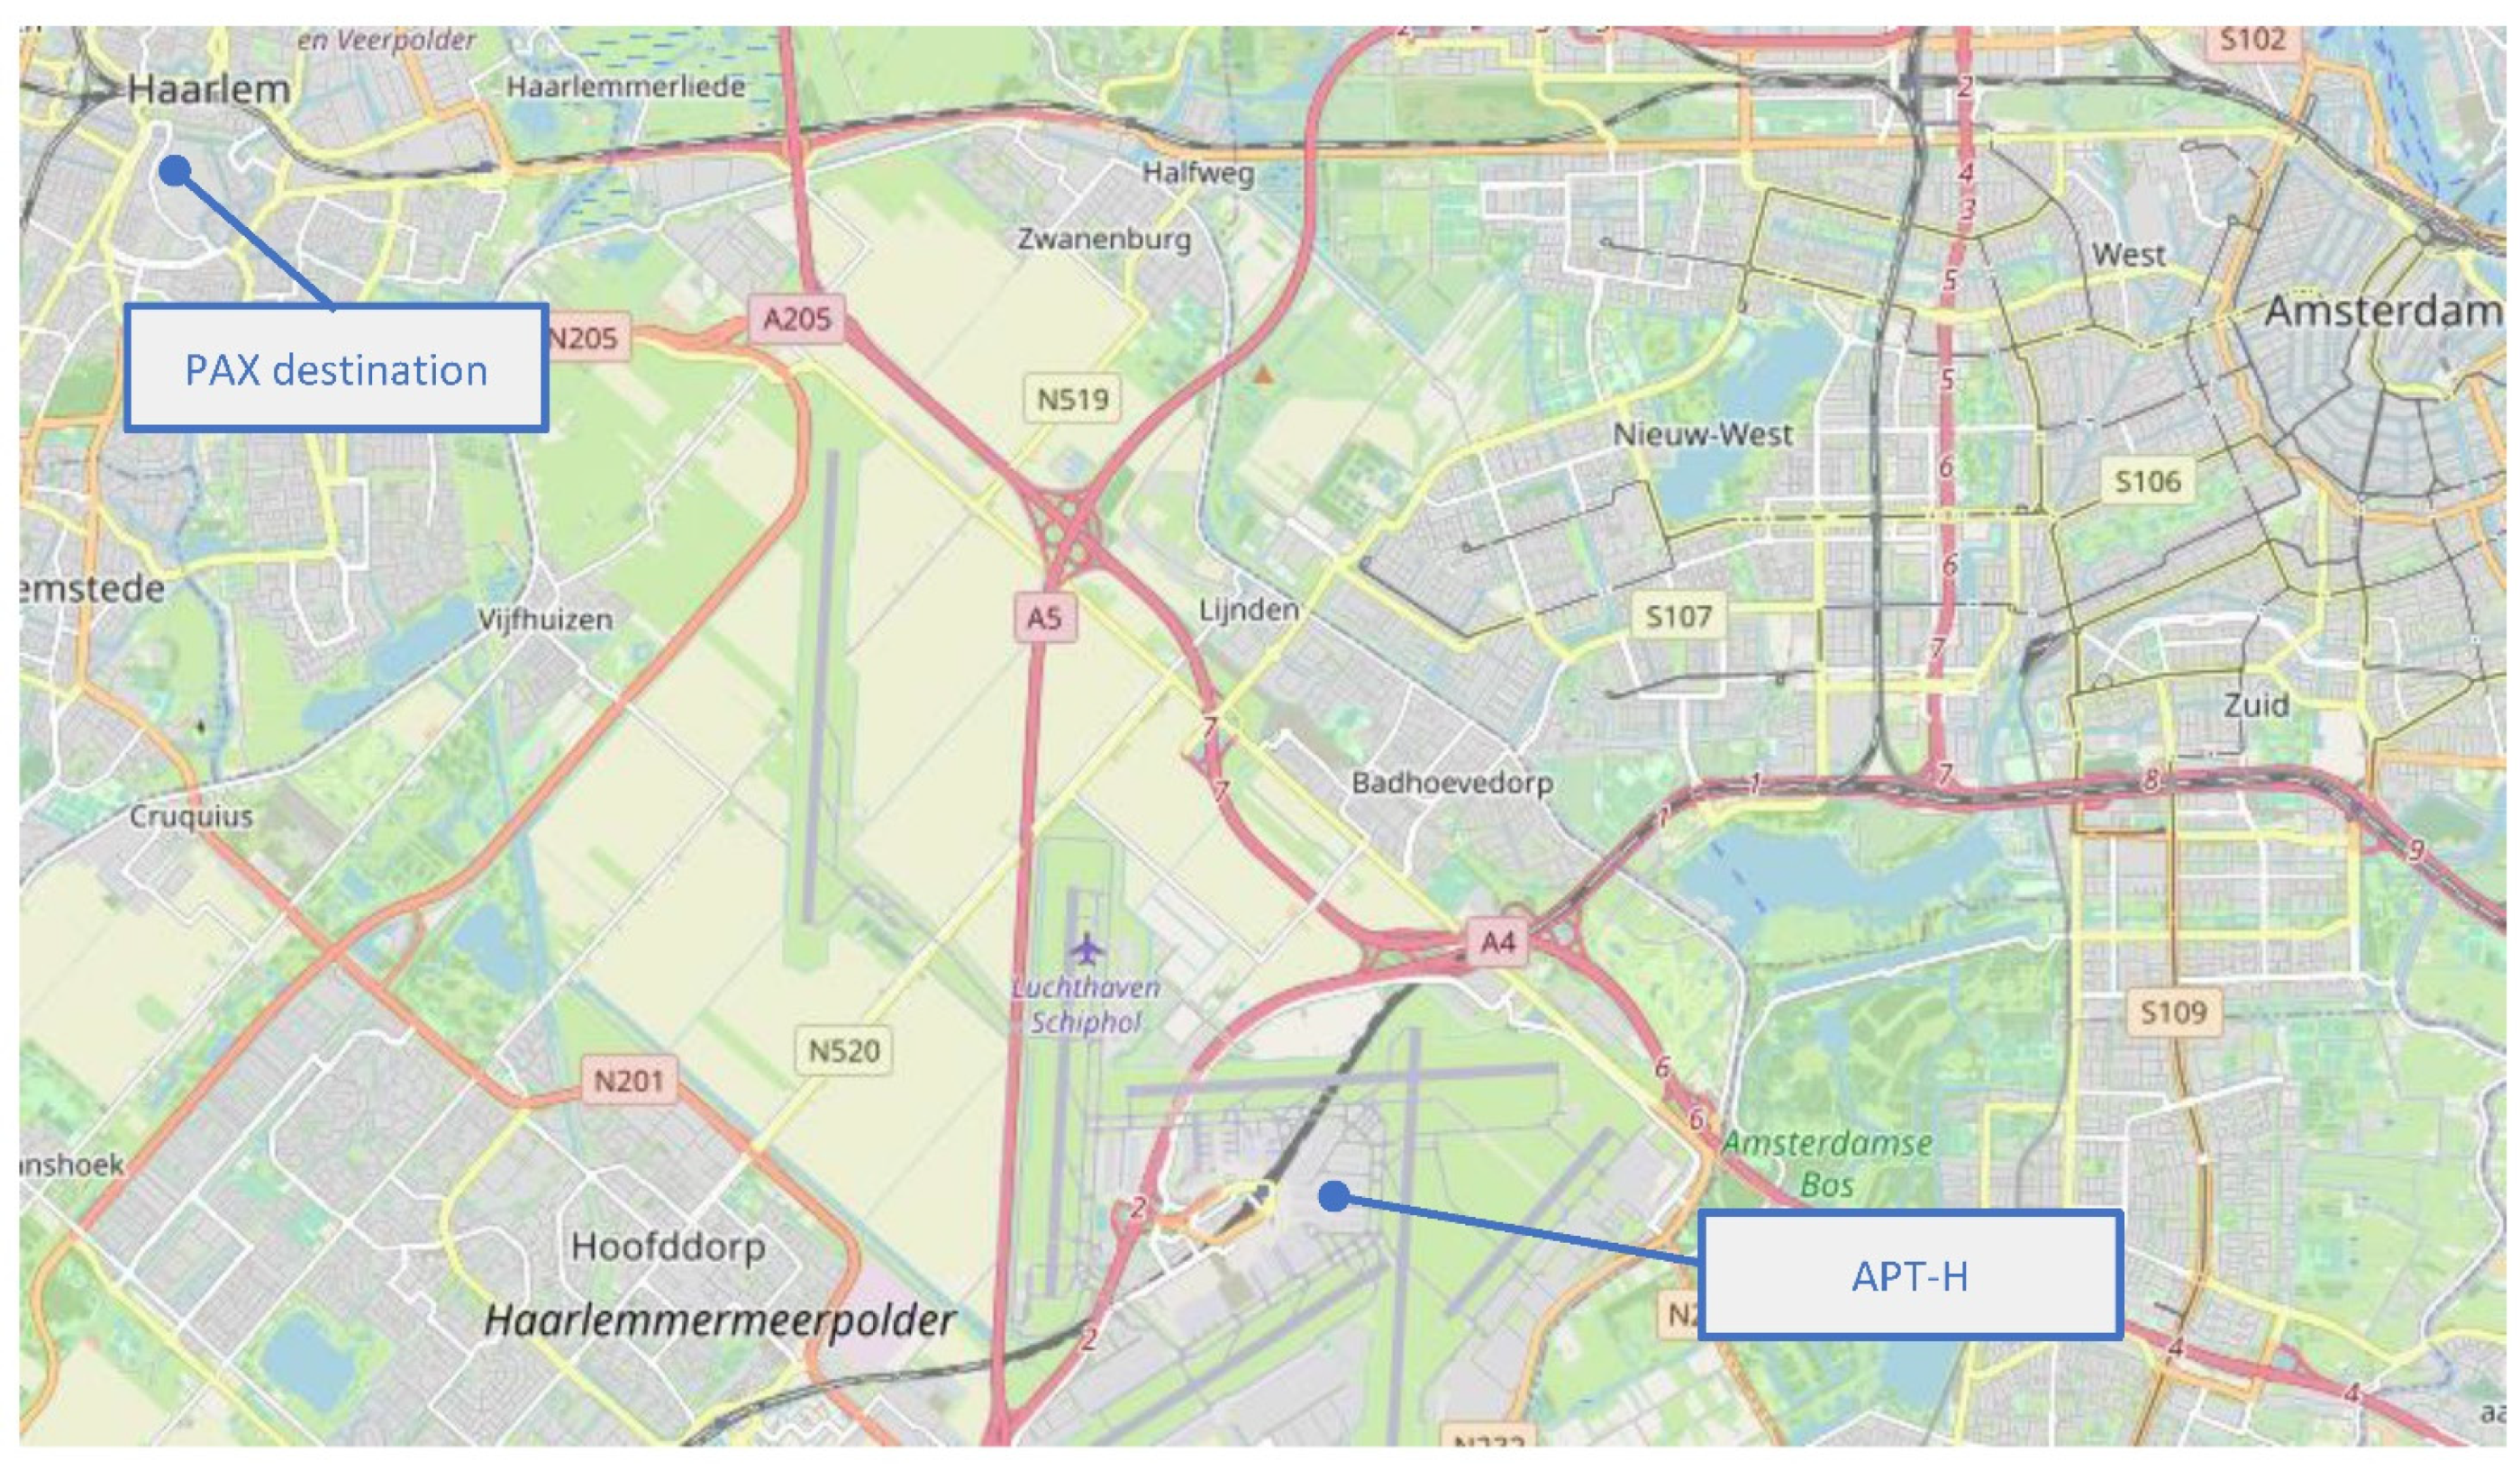
- Hub airport—an airport that serves as a node for connecting different flight legs for several airlines [57]. Amsterdam Schiphol was taken as the base case. In this paper, this airport is referred to as APT-H.
The framework implemented the existing and future transport technologies following a multi-model approach. The existing transport network was created, verified, and validated based on existing transport information. The future transport modes were progressively added depending on the time horizon, considering relevant assumptions and the ConOps. As the characteristics of many of these future technologies are still unknown, expert-based assumptions had to be made regarding those technologies’ characteristics and operational modes.
The conceptual model of the framework is presented in Figure 1. It consists of two models: the first reproduces the door-to-airport (D2A) leg of the passenger journey, and the second the airport-to-door (A2D) leg. Different available routes and operations were modelled in the following way. The transport networks were modelled as a combination of nodes and edges with different weights and characteristics, where the trajectory started at the passenger’s origin and used the transport network (depicted in Figure 1 as nodes connected by edges) until they got to the APT node where the flight takes place. Then the same conceptual approach was followed for the final leg of the trajectory; the passenger started at the APT node, used the transport network—which has the available options of the time—and then got to the final node (final destination). The nodes are capacitated static elements in the network such as locations, airports, or stations, and the weighted edges represent the connections between the different locations. The connection between the two legs is made by another edge representing the flight connecting the two airports under study.
To make the models dynamic, we used a general-purpose simulator—SIMIO—that allowed us to include (apart from the nodes, edges, capacitated servers, and networks) dynamic entities such as vehicles and passengers, the variability inherent to the system, and a global clock that allowed us to evaluate the system’s performance. The entities are injected into the model, and the performance is evaluated when they exit.
The sub-models were developed using a multi-layered approach [58], where we overlaid the model over a GIS layer from OpenStreetMap [59] so that the weighted edges consider the real distances between locations and the calculations made by the simulator could be as accurate as possible. Interactions of IT systems or management aspects of transport systems were not explicitly modelled in this framework.
A 2D view of the door-to-airport (D2A) model is shown in Figure 2. The presented maps correspond to the GIS layer used to determine the scales of transport connections for the models. The right image is the origin region (Brunswick), and the left represents the area where the regional airport is located (Hannover). These areas are located 60 km from each other. The road and railway networks connecting these two areas were modelled by an edge whose weight is the total distance between them.
A similar 2D view of the airport-to-door (A2D) model is shown in Figure 3. The PAX’s destination city of Haarlem is located 10 km from Amsterdam Airport Schiphol (depicted on the map as APT-H).
The arrival of passengers and most transportation means were generated stochastically considering the assumptions present in the ConOps. Some elements available in the actual system (such as buses and trains) were generated on a schedule basis. For uncertain elements and performances of the future horizons, informed assumptions had to be made. For example, data sharing in 2025 will increase the system’s transparency, especially in short-range airline connections, and good connections between the hub airport and the city by numerous transport modes (trains, bus connections, taxis) will exist.
There will be circumstances that might affect the expected results presented by the study, such as the regulatory framework for flying vehicles not being in place in the time horizon or the number of high-speed train connections being reduced in the future instead of increased. However, they could be part of another set of scenarios not considered in the current study. For clear information on the assumptions used, the reader is referred to Section 6.
5. Passenger Profiles
Passengers and their expected behaviour are based on the distinction between business travellers (profile B) and other travellers, such as visiting friends and relatives (profile V). Their characteristics and corresponding expected behaviour are projected in the future according to three time horizons: 2025, 2035, and 2050. These characteristics were based on extensive research on political and economic trends, strategies defined by the EC (goals planned to be achieved in given time horizons), expected future passengers’ needs, and technologies planned to be available in the target time horizons [52]. It is worth emphasising here that the X-TEAM D2D analysis of passengers’ needs is based on the consideration of EU principles of equality and human rights to access public services, on the achievement of a set of passenger-related data to be combined with ATM and other transport means data for an affordable, accessible, and seamless multimodal travel experience, and on the meaningful profiling of multimodal and air transport passengers from the users’ perspective. In addition, the designed profiles have been validated thanks to the support of the project-appointed Passengers Advisory Group, including several stakeholders. The considered use cases are “ATM-centred” (including the role of ATM in multimodal transport), using available air connections in a given time horizon.
Nevertheless, as the project’s focus is up to the regional level, in the case of the traditional hub or regional airports, only access and regress to/from the airport are considered. In addition, the use cases focus on irregular multimodal travels (other than, i.e., daily travel to work or school) to better suit the integration in the multimodal network of also on-demand transportation alternatives, such as UAM vehicles, for instance. The detailed foresight scenario analysis carried out in the project has been documented in references [52,55].
Within the same time horizon, variability derives from different abilities associated with different classes of travellers (younger travellers are expected to not have limitations, whereas older people, typically over 65-years-old, typically experience some limitations) and from the different needs arising from the different natures of the trip (typically, business travellers have different needs and budget limitations than leisure travellers). In addition, for the same kind of traveller and the same kind of trip, the variability among different time horizons derives from the different technologies and service possibilities, which will evolve according to the results of the dedicated studies carried out in the project and reported in documents [52,53,54,55,56]. These profiles and scenarios take properly into consideration, for instance, that in the future, in the EU, the percentage of older adults is projected to increase. However, at the same time, the environmental sensitiveness and the technologically driven automation possibilities will evolve. Finally, it is worth noting here that profile V (other travellers) inherently provides an inner variability that assures including in the considered use cases and profiles as wide a consideration as possible of different needs and expectations because this profile includes both younger and older travellers. The resulting profiles, where the variability of the different needs according to the different ages and classes of the passengers is emphasised, are summarised further. Table 1 overviews the assumed profile B characteristics and corresponding behaviour, while profile V travellers are presented in Table 2. More details about assumed passenger profiles and their evolution across time horizons can be found in [52].
6. Experimental Set-Up
The simulation experiments considered the complete D2D journey under three time horizons—2025, 2035, and 2050—giving a total of two groups of nine scenarios. The state of the transport network in each time horizon was:
- No disturbance or normal operations; all transport operates according to its schedule, if applicable.
- An ad hoc disturbance occurs on one of the transport modes when the passengers are on their way to use it.
- A disturbance occurs five hours before passengers start their trip on one of the transport modes.
Each experimental scenario simulated 24 h of passengers travelling in Europe from Brunswick in Germany (where a regional airport is in place) to another country, Haarlem in the Netherlands (where a hub airport is available). A combination of real data and expected performance (based on reports from manufacturers) was used to make the scenarios as realistic as possible. The transport modes simulated in 2025 represent transport options available for passengers in Germany and the Netherlands in 2020 and 2021. During the journey, passengers used the available transport modes in the following way.
6.1. Scenarios in 2025
A multimodal journey must be planned and managed by the travellers. Planning can be done with the use of online services provided. Buying tickets in advance is possible, checking in at least the day before the flight, and using remote ticket validation systems. Flights are booked via a travel agency app or the internet in advance. In case of disruptions on one of the transport modes, the passengers must replan the journey on the spot and must switch to available alternatives within their budget. Figure 4 schematically shows the assumed journey of business passengers and other travellers in 2025.
6.2. Scenarios in 2035
The exchange of information between air transport and surface modes, together with access and communication with the user’s portable device, provides the travellers with all data concerning their multimodal journey in advance (at least a day before the day of the journey). The travellers are provided with alternatives, allowing them to react in time (concerning their requirements, e.g., related to disabilities). Privately generated data will be available for service providers, and daily demand forecasts will become possible, making the transport system more efficient and sustainable. The travellers have the possibility to modify their journey a day before travel (select other modes according to their preferences). Travellers will be offered to purchase one single ticket for the entire journey with access rights to change modes. Check-in is done automatically at the start of the journey. Owing to technology development, more users’ focus will be on personal needs, as well as the impact on the environment.
Information about disruptions (e.g., delay) will be available for the travellers in a very short time, and if necessary, the travellers will be provided with available alternatives (in respect to their requirements, e.g., related to disabilities). This allows the travellers to react in time. In case of a lack of alternatives, the travellers will have to manage disruption by themselves using mobile applications providing data gathered from transport operators. The journey’s structure in 2035 for travellers is shown in Figure 5.
6.3. Scenarios in 2050
Travellers are provided with all data concerning their multimodal journey at least every hour during the journey. It is possible to modify the journey even on a day of the journey (select other modes according to their preferences). Travellers purchase one single ticket for the entire journey with access rights to change nodes. The offer will be designed based on smart pricing favouring preferred/prioritised modes of transport (regarding applied policies such as carbon footprint or emissions, sustainability level). Solutions will cover all or almost all publicly available means of transport. Time spent on changing nodes will be reduced thanks to the total management system approach applied (System of Systems management). Completed digitalisation will allow travellers to make the transport mode fitter to their individual preferences/needs: Next door is an NMS service, including e-bikes/e-scooters and an electric autonomous car-sharing depot.
In 2050, there is no difference for the traveller between disruptions five hours prior to departure and during the journey. In case of disruption, information about it will be available immediately, and if it is necessary, the traveller will be provided with the required actions on their side. The travellers will have the possibility to modify their journey the day of the journey and select other modes according to their preferences/needs.
Disturbances in 2050 with internal reasons such as failure or accidents originating outside the system will be very rare. The time for recovery will be extremely short due to using immediate activation of resources of other modes of transport. Figure 6 presents the steps of the journey in 2050 for business and other travellers.
6.4. Experimental Assumptions about Passengers
Different passengers have different needs and expectations, resulting in multimodal transport systems performing differently depending on the specific passenger type using the service. To represent such differences, different groups of passengers were simulated with different walking speeds. The speed varied according to age, physical and sensorial ability, gender, number of group members, and many other variables [52,60]. These speed characteristics were adapted from [61], as listed in Table 3 and Table 4.
Furthermore, other assumptions were made regarding the number of passengers in each group and their journey starting times. These assumptions are listed in Table 5.
6.5. Experimental Assumptions on Transport Modes
Different modes of transport were modelled for various travel options considered in the coming decades. A set of informed modelling assumptions (evaluated by subject matter experts) was defined for each scenario. Where possible, the operational characteristics of mobility services were adapted from the corresponding service operators [62,63,64,65,66]. The following assumptions are considered in the experiments:
- All passengers have pre-purchased travel tickets; therefore, no purchasing time was considered during the journey.
- Travelling time in the first transport modality also includes walking time to the first transport station from the passenger’s origin location.
- All transport modes in 2035 and 2050 are carbon-neutral (electric transport).
Furthermore, for air transport, the following parameters are adopted:
- Flight Hannover–Amsterdam always departs at the scheduled time.
- Flight Hannover–Amsterdam’s schedule corresponds to the schedule in 2021 [67].
- Embarkment on the aircraft always ends 20 min prior to the departure time.
- If passengers arrived at the gate after the end of the embarkment, they had to stay at the airport to take the next flight on the schedule.
- Flight time considers the time between the aircraft take-off at the regional airport and the landing of the aircraft at the hub airport.
- eVTOL and ATM operation does not consider possible airspace limitations and regulations.
- eVTOL embarkment and control procedures/de-boarding take three to ten minutes per person.
- Differences in piloted and unmanned eVTOL operations are not considered.
- Additionally, road transport was simulated under the following parameters:
- Since currently there is no information regarding the future design of road networks in Germany and the Netherlands, the road infrastructure and its operational conditions were assumed to remain unchanged through all time horizons and correspond to the existing infrastructure state in 2020.
- Bus stops are in direct proximity to PAX origins.
- Boarding/de-boarding an e-scooter takes five seconds per person.
For railway transport:
- The railway infrastructure and its stations’ locations remain unchanged through all time horizons and correspond to the existing infrastructure state in 2020.
- Water transport operations:
- Water transport operates under speed regulations and uses navigable inland waters existing in 2020 in the North Holland province of the Netherlands [68].
- Ferry boarding/de-boarding takes five seconds per person.
7. Results
The following figures present the main results. We focused on the evolution in the quality of passenger travel in the expected horizons. Figure 7 presents the outcome for travel distance.
In the scenario without disturbances across time horizons for business travellers (Profile B), it can be noticed that, in 2035, disturbance on one of the transport modes results in the need to cover a 3% longer distance on the same route compared with 2025. The situation will improve by 2050, as this type of passenger travels only 1% further in 2050 compared to 2025. However, in the case of disruptions in 2050, the total travel distance could be reduced by 2% compared to 2025. Furthermore, in future disruptions in 2050, business travellers will take advantage of the multimodal transportation system and can shorten their total travel distance by 3% compared to the scenario without disturbances. This outcome reveals the resilience developed with the use of novel technology.
For regular travellers (Profile V), it can be noticed that multimodal networks generally reduce the travel distance required to reach the destination by 2% in 2035 and 2050. In case of ad hoc and early disturbances, other travellers can benefit significantly from the multimodality and decrease their travel distance by 1% in 2035 and 10% in 2050.
Regarding Figure 7, presenting the impact on total travel distance, in general, when there is a disturbance, the distance could be increased in some cases (in 2035). However, the passengers are forced to use a faster (and probably more expensive) mode to reach their destination. In this study, we did not consider economic factors; however, the results reveal that it could be an interesting indicator to consider so that the balance between efficiency and cost is more transparent.
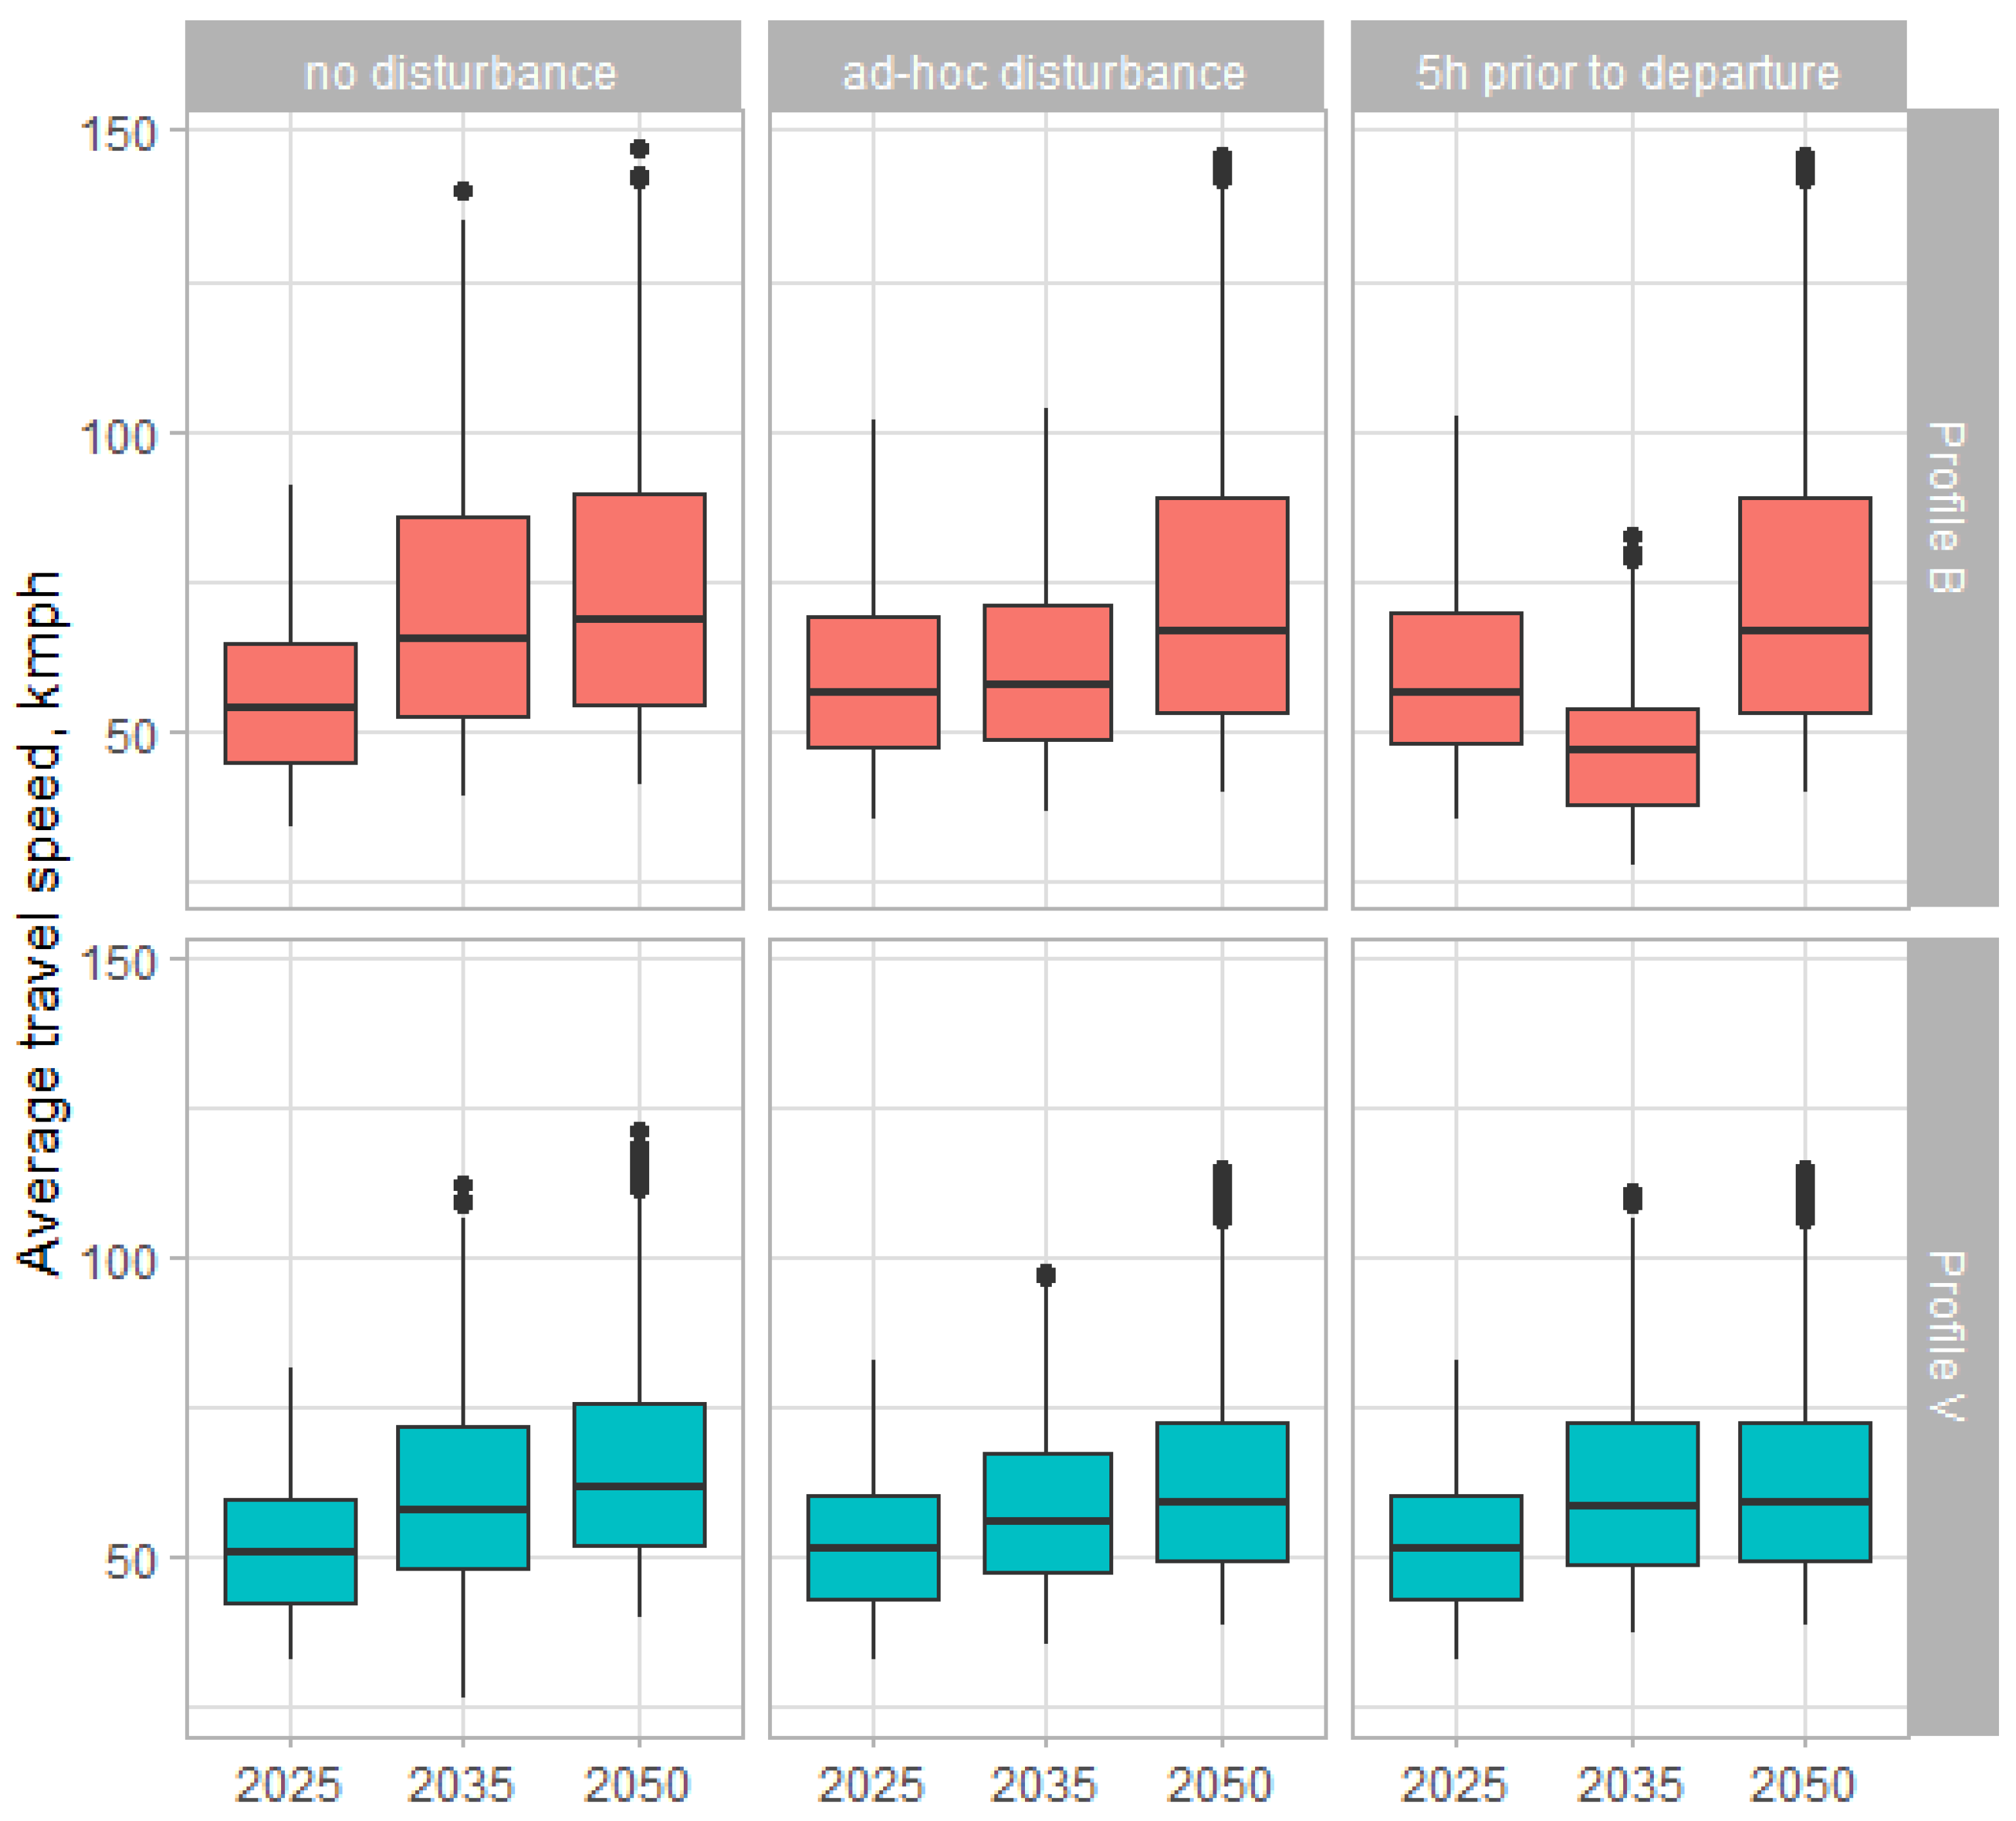
Regarding the average speed of travel (Figure 8), it can be noticed that in 2050 the travel speed will increase by 21% on average for both passenger profiles. Notable is that in 2035 disruptions slow the travelling of business passengers. However, in 2050, disruptions no longer impact their average travelling speed, revealing that the system becomes more resilient with the implementation of novel technology providing better options.
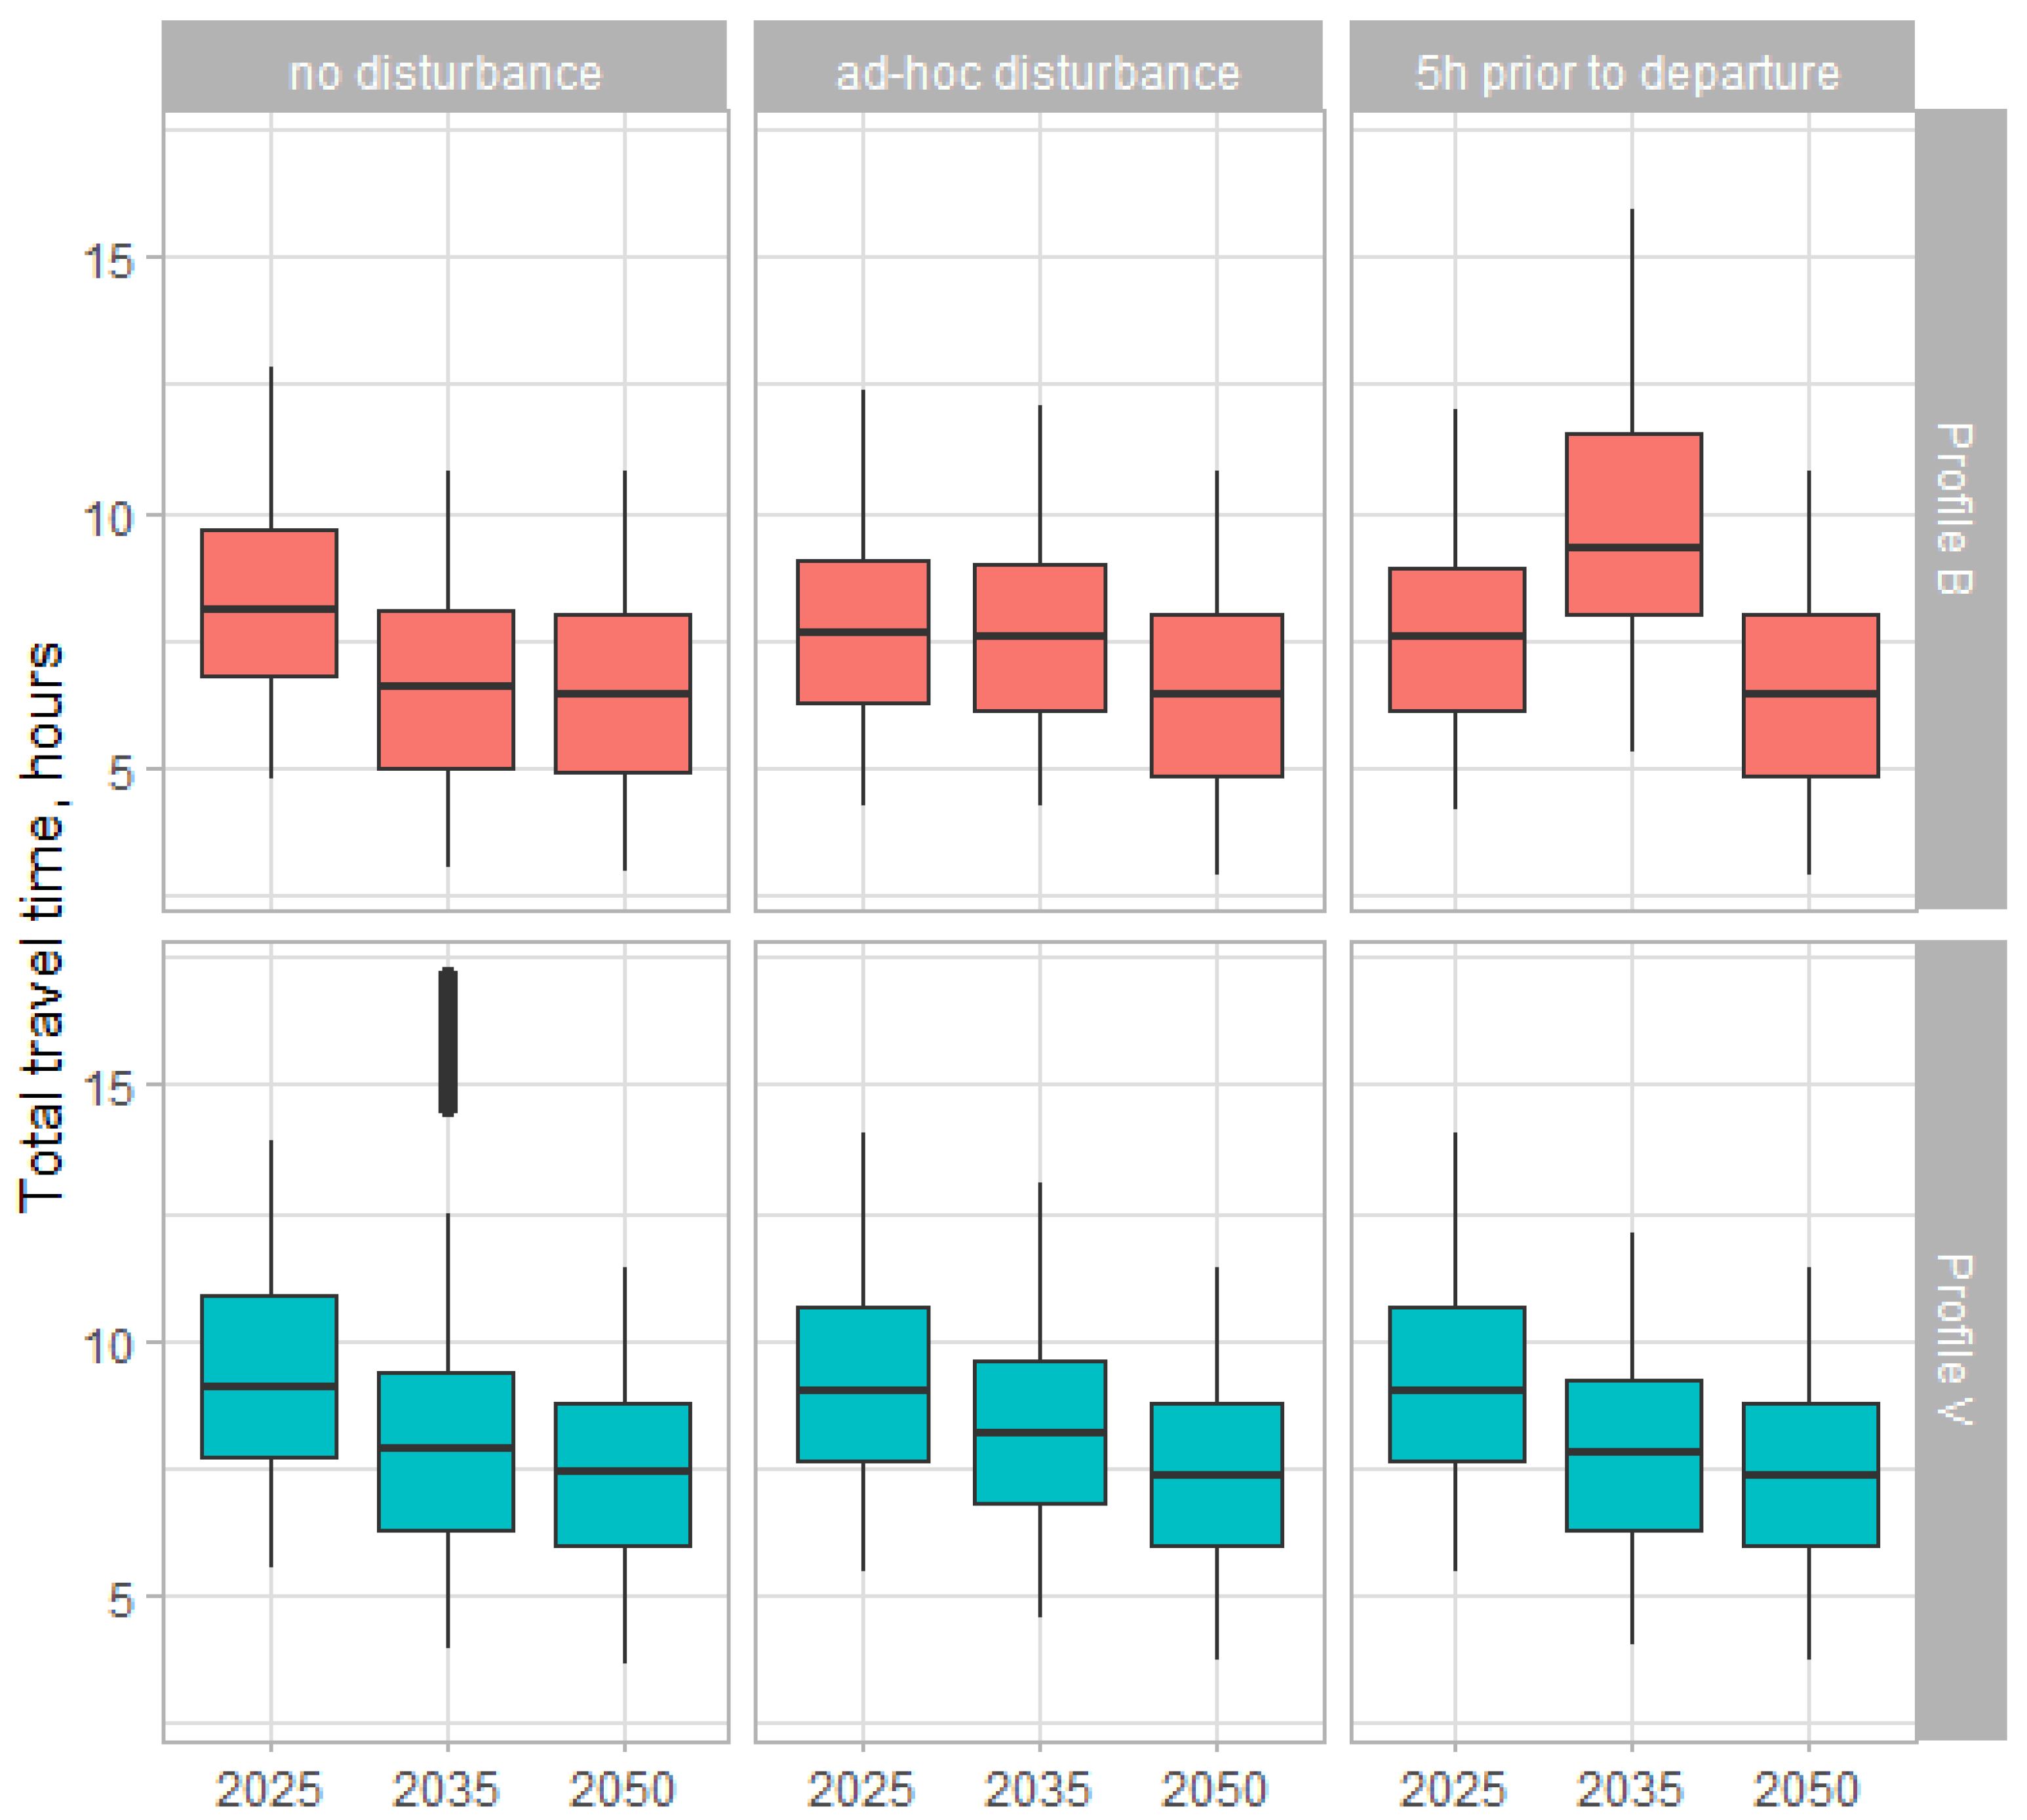
Another indicator considered is total travel time per passenger. Figure 9 illustrates that the system evolves toward reducing total travel time for both categories of passengers, as there is a clear tendency to reduce travel time as we approach 2050. It is important to note that, in the case of disruptions, the total travel time is not affected for both types of passengers. This might be another indicator of the system’s resilience, as it can absorb the disruptions without affecting the passengers.
Furthermore, it is also important to mention that, for the first time, we can estimate what the total travel time D2D could be when the new transport modes are available. An average of 6.5 h can be expected for regular passengers in 2050 under normal conditions; for the case of business passengers, we can expect an average of approximately 6 h. In the case of disruptions, these values are reduced, as the passengers are forced to take speedy alternatives to avoid missing their flights. In extreme cases, we notice that the trajectory can be made in 2.5 h by business and regular passengers.
8. Conclusions, Limitations, and Future Work
In this paper, we presented a simulation framework that enabled us to construct a complete door-to-door journey in Europe for the first time. We used a simulation-based framework to investigate the impact of future transport modes under the European project X-Team D2D where future transport technologies for passengers’ travel are considered. We devised performance indicators that can also be considered as proxies for resilience, level of service, or environmental emissions. The evaluation of the complete journey gave us the first insights into how the transport system can evolve in the future and obtained initial values of its performance indicators.
According to the results, as the system’s integrations evolve towards 2050, the following conclusions can be drawn considering the two main categories of passengers in the study. First, with regards to total travelled distance, we can perceive a reduction in the travelled distance in the future for regular passengers, and this is more evident in the scenarios with disruptions. The reason for this might be that, under those scenarios, the passengers are forced to use alternatives that are more direct than public transport (the no disruption scenarios). In the case of business passengers, the impact is not as high; this might be because they are assumed to use the fast alternatives that reduce the travelled distance the most.
Regarding average travel speed, a positive trend is noted as time evolves and new and faster technology is incorporated into the system. This is evident as, for instance, passengers’ travel speed is increased by 21% compared to today’s transport networks.
Concerning total travel time, we can infer from the statistics that the impact of new technology on the transport systems is positive, and the travel time is reduced. In both categories, but more evident in the general population (Profile V), there is a clear trend towards reducing travel time. Furthermore, using this indicator as a proxy for the system’s level of service or resilience (in the scenarios with disruptions), we can conclude that the level of service will be improved with new systems and alternative transport modes. With regard to resilience, since the total travel time in the disrupted scenarios is not negatively affected, we can conclude that the resilience of the system is improved.
The presented study has some limitations, since the scenarios combine real actual data from the current systems and expected performance in combination with informed assumptions (particularly those for the scenarios of 2035 and 2050). We would expect some inaccuracies in the obtained values, but in any case, they can be treated as an upper bound of the real situation if the system in place is similar to the one presented in the study. We would also revise assumptions such as passengers arranging and planning their trips in advance or the time spent in the airports in the future; furthermore, algorithmic governance was not considered in the study, and that could positively impact the performance of systems (especially in 2050).
In future work, these elements will be revised, and we will focus on the extreme cases in which the performance was the best to understand which conditions are fulfilled to make the journey more efficient. We will use the framework to investigate further door-to-door travel, as how the 4 h door-to-door travel is achievable in the future is an interesting question.
Author Contributions
Writing—original draft preparation, M.B.; writing—review and editing, M.M.M.; writing—review and editing, V.D.V. All authors have read and agreed to the published version of the manuscript.
Funding
This paper presents findings of the X-TEAM D2D project, which was funded by the SESAR Joint Undertaking, grant number 891061, under the European Union’s Horizon 2020 research and innovation program.
Institutional Review Board Statement
Not applicable.
Informed Consent Statement
Not applicable.
Data Availability Statement
The data presented in this study are available on request from the corresponding authors. The data are not publicly available due to the data management policies of the X-TEAM D2D consortium partners.
Acknowledgments
The authors would like to express their gratitude to the Dutch Benelux Simulation Society (www.dutchBSS.org (accessed on 15 July 2022)) and EUROSIM for disseminating the results of this work.
Conflicts of Interest
The authors declare no conflict of interest. The funders had no role in the design of the study; in the collection, analyses, or interpretation of data; in the writing of the manuscript, or in the decision to publish the results.
References
- United Nations; Department of Economic and Social Affairs; Population Division. World Population Prospects 2019: Highlights; United Nations Department of Economic and Social Affairs: New York, NY, USA, 2019. [Google Scholar]
- Organisation for Economic Co-operation and Development. International Transport Forum Leveraging Digital Technology and Data for Human-Centric Smart Cities. The Case of Smart Mobility. 2020. Available online: https://www.itf-oecd.org/sites/default/files/docs/data-human-centric-cities-mobility-g20.pdf (accessed on 10 September 2021).
- Macioszek, E.; Kurek, A. The Analysis of the Factors Determining the Choice of Park and Ride Facility Using a Multinomial Logit Model. Energies 2021, 14, 203. [Google Scholar] [CrossRef]
- Azimian, A.; Wang, H.; Ayaragarnchanakul, E.; Creutzig, F.; Javaid, A.; Puttanapong, N. Choosing a Mode in Bangkok: Room for Shared Mobility? Sustainability 2022, 14, 9127. [Google Scholar] [CrossRef]
- di Vito, V.; Valentino Montaquila, R.; Cerasuolo, G.; Dziugiel, B.; MacZka, M.; Mazur, A.; Meincke, P.A.; Naser, F.; Mota, M.M.; Bagamanova, M.; et al. An Outline of a Concept of Operations for Integration of ATM and Air Transport into Multimodal Transport System for Door-To-Door Travel. In Proceedings of the Integrated Communications, Navigation and Surveillance Conference, ICNS, Herndon, VA, USA, 11–13 May 2010; Institute of Electrical and Electronics Engineers Inc.: Manhattan, NY, USA, 2022; Volume 2022. [Google Scholar]
- di Vito, V.; Valentino Montaquila, R.; Cerasuolo, G.; Dziugieł, B.; Meincke, P.A.; Naser, F.; Mujica Mota, M.; Bagamanova, M.; el Makhloufi, A.; Duca, G.; et al. X-TEAM D2D Project: First Results. In Proceedings of the 11th SESAR Innovation Days, online, 7–9 December 2021. [Google Scholar]
- Bagamanova, M.; Mujica Mota, M.; di Vito, V.; Valentino, R.; Giovanni, M.; Bartosz, C.; Maciej, D.; Meincke, P.A.; Duca, G.; Russo, R.; et al. Extended ATM for Seamless Travel (X-TEAM D2D). Scand. Simul. Soc. 2021, 189–195. [Google Scholar] [CrossRef]
- Bagamanova, M.; Mujica Mota, M.; di Vito, V. X-TEAM D2D: Modeling Future Smart and Seamless Travel in Europe. In 2021 Winter Simulation Conference (WSC 2021), Proceedings of the 2021 Winter Simulation Conference, Phoenix, AZ, USA, 12–15 December 2021; Kim, S., Feng, B., Smith, K., Masoud, S., Zheng, Z., Szabo, C., Lope, M., Eds.; IEEE: Piscataway, NJ, USA, 2022. [Google Scholar]
- European Commission 2018—Year of Multimodality. Available online: https://transport.ec.europa.eu/transport-themes/logistics-and-multimodal-transport/2018-year-multimodality_en (accessed on 15 July 2022).
- Zhao, J.; Guo, D.; Wang, J.; Yang, Z.; Zhang, H. Examining the Association of Economic Development with Intercity Multimodal Transport Demand in China: A Focus on Spatial Autoregressive Analysis. ISPRS Int. J. Geo-Inf. 2018, 7, 56. [Google Scholar] [CrossRef] [Green Version]
- Vickerman, R. Recent Evolution of Research into the Wider Economic Benefits of Transport Infrastructure Investments. ECD/ITF Jt. Transp. Res. Cent. Discuss. Pap. 2007, 9, 29–49. [Google Scholar] [CrossRef]
- Zhao, J.; Yu, Y.; Wang, X.; Kan, X. Economic Impacts of Accessibility Gains: Case Study of the Yangtze River Delta. Habitat Int. 2017, 66, 65–75. [Google Scholar] [CrossRef]
- Tłoczyński, D.; Szmelter-Jarosz, A.; Susmarski, S. Analysis of Sustainable Transport Systems in Service of Selected SEA-EU Consortium Countries’ Airports—A Pilot Case Study of Passenger Choices for Gdańsk Airport. Int. J. Environ. Res. Public Health 2022, 19, 827. [Google Scholar] [CrossRef]
- Tsoneva, E. Exploring Associations between Multimodality and Built Environment Characteristics in the U.S. Sustainability 2022, 14, 6629. [Google Scholar] [CrossRef]
- Casquero, D.; Monzon, A.; García, M.; Martínez, O. Key Elements of Mobility Apps for Improving Urban Travel Patterns: A Literature Review. Future Transp. 2022, 2, 1. [Google Scholar] [CrossRef]
- Burrieza-Galán, J.; Jordá, R.; Gregg, A.; Ruiz, P.; Rodríguez, R.; Sala, M.J.; Torres, J.; García-Albertos, P.; Cantú Ros, O.G.; Herranz, R. A Methodology for Understanding Passenger Flows Combining Mobile Phone Records and Airport Surveys: Application to Madrid-Barajas Airport after the COVID-19 Outbreak. J. Air. Transp. Manag. 2022, 100, 102163. [Google Scholar] [CrossRef]
- Susilo, Y.O.; Woodcock, A.; Liotopoulos, F.; Duarte, A.; Osmond, J.; Abenoza, R.F.; Anghel, L.E.; Herrero, D.; Fornari, F.; Tolio, V.; et al. Deploying Traditional and Smartphone App Survey Methods in Measuring Door-to-Door Travel Satisfaction in Eight European Cities. Transp. Res. Procedia 2017, 25, 2257–2275. [Google Scholar] [CrossRef] [Green Version]
- Wang, B.; Loo, B.P.Y. Travel Time Use and Its Impact on High-Speed-Railway Passengers’ Travel Satisfaction in the e-Society. Int. J. Sustain. Transp. 2019, 13, 197–209. [Google Scholar] [CrossRef]
- Yilmaz, V.; Ari, E. The Effects of Service Quality, Image, and Customer Satisfaction on Customer Complaints and Loyalty in High-Speed Rail Service in Turkey: A Proposal of the Structural Equation Model. Transp. Transp. Sci. 2017, 13, 67–90. [Google Scholar] [CrossRef]
- Losada-Rojas, L.L.; Gkartzonikas, C.; Pyrialakou, V.D.; Gkritza, K. Exploring Intercity Passengers’ Attitudes and Loyalty to Intercity Passenger Rail: Evidence from an on-Board Survey. Transp. Policy 2019, 73, 71–83. [Google Scholar] [CrossRef]
- Wang, T.; Zhang, Y.; Li, Y.; Fu, X.; Li, M. Sustainable Development of Transportation Network Companies: From the Perspective of Satisfaction across Passengers with Different Travel Distances. Res. Transp. Bus. Manag. 2021, 41, 100687. [Google Scholar] [CrossRef]
- de Oña, J.; de Oña, R.; Calvo, F.J. A Classification Tree Approach to Identify Key Factors of Transit Service Quality. Expert Syst. Appl. 2012, 39, 11164–11171. [Google Scholar] [CrossRef]
- Garrido, C.; de Oña, R.; de Oña, J. Neural Networks for Analyzing Service Quality in Public Transportation. Expert Syst. Appl. 2014, 41, 6830–6838. [Google Scholar] [CrossRef]
- Fu, X.M.; Zhang, J.H.; Chan, F.T.S. Determinants of Loyalty to Public Transit: A Model Integrating Satisfaction-Loyalty Theory and Expectation-Confirmation Theory. Transp. Res. Part A Policy Pract. 2018, 113, 476–490. [Google Scholar] [CrossRef]
- Zhang, C.; Liu, Y.; Lu, W.; Xiao, G. Evaluating Passenger Satisfaction Index Based on PLS-SEM Model: Evidence from Chinese Public Transport Service. Transp. Res. Part A Policy Pract. 2019, 120, 149–164. [Google Scholar] [CrossRef]
- Börjesson, M.; Rubensson, I. Satisfaction with Crowding and Other Attributes in Public Transport. Transp. Policy 2019, 79, 213–222. [Google Scholar] [CrossRef]
- Fellesson, M.; Friman, M. Perceived Satisfaction with Public Transport Service in Nine European Cities. J. Transp. Res. Forum 2012, 47, 3. [Google Scholar] [CrossRef] [Green Version]
- Lombardo, R.; Camminatiello, I.; Beh, E.J. Assessing Satisfaction with Public Transport Service by Ordered Multiple Correspondence Analysis. Soc. Indic. Res. 2019, 143, 355–369. [Google Scholar] [CrossRef]
- Shen, J.; Li, W. Discrete Hopfield Neural Networks for Evaluating Service Quality of Public Transit. Int. J. Multimed. Ubiquitous Eng. 2014, 9, 331–340. [Google Scholar] [CrossRef]
- García-Albertos, P.; Cantú Ros, O.G.; Herranz, R. Analyzing Door-to-Door Travel Times through Mobile Phone Data. CEAS Aeronaut. J. 2019, 11, 345–354. [Google Scholar] [CrossRef]
- Zhao, Y.; Yu, H. A Door-to-Door Travel Time Approach for Evaluating Modal Competition of Intercity Travel: A Focus on the Proposed Dallas-Houston HSR Route. J. Transp. Geogr. 2018, 72, 13–22. [Google Scholar] [CrossRef]
- Schmalz, U.; Ringbeck, J.; Spinler, S. Door-to-Door Air Travel: Exploring Trends in Corporate Reports Using Text Classification Models. Technol. Forecast. Soc. Chang. 2021, 170, 120865. [Google Scholar] [CrossRef]
- Monmousseau, P.; Delahaye, D.; Marzuoli, A.; Feron, E. Door-to-Door Travel Time Analysis from Paris to London and Amsterdam Using Uber Data. In Proceedings of the 9th SESAR Innovations Days, Athens, Greece, 2–5 December 2019. [Google Scholar]
- Sun, X.; Wandelt, S.; Stumpf, E. Competitiveness of On-Demand Air Taxis Regarding Door-to-Door Travel Time: A Race through Europe. Transp. Res. E Logist. Transp. Rev. 2018, 119, 1–18. [Google Scholar] [CrossRef]
- European Commission; Directorate-General for Mobility and Transport; Directorate-General for Research and Innovation. Innovation Flightpath 2050: Europe’s Vision for Aviation: Maintaining Global Leadership and Serving Society’s Needs; Publications Office of the European Union: Luxembourg, 2011; Available online: https://data.europa.eu/doi/10.2777/50266 (accessed on 17 October 2022).
- Be Part of Hyperconnected Europe—Hyperconnected Europe. Available online: https://hyperconnected.eu/ (accessed on 12 July 2022).
- Detti, A.; Tropea, G.; Melazzi, N.B.; Kjenstad, D.; Bach, L.; Christiansen, I.; Lisi, F. Federation and Orchestration: A Scalable Solution for EU Multimodal Travel Information Services. Sustainability 2019, 11, 1888. [Google Scholar] [CrossRef] [Green Version]
- Vij, A.; Ryan, S.; Sampson, S.; Harris, S. Consumer Preferences for Mobility-as-a-Service (MaaS) in Australia. Transp. Res. Part C Emerg. Technol. 2020, 117, 102699. [Google Scholar] [CrossRef]
- Babić, D.; Kalić, M.; Janić, M.; Dožić, S.; Kukić, K. Integrated Door-to-Door Transport Services for Air Passengers: From Intermodality to Multimodality. Sustainability 2022, 14, 6503. [Google Scholar] [CrossRef]
- Djurhuus, S.; Sten Hansen, H.; Aadahl, M.; Glümer, C. Building a Multimodal Network and Determining Individual Accessibility by Public Transportation. Environ. Plan. B Plan. Des. 2015, 43, 210–227. [Google Scholar] [CrossRef]
- Martinčević, I.M.; Brlek, P.; Domjan, N.; Kačarević, K. Mobility as a Service (MaaS) as a Sustainability Concept for Tourist Destinations. Sustainability 2022, 14, 7512. [Google Scholar] [CrossRef]
- SESAR Joint Undertaking SYN+AIR—Synergies between Transport Modes and Air Transportation. Available online: https://www.sesarju.eu/projects/synair (accessed on 9 July 2022).
- European Commission Strategic Transport Research and Innovation Agenda (STRIA). Available online: https://ec.europa.eu/info/research-and-innovation/research-area/transport/stria_en (accessed on 13 July 2022).
- SESAR Joint Undertaking IMHOTEP—Integrated Multimodal Airport Operations for Efficient Passenger Flow Management. Available online: https://www.sesarju.eu/projects/imhotep (accessed on 9 July 2022).
- Mota, M.M.; Scala, P.; Herranz, R.; Schultz, M.; Jimenez, E. Creating the Future Airport Passenger Experience: IMHOTEP. In Proceedings of the 32nd European Modeling & Simulation Symposium, online, 16–18 September 2020; pp. 171–178. [Google Scholar]
- Classen, A.B.; Werner, C.; Jung, M. Modern Airport Management—Fostering Individual Door-to-Door Travel. Transp. Res. Procedia 2017, 25, 63–76. [Google Scholar] [CrossRef]
- Bagamanova, M.; Brucculeri, L.; Giovannini, S.; Ciaburri, M.; Sangermano, V.; Russo, R.; Duca, G.; Meincke, P.A.; Maczka, M.; Dziugieł, B.; et al. Extended ATM for Seamless Travel (X-TEAM D2D). In Proceedings of the Scandinavian Simulation Society, Trondheim, Norway, 20–21 September 2022; Linköping University Electronic Press: Linkoping, Sweden, 2022; Volume 185, pp. 189–195. [Google Scholar]
- TRANSIT|A Research Project Funded under SESAR 2020 Exploratory Research. Available online: https://www.transit-h2020.eu/ (accessed on 9 July 2022).
- SESAR Joint Undertaking Modus—Modelling and Assessing the Role of Air Transport in an Integrated, Intermodal Transport System. Available online: https://www.sesarju.eu/projects/modus (accessed on 9 July 2022).
- Rothfeld, R.; Straubinger, A.; Paul, A.; Antoniou, C. Analysis of European Airports’ Access and Egress Travel Times Using Google Maps. Transp. Policy 2019, 81, 148–162. [Google Scholar] [CrossRef]
- Kluge, U.; Ringbeck, J.; Spinler, S. Door-to-Door Travel in 2035—A Delphi Study. Technol. Forecast. Soc. Chang. 2020, 157, 120096. [Google Scholar] [CrossRef]
- X-TEAM D2D. Deliverable D2.1 “Future Reference Scenarios and Barriers”. 2021. Available online: https://xteamd2d.eu/future-reference-scenarios-and-barriers/ (accessed on 30 July 2022).
- X-TEAM D2D. Deliverable D3.1 ‘Concept of Operations for ATM Integration in Intermodal Transport System [Concept Outline]’. 2021. Available online: http://xteamd2d.eu/concept-of-operations-for-atm-integration-in-intermodal-transport-system-concept-outline/ (accessed on 30 July 2022).
- X-TEAM D2D. Deliverable D3.2 ‘Concept of Operations for ATM Integration in Intermodal Transport System [Concept Description]’. 2022. Available online: http://xteamd2d.eu/concept-of-operations-for-atm-integration-in-intermodal-transport-system-concept-description/ (accessed on 30 July 2022).
- X-TEAM D2D. Deliverable D4.1 ‘Concept of Operations for ATM Service to Passengers in Intermodal Transport System [Concept Outline]’. 2021. Available online: http://xteamd2d.eu/deliverables/concept-of-operations-for-atm-service-to-passengers-in-intermodal-transport-system-concept-outline (accessed on 29 July 2022).
- X-TEAM D2D. Deliverable D4.2 ‘Concept of Operations for ATM Service to Passengers in Intermodal Transport System [Concept Description]’. 2022. Available online: http://xteamd2d.eu/concept-of-operations-for-atm-service-to-passengers-in-intermodal-transport-system-concept-description/ (accessed on 28 July 2022).
- Kwasiborska, A.; Skorupski, J.; Yatskiv, I. Advances in Air Traffic Engineering; Kwasiborska, A., Skorupski, J., Yatskiv, I., Eds.; Lecture Notes in Intelligent Transportation and Infrastructure; Springer International Publishing: Cham, Switzerland, 2021; ISBN 978-3-030-70924-2. [Google Scholar]
- Mota, M.M.; di Bernardi, A.; Scala, P.; Ramirez-Diaz, G. Simulation-Based Virtual Cycle for Multi-Level Airport Analysis. Aerospace 2018, 5, 44. [Google Scholar] [CrossRef] [Green Version]
- OpenStreetMap Contributors OpenStreetMap. Available online: https://www.openstreetmap.org/#map=8/52.154/5.295 (accessed on 9 April 2022).
- X-TEAM D2D. Deliverable D5.1 “Concept of Operations Validation Report”. 2022. Available online: http://xteamd2d.eu/concept-of-operations-validation-report/ (accessed on 30 July 2022).
- Gates, T.J.; Noyce, D.A.; Bill, A.R.; Van Ee, N. Recommended Walking Speeds for Timing of Pedestrian Clearance Intervals Based on Characteristics of the Pedestrian Population. Transp. Res. Rec. J. Transp. Board 2006, 1982, 38–47. [Google Scholar] [CrossRef]
- Connexxion Up-to-Date Travel Information. Available online: https://www.connexxion.nl/en/travel-information/up-to-date-travel-information (accessed on 10 September 2021).
- Electric Scooter Guide Best Electric Scooters of 2021: According to Science and Exclusive Data. Available online: https://electric-scooter.guide/best-rated/best-electric-scooters/ (accessed on 10 September 2021).
- EV Database Top Speed of Full Electric Vehicles Cheatsheet. Available online: https://ev-database.org/cheatsheet/top-speed-electric-car (accessed on 10 September 2021).
- NV Nederlandse Spoorwegen Travel Information. Available online: https://www.ns.nl/en/travel-information (accessed on 10 September 2021).
- Deutsche Bahn Cheap Train Tickets|Timetables for Germany & Europe—Deutsche Bahn. Available online: https://www.bahn.com/en (accessed on 22 February 2022).
- Departures Hannover Airport. Available online: https://www.hannover-airport.de/rund-ums-fliegen/abflug/?tx_vcairportflugplanxml_pi1%5Baction%5D=showTomorrow&tx_vcairportflugplanxml_pi1%5Bdirection%5D=departure (accessed on 22 February 2022).
- Sloepen Netwerk Most Beautiful Boat Routes around Amsterdam and Haarlem (in Dutch). Available online: https://cdn.sloepennetwerk.nl/vaarkaarten/vaarkaart-amsteram-en-haarlem.pdf (accessed on 3 March 2022).
Figure 1.
Schematic structure of the ConOps validation framework.

Figure 2.
Regional airport area model (GIS layer)—D2A.

Figure 3.
Hub airport area model (GIS layer)—A2D.

Figure 4.
Travellers’ journeys in 2025.

Figure 5.
Travellers’ journeys in 2035.

Figure 6.
Travellers’ journeys in 2050.

Figure 7.
Total travel distance (including flight segment).

Figure 8.
Average travel speed statistics (including flight segment).

Figure 9.
Total travel time (including flight segment).


Table 1.
Business traveller profile’s key points assumed across time horizons.
| Business Traveller (Profile B) | 2025 | 2035 | 2050 |
|---|---|---|---|
| Travel alone (mainly) | ✓ | ✓ | ✓ |
| Time constraints/target times | ✓ | ||
| Budget limits | ✓ | ✓ | ✓ |
| A short stay and small luggage | ✓ | ✓ | |
| Might need to work during the travel time | ✓ | ||
| Frequent flyer/traveller | ✓ | ✓ | ✓ |
| Adult (18–70 years), generally in normal health condition (no physical or sensorial impairments) | ✓ | ||
| Can be allowed or not allowed to arrange/rearrange his travel plan depending on internal procedures | ✓ | ||
| Expects a very high comfort standard | ✓ | ✓ | |
| Expects a very short travel time | ✓ | ✓ | |
| Adult (18–70 years), generally in normal health condition (minor physical or sensorial impairments) | ✓ | ||
| Relies on dedicated business services for travel arrangements (no reservation or payment method constraints) | ✓ | ✓ | |
| Full flexibility for travel plan changes | ✓ | ✓ | |
| Might travel for long stays with large/heavy luggage | ✓ | ||
| Adult (18–75 years) with possible physical or sensorial impairments | ✓ | ||
| Must comply with environmental performance targets set by their company | ✓ |
Table 2.
Other travellers’ profile’s key points assumed across time horizons.
| Other Travellers (Profile V) | 2025 | 2035 | 2050 |
|---|---|---|---|
| Travel in small or larger groups (mainly) | ✓ | ✓ | ✓ |
| Unless specific travel reasons (a ceremony, family issues, etc.) have relatively low time constraints | ✓ | ✓ | ✓ |
| Have budget limits | ✓ | ✓ | ✓ |
| Can have larger/heavy luggage or other items such as sports equipment, walking aids, etc. | ✓ | ✓ | |
| Might need assistance (children, elderly, disabled people) | ✓ | ✓ | ✓ |
| Can be or not be a frequent flyer/traveller | ✓ | ||
| Can be of any age range, from baby/children to very elderly | ✓ | ✓ | ✓ |
| Can have any kind of physical or sensorial impairment | ✓ | ✓ | ✓ |
| Free to arrange/rearrange the travel according to the preferences | ✓ | ✓ | ✓ |
| Might have constraints in payment methods (unavailable credit card/cash, etc.) | ✓ | ||
| Might encounter language/communication barriers | ✓ | ||
| No constraints for reservation or payment methods | ✓ | ✓ | |
| Sensitive to environmental footprint of their journey | ✓ | ✓ | |
| No communication limitations thanks to technology support | ✓ | ||
| Only personal items/small luggage as luggage will be picked up and delivered door to door (except for walking aids/stroller) | ✓ | ||
| Frequent short-stay/medium-distance travels | ✓ | ||
| No communication limitations (owing to good education and/or technology support) | ✓ |
Table 3.
Profile B passengers’ composition and walking speed assumptions.
| Business Passenger Category | 2025 | 2035 | 2050 | Walking Speed, m/s |
|---|---|---|---|---|
| Older than 65 | 6% | 9% | 25% | Normal (1.18, 0.251) |
| Younger than 65 | 94% | 91% | 75% | Normal (1.445, 0.217) |
Table 4.
Profile V passengers’ composition and walking speed assumptions.
| Other Passenger Category | 2025 | 2035 | 2050 | Walking Speed, m/s |
|---|---|---|---|---|
| Without children and younger than 65 | 65% | 58% | 46% | Normal (1.445, 0.217) |
| Older than 65 | 19% | 25% | 32% | Normal (1.180, 0.251) |
| With children and younger than 65 | 10% | 9% | 12% | Normal (1.215, 0.188) |
| With impairments | 6% | 8% | 10% | Normal (1.175, 0.304) |
Table 5.
Experimental assumptions for generating passenger profiles in 2025, 2035, and 2050.
| Feature | Profile B | Profile V |
|---|---|---|
| Maximum number of PAX groups generated | 1000 | 1000 |
| Time between PAX groups, min | Uniform (0, 30) | Uniform (0, 30) |
| PAX group arrival rate, PAX groups | Uniform (0, 10) | Uniform (0, 10) |
| Number of people in PAX group | 1 | Uniform (1, 4) |
| First PAX group starts their journey | 05:00 | 07:00 |
| Last PAX group starts their journey | 23:00 | 20:00 |
Table 6.
Experiment assumptions for transport modes in 2035 and 2050.
| Mode | APT Type | Capacity of One Unit | Average Speed, km/h | Arrival Mode | Interarrival Time, min | Activity Radius, km/ Ride Duration, min | Availability |
|---|---|---|---|---|---|---|---|
| e-scooter | APT-R | 1 | 50 | on-demand | - | Uniform (5, 15) | - |
| eVTOL | APT-R | 4 | 200 | on-demand | - | Uniform (10, 15) | - |
| HST B-H 1 | APT-R | 391 | 200 | schedule | ~29 min | - | 2:36–00:20 |
| HST H–APT-R 2 | APT-R | 391 | 200 | schedule | 30 | - | 04:35–01:33 |
| flight | - | 75 | - | schedule | 06:00 11:25 18:15 | Uniform (45, 65) | - |
| ferry | APT-H | 50 | 60 | schedule | 10 | 19.2 km | 05:00–01:00 |
| e-scooter | APT-H | 1 | 50 | on-demand | - | - | - |
| e-taxi | APT-H | 1 person/group | Uniform (50, 57) | on-demand | - | Uniform (19, 23) km | - |
1 Highspeed train Brunswick–Hannover centre. 2 Highspeed train Hannover centre–Hannover airport.
Publisher’s Note: MDPI stays neutral with regard to jurisdictional claims in published maps and institutional affiliations. |
© 2022 by the authors. Licensee MDPI, Basel, Switzerland. This article is an open access article distributed under the terms and conditions of the Creative Commons Attribution (CC BY) license (https://creativecommons.org/licenses/by/4.0/).
Share and Cite
MDPI and ACS Style
Bagamanova, M.; Mujica Mota, M.; Di Vito, V. Exploring the Efficiency of Future Multimodal Networks: A Door-to-Door Case in Europe. Sustainability 2022, 14, 13621. https://doi.org/10.3390/su142013621
AMA Style
Bagamanova M, Mujica Mota M, Di Vito V. Exploring the Efficiency of Future Multimodal Networks: A Door-to-Door Case in Europe. Sustainability. 2022; 14(20):13621. https://doi.org/10.3390/su142013621
Chicago/Turabian StyleBagamanova, Margarita, Miguel Mujica Mota, and Vittorio Di Vito. 2022. "Exploring the Efficiency of Future Multimodal Networks: A Door-to-Door Case in Europe" Sustainability 14, no. 20: 13621. https://doi.org/10.3390/su142013621
Note that from the first issue of 2016, this journal uses article numbers instead of page numbers. See further details here.