Article

Influence of Minor Additions of Be on the Eutectic Modification of an Al-33wt.%Cu Alloy Solidified under Transient Conditions

1
Faculty of Mechanical Engineering, University of Campinas, Campinas 13083-860, Brazil
2
Federal Institute of Education, Science and Technology of São Paulo, IFSP, Bragança Paulista 12903-000, Brazil
3
Chemical and Materials Engineering Department, University of Alberta, Edmonton, AB T6G 2R3, Canada
*
Author to whom correspondence should be addressed.
Metals 2023, 13(1), 94; https://doi.org/10.3390/met13010094
Submission received: 23 November 2022 / Revised: 26 December 2022 / Accepted: 30 December 2022 / Published: 2 January 2023
(This article belongs to the Special Issue Casting Alloy Design and Characterization)

Abstract

:
Al-based alloys are often selected for use in various engineering applications as well as in the aircraft and aerospace industry. The improvement of their performances under severe conditions have required the use of alloying elements. In the present work, Be is added to the eutectic Al-33 wt.%Cu alloy with a view to investigating the resulting effects on microstructural features and hardness. A directional solidification technique is used, yielding a wide range of solidification cooling rates. This permits microstructural features to be investigated with emphasis on the role of Be on the eutectic morphology. The directionally solidified microstructures are formed by eutectic colonies for the Al-33 wt.%Cu alloy, however, with additions of both 0.05 and 0.5 wt.% Be, the original cell-like morphology is transformed into a trefoil-like morphology. This together with the α-Al dendritic pattern characterize the microstructure of the Al-33Cu-Be alloys examined. Solidification growth laws are experimentally derived relating dendritic and eutectic colony spacings to solidification cooling rates and growth rates. The length scale of such spacings is shown not to affect the Vickers hardness of the Al-33Cu-Be alloys examined; however, the additions of Be are shown to improve the brittle behavior of the Al-33 wt.%Cu alloy.

1. Introduction

Aluminum alloys are often a preferred choice in the aeronautical and aerospace industries, as well as for various engineering applications due to their lightweight properties and high strength-to-weight ratio when compared to steels [1,2]. Such outstanding mechanical and physical characteristics have required the increased use of alloying elements in order to improve the performance of components under extreme conditions for their use in strategic fields [3]. On the other hand, Deschamps and collaborators [4] emphasize that the challenges in working with multicomponent alloys concern the formation of different phases and the identification of useful alloy compositions. Moreover, the complex compositions of multiple elements offer many challenges to optimize the design of alloys. Among the latest developments of aluminum-based alloys for aeronautic applications, the 2xxx series—(Al-Cu) based ones, particularly those containing Mg—have attracted attention due to the precipitation strengthening of the Al2Cu and Al2CuMg phases and good resistances to damage and to fatigue crack growth when compared to other Al-alloys series. However, improvements are required concerning the yield strength for applications under high load conditions and corrosion resistance due to the anodic behavior of the Al2CuMg phase. On the other hand, controlled addition of alloying elements such as Sn, In, Cd and Ag is reported to be beneficial to mechanical properties, e.g., hardness, yield strength and ultimate tensile strength [5].
In terms of castings, not only the alloying content affects the final properties but also the cooling conditions during solidification [6]. In this regard, in recent years our research group has emphasized the study of the simultaneous effect of different cooling rates and alloying elements during solidification of several alloys systems on the resulting properties. For example: the addition of vanadium to the Al-Si-Fe alloy system [7], of zinc to the Al-Si system [8], of bismuth to the Zn-Al system [9]. We believe that such an approach can contribute to the understanding of the formation of phases and intermetallic compounds in more complex systems, such as multicomponent and high entropy alloys, when some common alloying elements are involved.
The present work aims to analyze the influence of additions of beryllium (0.05 and 0.5 wt.%) on the microstructure of the binary Al-Cu eutectic alloy (Al-33 wt.%Cu) during transient solidification conditions. To the best of the present authors’ knowledge, such study has not yet been performed. As a first goal, it is intended to support the ongoing work analyzing the solidification of Al-Cu hypoeutectic alloys with additions of beryllium, since such binary alloy has an Al-rich primary phase immersed in a eutectic matrix. The main goal is to generate knowledge on the Al-Cu-Be system in order to understand the effects of the additions of Ag, Ni, Si and Sn since in previous studies the following systems have been analyzed by our research group: Al-Ag-Cu [10], Al-Cu-Ni [11], Al-Si-Cu [12], Al-Sn-Cu [13], which can be used for a comparative study.
Works concerning the addition of Be to Al-Cu alloys are very scarce. A potential application in the aerospace field has been reported by Houska [14] highlighting the formation of a BeO protective surface layer when 0.1–0.3 wt.%Be is added to an Al-based alloy. This oxide layer exhibits excellent resistance to thermal oxidation corrosion. The author also mentions that Be accelerates the age hardening process in Al-Cu alloys, which is also interesting for aeronautical and structural applications. The rate of precipitation of the θ phase is significantly increased by the addition of beryllium, and a faster transformation rate is shown to occur in the earlier θ ′ ~ θ transition [15]. On the other hand, the as-cast microstructure influences the aging process, such as the eutectic morphology, as emphasized by Yuan [16]. Thus, it is necessary to conduct a detailed study on the formation of the as-cast microstructure before exploring the alloy aging. In the present work, a comparative analysis of the solidification of Al-33 wt.%Cu-X wt.%Be alloys (X = 0, 0.05 and 0.5—the last one representing an increase of ten times in Be content when compared to the first addition and such Be contents aim to cover two regions of the Al-Cu-Be phase diagram) under a wide range of cooling rates is performed, with a view to analyzing the increasing influence of beryllium on the experimental microstructural growth laws and on the modification of the eutectic morphology.

2. Materials and Methods

The investigated Al-based alloys, Al-33 wt.%Cu, Al-33 wt.%Cu-0.05 wt.%Be and Al-33 wt.%Cu-0.5 wt.%Be, were prepared using commercially pure Al, Cu and a Cu-Be master alloy, for which the respective compositions are summarized in Table 1. At first, to produce each alloy, 800 g of Al were placed in a silicon carbide crucible, previously coated with alumina, and melted in a muffle furnace at 800 °C. Subsequently, the required amounts of Cu and Be were incorporated into the molten Al. For the eutectic Al-Cu alloy, only chips of commercial-purity Cu were added. For the ternary alloys, additional chips of a Cu-10 wt.%Be master alloy were used. The molten alloy was mechanically stirred using an alumina-coated stainless-steel bar and the resulting mixture was again placed into the furnace for about 45 min. This mechanical homogenization procedure was repeated three more times. In order to eliminate possible gases trapped in the liquid, ultrapure Argon (UN1006) was injected into the molten mixture for approximately 2 min and at about 1atm. The molten alloy was poured into a 60 mm diameter and 150 mm height stainless-steel cylindrical split mold, previously arranged inside the casting chamber of the directional solidification apparatus, as schematically represented in Figure 1. It is worth noting that in order to minimize the radial heat losses and facilitate the removal of the casting, the mold was previously coated internally with a highly refractory alumina-based material. It is worth mentioning that the bottom of the mold, made of AISI 1020 carbon steel sheet, is directly in contact with the liquid metal, i.e., it is not covered with alumina, being the region responsible for heat extraction. The alloy was remelted and when a temperature of about 5% above the alloy liquidus temperatures (only considering Al, Cu, Fe and Be as elements in the alloy composition) was reached, the electric heaters were switched off and the water flow (20 L/min—controlled by a rotameter), at the bottom of the mold started the vertical upward directional solidification. It is worth noting that in this work, solidification occurs under transient heat flow conditions in which both growth and cooling rates are free to vary over time, unlike the steady-state regime, in which these parameters are set at constant values in a Bridgman-type solidification furnace [17]. During the cooling process, 8 (eight) K-type thermocouples continuously monitored the temperatures at different positions along the length of the casting while the thermal profiles (temperature–time) were recorded through a data logger system (LynxADS1000, São Paulo, Brazil), connected to a computer, at a frequency of 20 Hz. Subsequently, these data were used to determine the evolution of both the growth rates (V) and cooling rates (Ṫ) over the length of the casting.
As schematically represented in Figure 2, longitudinal and transverse samples were extracted from the directionally solidified (DS) castings for microstructural characterization. The samples were ground with silicon carbide papers from 100 up to 1200 mesh and subsequently polished with diamond paste (1 and 3 μm). Microstructural spacings measurements were performed on images acquired using an Olympus Inverted Metallurgical Microscope (model 41GX, Olympus, Tokyo, Japan). The eutectic colony/primary dendritic arm spacings (λEC1) were measured on transverse samples using the triangle method, while the lamellar (λL) and secondary dendritic arm (λ2) spacings were quantified using the linear intercept method, λL in transverse sections and λ2 in longitudinal sections. Both methods are depicted in Figure 2 [18]. A scanning electron microscope (SEM) FEI Inspect F5 (Thermo Fisher Scientific, Waltham, MA, USA) with an energy dispersive X-ray spectrometer (EDS) was used to verify the Cu content along the length of the DS castings and to quantify the distribution of the elements (Al, Cu and Fe) in the microstructure. The analysis of Be content was performed by using the inductively coupled plasma optical emission spectrometry technique. Samples with similar Ṫ values were extracted from the DS alloys castings and subjected to X-ray diffraction (XRD) analysis. The analyzed samples were extracted from different positions from the cooled surface of the DS castings (P): P = 5, 15, 30 and 70 mm, for Al-33 wt.%Cu and Al-33 wt.%Cu-0.05 wt.%Be alloys, and P = 5, 10, 30 and 70 mm, for the Al-33 wt.%Cu-0.5 wt.%Be alloy. A X’Pert-MDP (Philips Analytical X Ray, Malvern Panalytical, Cambridge, UK) diffractometer, employing CuKα radiation with a wavelength of 0.15406 nm in the 2θ range from 20° to 80°, was used to determine the phases. Vickers hardness tests were performed using a Shimadzu HMV-2 model hardness tester using a load of 0.5 kgf and a dwell time of 15 s. The average of at least 20 measurements was the hardness value adopted for each representative sample.

3. Results and Discussion

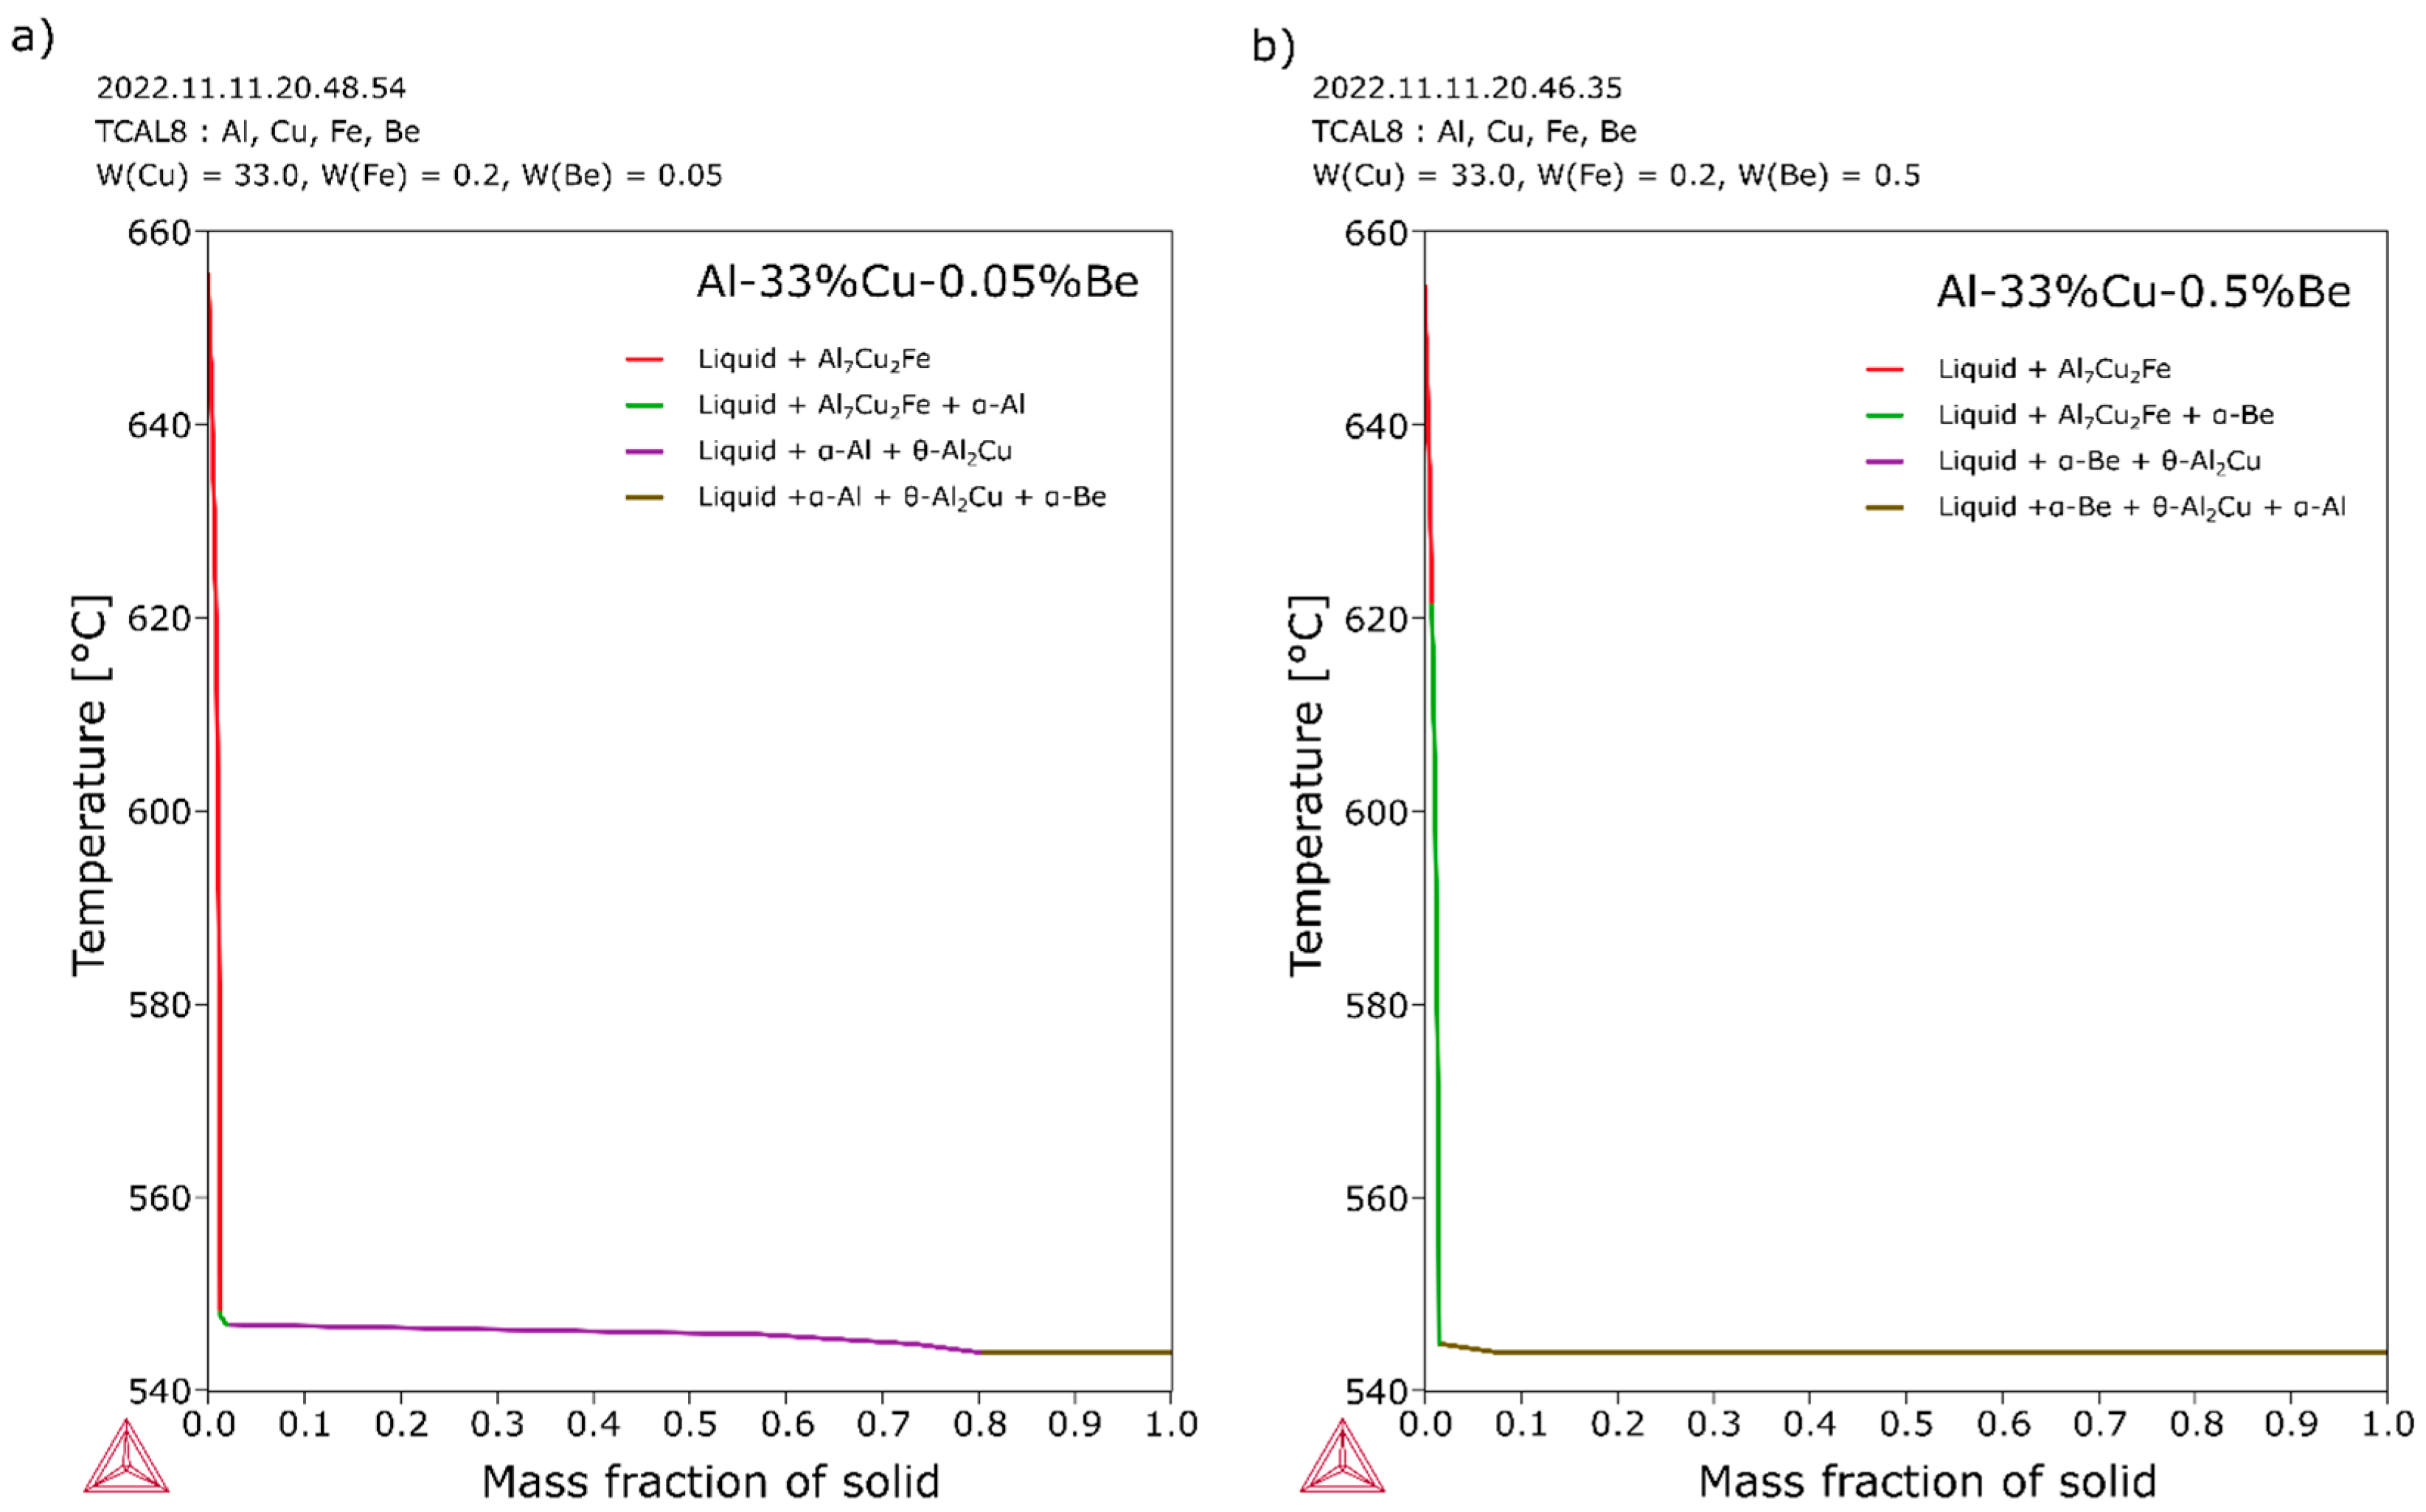
3.1. Thermo-Calc Simulations

The partial pseudo-binary Al-33 wt.%Cu-0.2 wt.%Fe-xBe (Be up to 0.1 wt.%) phase diagram is shown in Figure 3a, with a red dashed line indicating 0.05 wt.%Be (Al-33 wt.%Cu-0.2 wt.%Fe-0.05 wt.%Be alloy). In Figure 3b, a blue dashed line indicates 0.5 wt.%Be (Al-33 wt.%Cu-0.2 wt.%Fe-0.5 wt.%Be alloy). The 0.5 wt.%Be represents an increase of ten times when compared to the first addition and also, the chosen Be contents are to involve characteristic alloys of each region of the phase diagram: to the left and right of the 0.23 wt% Be point. At the right zone, it was intended to obtain the α-Be phase. The 0.2 wt.% Fe amount, shown later in this section, is a result from the alloy macrosegregation analysis, i.e., as an impurity present in aluminum and in the Cu-Be master alloy (Table 1), as well as from a result of diffusion from the cooled steel mold at elevated temperatures. Both diagrams were calculated under equilibrium conditions with Thermo-Calc software version 2021b using the TCAL8 database. The partial pseudo-binary Al-33 wt.%Cu-0.2 wt.%Fe phase diagram is not shown since the difference concerns only to the absence of α-Be (pure beryllium) when compared to the Al-33 wt.%Cu-0.2 wt.%Fe-xBe diagram. Hereafter, the alloys are referred to as Al-33 wt.%Cu, Al-33 wt.%Cu-0.05 wt.%Be and Al-33 wt.%Cu-0.5 wt.%Be, as shortened forms. During the solidification process, it can be noted that the α-Al and α-Be phases as well as the θ-Al2Cu and Al7Cu2Fe intermetallic compounds (IMC) are common to both alloys. The precipitation sequence predicted by the phase diagram, in the case of the alloy with the lowest Be content (0.05 wt.%), is: primary phases, Al7Cu2Fe and α-Al, binary eutectic reaction L → L + α-Al + θ-Al2Cu and ternary eutectic reaction L → α-Be + θ-Al2Cu + α-Be. In the case of the alloy with 0.5 wt.%Be the sequence is: primary phases, Al7Cu2Fe and α-Be, binary eutectic reaction L → L + α-Be + θ-Al2Cu and ternary eutectic reaction L → α-Be + θ-Al2Cu + α-Al. The α-Al and α-Be phases are FCC and HCP based structures respectively.

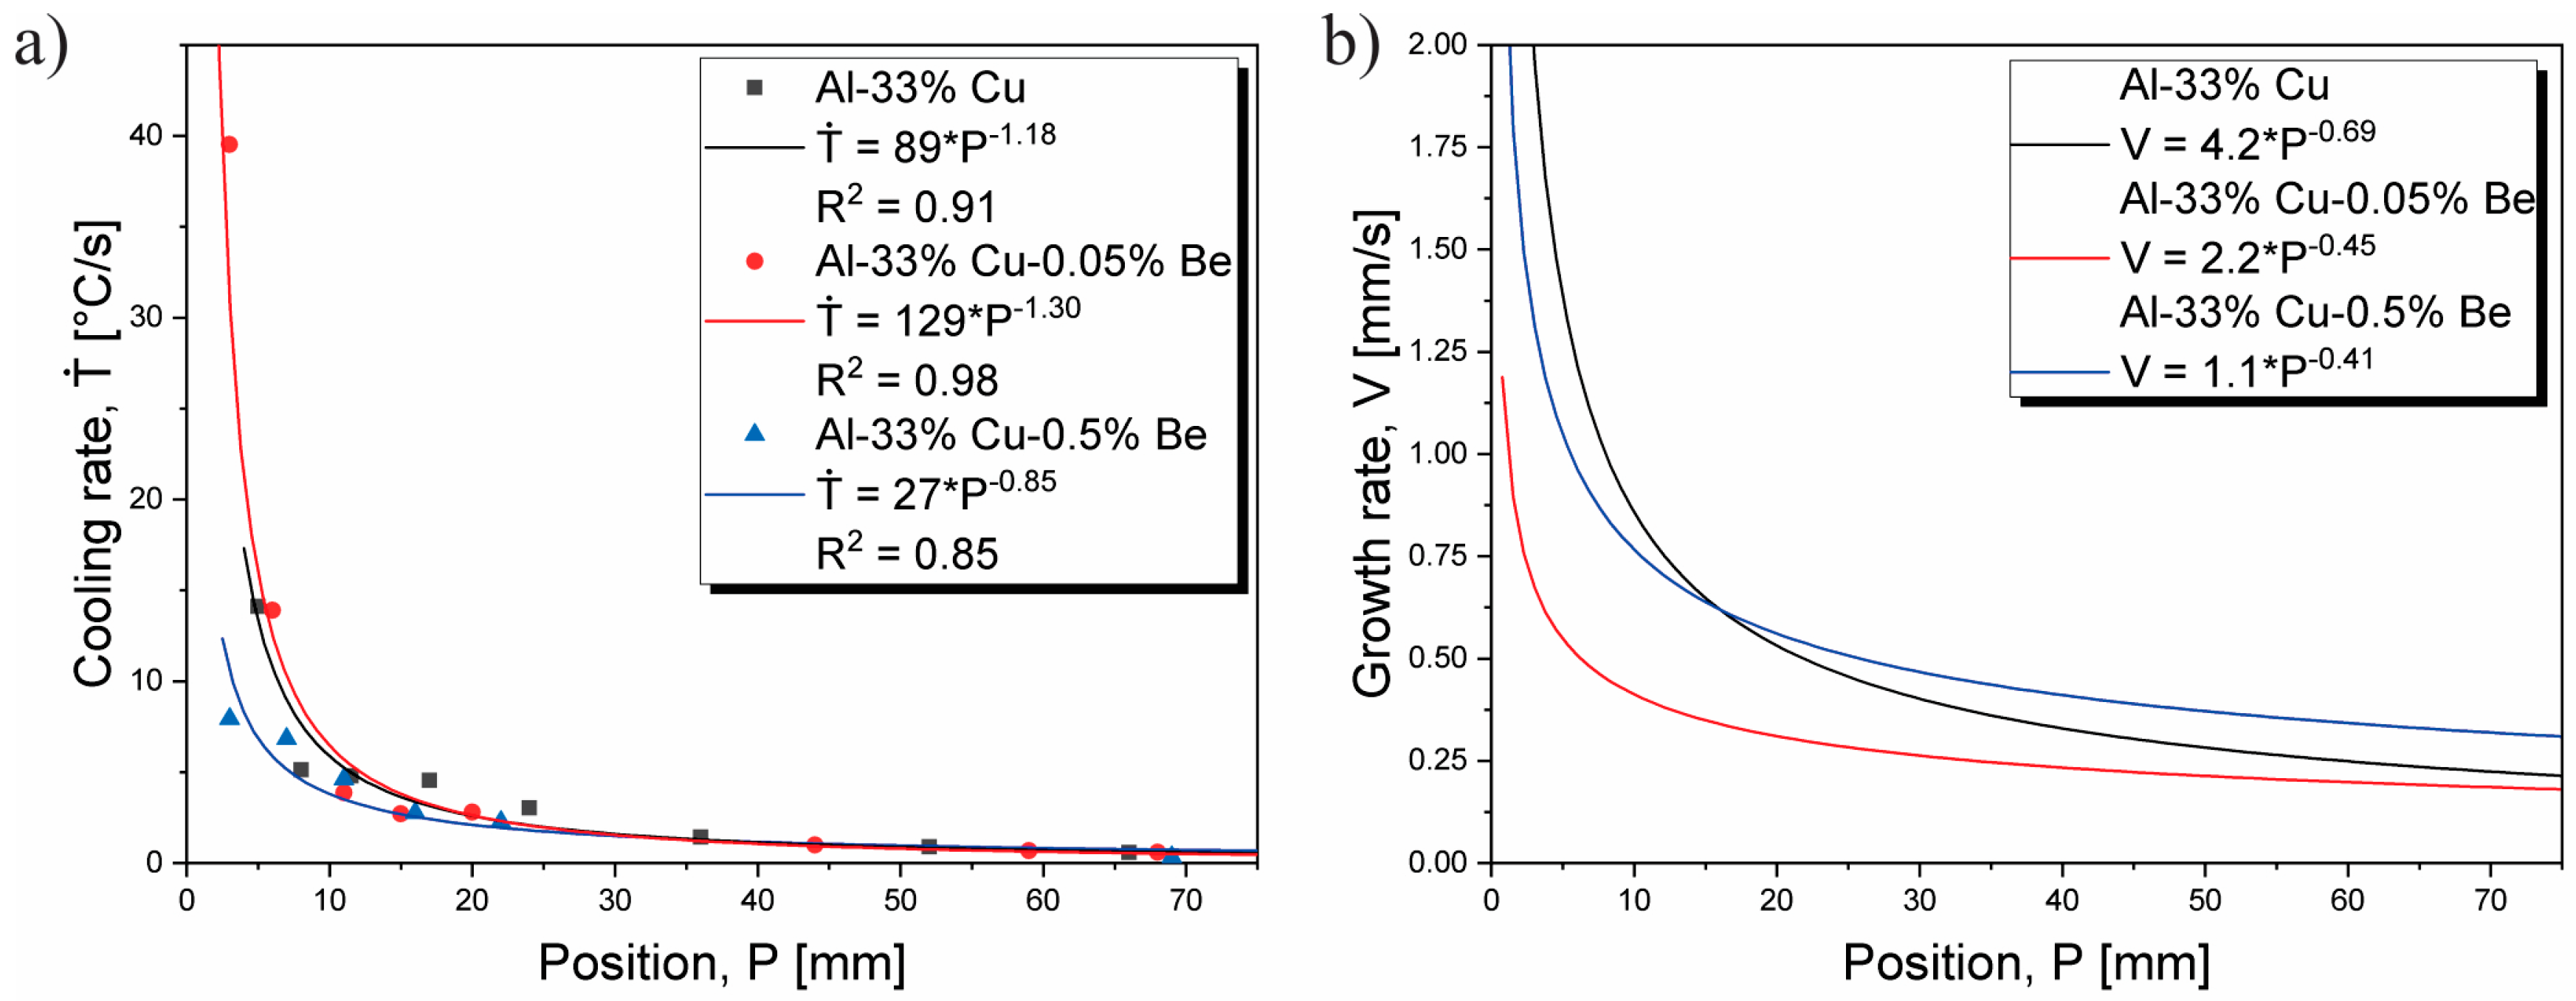
3.2. Solidification Thermal Parameters

It is worth mentioning that some results on the Al-33 wt.%Cu eutectic alloy were previously published by Kakitani and coauthors [19]. In order to analyze the effects of Be addition to the Al-Cu eutectic alloy, these results, whenever necessary, will be presented and referenced throughout the work. The cooling rate (Ṫ) and growth rate (V) profiles are shown in Figure 4a,b, respectively. These solidification thermal parameters were calculated from the temperature profiles obtained along the length of the DS castings through thermocouples readings during the experiments.
The cooling rate profiles were obtained from the first time-derivative of the function T = f(t), in which t represents the time corresponding to the isotherm of eutectic transformation passing by each thermocouple position. The growth rates were obtained from the first time-derivative of the equation P = f(t) that represents the position (P) of each thermocouple, from the cooled bottom of the casting, as a function of tL. As expected, higher values of Ṫ and V are predominant at positions near to the bottom of the cooled mold. Two factors contribute to the decrease in Ṫ and V toward the top of the casting. First, the advance of the solidification front leads to increase in the thermal resistance between the cooled mold and the remaining molten alloy. Second, the increase in the metal/mold interfacial thermal resistance due to the gap evolving between the inner wall of the mold and the casting bottom surface. When compared, Al-33 wt.%Cu and Al-33 wt.%Cu-0.05 wt.%Be alloys present similar cooling rate profiles. In this case, the amount of 0.05 wt.%Be seems to have little influence on this thermal parameter. However, increasing the amount of Be to 0.5%, the Ṫ values decrease specifically at positions close to metal/mold interface (up to P ≈ 20 mm). From this position, almost the same cooling rates can be observed for different positions in the DS alloys castings studied in this work. Although the Al-33 wt.%Cu and Al-33 wt.%Cu-0.05 wt.%Be alloys presented mostly the same (Ṫ) profiles, this trend did not occur for the (V) profiles, because the alloys differed from each other by having distinct thermal gradients (G). This can be explained by the definition of the cooling rate, which is provided by the product of thermal gradient and growth rate, i.e., (Ṫ) = G.V.

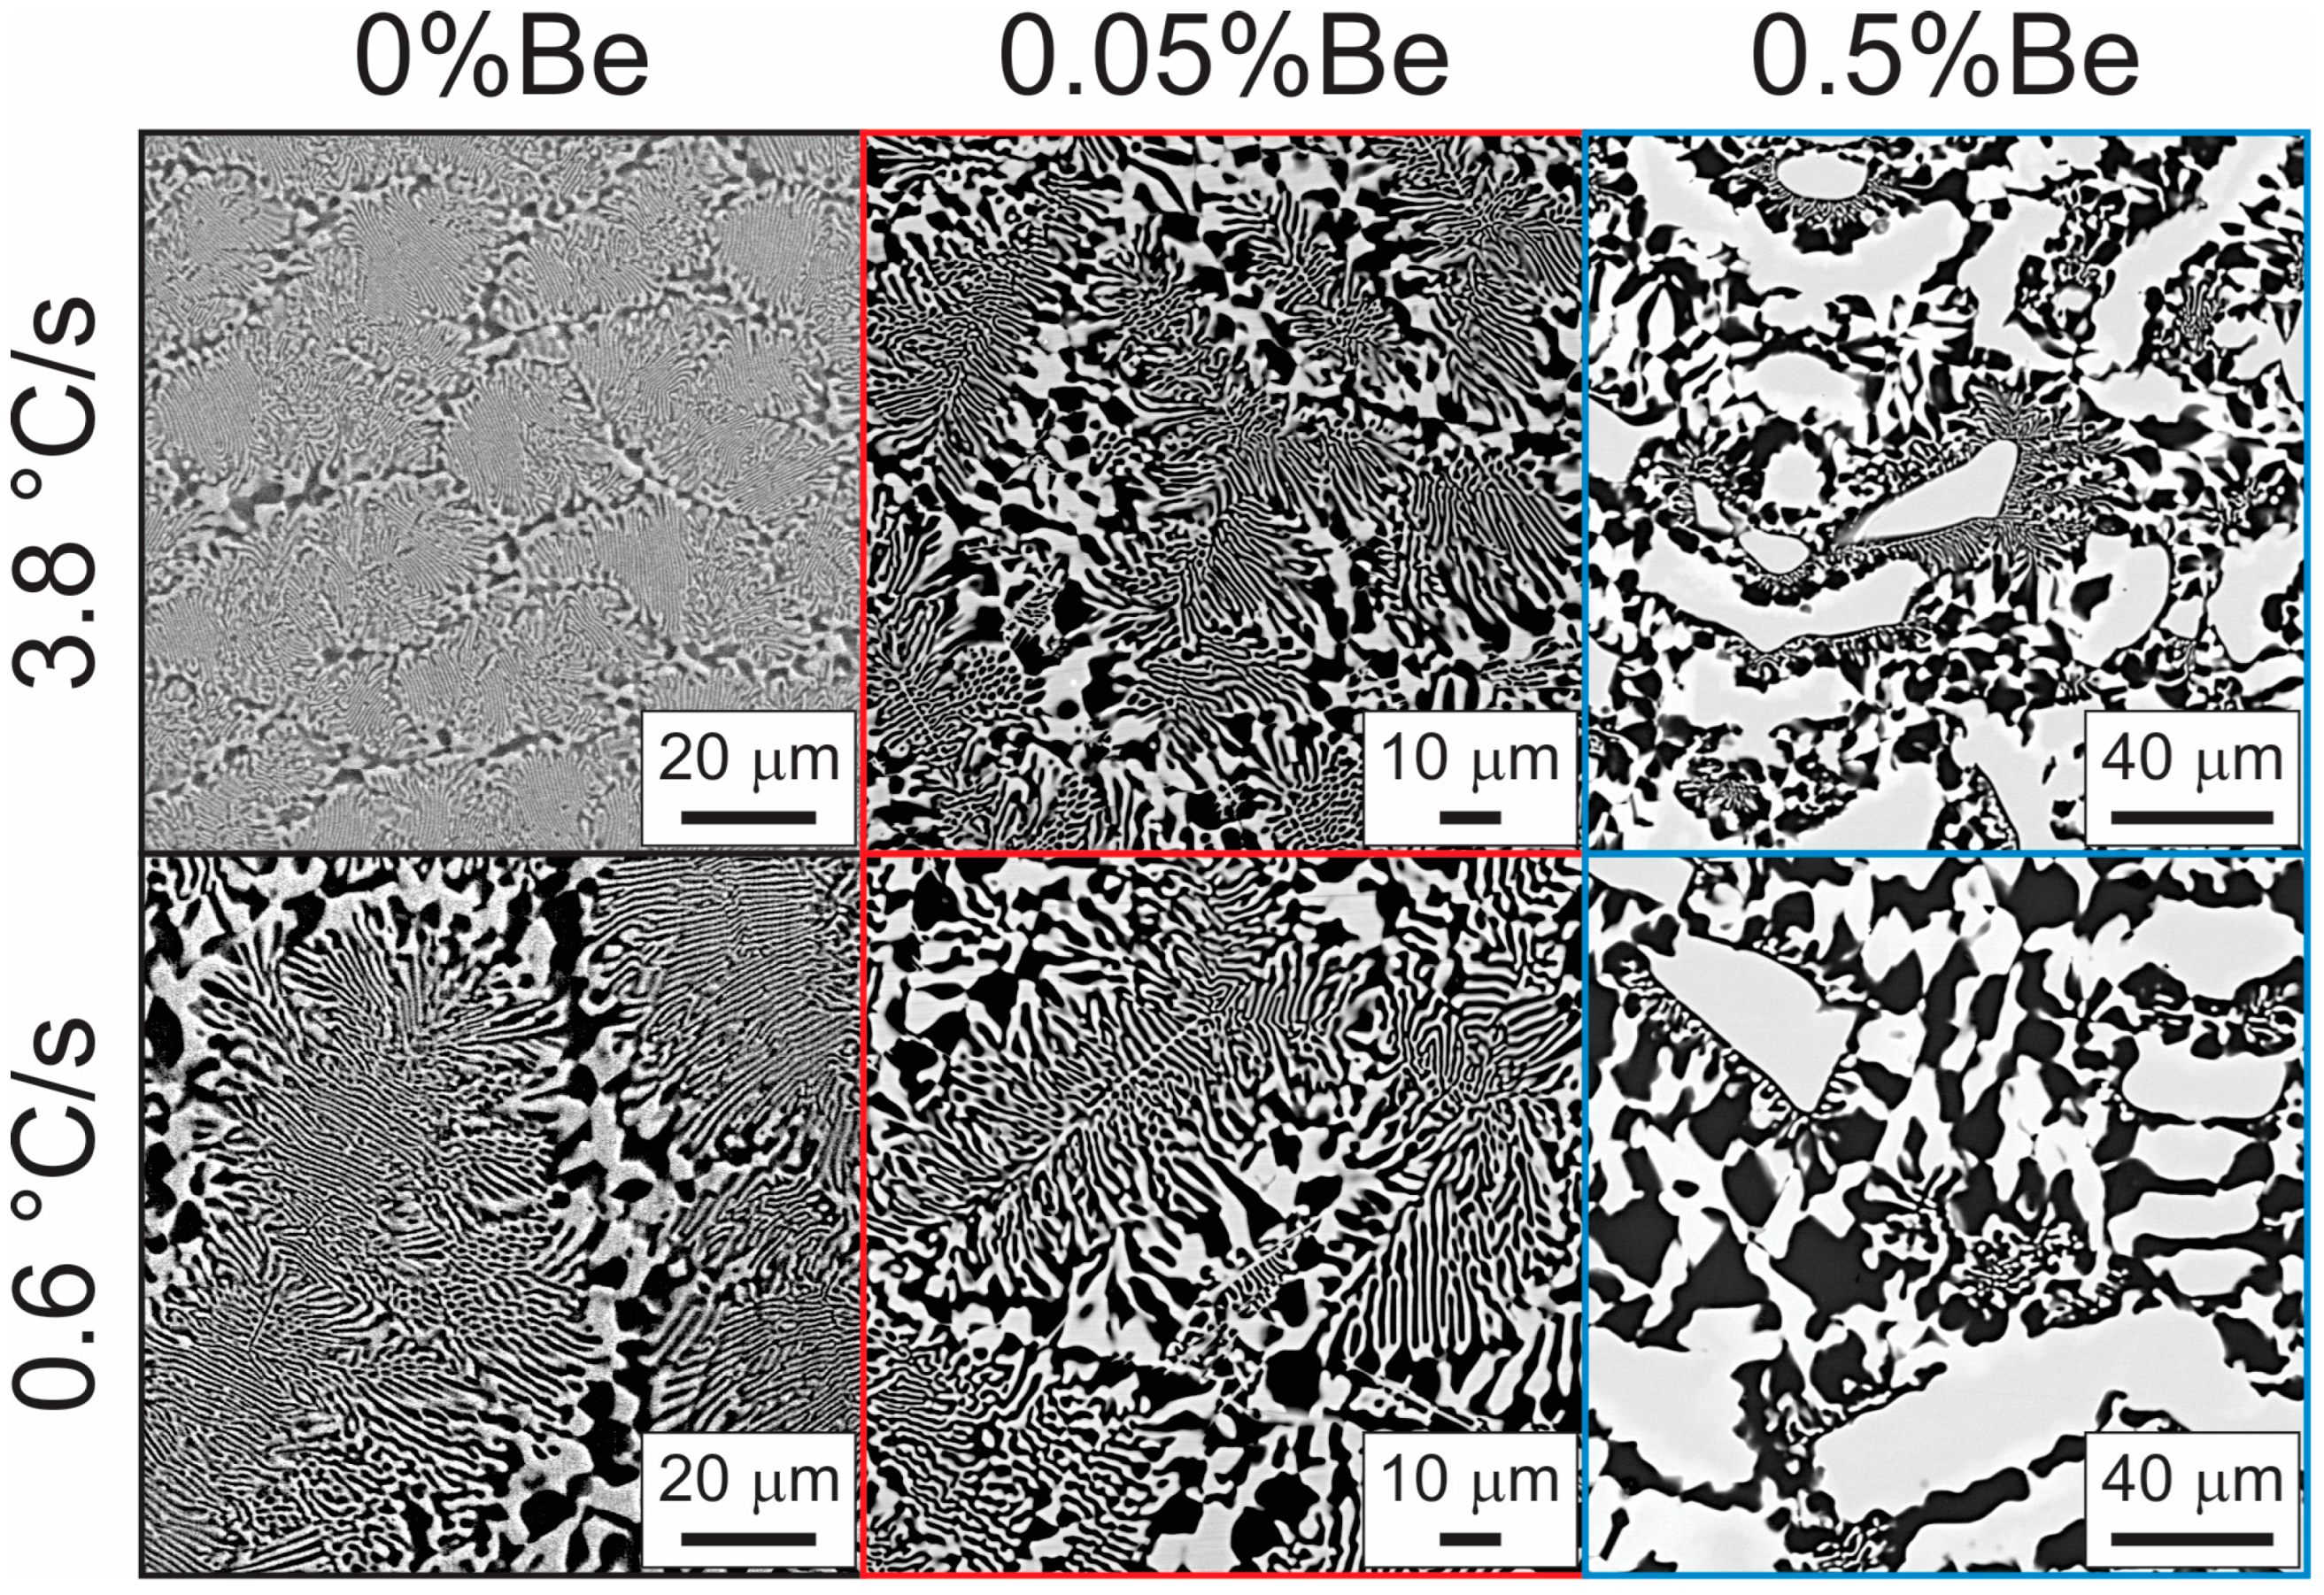
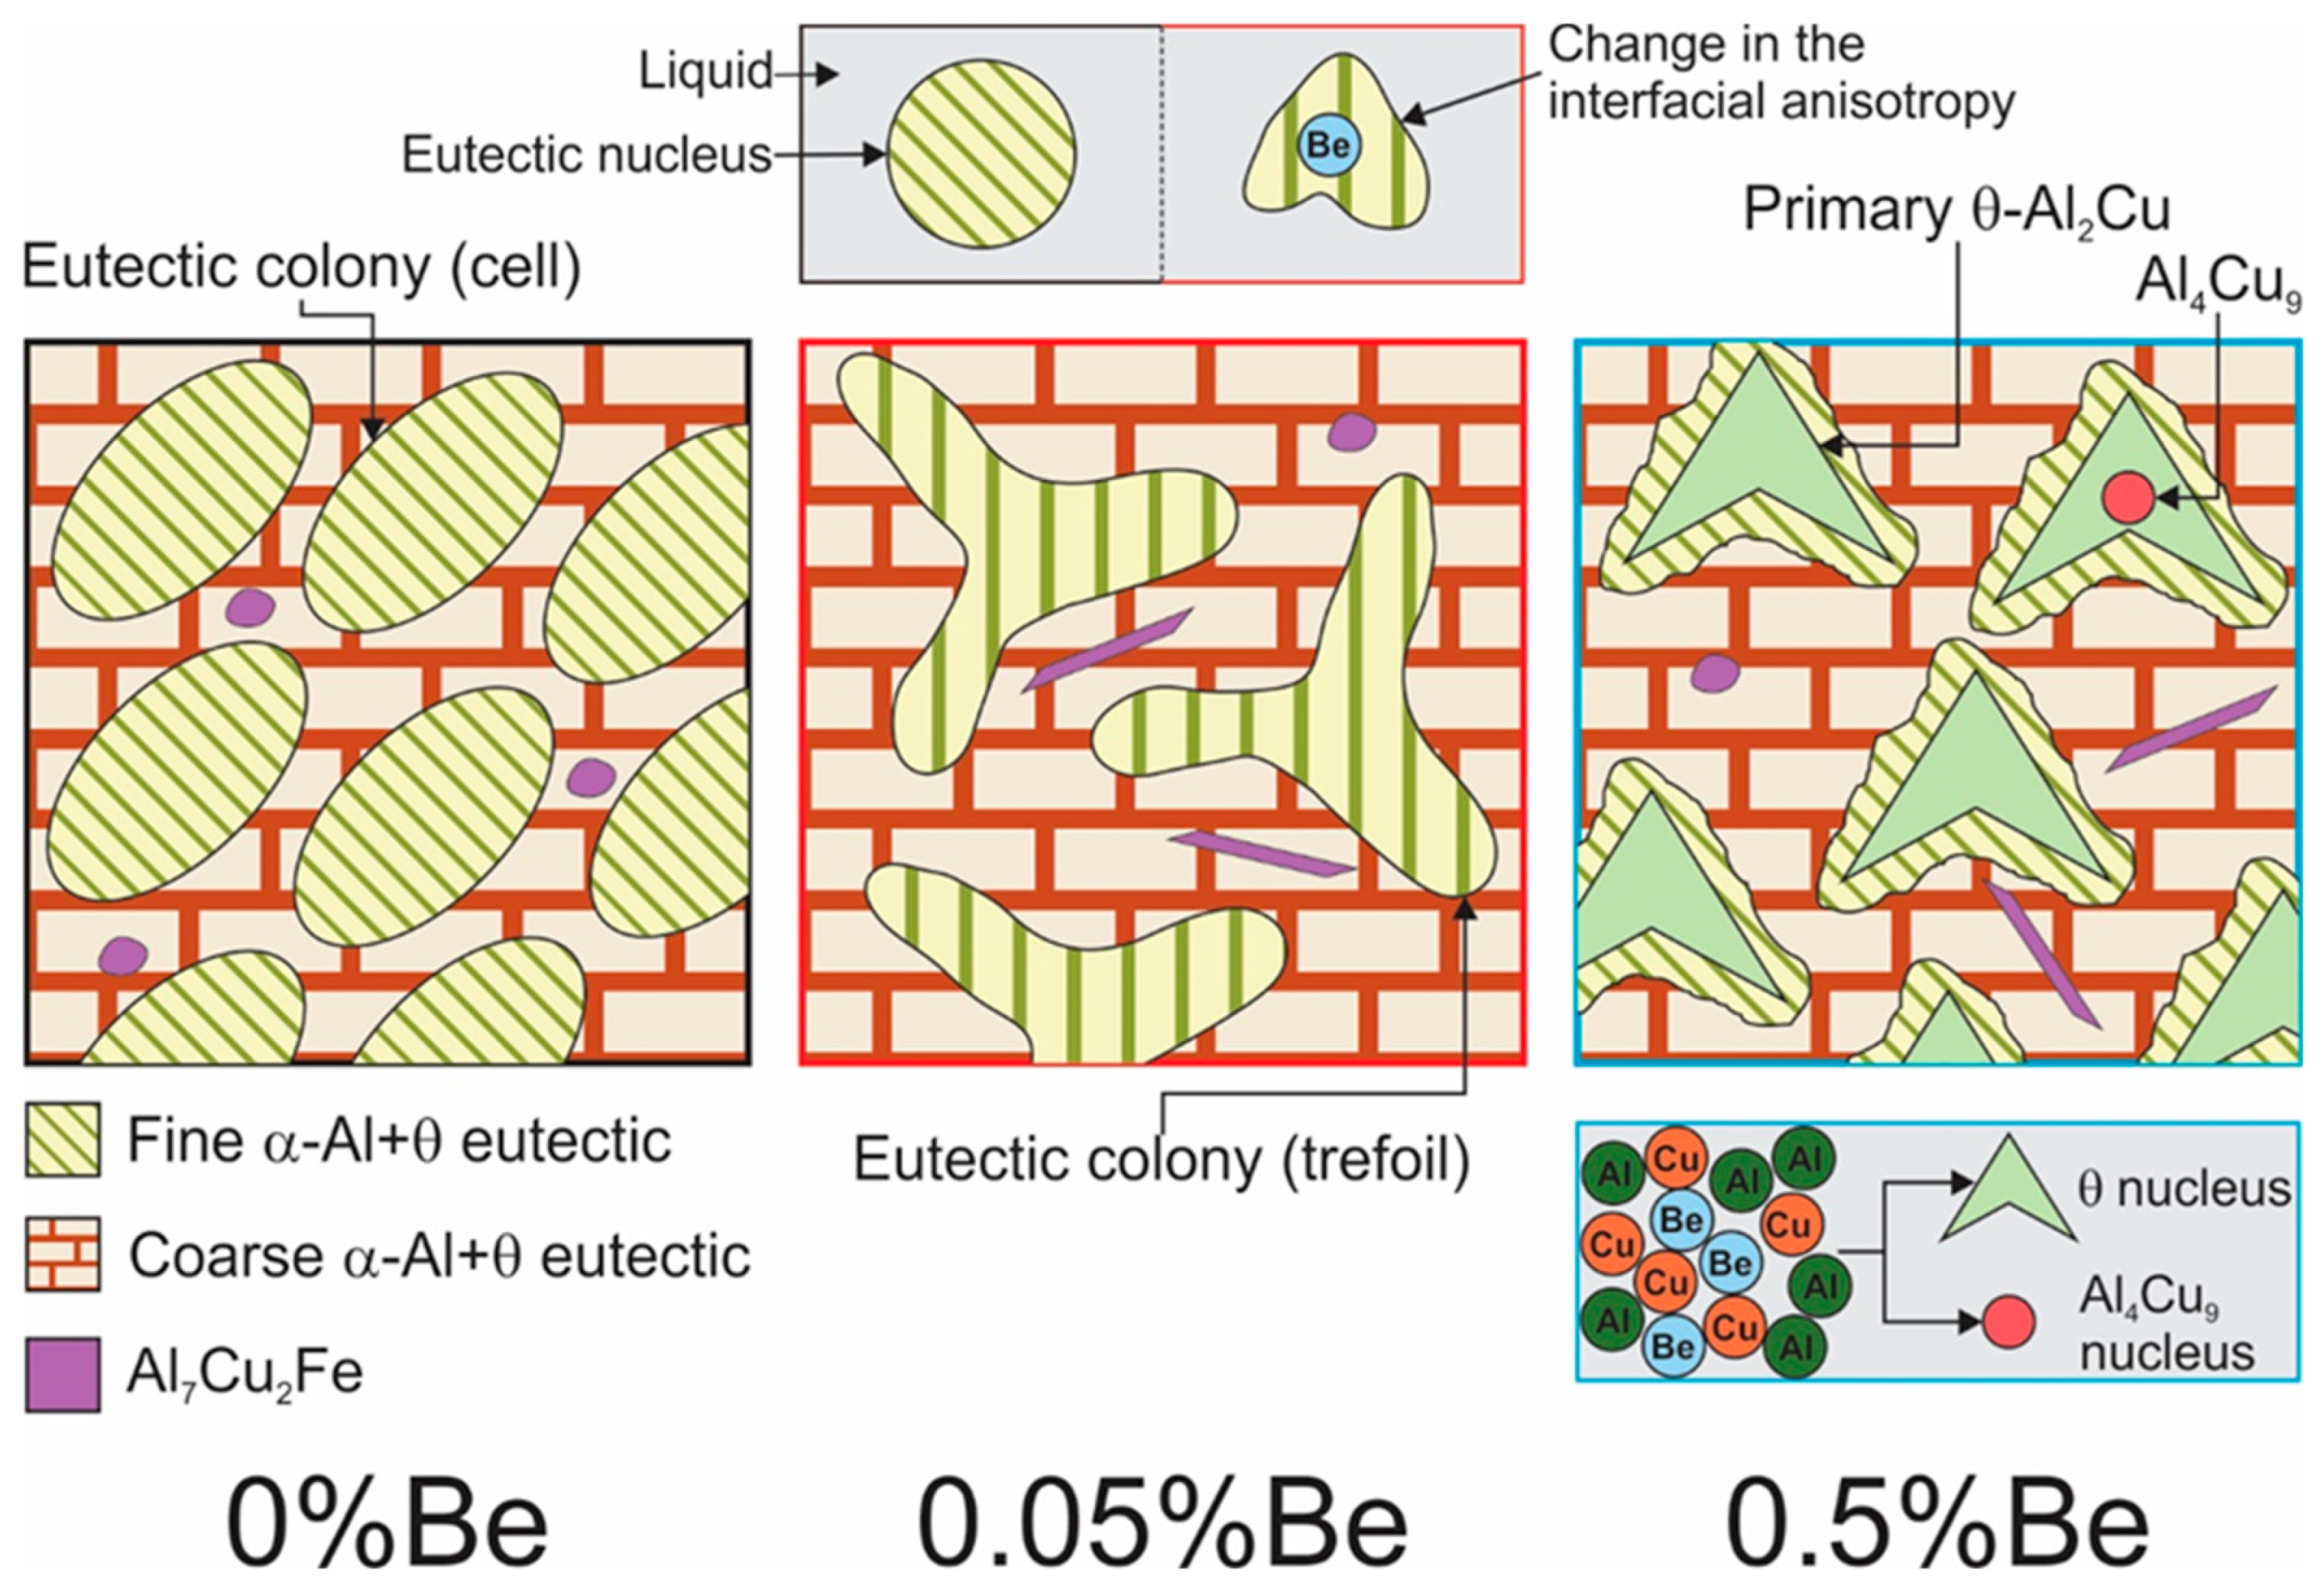
3.3. Microstructural Analysis

Transverse sections images obtained through scanning electron microscopy (SEM) are presented in Figure 5. Similar Ṫ values (3.8 °C/s and 0.6 °C/s) were adopted as reference to establish a comparison among the microstructures of the alloys studied in this work. First, eutectic colonies can be noted in the Al-33 wt.%Cu alloy, and dendrites with a trefoil morphology, in the Al-33 wt.%Cu-0.05 wt.%Be and Al-33 wt.%Cu-0.5 wt.%Be alloys. Additionally, the intermetallic compounds (IMCs) are finer for positions close to the cooled bottom of the castings (higher cooling rates) for any alloy examined. Second, beryllium seems to contribute not only to the microstructural coarsening, but also to the microstructural morphology modification. Figure 6 shows longitudinal images that provide another view of the microstructure being influenced by the increase in beryllium. It can be noted that the increase in beryllium gradually transforms the cellular morphology of the eutectic mixture into a dendritic one. The red line contour in Figure 6, for the alloy with 0.05 wt.%Be, indicates the secondary dendritic arms with the eutectic mixture inside, which is very curious. It seems that a stage of the transition from a cellular structure to a dendritic one has occurred. The alloy with 0.5 wt.%Be shows a characteristic dendritic morphology, although with a different nature, i.e., Al2Cu instead of the eutectic mixture (Al2Cu + α-Al)—which will be further shown in the elemental SEM-EDS analysis. How this mechanism leading to the Al2Cu prevalence occurs over the eutectic mixture, induced by the addition of beryllium is a study that deserves to be carried out. Jafari and Amiryavari [20] investigated the influence of zirconium and beryllium additions on the microstructure, mechanical properties and corrosion behavior of an as-cast AZ63 (Mg-Zn-Al) alloy. The AZ63 alloy containing 0.0001 and 0.001 wt.%Be exhibited microstructure coarsening effect, while a morphological change (from sixfold symmetrical to irregular shape) was observed to occur for the AZ63 alloy containing 0.01 and 0.1 wt.%Be. Longitudinal images, obtained by optical microscopy, are shown in Figure 6. The secondary dendritic arms are evident in alloys containing beryllium, but they are not observed in the binary Al-Cu eutectic alloy.

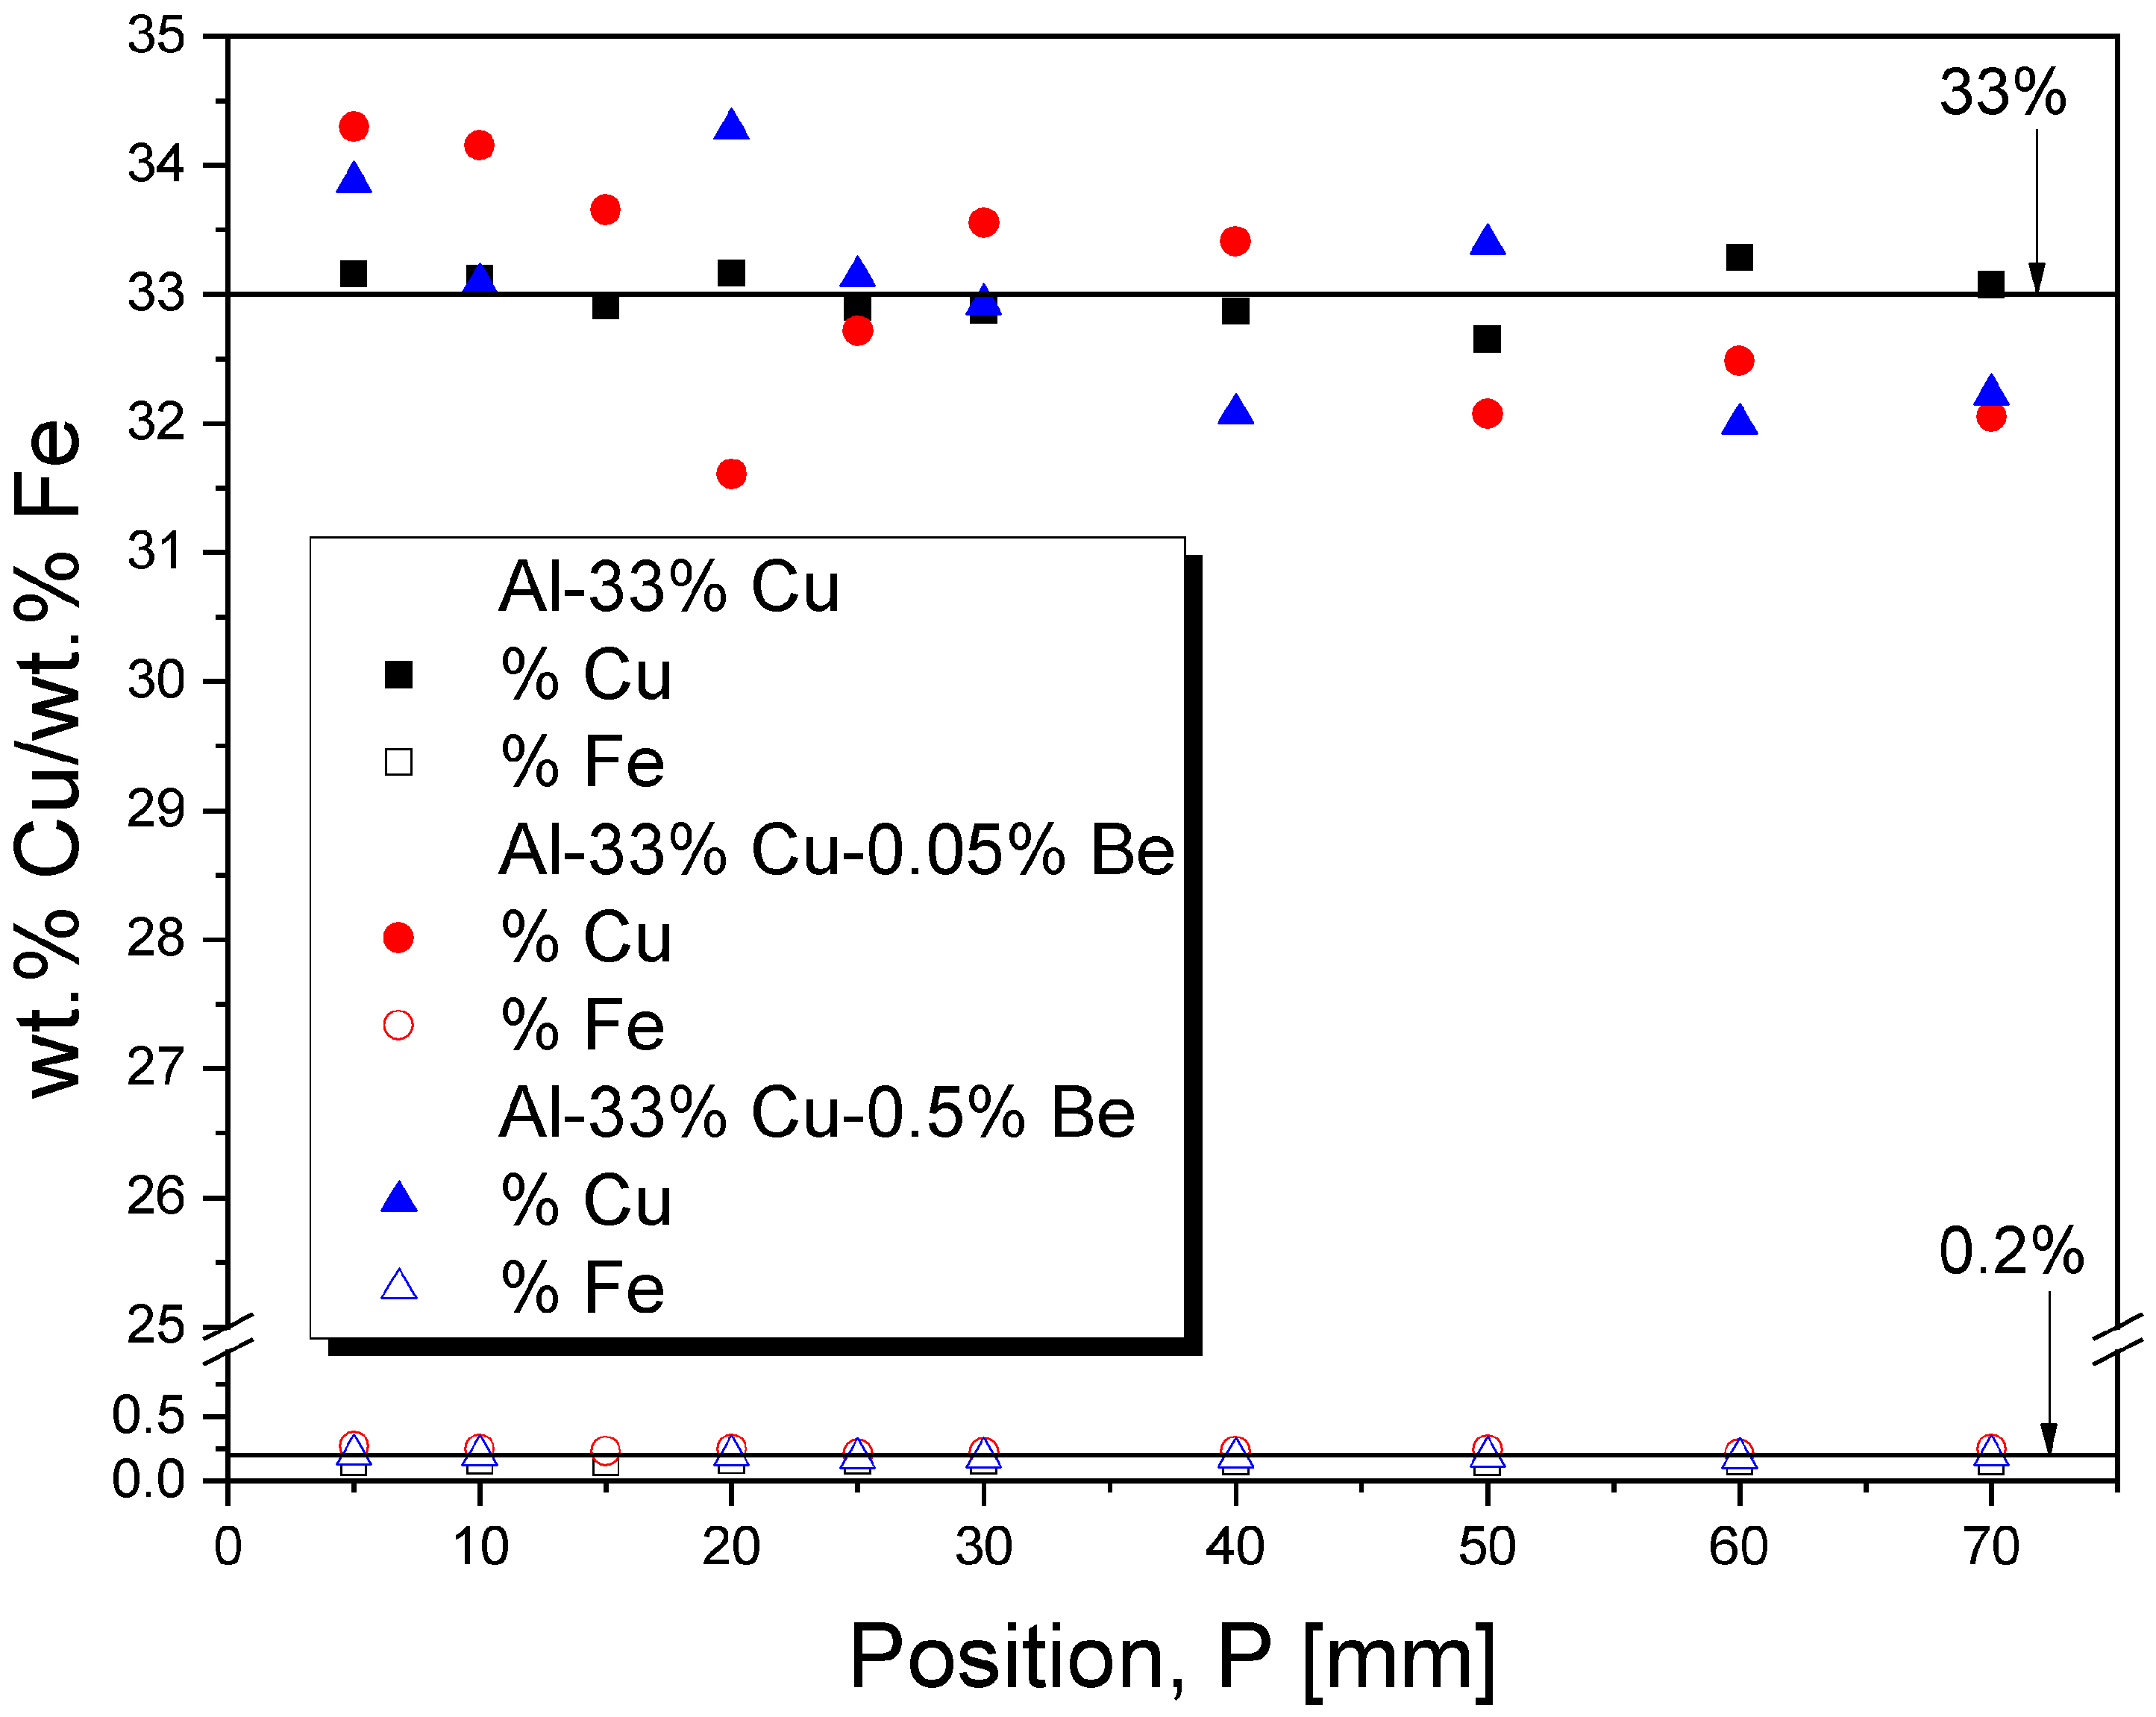
3.4. Chemical Composition

Figure 7 shows the Cu distribution profiles and the residual Fe profiles along the length of the DS castings. While Fe remains close to 0.2 wt.% along the length of all the alloys castings with Be, a small inverse Cu macrosegregation can be seen at positions closer to the water-cooled bottom of the Be-containing alloys. Considering the samples of Al-33 wt.%Cu, the Fe content remained at about 0.15 wt.% along the casting [19]. This behavior was observed to occur for other ternary alloys as Al-Cu-Si [12] and Al-Cu-Ni [11,21] alloys. The inverse macrosegregation was described by Grandfield et al. [22] as a result of movement of the interdendritic fluid in the opposite direction with respect to the advance of the solidification front. The increase in Cu content promotes microstructural refinement [23]. This fact, in addition to the high cooling rates imposed at positions close to the cooled bottom of the DS castings, may also have contributed to the microstructural refinement in this region. In order to verify the amount of Be in alloys and in view of the difficulty of detecting beryllium using EDS (the use of EDS is feasible when the phase contain a very high Be content) [24], the plasma optical emission spectrometry method was applied, and the results are presented in Table 2. As can be seen, the effective amount of Be is in good agreement with the nominal composition of the ternary alloys.

3.5. Microstructural Growth Laws

The values of primary dendritic arm spacing (λ1), eutectic colony spacing (λEC), lamellar spacing (λL) and secondary dendritic arm spacing (λ2) are correlated with the thermal parameters Ṫ and V in Figure 8. λEC and λ1 decrease with increasing Ṫ and V and the following experimental growth laws can be derived: λEC = 132 Ṫ−0.25 and λEC = 80 V−0.50, for the Al-33 wt.%Cu-0.05 wt.%Be alloy, and λ1 = 132 Ṫ−0.55 and λ1 = 24 V−1.10, for the Al-33 wt.%Cu-0.5 wt.%Be alloy. When compared with the binary DS Al-33 wt.%Cu alloy, studied by Kakitani and coauthors [19], the analyzed alloys in this work show higher λ1 values. It can be noted that, close to metal/mold interface, the amount of beryllium exerts a greater influence on the microstructure refinement as compared to that exerted by the cooling rates, since the alloy containing 0.5 wt.%Be has a higher degree of refinement, even being subjected to lower cooling rates when compared to the Al-33 wt.%Cu-0.05 wt.%Be alloy, as previously presented. However, as the distance from the cooled bottom of the DS casting increases, where both alloys are almost under the same cooling rates, the microstructure of the alloy with 0.5 wt.%Be becomes slightly coarser than that observed for the alloy with 0.05 wt.%Be. The use of −0.55 and −1.1 exponents in experimental laws correlating the primary dendritic arm spacing with cooling rate and growth rate, respectively, has been demonstrated to be effective for several ternary Al-based alloys solidified under unsteady-state conditions [25,26,27].
Despite that, in the case of the Al-33 wt.%Cu-0.05 wt.%Be alloy, the use −0.25 and −0.50 exponents promoted better adjustments in the experimental growth laws correlating λEC to Ṫ and V, respectively. When compared to the binary Al-33 wt.%Cu alloy, the addition of 0.05wt.%Be provided coarsening of the lamellae of eutectic colonies and, consequently, higher λL values were found. The experimental growth laws for lamellar spacing are λL = 1.9 Ṫ−0.25 and λL = 1.1 V−0.50. The exponents −0.25 and −0.5 used in experimental laws correlating the lamellar spacing with cooling rate and growth rate, respectively, were successfully applied for Al-Ni [28] and Al-Co [29] alloys. The exponential value of the growth rate was found to be 0.50 using the Jackson–Hunt theory of eutectic growth [30]. The use of the 0.50 exponent proved to also be satisfactory in studies with ternary alloys, e.g., alloys from the Al-Cu-Ag system [31]. Finally, the increase in Be content to 0.5wt.% promoted the refinement of secondary dendritic arm spacings, and the following experimental growth laws are proposed: λ2 = 22 Ṫ−1/3 and λ2 = 11 V−2/3, for the Al-33 wt.%Cu-0.05 wt.%Be alloy, and λ2 = 15 Ṫ−1/3 and λ2 = 5 V−2/3, for the Al-33 wt.%Cu-0.5 wt.%Be alloy. The use of −1/3 and −2/3 exponents to correlate secondary dendritic arm spacing with cooling rate and growth rate, respectively, was shown to be effective for several binary and ternary alloys solidified under unsteady-state conditions [7,8,23]. These results suggest that the addition of Be to the eutectic Al-33 wt.%Cu alloy (Figure 8a,b) promotes coarsening of the microstructure. However, comparing both Be additions, the increase in Be content from 0.05 to 0.5 wt.%, as shown in Figure 8c,d, promotes microstructural refining.

3.6. Microstructural Phases
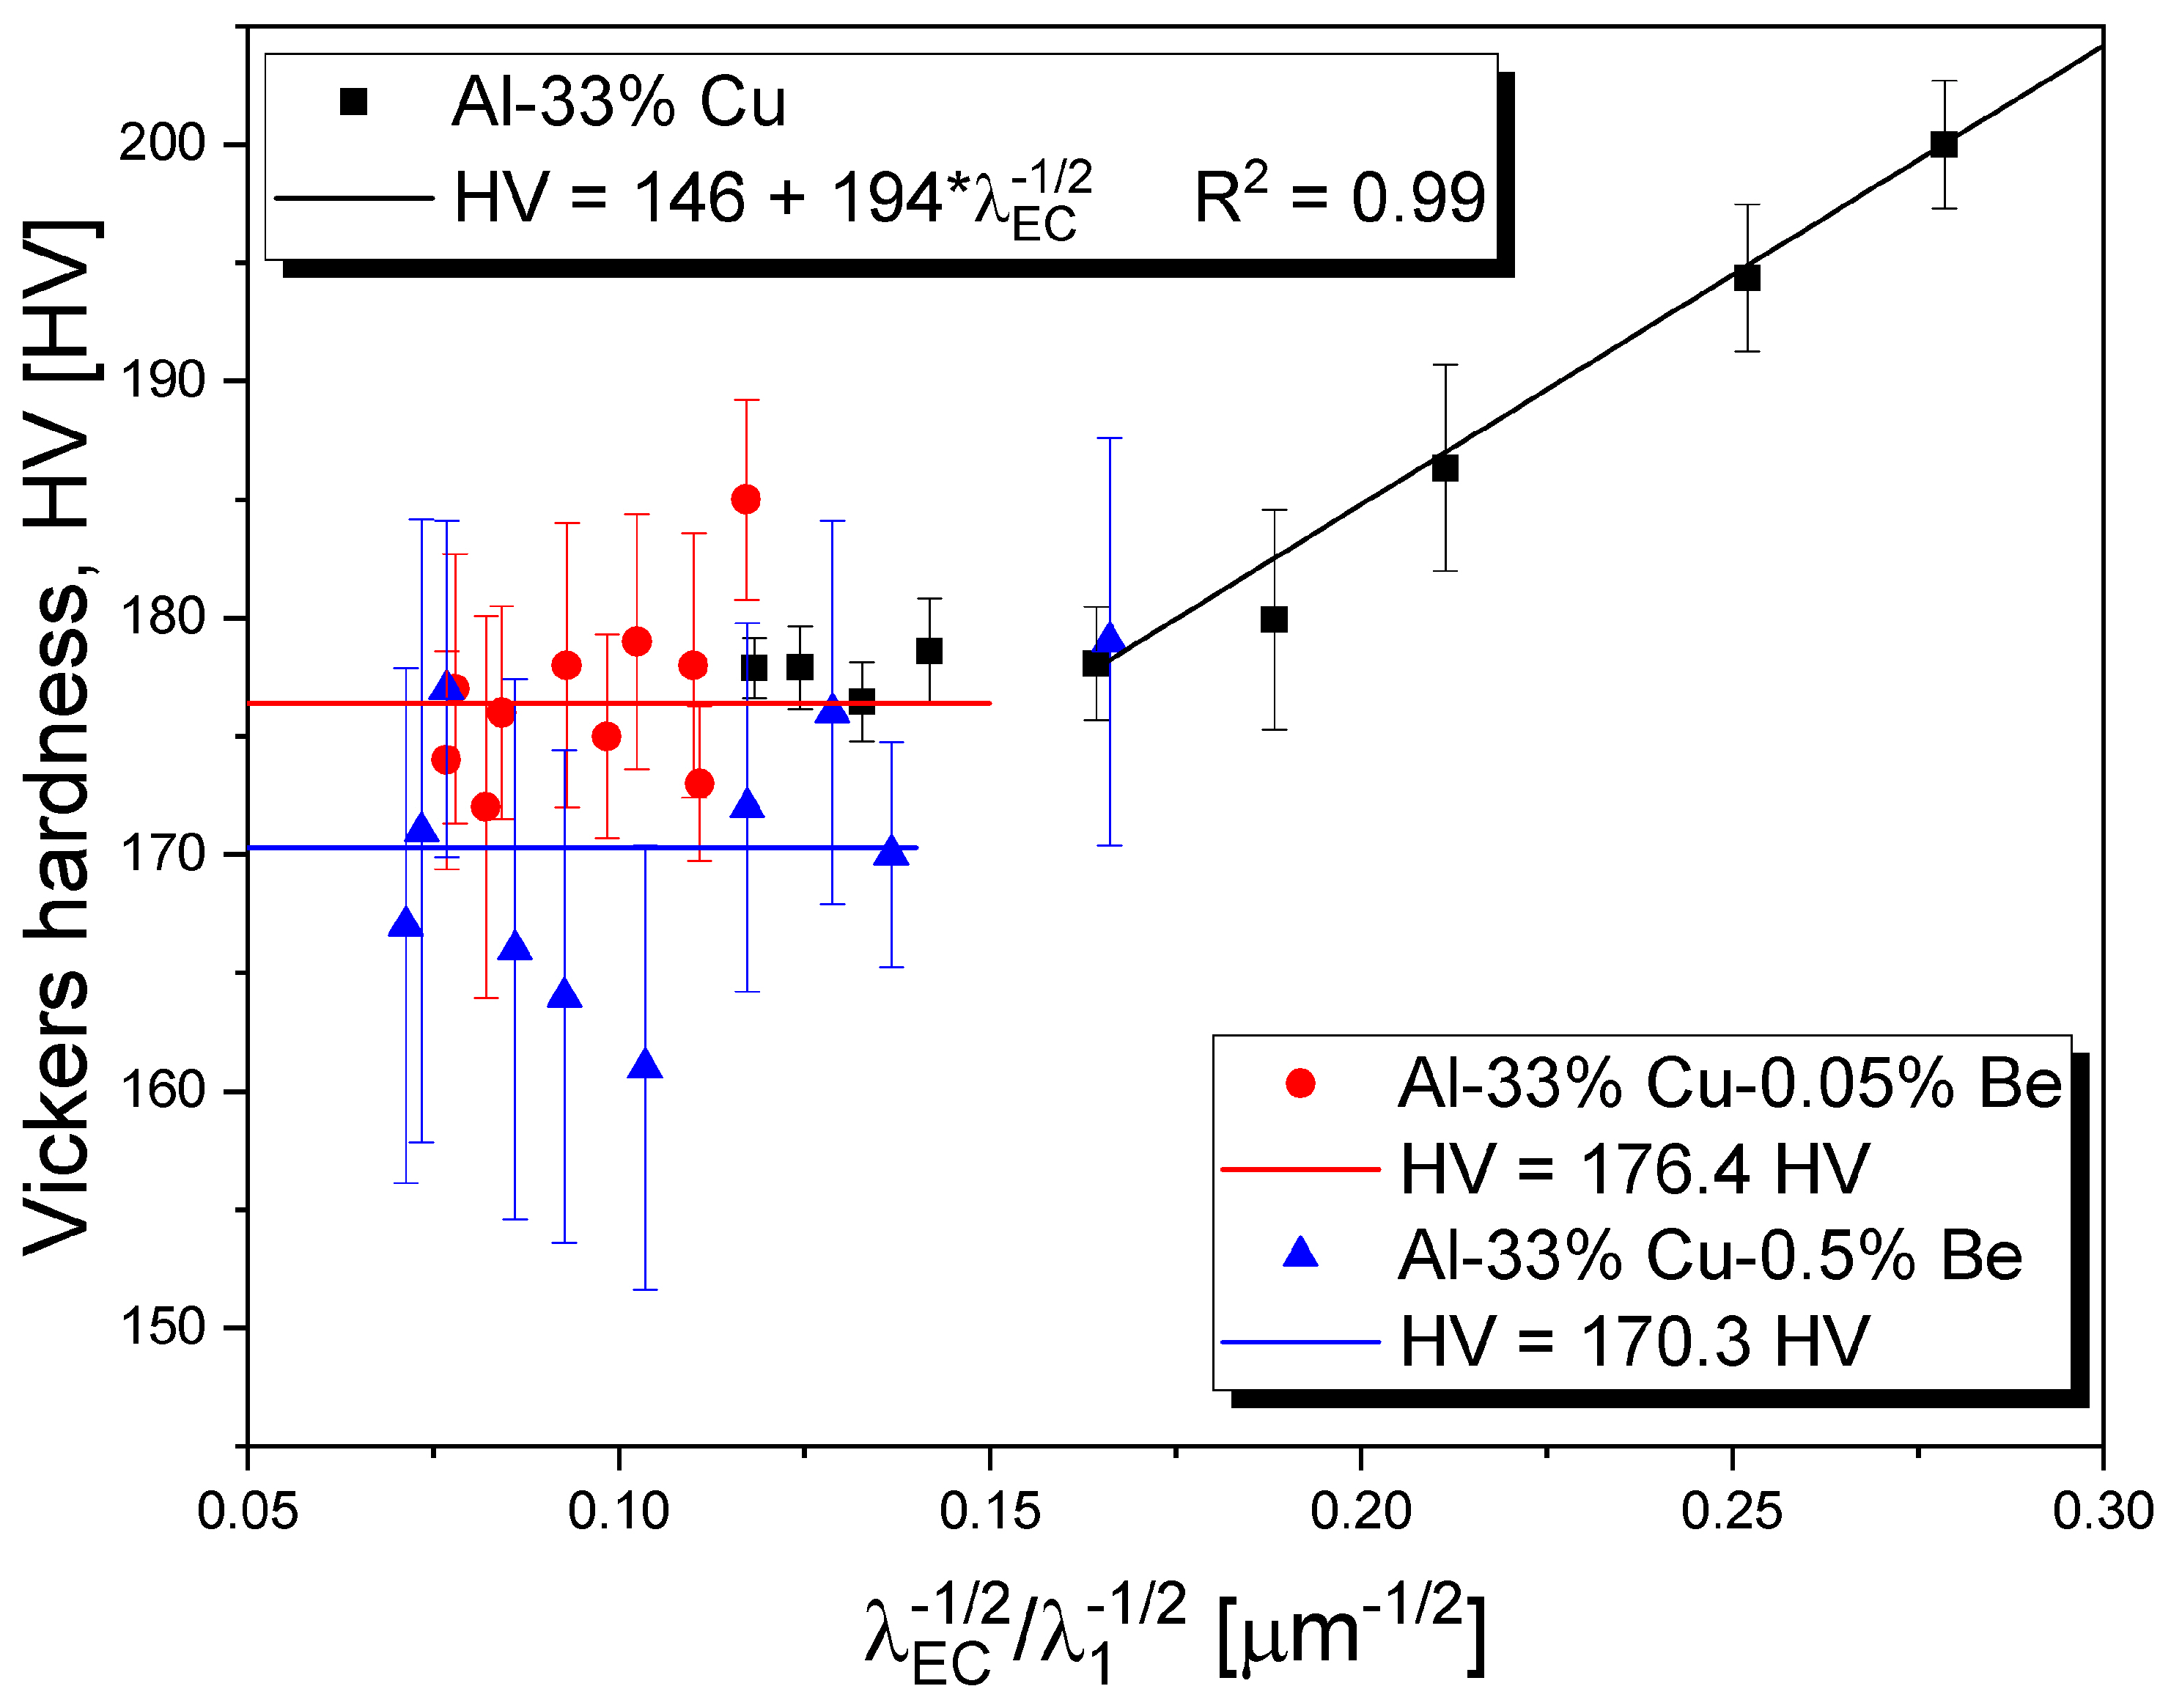
The XRD patterns of the samples extracted along the length of the DS Al-33 wt.%Cu, Al-33 wt.%Cu-0.05 wt.%Be and Al-33 wt.%Cu-0.5 wt.%Be alloys castings are shown in Figure 9a–c, respectively. Generally, the studied alloys had three phases in common: α-Al, Al2Cu and Al7Cu2Fe. Additionally, alloys containing Be present characteristic peaks of the Al4Cu9 phase, which are not predicted by the Al-Cu-Be pseudo-binary phase diagram (Figure 3). All phases were identified by comparison based on the diffraction patterns available in the Inorganic Crystal Structure Database (ICSD). The α-Al peaks are related not only to the alloy matrix, but also to the α-Al + Al2Cu eutectic mixture. Fe is the most common impurity found in Al-Cu alloys [32] and plate-like Al7Cu2Fe (referred to as β-CuFe) is one of the possible IMCs formed. Al7Cu2Fe is considered a deleterious constituent, since it may be the starting point of fatigue crack and localized corrosion of high-strength aluminum alloys [33,34]. When formed in large volume, Al7Cu2Fe will consume atoms from the α-Al matrix, thus decreasing the strengthening effect of Cu-related precipitates such as Al2Cu [35]. As previously presented (Figure 7), all the alloys investigated in this work show an average iron contamination of about 0.2 wt.%, which, associated with the peaks found by XRD analyses, suggests the formation of Al7Cu2Fe, which is in agreement with the prediction of the phase diagrams in Figure 3. Xu and coauthors [36] studied the evolution of Fe-rich IMCs and their effects on the mechanical properties of a 2219 Al-Cu alloy under different processing approaches. Alloys containing 0.03, 0.10, 0.15 and 0.20 wt.%Fe were analyzed. For Fe content less than 0.03 wt.%, Al2Cu was the main IMC observed. When the Fe amount increased to 0.10 wt.%, a new needle-like IMC appeared, either Al7Cu2Fe or Al7Cu2(Fe, Mn). The authors emphasized that the increase in Fe content did not change the morphology of IMCs, but they became longer and wider.
The peaks that suggest the formation of the Al4Cu9 IMC occurred at 48.17°, in the Al-33 wt.%Cu-0.05 wt.%Be alloy, and at 38.73° and 66.82°, in the Al-33 wt.%Cu-0.5 wt.%Be alloy. It is worth noting that the peak that occurred at 48.17° in the Al-33 wt.%Cu-0.05 wt.%Be alloy is more intense than that observed for the α-Al matrix, which can be related to a possible texturing of the sample. Karov and Youdelis [37] determined that the degree of solubility of beryllium in Al2Cu is in the range of 0.8–2.07 wt.%. These authors examined Al-Cu alloys with eutectic composition containing 0, 0.14, 0.3 and 0.5 wt.%Be. For alloys with 0.14 and 0.3 wt.%Be, only α-Al and Al2Cu phases were found, indicating that all the Be was absorbed by the Al2Cu IMC. The authors reported that the aluminum atoms were replaced with beryllium ones. However, the authors pointed out that the common fine lamellar microstructure of the eutectic became irregular and coarse with increasing beryllium content and a new phase within the Al2Cu regions was observed to occur, specifically in the alloy containing 0.5 wt.%Be. Moreover, in this work, the authors observed diffusion diffraction lines of the Al4Cu9 phase, identified as the Cu-rich phase in the Al-3Cu-0.1Be alloy. These results showed that, in these alloys, Be is concentrated in the precipitated phases. In this work, the observed peaks, associated with the high solubility of Be in Cu-rich phases, suggest the formation of the Al4Cu9 phase.
It is worth noting that no peaks of IMC phases containing Be were observed, although expected in the pseudo-binary phase diagrams (Figure 3) and in the solidification paths based on the Scheil–Gulliver (S–G) model (Figure 10), which assumes nonequilibrium conditions that are complete diffusion in the liquid and no diffusion in the solidified phases. Amirkhanlou [38] reported that the distribution of a Be-rich phase in the Al matrix depends on the relative amounts of Be and on the processing method. Bodwen [39] found fine dispersions of Be phase in the Al matrix of samples processed by powder metallurgy, due to the high amount of Be in the Al-63%Be eutectic alloy. In this work, the α-Be phase is expected to occur in the alloy with 0.05%Be only at the end of solidification (~544 °C, Figure 10a), probably with the remaining liquid achieving eutectic transformation with a tiny amount of α-Be being part of the eutectic mixture. On the other hand, in the alloy with 0.5%Be, α-Be arises as the primary phase, i.e., at the beginning of solidification. In the alloy with 0.5% Be, the practically vertical green line of Figure 10b indicates a low amount of α-Be, similarly as Al7Cu2Fe, when compared to the other phases. It worth noting that increasing the beryllium content the solidification interval associated with the formation of Al7Cu2Fe decreases, as shown comparatively by the red line lengths in Figure 10a,b. This decrease in the solidification range can also be realized in Figure 3b, due to the existence of the two-phases zone (L+α-Be) in L+ Al7Cu2Fe that was absent in Figure 3a. Thus, in both alloys, α-Be appears in small amount, which may make its detection through XRD unfeasible. Although the S–G model considers nonequilibrium solidification, it is worth bearing in mind that the water-cooled mold can shift solidification to a condition much further than that considered by the S–G model, undermining or suppressing the α-Be phase. Next, a complementary discussion involving SEM-EDS analysis on the α-Be phase is conducted.
SEM-EDS analyses on transverse sections of Al-33 wt.%Cu-0.05 wt.%Be and Al-33 wt.%Cu-0.5 wt.%Be alloys (P = 70 mm) are presented in Figure 11a,b, respectively. It can be seen that Be is not detected in any analyzed region. Some well-known characteristics of Be are its low atomic number (Z = 4), low relative atomic mass (A = 9.012) and low density (ρ = 1.85 g/cm³). Beryllium presents a very low fluorescence yield, which makes the emission of Auger electrons more likely than the emission of characteristic X-rays, which can easily be absorbed by the surface layers and the contaminations on the surface. Such attributes make the detection of Be, using the EDS technique, very difficult [40]. Characterizing Be-containing phases is reported as challenging in the literature [40], mainly for Be-diluted alloys and to the best of the present authors’ knowledge, this task has not been successfully accomplished in related works. The EDS analysis for the alloy with 0.05wt.%Be shows in point #1, that the amount of Cu in solid solution is about the expected value for the Al-Cu binary system [41]. The same can be observed for point #2 (Al2Cu) and point #3 (eutectic mixture). Considering the EDS analysis for the alloy with 0.5%wt.%Be, the composition of the α-Al matrix (point #4) remained mostly the same as that of point#1, as well as for the Al2Cu phase (point #5). Point #6 represents the Al4Cu9 phase with a faceted morphology curiously located inside the Al2Cu phase. The ratio between at.% Cu and Al at point#6 may not follow 9:4, probably due to interference from what is beneath the analyzed area, which is a common issue in the Energy Dispersive X-ray spectroscopy technique. Figure 12 shows the same SEM image of the Al-33 wt.%Cu-0.05 wt.%Be alloy (Figure 12a), but with its respective EDS elemental maps. The maps present the elemental distribution of Cu, Al, Fe and Be elements in the α-Al, eutectic and the Al7Cu2Fe phases. Beryllium seems homogeneously distributed throughout the sample and the iron distribution demonstrates that the Al7Cu2Fe phase has needle-like and non-elongated morphologies, although reported as plate-like by Zhao [32], which may cause deleterious effects on the mechanical properties, similarly as the β-AlFeSi in Fe contaminated Al-Si alloys [42,43].
Figure 13 schematically suggests the nucleation and growth of the observed phases for the three analyzed alloys. Considering the eutectic binary alloy without Be addition, the transient solidification conditions favored the nucleation and growth of eutectic colonies surrounded by the same eutectic mixture rather coarser. The tiny addition of 0.05 wt.% Be seems to be responsible for modifying the anisotropic interface of the eutectic colonies, transforming the original cell-like morphology into a trefoil-like one. Observing the phase diagram (Figure 3a), the expected α-Al primary phase, as previously discussed, is not favored in the microstructure (Figure 5 and Figure 6) instead of the eutectic phase, which may nucleate and grow preferentially. Thus, in the eutectic mixture, atoms of Al may have been replaced by Be, as previously mentioned by Karov and Youdelis [37]. In addition, considering that Be has a different crystal structure as compared to Al and Cu, i.e., HCP instead of FCC [44]. The gradual replacement of Al atoms by Be may have induced the growth of a trefoil morphology. In addition, considering the interfacial energy anisotropy on the phase morphology could be performed as an attempt to respond the influence of Be, as shown in the literature concerning the influence of Zn on the dendrite morphology of Al-Zn alloys [45]. With the increase in the addition of Be to 0.5 wt.%, the phase diagram (Figure 3b) predicts a primary α-Be phase, which was not found. Instead, the formation of primary phases of θ-Al2Cu and Al4Cu9 occurred. It seems that the higher Be content, associated with nonequilibrium conditions, induced the formation of AlxCuy type primary phases. The trefoil-like morphology observed in both alloys, with 0.05 and 0.5 wt%. Be, seems to indicate that Be has been incorporated into the phases. Be constituting other IMCs is favored as compared to the formation of the α-Be phase, as reported in the literature, such as: Al8Fe2SiBe [46], Al92Mn4Be2Cu2 [40] and Be4Al(Mn,Cu) [24]. An exception is the formation of a fine eutectic, i.e., without a trefoil morphology around the primary phases that may have served as a nucleating agent, as can be seen in Figure 5 for the alloy with 0.5%Be. It was curious to observe that in some regions, as shown in Figure 10b, the Al4Cu9 IMC played the role of a nucleating agent for the Al2Cu IMC. Additionally, the Al7Cu2Fe IMC was shown to have two morphologies (needle-like and non-elongated) in the alloys with additions of Be although it was reported in in a previous study [19] that the Al7Cu2Fe IMC has only the non-elongated morphology.

3.7. Hardness

Figure 14 presents the Vickers hardness (HV) of Al-33 wt.%Cu, Al-33 wt.%Cu-0.05 wt.%Be and Al-33 wt.%Cu-0.5 wt.%Be alloys as a function of λEC/ λ1. A Hall–Petch-type equation has been fitted to most of the experimental scatter only for the alloy without Be, in which HV increases along the lower range of cellular spacings due to the more homogeneous distribution of the eutectic mixture throughout the alloy microstructure. For the range of λEC−1/2/ λ1−1/2 values below 0.15 μm−1/2, λEC and λ1 are shown not to affect HV for any alloy examined. On the other hand, the decrease in HV indicates that the addition of Be has the beneficial effect of improving the brittle behavior of the Al-33%Cu alloy, even with the formation of the Al4Cu9 IMC, which has HV of about two times higher than that of the Al2Cu IMC (Table 3). Both tensile strength and hardness are indicators of the mechanical strength of the metal to plastic deformation. When the strength (and hardness) increases, normally the ductility, which is a measure of the degree of plastic deformation developed by the material until fracture, is sacrificed resulting in brittle behavior, which involves very little or no plastic deformation. Thus, hardness is inversely related to ductility [44]. Hence, the decrease in HV provided by the addition of Be improves the brittle behavior of the Al-33%Cu alloy.

4. Conclusions

The directionally solidified microstructures were shown to be formed by eutectic colonies for the Al-33 wt.%Cu alloy, and dendrites with a trefoil morphology, in Al-33 wt.%Cu-0.05 wt.%Be and Al-33 wt.%Cu-0.5 wt.%Be alloys. The secondary dendritic arms are evident in alloys containing beryllium, but they are not observed in the Al-Cu eutectic binary alloy.
The primary dendritic arm spacing (λ1), the eutectic colony spacing (λEC), the lamellar spacing (λL) and the secondary dendritic arm spacing (λ2) were correlated with the solidification cooling rate (Ṫ), and the growth rate (V) and the following experimental growth laws were derived:
λEC = 132 Ṫ−0.25 and λEC = 80 V−0.50 for the Al-33 wt.%Cu-0.05 wt.%Be alloy
λ2 = 22 Ṫ−1/3 and λ2 = 11 V−2/3
λ1 = 132 Ṫ−0.55 and λ1 = 24 V−1.10, for the Al-33 wt.%Cu-0.5 wt.%Be alloy
λ2 = 15 Ṫ−1/3 and λ2 = 5 V−2/3
where λEC/ λ1/ λ2 (µm); Ṫ (K/s) and V (mm/s).
For the Al-33 wt.%Cu alloy, the transient solidification conditions favored the nucleation and growth of eutectic colonies surrounded by a coarser eutectic mixture. The tiny addition of 0.05 wt.%Be was shown to be responsible for modifying the anisotropic interface of the eutectic colonies, transforming the original cell-like morphology into a trefoil-like one. Such trefoil-like morphology was shown to occur for both alloys, with 0.05 and 0.5 wt% Be, seeming to indicate that Be has been incorporated into the phases.
A Hall–Petch-type equation has been fitted to most of the experimental hardness scatter only for the alloy without Be, in which HV was shown to increase in the lower range of λEC. For the range of λEC1/2/ λ11/2 values below 0.15 μm1/2, λEC and λ1 were shown not to affect HV for any alloy examined. In contrast, the addition of Be was shown to have the beneficial effect of improving the brittle behavior of the Al-33%Cu alloy.

Author Contributions

Formal analysis, A.V.R., R.K., C.S., L.G., M.D. and N.C.; Methodology, A.V.R., R.K. and C.S.; Writing—original draft, A.V.R., R.K., C.S. and N.C.; Writing—review and editing, H.H., A.G. and N.C. All authors have read and agreed to the published version of the manuscript.

Funding

This study was financed in part by FAPESP-São Paulo Research Foundation, Brazil (Grant 2021/11439-0); CNPq-National Council for Scientific and Technological Development–CNPq, Brazil; CAPES-Coordenacão de Aperfeiçoamento de Pessoal de Nível Superior, Brazil (Finance Code 001); and FAEPEX/UNICAMP-Fundo de Apoio ao Ensino, à Pesquisa e à Extensão (grants 2162/21 and 2549/22).

Data Availability Statement

Not applicable.

Acknowledgments

This research used facilities of the Brazilian Nanotechnology National Laboratory (LNNano), part of the Brazilian Centre for Research in Energy and Materials (CNPEM), a private non-profit organization under the supervision of the Brazilian Ministry for Science, Technology, and Innovations (MCTI). The SEM–FIB staff is acknowledged for the assistance during the experiments (SEM–FIB–C1–20210595).

Conflicts of Interest

The authors declare no conflict of interest.

References

  1. Cantor, B.; Assender, H.; Grant, P. Aerospace Materials; CRC Press: Boca Raton, FL, USA, 2001. [Google Scholar]
  2. Kaufman, J.F.; Rooy, E.L. Aluminum Alloy Castings: Properties, Processes, and Applications; ASM International: Materials Park, OH, USA, 2004. [Google Scholar]
  3. Chen, H.-L.; Chen, Q.; Engström, A. Development and applications of the TCAL aluminum alloy database. Calphad 2018, 62, 154–171. [Google Scholar] [CrossRef]
  4. Deschamps, A.; Tancret, F.; Benrabah, I.-E.; De Geuser, F.; Van Landeghem, H.P. Combinatorial approaches for the design of metallic alloys. C. R. Phys. 2018, 19, 737–754. [Google Scholar] [CrossRef]
  5. Gloria, A.; Montanari, R.; Richetta, M.; Varone, A. Alloys for Aeronautic Applications: State of the Art and Perspectives. Metals 2019, 9, 662. [Google Scholar] [CrossRef] [Green Version]
  6. Dias, M.; Costa, T.; Rocha, O.; Spinelli, J.E.; Cheung, N.; Garcia, A. Interconnection of thermal parameters, microstructure and mechanical properties in directionally solidified Sn–Sb lead-free solder alloys. Mater. Charac. 2015, 106, 52–61. [Google Scholar] [CrossRef]
  7. Silva, C.; Barros, A.; Rodrigues, A.V.; Kakitani, R.; Soares, T.; Garcia, A.; Cheung, N. Microstructure and Tensile Strength of an Al-Si-Fe-V Alloy: Vanadium and Solidification Thermal Parameters as Recycling Strategies. Sustainability 2022, 14, 13859. [Google Scholar] [CrossRef]
  8. Kakitani, R.; Konno, C.; Garcia, A.; Cheung, N. The Effects of Solidification Cooling and Growth Rates on Microstructure and Hardness of Supersaturated Al-7%Si-x%Zn Alloys. J. Mater. Eng. Perform. 2022, 31, 1956–1970. [Google Scholar] [CrossRef]
  9. Septimio, R.S.; Costa, T.A.; Silva, C.A.P.; Vida, T.A.; Damborenea, J.; Garcia, A.; Cheung, N. Correlation between unsteady-state solidification thermal parameters and microstructural growth of Zn–8 mass% Al and Zn–8 mass% Al–XBi tribological alloys. J. Therm. Anal. Calorim. 2020, 139, 1741–1761. [Google Scholar] [CrossRef]
  10. Duarte, R.N.; Faria, J.D.; Brito, C.; Veríssimo, N.C.; Cheung, N.; Garcia, A. Length scale of the dendritic microstructure affecting tensile properties of Al–(Ag)–(Cu) alloys. Int. J. Mod. Phys. B 2016, 30, 1550261. [Google Scholar] [CrossRef]
  11. Rodrigues, A.V.; Lima, T.S.; Vida, T.A.; Brito, C.; Garcia, A.; Cheung, N. Microstructure and Tensile/Corrosion Properties Relationships of Directionally Solidified Al-Cu-Ni Alloys. Met. Mater. Int. 2018, 24, 1058–1076. [Google Scholar] [CrossRef]
  12. Ferreira, I.L.; Garcia, A.; Nestler, B. On Macrosegregation in Ternary Al-Cu-Si Alloys: Numerical and Experimental Analysis. Scr. Mater. 2004, 50, 407–411. [Google Scholar] [CrossRef]
  13. Bertelli, F.; Freitas, E.S.; Cheung, N.; Arenas, M.A.; Conde, A.; Damborenea, J.; Garcia, A. Microstructure, tensile properties and wear resistance correlations on directionally solidified Al-Sn-(Cu; Si) alloys. J. Alloys Compd. 2017, 695, 3621–3631. [Google Scholar] [CrossRef]
  14. Houska, C. Beryllium in Aluminum and Magnesium alloys. Met. Mater. 1988, 4, 100–104. [Google Scholar]
  15. Karov, J.; Youdelis, W.V. Precipitation in Al–3Cu–0·1Be. Mater. Sci. Technol. 1987, 3, 1–6. [Google Scholar] [CrossRef]
  16. Yuan, Z.; Guoa, Z.; Xiong, S.M. Effect of as-cast microstructure heterogeneity on aging behavior of a high-pressure die-cast A380 alloy. Mater. Charact. 2018, 135, 278–286. [Google Scholar] [CrossRef]
  17. Çadırlı, E.; Nergiz, E.; Kaya, H.; Büyük, U.; Şahin, M.; Gündüz, M. Effect of growth velocity on microstructure and mechanical properties of directionally solidified 7075 alloy. Int. J. Cast Metal. Res. 2020, 33, 11–23. [Google Scholar] [CrossRef]
  18. Gündüz, M.; Çadirli, E. Directional Solidification of Aluminium-Copper Alloys. Mater. Sci. Eng. A 2002, 327, 167–185. [Google Scholar] [CrossRef]
  19. Kakitani, R.; Gouveia, G.L.; Garcia, A.; Cheung, N.; Spinelli, J.E. Thermal analysis during solidification of an Al–Cu eutectic alloy: Interrelation of thermal parameters, microstructure and hardness. J. Therm. Anal. Calorim. 2019, 137, 983–996. [Google Scholar] [CrossRef]
  20. Jafari, H.; Amiryavari, P. The effects of zirconium and beryllium on microstructure evolution, mechanical properties and corrosion behaviour of as-cast AZ63 alloy. Mater. Sci. Eng. A 2016, A654, 161–168. [Google Scholar] [CrossRef]
  21. Rodrigues, A.V.; Kakitani, R.; Oliveira, R.; Barros, A.; Brito, C.; Garcia, A.; Cheung, N. Two-Phase Dendrite and Bimodal Structure in an Al-Cu-Ni Alloy: Their Roles in Hardness. J. Mater. Eng. Perform. 2022, 31, 3704–3715. [Google Scholar] [CrossRef]
  22. Grandfield, J.; Eskin, D.G.; Bainbridge, I. Direct-Chill Casting of Light Alloys: Science and Technology; Wiley: New York, NY, USA, 2013; pp. 144–254. [Google Scholar]
  23. Rocha, O.L.; Siqueira, C.A.; Garcia, A. Heat Flow Parameters Affecting Dendrite Spacings during Unsteady-State Solidification of Sn-Pb and Al-Cu Alloys. Metall. Mater. Trans. A 2003, 34A, 995–1006. [Google Scholar] [CrossRef] [Green Version]
  24. Rozman, N.; Medved, J.; Zupanic, F. Microstructural evolution in Al-Mn-Cu-(Be) alloys. Philos. Mag. 2011, 91, 4230–4246. [Google Scholar] [CrossRef]
  25. Barros, A.; Cruz, C.; Garcia, A.; Cheung, N. Corrosion behavior of an Al-Sn-Zn alloy: Effects of solidification microstructure characteristics. J. Mater. Res. Technol. 2021, 12, 257–263. [Google Scholar] [CrossRef]
  26. Kakitani, R.; Cruz, C.B.; Lima, T.S.; Brito, C.; Garcia, A.; Cheung, N. Transient directional solidification of a eutectic Al-Si-Ni alloy: Macrostructure, microstructure, dendritic growth and hardness. Materialia 2019, 7, 100358. [Google Scholar] [CrossRef]
  27. Brito, C.; Costa, T.A.; Vida, T.A.; Bertelli, F.; Cheung, N.; Spinelli, J.E.; Garcia, A. Characterization of Dendritic Microstructure, Intermetallic Phases, and Hardness of Directionally Solidified Al-Mg and Al-Mg-Si Alloys. Metall. Mater. Trans. A 2015, 46A, 3342–3355. [Google Scholar] [CrossRef]
  28. Kakitani, R.; Reyes, R.V.; Garcia, A.; Spinelli, J.E.; Cheung, N. Relationship between spacing of eutectic colonies and tensile properties of transient directionally solidified Al-Ni eutectic alloy. J. Alloys Compd. 2018, 733, 59–68. [Google Scholar] [CrossRef]
  29. Silva, C.A.P.; Kakitani, R.; Canté, M.V.; Brito, C.; Garcia, A.; Spinelli, J.E.; Cheung, N. Microstructure, phase morphology, eutectic coupled zone and hardness of Al-Co alloys. Mater. Charact. 2020, 169, 110617. [Google Scholar] [CrossRef]
  30. Jackson, K.A.; Hunt, J.D. Binary Eutectic Solidification. Trans. Met. Soc. AIME 1966, 6, 843–852. [Google Scholar]
  31. Wilde, J.D.; Froyen, L. Two-phase planar and regular lamellar coupled growth along the univariant eutectic reaction in ternary alloys: An analytical approach and application to the Al–Cu–Ag system. J. Appl. Phys. 2005, 97, 113515. [Google Scholar] [CrossRef]
  32. Zhao, Y.; Zhang, W.; Yang, C.; Zhang, D.; Wang, Z. Effect of Si on Fe-rich intermetallic formation and mechanical properties of heat-treated Al-Cu-Mn-Fe alloys. J. Mater. Res. 2018, 33, 898–911. [Google Scholar] [CrossRef] [Green Version]
  33. Payne, J.; Welsh, G.; Christ, R.J., Jr.; Nardiello, J.; Papazian, J.M. Observations of fatigue crack initiation in 7075-T651. Int. J. Fatigue 2010, 32, 247–255. [Google Scholar] [CrossRef]
  34. Birbilis, N.; Cavanaugh, M.K.; Buchheit, R.G. Electrochemical behavior and localized corrosion associated with Al7Cu2Fe particles in aluminum alloy 7075-T651. Corros. Sci. 2006, 48, 4202–4215. [Google Scholar] [CrossRef]
  35. Jiang, N.; Gao, X.; Zheng, Z. Microstructure evolution of aluminum-lithium alloy 2195 undergoing commercial production. Trans. Nonferrous Met. Soc. China 2010, 20, 740–745. [Google Scholar] [CrossRef]
  36. Xu, D.; Zhu, C.; Xu, C.; Chen, K. Microstrutures and Tensile Fracture Behavior of 2219 Wrought Al-Cu Alloys with Different Impurity of Fe. Metals 2021, 11, 174. [Google Scholar] [CrossRef]
  37. Karov, J.; Youdelis, W.V. Solubility of beryllium in CuAl2. Mater. Sci. Technol. 1987, 3, 394–395. [Google Scholar] [CrossRef]
  38. Amirkhanlou, S.; Ji, S. Casting lightweight stiff aluminum alloys: A review. Crit. Rev. Solid State Mater. Sci. 2019, 45, 171–186. [Google Scholar] [CrossRef]
  39. Bowden, D.; Pokross, C.; Kaczynski, D.; London, G.; Starke, E.A.; Sanders, T.H.; Cassada, W.A. Characterization of aluminium-beryllium alloy sheet. Mater. Sci. Forum 2000, 331–337, 901–906. [Google Scholar] [CrossRef]
  40. Zupanič, F. Extracting electron backscattering coefficients from backscattered electron micrographs. Mater. Charact. 2010, 61, 1335–1341. [Google Scholar] [CrossRef]
  41. Okamoto, H. Supplemental Literature Review of Binary Phase Diagrams: Ag-Ni, Al-Cu, Al-Sc, C-Cr, Cr-Ir, Cu-Sc, Eu-Pb, H-V, Hf-Sn, Lu-Pb, Sb-Yb, and Sn-Y. J. Phase Equilib. Diffus. 2013, 34, 493–505. [Google Scholar] [CrossRef]
  42. Kaiser, M.S.; Sabbir, S.H.; Kabir, M.S.; Soummo, M.R.; Al Nur, M. Study of Mechanical and Wear Behaviour of Hyper-Eutectic Al-Si Automotive Alloy Through Fe, Ni and Cr Addition. Mater. Res. 2018, 21. [Google Scholar] [CrossRef] [Green Version]
  43. Silva, C.; Barros, A.; Vida, T.; Garcia, A.; Cheung, N.; Reis, D.A.P.; Brito, C. Assessing Microstructure Tensile Properties Relationships in Al-7Si-Mg Alloys via Multiple Regression. Metals 2022, 12, 1040. [Google Scholar] [CrossRef]
  44. Callister, W.D.; Rethwisch, D.G. Materials Science and Engineering: An Introduction, 8th ed.; Wiley: New York, NY, USA, 2009. [Google Scholar]
  45. Zhao, Y.; Liu, K.; Hou, H.; Chen, L.-Q. Role of interfacial energy anisotropy in dendrite orientation in Al-Zn alloys: A phase field study. Mater. Des. 2022, 216, 110555. [Google Scholar] [CrossRef]
  46. Wang, Y.; Xiong, Y. Effects of beryllium in Al-Si-Mg-Ti cast alloy. Mater. Sci. Eng. A 2000, 280, 124–127. [Google Scholar] [CrossRef]
Figure 1. Schematic representation of the water-cooled upward directional solidification apparatus.
Metals 13 00094 g001
Figure 2. Schematic representation of samples extraction and of measurement methods used to quantify the length scale of the dendritic microstructure: λ1 is primary dendritic arm spacing, λ2 is secondary dendritic arm spacing, λEC is eutectic colony spacing, λL is lamellar spacing, ‘L’ is the length of the line and ‘n’ is the number of intercepted phases.
Metals 13 00094 g002
Figure 3. Partial pseudo-binary phase diagram Al-33 wt.%Cu-0.2 wt.%Fe−xBe with dashed lines indicating the compositions of the analyzed alloys (a) Al-33 wt.%Cu-0.2 wt.%Fe−0.05 wt.%Be and (b) Al-33 wt.%Cu-0.2 wt.%Fe−0.5 wt.%Be (Thermo-Calc 2021b, TCAL8 database).
Metals 13 00094 g003
Figure 4. (a) Cooling rate and (b) growth rate as functions of position from metal/mold interface for Al-33 wt.%Cu date from [19], Al-33 wt.%Cu-0.05 wt.%Be and Al-33 wt.%Cu-0.5 wt.%Be alloys.
Metals 13 00094 g004
Figure 5. Transverse SEM images of Al-33 wt.%Cu, Al-33 wt.%Cu-0.05 wt.%Be and Al-33 wt.%Cu-0.5 wt.%Be alloys under different cooling rates (3.8 °C/s and 0.6 °C/s).
Metals 13 00094 g005
Figure 6. Longitudinal images obtained by optical microscopy for Al-33 wt.%Cu, Al-33 wt.%Cu-0.05 wt.%Be and Al-33 wt.%Cu-0.5 wt.%Be alloys solidified under a cooling rate of 1.6 °C/s. The red line contour delimitates secondary arms of a dendritic morphology.
Metals 13 00094 g006
Figure 7. Cu and Fe (residual) distribution along the length of Al-33 wt.%Cu data from [19], Al-33 wt.%Cu-0.05 wt.%Be and Al-33 wt.%Cu-0.5 wt.%Be DS castings.
Metals 13 00094 g007
Figure 8. Eutectic colony/primary dendritic spacing, λEC1, as a function of (a) Ṫ and (b) V, lamellar spacing, λL, as a function of (c) Ṫ and (d) V and secondary dendritic spacing, λ2, as a function of (e) Ṫ and (f) V for Al-33 wt.%Cu data from [19], Al-33 wt.%Cu-0.05 wt.%Be and Al-33 wt.%Cu-0.5 wt.%Be alloys.
Metals 13 00094 g008
Figure 9. XRD patterns at four different positions (P), chosen by similarity of Ṫ values, in the (a) Al-33 wt.%Cu, (b) Al-33 wt.%Cu-0.05 wt.%Be and (c) Al-33 wt.%Cu-0.5 wt.%Be alloys.
Metals 13 00094 g009
Figure 10. Solidification paths of (a) Al-33 wt.%Cu-0.05 wt.%Be and (b) Al-33 wt.%Cu-0.5 wt.%Be alloys simulated by the Thermo-Calc software based on the Scheil–Gulliver model.
Metals 13 00094 g010
Figure 11. Elemental SEM-EDS analyses in transverse sections of the (a) Al-33 wt.%Cu-0.05 wt.%Be and (b) Al-33 wt.%Cu-0.5 wt.%Be alloys (P = 70 mm).
Metals 13 00094 g011
Figure 12. SEM image with EDS mapping detailing the phases present in the Al-33 wt.%Cu-0.05 wt.%Be alloy.
Metals 13 00094 g012
Figure 13. Schematic representation of the mechanism proposed to explain the microstructural changes promoted by beryllium in the Al-33 wt.%Cu alloy.
Metals 13 00094 g013
Figure 14. Vickers hardness of Al-33 wt.%Cu data from [19], Al-33 wt.%Cu-0.05 wt.%Be and Al-33 wt.%Cu-0.5 wt.%Be alloys as a function of λEC−1/21−1/2.
Metals 13 00094 g014
Table 1. Chemical compositions (wt.%) of the elements and of the Cu-Be master alloy used in the preparation of the alloys.
Element/Master AlloyAlSiMgCuFePbZnNiSnMnCoBe
AlBal.0.0060.00110.010.0730.0060.005-----
Cu---Bal.---0.0080.0090.008--
Cu-Be0.0290.097-Bal.0.0530.0028-0.01--0.0149.83
Table 2. Beryllium content (wt.%) in Al-33 wt.%Cu-0.05 wt.%Be and Al-33 wt.%Cu-0.5 wt.%Be alloys.
Alloy%Be
Al-33wt.%Cu-0.05wt.%Be0.055 ± 0.02
Al-33wt.%Cu-0.5wt.%Be0.60 ± 0.01
Table 3. Vickers hardness of θ-Al2Cu and Al4Cu9 IMCs.
PhaseHV0.05 (HV)
θ-Al2Cu397 ± 61
Al4Cu9824 ± 46
Disclaimer/Publisher’s Note: The statements, opinions and data contained in all publications are solely those of the individual author(s) and contributor(s) and not of MDPI and/or the editor(s). MDPI and/or the editor(s) disclaim responsibility for any injury to people or property resulting from any ideas, methods, instructions or products referred to in the content.

