
The Influence of Interfacial Thermal Conductance on the Tensile Strength of a Sn-Mg Solder Alloy

1
Department of Production Engineering, Federal University of Ouro Preto—UFOP, João Monlevade 35931-008, MG, Brazil
2
Department of Manufacturing and Materials Engineering, University of Campinas—UNICAMP, Campinas 13083-860, SP, Brazil
*
Author to whom correspondence should be addressed.
Metals 2023, 13(11), 1813; https://doi.org/10.3390/met13111813
Submission received: 2 October 2023
/
Revised: 25 October 2023
/
Accepted: 25 October 2023
/
Published: 27 October 2023
Abstract
:Sn-Mg alloys are potential Pb-free solder options. However, their mechanical strength and interfacial characteristics with electronic substrates remain barely understood. This study focuses on the interfacial heat transfer aspects, microstructure, and tensile strength of a Sn-2.1wt.%Mg alloy. Samples with various thermal histories were produced using a directional solidification apparatus. In these experiments, a Sn-2.1wt.%Mg alloy was solidified on Cu and Ni substrates, which are of interest in the electronics industry. Mathematical modeling was then employed, allowing for the determination of the overall and interfacial heat transfer coefficients (hov, and hi, respectively). The results show that the Ni substrate exhibits higher interfacial thermal conductance with the Sn-2.1wt.%Mg alloy compared to the Cu substrate, as indicated by the higher hi profiles. This fact occurs mainly due to their metallurgical interaction, resulting in a stronger bond with the presence of Sn-Ni-rich intermetallics at the interface. Finally, experimental equations based on the Hall–Petch relationship are proposed to describe how the refinement of the fibrous spacing of the Mg2Sn interphase (λG) and an increase in hi enhance both yield and ultimate tensile strengths.
1. Introduction
The continuous demand for miniaturized solder joints is of prime importance, particularly in fields such as advanced packaging and microsystem technologies. This demand highlights the crucial need to ensure the reliability and performance of solder materials for interconnecting and packaging electronic components and circuits [1,2,3]. Historically, Sn-Pb alloys have been the most successful solder materials on electronic boards, especially due to their low melting temperature, affordability, and excellent wettability [4]. However, environmental regulations in Europe, Asia, and the Americas imposed restrictions on the use of Pb because of its adverse effects on the environment and human health [5,6]. Consequently, the industry has been under an imperative to discontinue the use of Pb-containing solder materials [7]. In this context, where the development of Pb-free solder alloys has gained significant relevance and directly impacts practical applications, finding a proper balance between production cost and thermomechanical properties has proven to be quite challenging for new solder alloys [8,9].
Previous studies have contributed significantly by proposing new Sn-based alloys as potential alternatives to Sn-Pb alloys [10,11,12,13]. Particularly, the Sn-Ag, Sn-Ag-Cu, and Sn-Cu [wt.%] alloys seem to be the most promising choices for mechanical strength and electrical properties [14,15,16]. In recent years, the addition of Mg has emerged as a promising strategy to enhance the performance of these alloys. Tan et al. [17] conducted a comprehensive study on the impact of Mg addition on the microstructure and properties of Sn-3Ag-5Cu (wt.%) solder alloys. Their findings revealed that incorporating 0.1wt.% Mg effectively refines the primary Cu6Sn5 IMCs, reduces the thickness of the interfacial intermetallic compounds (IMCs) layer, and enhances the ductility at the solder joint’s interfacial layer. In addition, the introduction of Mg to the Sn-3Ag-5Cu (wt.%) solder alloy had a minimal impact on the electrical resistivity. On the other hand, Kim et al. [18] examined a Sn-Ag-Al composite solder alloy reinforced with Mg-multiwalled carbon nanotubes fabricated via powder metallurgy. They observed a significant decrease in the liquidus and solidus temperatures of the Sn-Ag-Al solder alloy due to Mg addition, accompanied by reduced electrical resistivity and improved wettability. In another study, Huang et al. [19] introduced Mg into a Sn-0.7Cu (wt.%) alloy, resulting in slightly coarser Sn dendrites and a 2 °C reduction in the melting point. Remarkably, the Sn-0.7Cu-0.01Mg (wt.%) alloy exhibited the lowest contact angles and the most extensive spreading areas.
Mg addition has positive effects on other Sn-based solder alloys as well. For instance, Huang et al. [20] observed that in Sn-Bi-Mg composite solders, the introduction of 0.4 wt.% Mg led to a 24.3% reduction in wetting angle and a 42.4% increase in spreading area. However, excessive Mg content tended to produce MgO on the Cu surface, negatively affecting wetting performance while having no significant impact on the melting point of Sn-58Bi solder. Incorporating Mg particles enhanced solder joint shear strength and reduced solder alloy microhardness. Chen et al. [21] examined the microstructure and properties of Sn58Bi/Ni solder joints modified by Mg particles on a Ni substrate. They found that Mg particles refined the microstructure of the Sn-58Bi solder, reducing the IMCs thickness at the interface. Using Sn58Bi-0.4Mg solder, the IMCs thickness decreased by 28.93%, and prismatic Ni3Sn4 particles became smaller and more evenly distributed. The Mg2Sn phase inhibited IMCs grain growth, significantly enhancing the joint mechanical properties. With 0.4wt%Mg, the joint strength reached a maximum of 37.91 MPa, that is, a 53.48% increase as compared to joints without Mg. Unfortunately, the high production cost of these commercial solder alloys may limit their application.
Sn-Mg alloys can offer cost-efficient production along with thermomechanical properties suitable for soldering applications. According to Meydaneri and Saatçi [22], the Sn-2.1wt.%Mg alloy exhibits a favorable combination of thermal and electrical conductivities, enabling its use in thermoelectric power generation, soldering, and various other applications. The microstructure of this alloy usually comprises a β-phase (Sn-rich) and Mg2Sn IMCs [23,24]. Although previous studies have focused on the microstructural evolution, hardness, and corrosion behavior of the eutectic Sn-2.1wt.%Mg alloy, a better understanding of its interactions with Cu and Ni is lacking. These two substrates are widely used in microelectronic devices and are recognized as relevant to electronic soldering [25,26]. It is worth mentioning that the transfer of heat across the molten solder/substrate interface during soldering processes is hindered by temperature disparities that result from imperfect interfacial contact [27]. In fact, the molten solder and substrate establish contact only at discrete points instead of the entire expected contact area because of the presence of interfacial air gaps [28]. The lack of this knowledge for the Sn-2.1wt.%Mg alloy represents a significant gap in the current literature.
Another topic that requires further exploration is how microstructural changes affect the mechanical strength of the Sn-Mg alloy. This is particularly significant because the distribution and size of Mg2Sn IMCs can play a key role in their final properties. Therefore, the primary objective of this study is to analyze the interfacial thermal conductance during the solidification of a Sn-2.1wt.%Mg eutectic alloy on Cu and Ni substrates. Furthermore, thermal variables inherent to the solidification process are associated with the fibrous spacing of the Mg2Sn interphase (λG). The tensile properties of the studied alloys are assessed with respect to the microstructural length scale and the interfacial heat transfer coefficient ().
2. Experimental
2.1. Solidification Experiments
The Sn-2.1wt.%Mg alloy studied here was prepared using commercial purity Sn and Mg, with their respective chemical compositions detailed in Table 1. This table also includes the chemical compositions of the commercially pure Cu and electrolytic nickel (Ni) that were used as substrates.
First, an amount of 2500 g of Sn was placed within a SiC crucible and positioned inside a muffle furnace for melting (Brasimet, Jundiaí, Brazil). The reason for preparing this significant amount of Sn is based on the dimensions of the mold, which can accommodate a volume of approximately 340 cm3. Subsequently, the stochiometric amount of Mg was added to the liquid Sn, and throughout this procedure, Ar was introduced to prevent the reactivity of Mg. Simultaneously, mechanical homogenization was applied to ensure the mixing of the alloy components. After that, the molten Sn-2.1wt.%Mg alloy was poured into a stainless-steel cylindrical mold situated within the casting chamber of a directional solidification apparatus. Additionally, Ar was introduced into the molten alloy for approximately 2 min immediately after it was poured into the mold to facilitate the removal of trapped gases. These specific steps were the only instances where Ar was used. It was considered unnecessary to employ an Ar atmosphere during melting and directional solidification because the relatively low casting temperatures involved made significant oxidation phenomena unlikely during these stages.
A stainless-steel mold with the following specifications was used: an internal diameter of 60 mm, a height of 120 mm, and a wall thickness of 5 mm. This mold was constructed by joining two AISI 310 stainless-steel half-cylindrical shells using M6 screws and nuts. To facilitate the casting’s removal and avoid Fe contamination, the inner surfaces of the stainless-steel mold was coated with an alumina-based refractory material before the alloy was poured.
As shown in Figure 1, the bottom part of the mold was designed to be interchangeable for easy alteration of alloy/substrate combinations. The substrates consisted of 3 mm thick sheets made of commercially pure Cu and electrolytic Ni (see Table 1). Additionally, the contact condition at the solder alloy/substrate interface was standardized by preparing the substrate surface with 1200-grit SiC abrasive paper, followed by air jet cleaning. Soldering flux was not used for either the Sn-Mg alloy/Cu or Sn-Mg alloy/Ni pairs.
A set of fine type J thermocouples, each with an outer diameter of 1.6 mm, was employed for the continuous monitoring of temperature. This monitoring occurred at various positions along the length of the casting. These thermocouples were linked via coaxial cables to a Lynx ADS1000 data logger system (Lynx, São Paulo, Brazil), which automatically recorded temperature–time data at a 5 Hz frequency, translating to a temperature reading every 0.2 s. Immediately after the thermocouple nearest to the substrate recorded a temperature of about 1.1 times higher than the eutectic temperature, the electric heaters were deactivated, and water flow at the bottom of the mold was initiated. To produce samples for microstructural analysis, two directional solidification experiments were conducted: one for the Sn-Mg/Ni couple and another for the Sn-Mg/Cu couple. An additional experiment was undertaken for the Sn-Mg/Ni couple with the purpose of extracting samples for tensile tests, given that this coupling resulted in the widest range of cooling rates, as explained later.
2.2. Calculation of Solidification Thermal Parameters
The thermal profiles, characterized over time (t), were employed to evaluate both the eutectic growth () and cooling rates () along the length of the casting. was determined by calculating the time derivative of a power function , with representing the position in the casting in relation to the cooling interface and teut denoting the time when the eutectic isotherm passed through the given position.
was determined using power law functions as well. Parabolic regression lines were used to represent the overall temperature–time data behavior within an extensive range encompassing the eutectic temperature (). A regression line was applied only if its coefficient of determination (R2) was higher than 0.9. The first derivative of each function was solved by inserting , which provided the value of .
2.3. Microstructural Analysis
To analyze the microstructure evolution of the DS Sn-2.1wt.%Mg alloy castings under various thermal histories, transverse and longitudinal samples were extracted from different positions along the length of the DS castings (from 5 to 70 mm in relation to the metal–mold interface) using an IsoMet 4000 precision cutter (Buehler, Esslingen, Germany), as shown in Figure 2. In total, 18 samples were extracted along the length of the DS castings for microstructural analysis, considering the Sn-Mg/Ni and Sn-Mg/Cu couples. These samples underwent metallographic procedures until their surfaces achieved a 1 µm finish, which was achieved by polishing using diamond paste. Images were collected using an Olympus GX41 compact inverted metallurgical microscope (Olympus, Tokyo, Japan) and a ZEISS EVO MA15 SEM (Zeiss Microscopy, Oberkochen, Germany), coupled to an Oxford X-Max model energy-dispersive X-ray spectrometer (EDS) (Zeiss Microscopy, Oberkochen, Germany). To identify the phases comprising the interfacial reaction layers, X-ray diffraction (XRD) analysis was conducted using a Panalytical X’Pert PRO MRD XL diffractometer equipped with a PIXcel detector. XRD patterns were recorded at room temperature over a range of 20° ≤ 2θ ≤ 100°, utilizing nickel-filtered Cu-Kα radiation (wavelength of λ = 1.5406 Å), a tube voltage of 45 kV, and a tube current of 40 mA. The ImageJ software (https://imagej.net/ij/) was used to measure the fibrous spacing of the Mg2Sn interphase (λG), with approximately 50 independent measurements performed for each transverse sample. These measurements were conducted using the triangle method on optical images of transverse samples [29], as shown in Figure 2.
2.4. Tensile Testing
Figure 2 shows a schematic representation of how samples subjected to tensile testing were extracted along the length of the DS casting that experienced the widest range of cooling rates. A total of 45 samples were extracted for conducting tensile tests, with 3 samples tested for each of the 15 considered positions along the length of the DS casting. This allowed for the analysis of how the Sn-2.1wt.%Mg alloy responded under different levels of microstructural refinement. The samples underwent tensile tests using an MTS 810-FlexTest 40 machine (MTS Systems, Eden Prairie, MN, USA), following the guidelines outlined in ASTM Standard E 8M/04 [30], with a strain rate of 10−3 mm s−1. The tensile tests were performed three times for each set of samples.
3. Modelling
This study employed an inverse heat conduction method during directional solidification to determine the interfacial heat transfer coefficient () between the Sn-2.1wt.%Mg alloy casting and the substrate (mold). It compared experimental cooling curves with simulated thermal profiles using an artificial intelligence (AI)-driven approach outlined by Silva-Santos et al. [31]. This approach involves the integration of an artificial immune system (AIS) into a numerical model of solidification. The primary objective of this integration is to address the inverse heat transfer problem (IHTP) by examining the transient directional solidification process, particularly with a focus on determining the overall interfacial heat transfer coefficient (). To achieve this, an optimized aiNet algorithm is linked to the numerical solidification model, necessitating a well-planned procedure for flexibility across various applications and efficient data communication to conserve computational resources. Dual algorithms were developed within the C++ programming language and compiled using the GNU GCC compiler. This procedure step is employed to optimize the search for candidates, which can generate simulated temperature profiles closely matching the experimental data from the thermocouples. This involved minimizing the difference between measured temperatures from thermocouples and theoretical temperatures calculated from the heat equation (Equation (1)) and a specified boundary condition (Equation (2)).
where = thermal conductivity [W m−1 K−1], = density [kg m−3], = temperature [K], and = specific heat [J kg−1 K−1]. and , in the case of the present work, correspond to the water and metal (alloy) temperatures [K], respectively. , which is the overall heat transfer coefficient [W m−2 K−1], can be defined as follows:
where = mold thickness [m], = interfacial heat transfer coefficient [W m−2 K−1], = mold thermal conductivity [W m−1 K−1], and = mold/cooling fluid heat transfer coefficient [W m−2 K−1].
Equations (1) and (2) were solved through discretization using the finite difference method, considering the latent heat release during solidification. This latent heat release is characterized by a temperature accumulation factor, λ, as described in Reference [32].
where L = latent heat. The thermophysical properties required for the simulations are provided in Table 2.
4. Results and Discussion
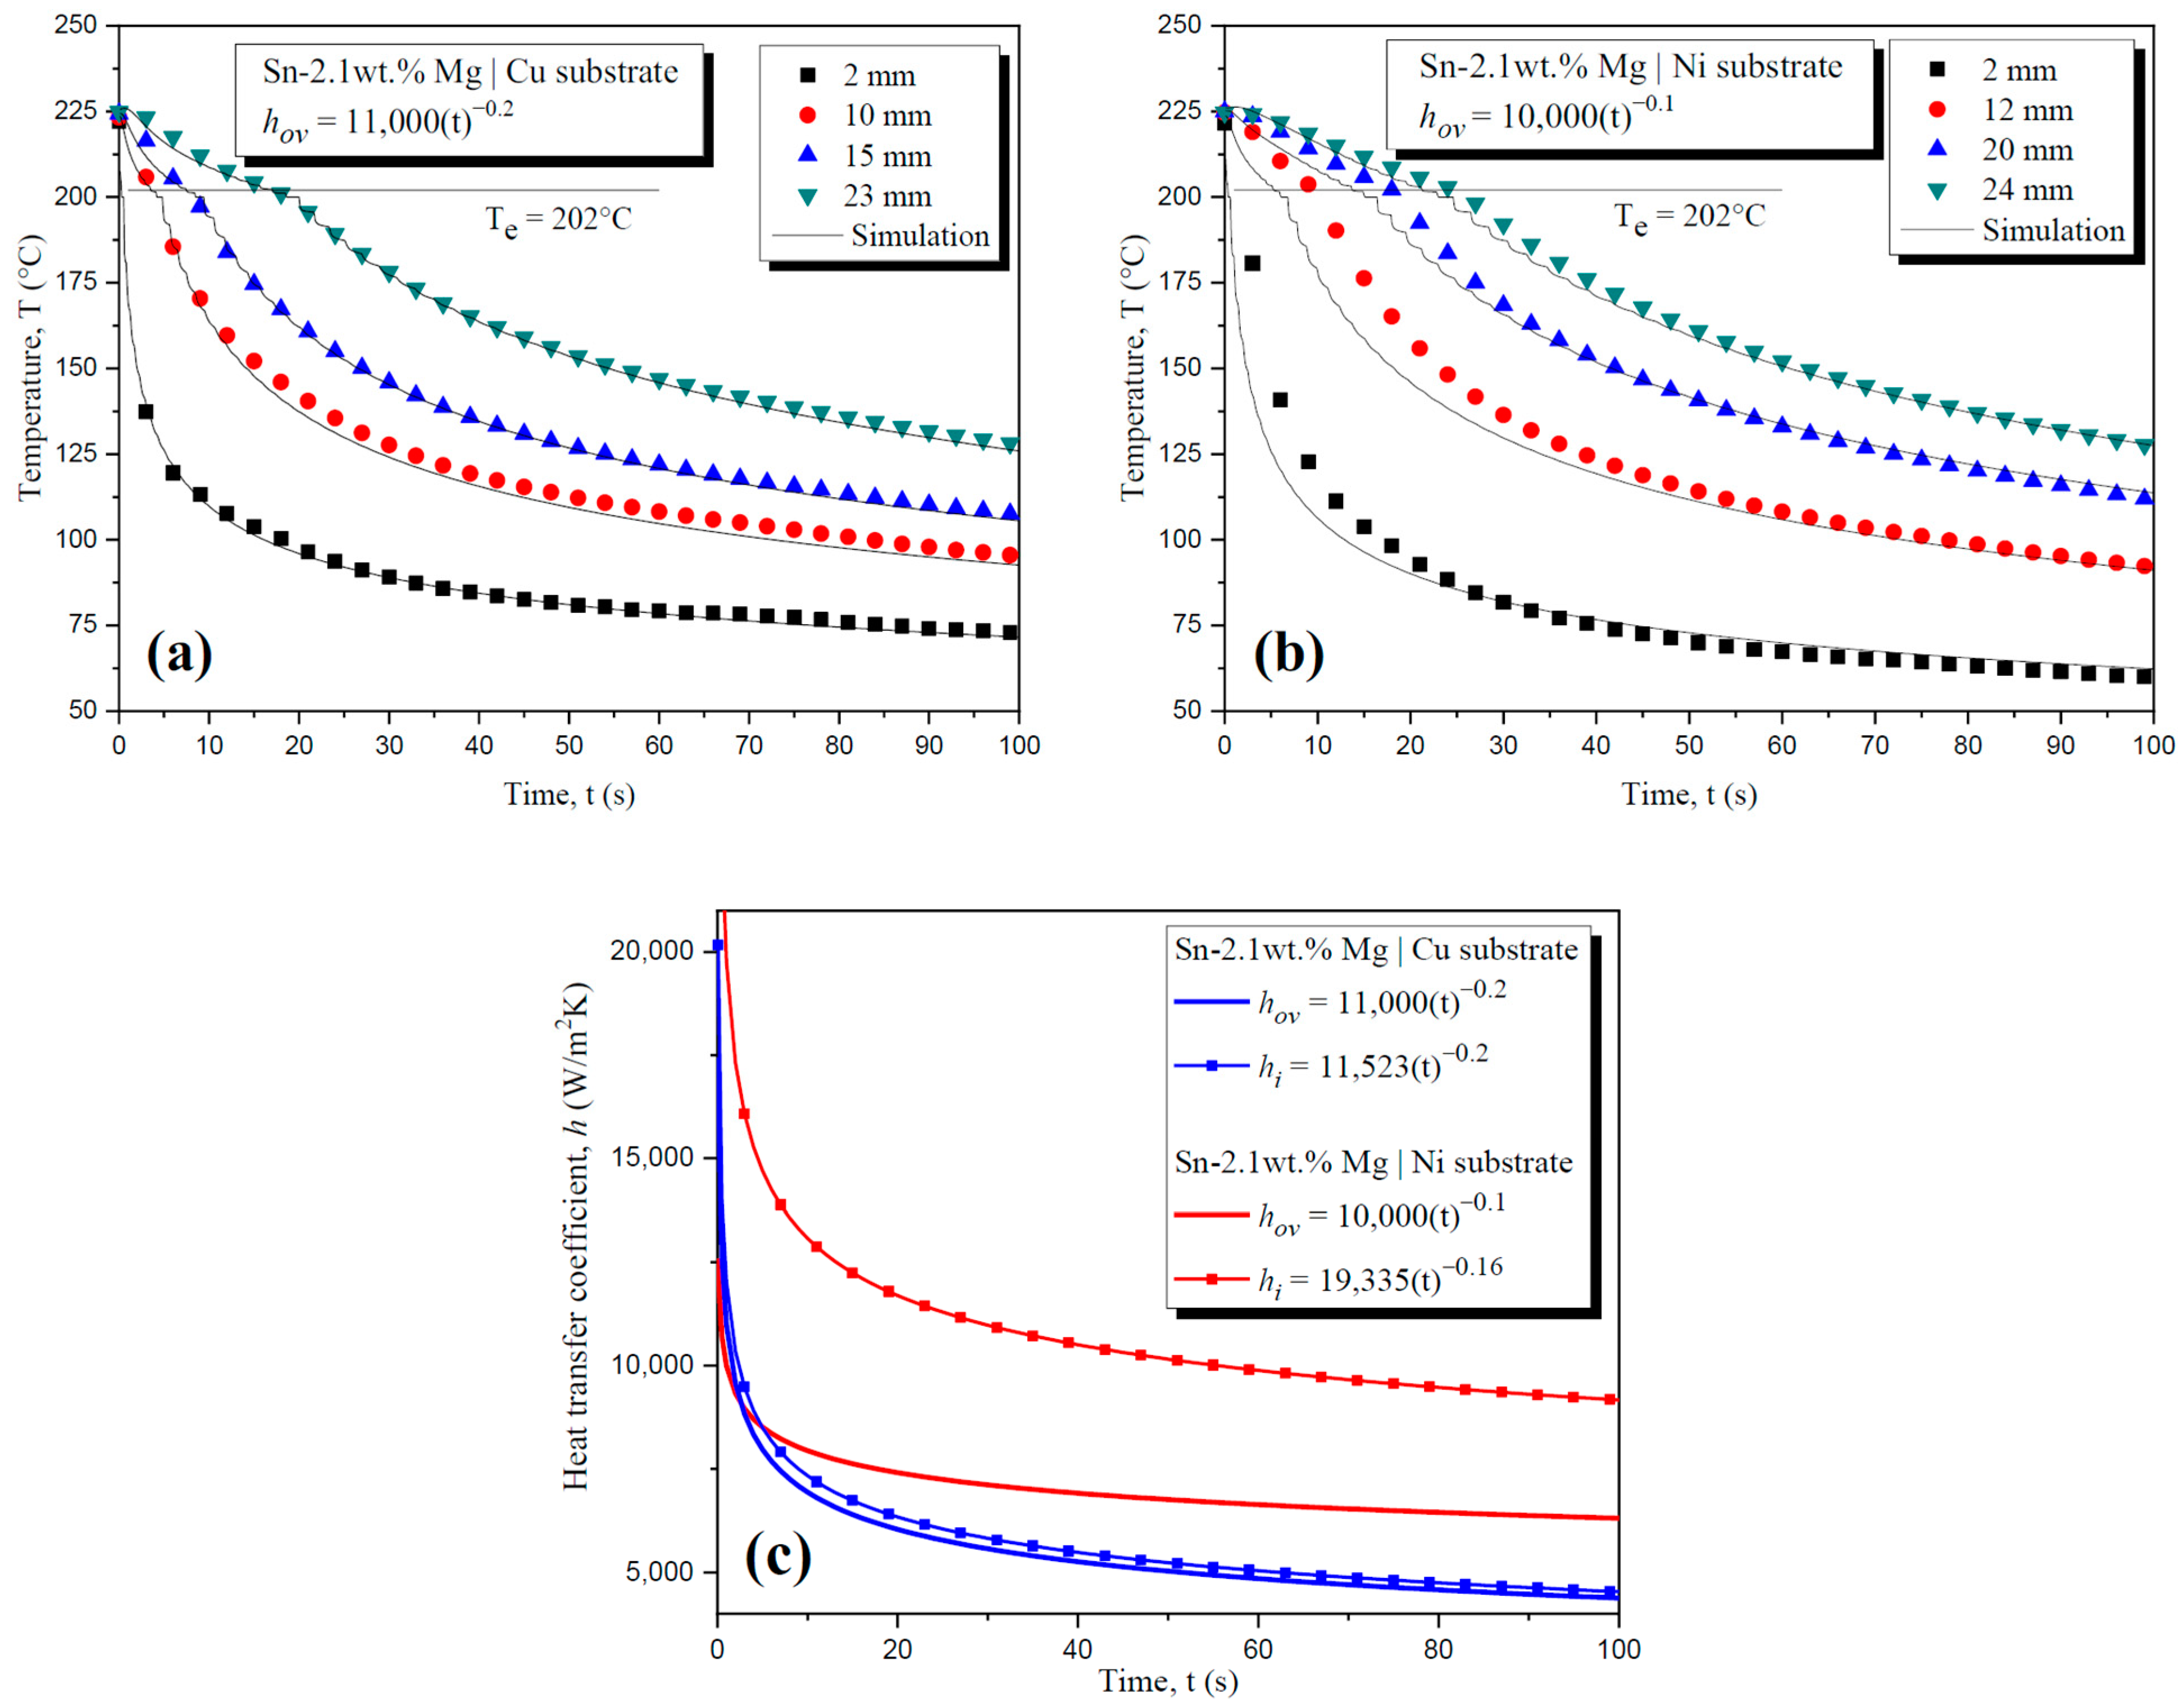
Figure 3a,b show the best match between simulations and experimental cooling curves registered along the length of the DS castings for the Sn-2.1wt.%Mg alloy solidified in Cu and Ni substrates, respectively. Notably, the Ni substrate promoted a higher profile when compared to the Cu substrate (Figure 3c). This behavior indicates that depends not only on the heat extraction characteristics of the substrate material but also on the interfacial heat transfer mechanisms.
In Figure 3c, it is evident that both equations, = f(t), share similar constant multipliers (~11,000 for Cu and ~10,000 for Ni), but they differ significantly in their negative exponents. The exponent associated with the Cu substrate is twice as large as that of Ni. This discrepancy implies that the profile in the Sn-Mg/Ni system experiences a slower rate of decay due to its lower negative exponent compared to the Sn-Mg/Cu system. As a result, the Sn-Mg/Ni system maintains higher values, thereby facilitating faster solidification through enhanced interfacial heat transfer. It can be assumed that the rate at which heat is transferred from the mold to the water remains constant or unchanged when Ni and Cu substrates are changed (same ). Additionally, the turbulent flow from the cooling water imposes high values of , which causes 1/ to tend toward zero. Therefore, can be determined as follows from Equation (3):
plays a key role in governing solidification, as it serves as a comprehensive indicator of the dynamics occurring at the metal/mold interface (Sn-2.1wt.%Mg alloy/substrate, in the present study). It is directly associated with critical aspects, such as the initial wetting behavior of the liquid metal upon contact with the mold. In addition, also involves the subsequent mismatch phenomena arising from the different material properties and distinct coefficients of thermal expansion/contraction between the alloy and the mold. Additionally, considers the formation of IMCs, providing an idea of the degree of metallurgical interaction occurring between the alloy and the mold throughout solidification.
Figure 3c also provides a comparative view of = f(t) determined using Equation (5) for both solidification experiments. hi characterizes the thermal resistances related to the gap and IMCs. It is worth noting that the difference between the profiles of and is more pronounced for the Sn-Mg/Ni combination. This indicates that while the thermal resistance linked to a 3 mm thick Cu sheet can be regarded as relatively low, the corresponding resistance for the Ni substrate is comparatively higher. Cu exhibits a thermal conductivity of ~385 W/mK [33], which is six times greater than that of Ni (~60.7 W/mK [33]), resulting in a significantly lower thermal resistance. However, the thermal properties of the solders on substrates may be modified because of the higher thermal conductivity of the IMC layer in comparison to that of the solder bulk [25]. As a result, the influence of the thermal resistance caused by a 3 mm thick Cu sheet proves to be minimal on the interfacial heat transfer, given the proximity of the and profiles. In contrast, due to the lower thermal conductivity of Ni, the thermal resistance associated with a 3 mm thick Ni sheet assumes a notable contribution, resulting in a significant separation between the and profiles.
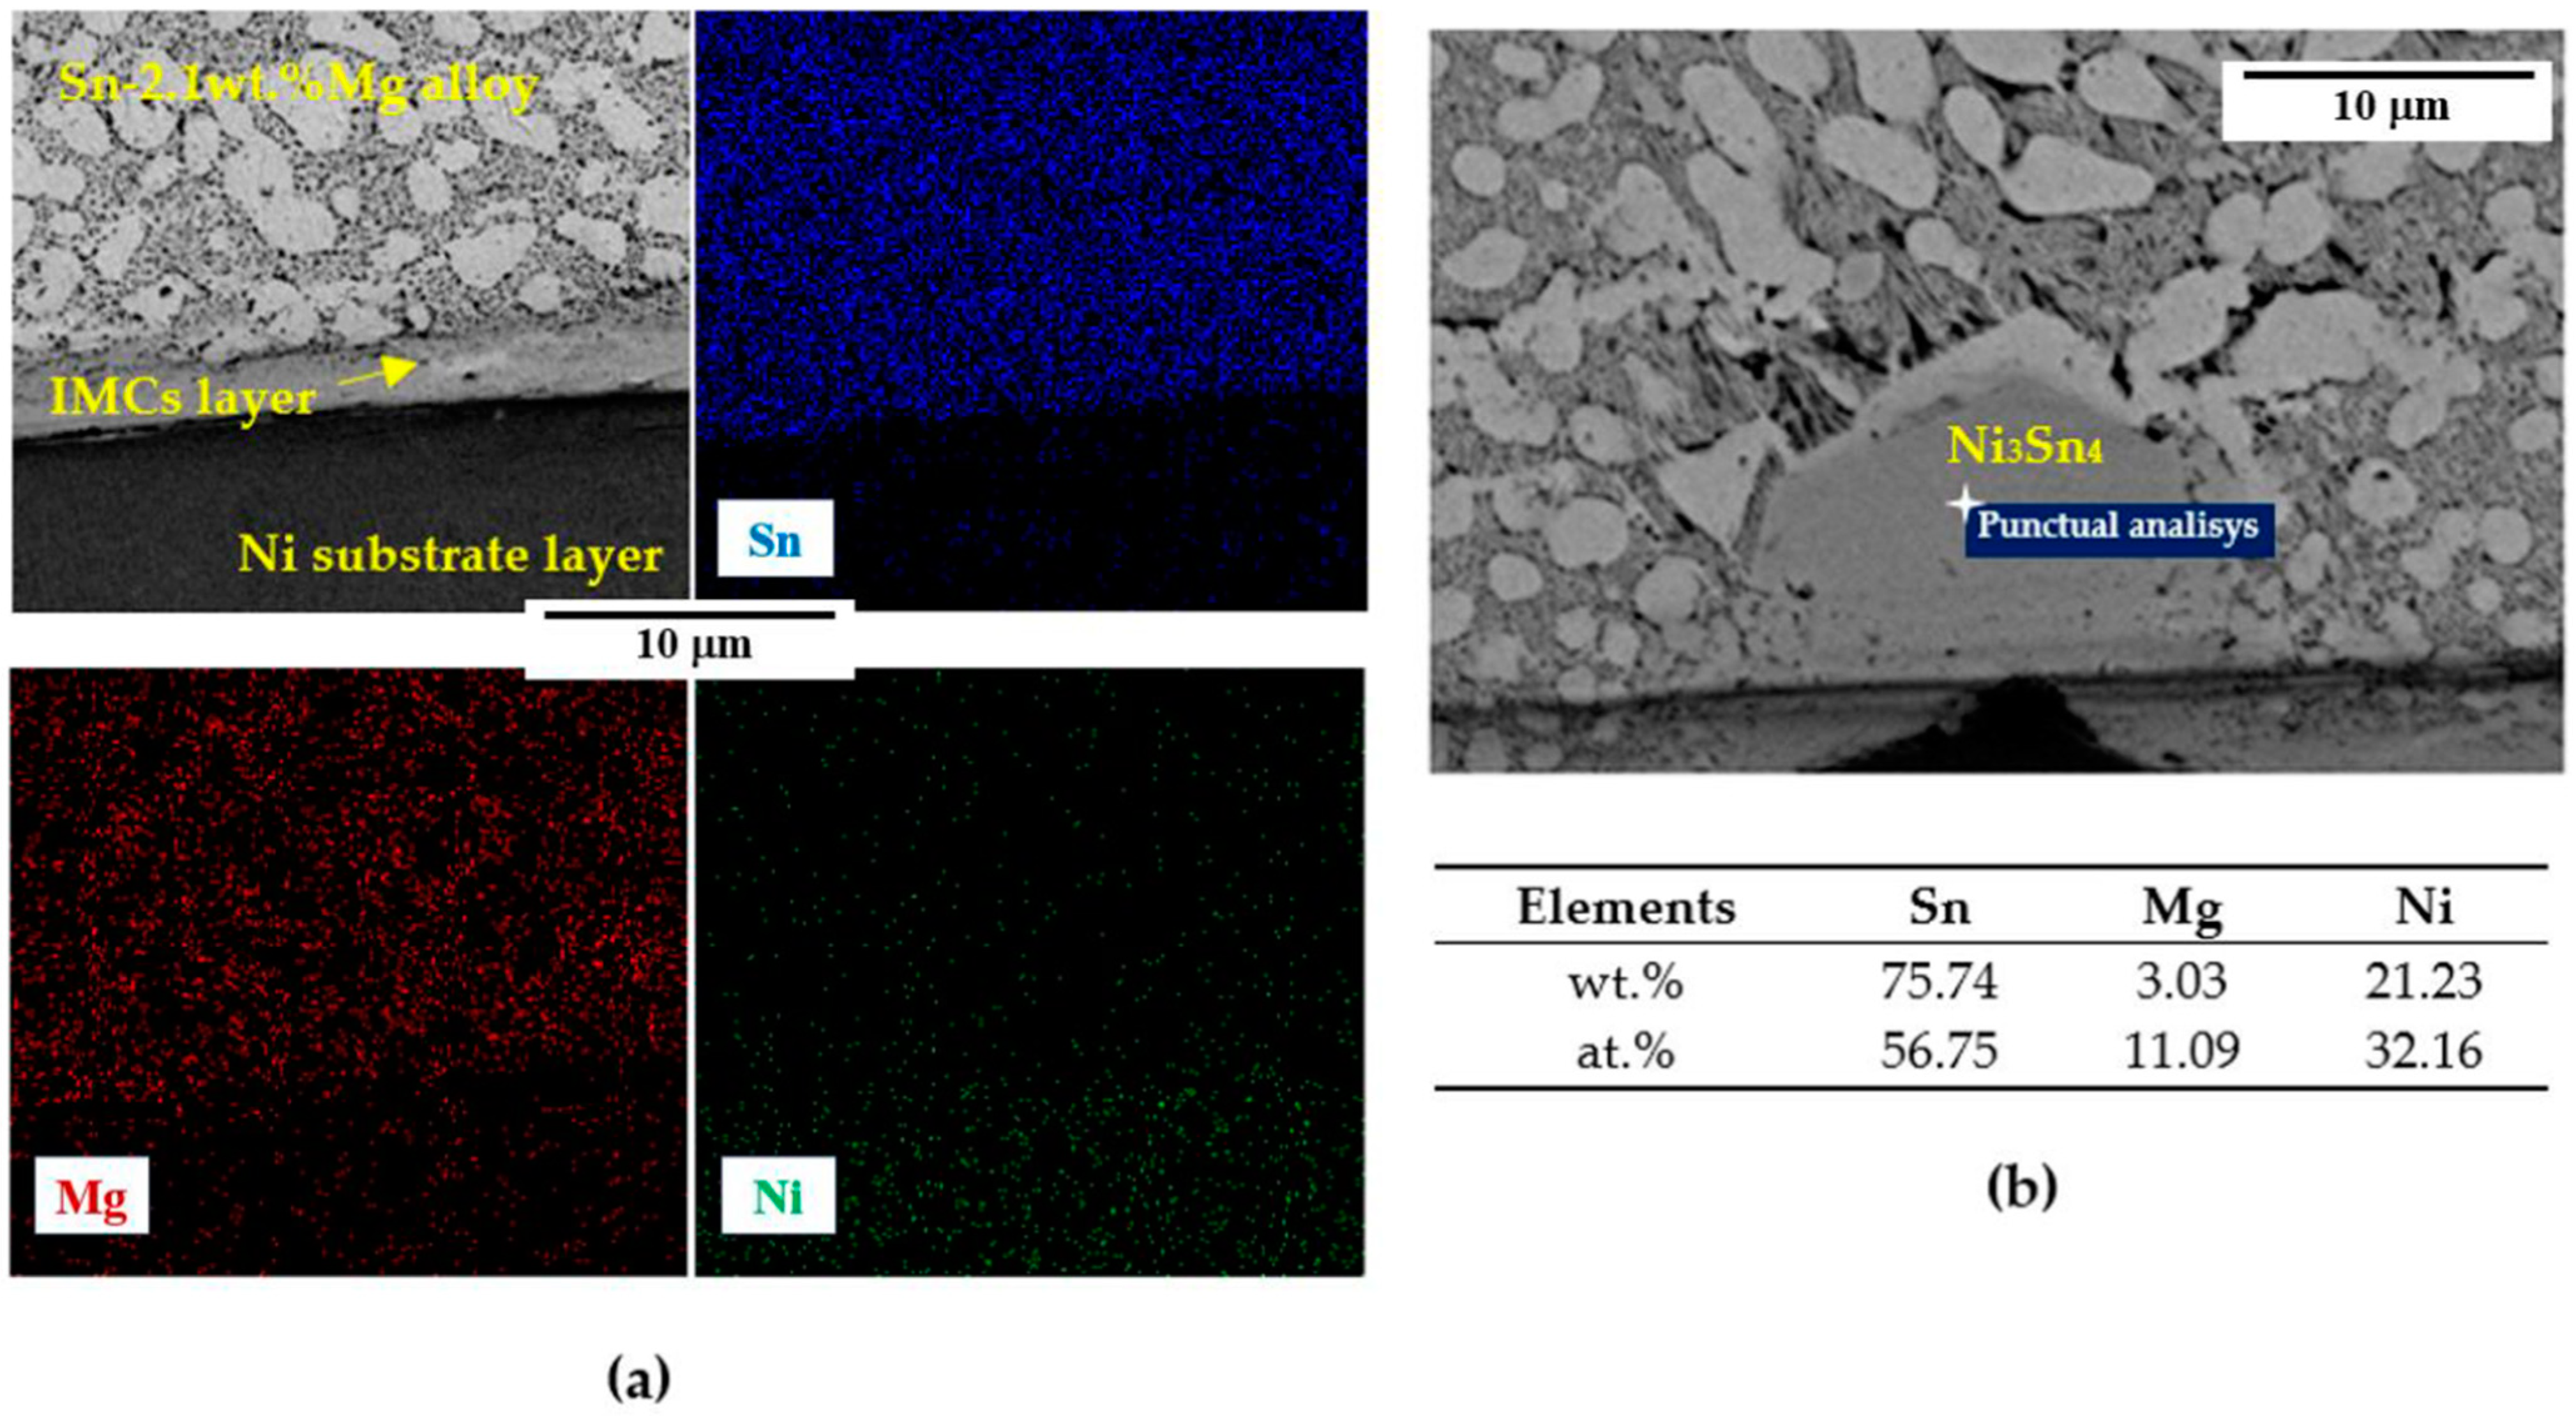
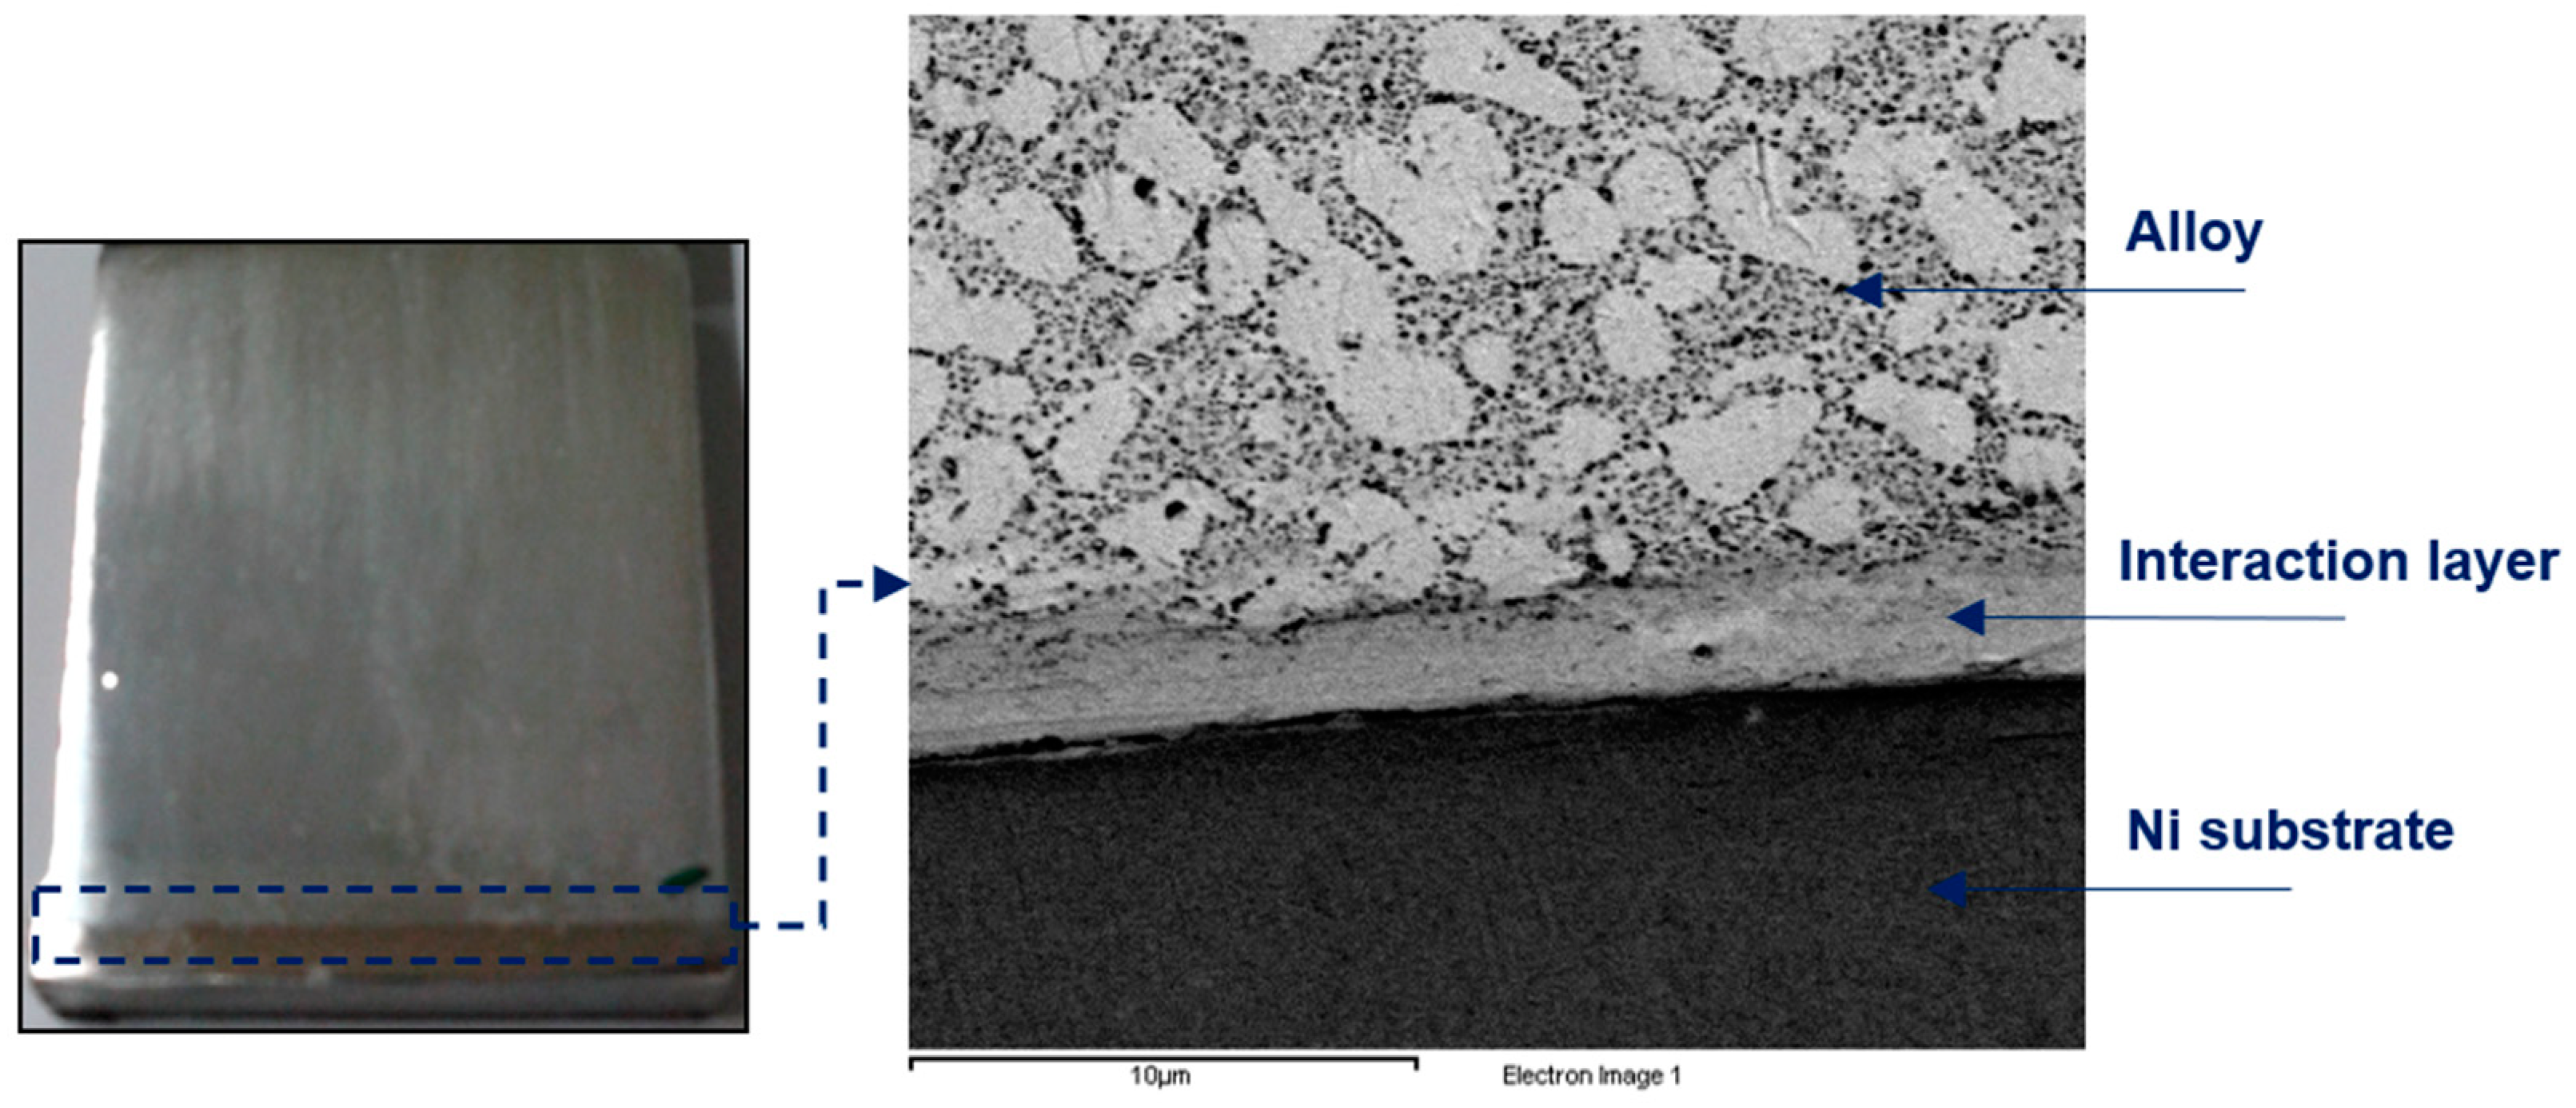
The Sn-2.1wt.%Mg|Ni pair formed a strong bond, so much so that the DS casting remained attached to the substrate even when the sides of the mold were disassembled. The evidence of metallurgical interaction between the eutectic Sn-2.1wt.%Mg alloy and the Ni substrate is shown in Figure 4a through SEM-EDS analysis. As revealed by the EDS maps, Ni atoms migrated from the substrate into the alloy. In fact, a layer made of IMCs can be seen between the alloy and the Ni substrate. A punctual EDS analysis, shown in Figure 4b, was carried out in one of the IMCs, confirming that metallurgical interactions took place at this interface. Only a partial bond was formed between the DS casting and the Cu substrate, so much so that they detached when the mold sides were disassembled. Figure 5a reveals the metallurgical interaction between the solder alloy and the Cu substrate through EM-EDS analysis. This indicates the occurrence of Cu migration from the substrate into the alloy, resulting in the formation of Cu-containing IMCs. A specific EDS analysis for one of these IMCs is presented in Figure 5b.
In Figure 4b, the observed IMC can be reasonably attributed to Ni3Sn4, disregarding the presence of Mg from consideration. Considering that the IMC has a small size, it is plausible to suppose that Mg was detected due to the pear-shaped interaction volume, where the SEM-EDS analysis captured Mg beneath the IMC layer, that is, Mg present in the Mg2Sn IMCs from the Sn-2.1wt.%Mg alloy. It is worth noting that these IMCs exhibit a relatively small scale, approximately on the order of ~15 µm. Given that the analytical spot size significantly exceeds this dimension, it stands to reason that the analysis encompassed a fraction of the Sn-rich matrix of the Sn-2.1wt.%Mg alloy. After disregarding the wt.% contribution of Mg and converting the remaining compositions of Ni and Sn to at%, the Ni and Sn ratio led to the notion of Ni3Sn4. In other words, dividing the detected atomic concentration of Mg (11.09%) in half results in 5.545%. Adding this value to the atomic concentrations of Ni and Sn yields a Ni concentration of 37.705% and a Sn concentration of 62.295%. Consequently, the Ni/Sn ratio is approximately 1.65, which closely matches the Ni/Sn ratio of Ni3Sn4, standing at 1.333. This assumption that the observed IMCs in the SEM image are Ni3Sn4 is further supported by the exclusive presence of Ni3Sn4 among the Ni- and Sn-containing IMCs identified in the DRX patterns, as explained subsequently. In Figure 5b, the IMCs manifest at a significantly larger scale, ~100 µm. In this case, the interference of the pear-shaped interaction volume reduces substantially. It can be seen that there is a compositional ratio of 1:1:1 between Cu, Mg, and Sn, which leads to the argument that the IMC corresponds to CuMgSn. It is noteworthy that the Sn-2.1wt.%Mg/Ni joint exhibited a strong bond. Figure 6 provides a longitudinal view of the Sn-2.1wt.%Mg/Ni joint after the mold was taken apart. On the other hand, the Sn-2.1wt.%Mg/Cu joint exhibited a weak bond, so much so that the alloy detached when the mold was disassembled.
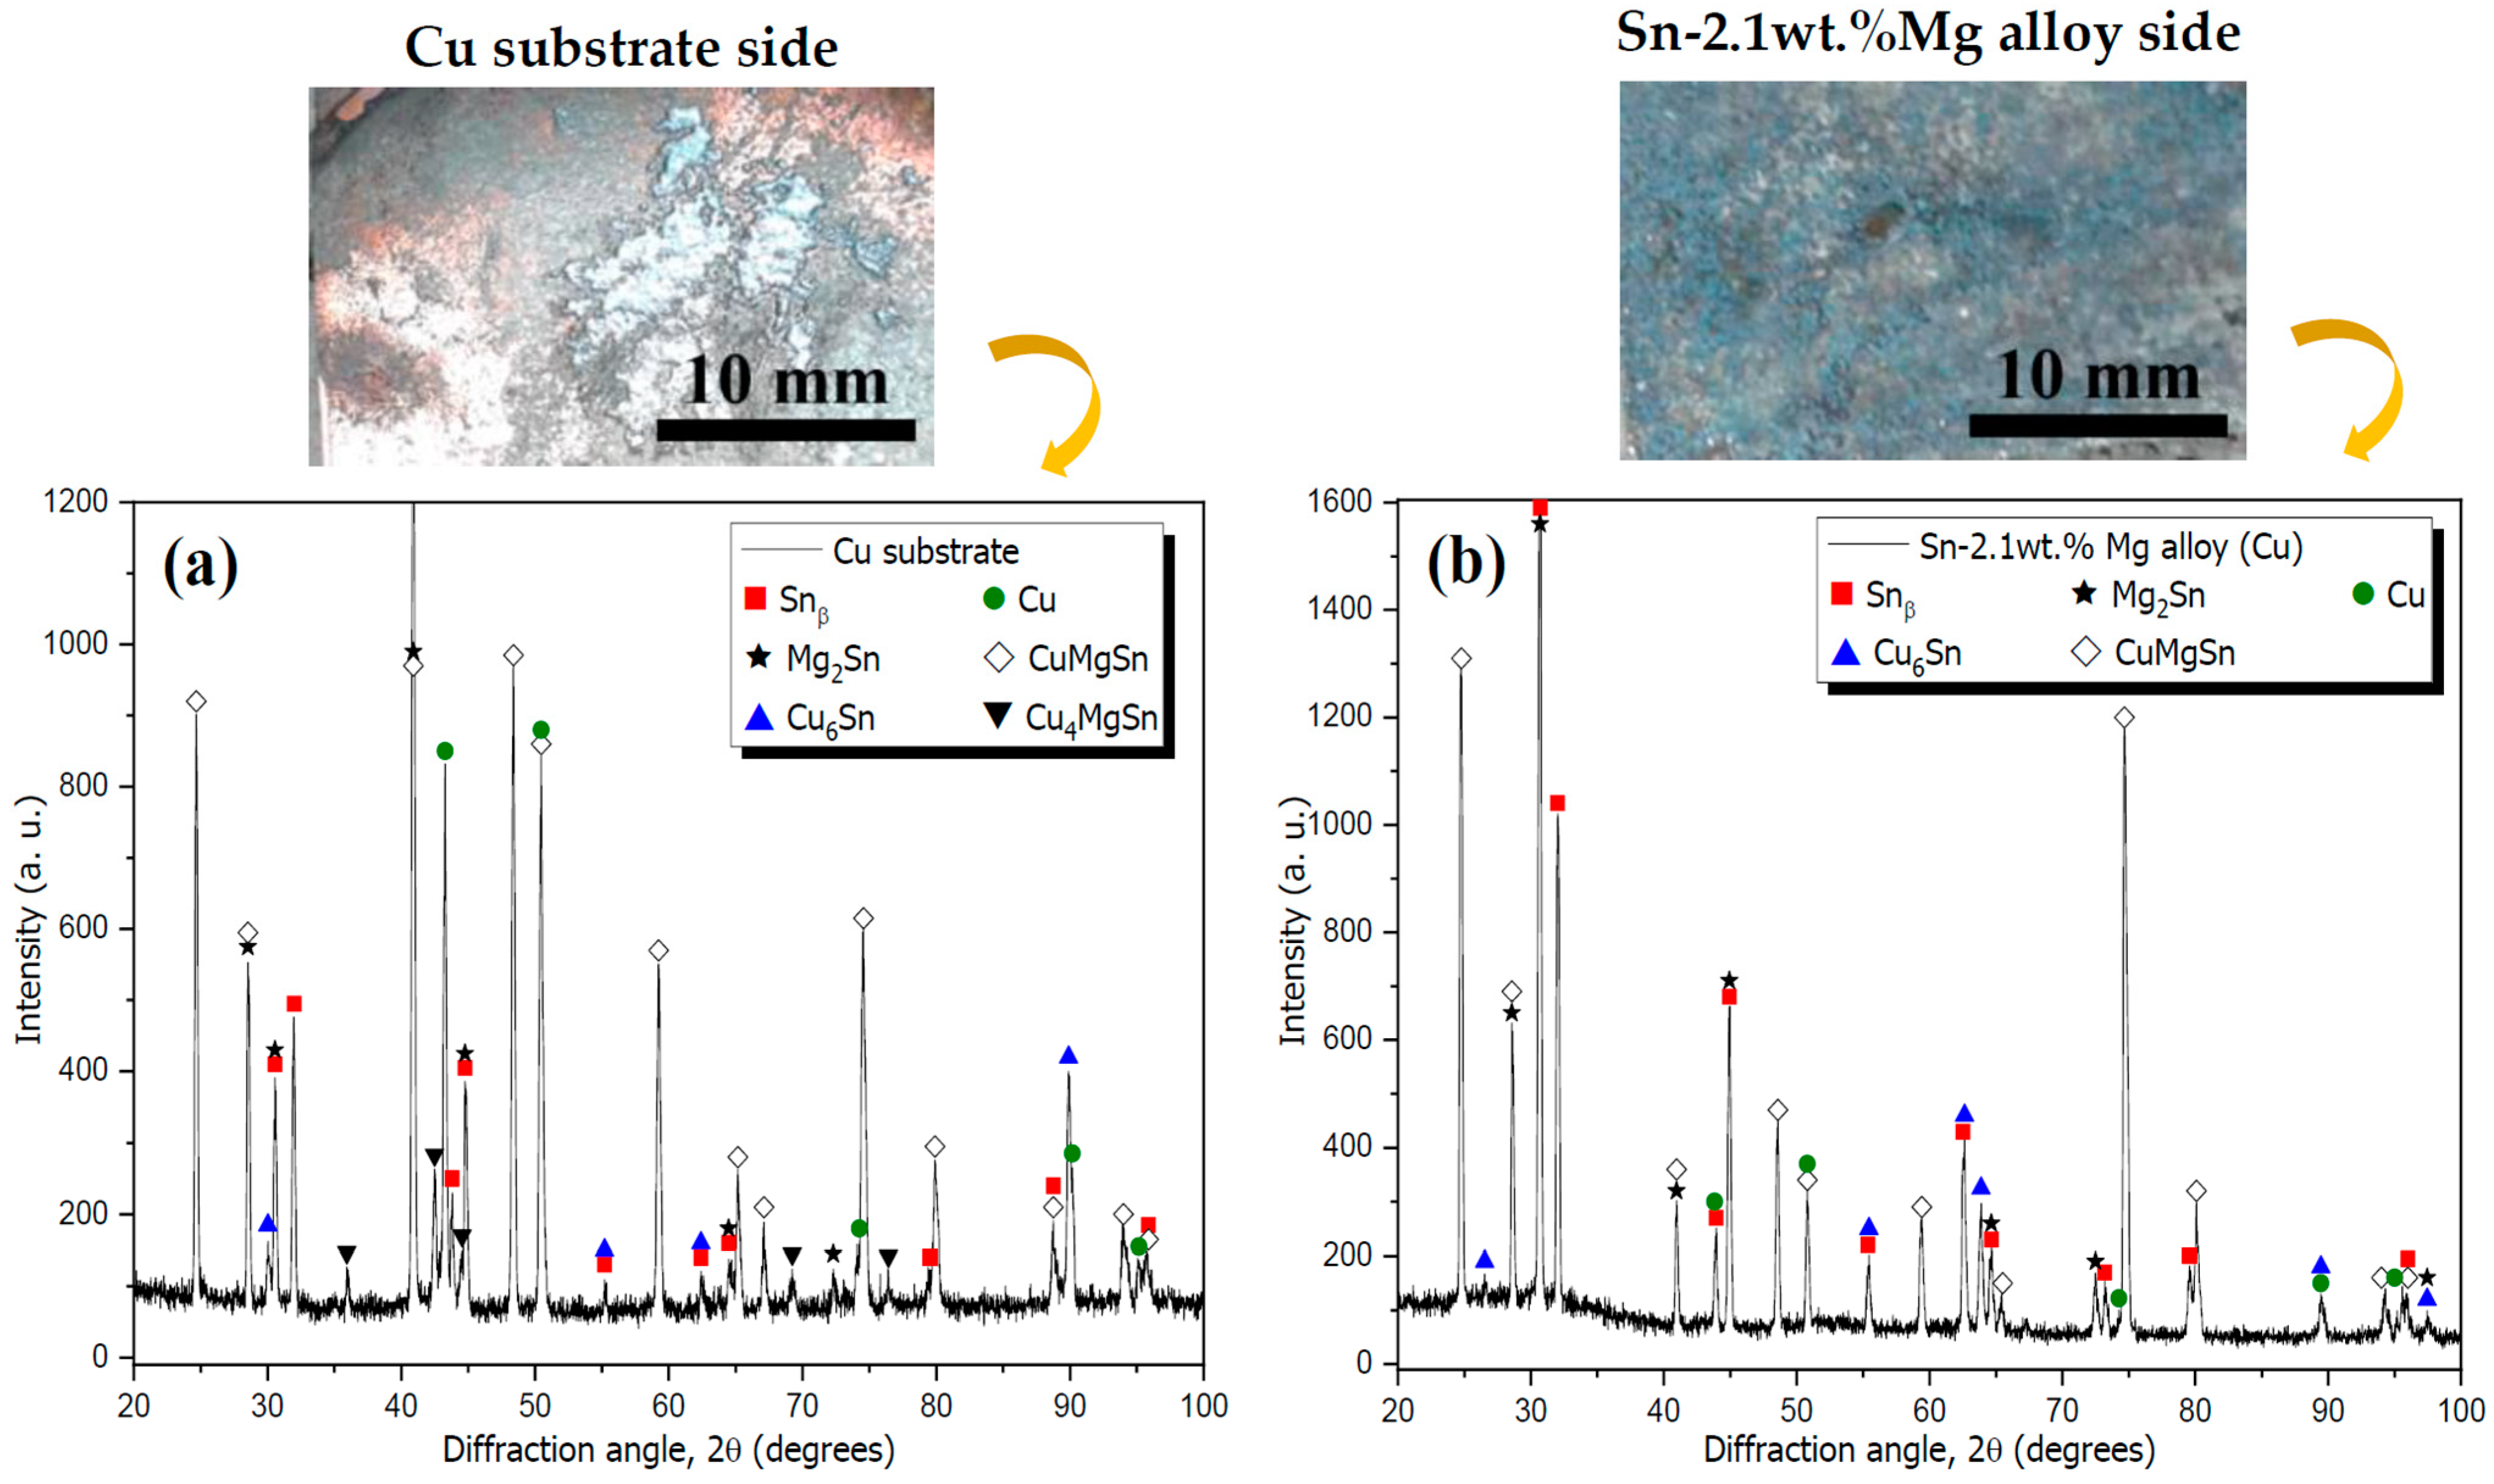
Figure 7a,b display the XRD patterns of the interfaces of the joints established between the Sn-2.1wt.%Mg alloy and the Ni substrate relative to the Ni substrate side and alloy side, respectively. Figure 8a,b show the XRD patterns of the Sn-2.1wt.%Mg/Cu joint interfaces, representing both the Cu substrate side and the alloy side, respectively. Actual images of the interfaces indicate the surfaces where XRD patterns were collected. These XRD patterns were obtained after the detachment of the joints, that is, by analyzing the surfaces formed on both the substrate side and the Sn-2.1wt.%Mg alloy side. On the Cu substrate side, the following phases were identified: β-Sn, Mg2Sn, Cu6Sn5, CuMgSn, Cu4MgSn, and Cu. The only distinction in the XRD pattern of the Sn-2.1wt.%Mg alloy side was the absence of Cu4MgSn. The phases detected on the Ni substrate side comprised β-Sn, Mg2Sn, Ni3Sn4 [34], and Ni [35]. All these phases, except the Ni phase, were found on the Sn-2.1wt.%Mg alloy side.
The presence of IMCs containing Cu and Ni was only observed at the interface between the Sn-2.1wt.%Mg alloy and the substrates, with the microstructural pattern remaining the same throughout the rest of the DS castings. Figure 9 shows a characteristic SEM image of the Sn-2.1wt.%Mg alloy with EDS mapping. As observed in our previous study [23], where the Sn-2.1wt.%Mg alloy was solidified on a steel substrate, the microstructure of this alloy primarily consists of a fibrous eutectic morphology, characterized by the coexistence of a Sn-rich phase (β) with Mg2Sn IMCs.
As seen in Figure 10a,b, the DS castings analyzed here experienced a variation in and , which directly impacts the microstructural length scale. Furthermore, higher and values are associated with positions near the cooling interface. However, as the solidification front advances, decreasing profiles of both thermal variables are observed, linked to increasing microstructural coarsening. In Figure 10a, a single curve represents the pairs we studied: Sn-Mg|Ni and Sn-Mg|Cu, even though there are two distinct curves in the profiles (Figure 10b). In this case, the occurrence of an identical curve for the two different profiles is a direct result of variations in the eutectic thermal gradient (). This means that different profiles occurred ahead of the eutectic isotherm for the Sn-Mg|Ni and Sn-Mg|Cu pairs. These three thermal parameters are interrelated through the following equation:
The fact that the curve remains identical for both studied pairs means that, when a Ni substrate is used, the Sn-2.1wt.%Mg alloy experiences a higher at a given position within the casting. It is important to consider that the analysis of Vet cannot be dissociated from , which together represent a specific solidification condition. In contrast, considers the simultaneous effects of and on the microstructure, making it a more suitable thermal parameter for use as a reference in comparisons. It is noteworthy that the Ni substrate favored a higher profile when compared to the Cu substrate, similar to what occurs with the profiles (Figure 3c). Interestingly, a single profile effectively represents the behavior of both Sn-2.1wt.%Mg|Cu and Sn-2.1wt.%Mg|Ni pairs.
Figure 11a,b show characteristic SEM micrographs obtained at three positions in DS castings solidified on Ni and Cu substrates, respectively. These images illustrate the impact of varying on the microstructural length scale. For both cases, the microstructures are the same, being composed of a Sn-rich matrix surrounded by fibrous Mg2Sn IMCs. The measurement of microstructural refinement is based on the fibrous spacing of the Mg2Sn interphase (λG), a parameter that comprehensively represents the microstructural array in the Sn-2.1wt.%Mg alloy. Clearly, lower values of λG are associated with higher values of . Notably, the experiment conducted with a Ni substrate results in a higher , leading to a finer microstructure. This finding is directly related to the interface coefficients ( and ) governing local thermal conductance throughout the solidification process. These coefficients significantly influence the solidification thermal parameters, particularly , as previously shown in Figure 8b. Overall, when and values are higher, the profile increases, resulting in finer microstructures.
Figure 12a,b show the fibrous spacing of the Mg2Sn interphase (λG) measured along the length of the DS Sn-2.1wt.%Mg alloy casting in relation to Veut and Ṫeut, respectively. This analysis considers the experimental data collected from experiments conducted with both Cu and Ni substrates. Interestingly, these experimental results align quite well with the growth law found in our previous study [23], which involved the solidification of the Sn-2.1wt.%Mg alloy on a steel substrate. The experimental values of λG, found in the Reference [23], are represented as black squares in Figure 8a. Figure 8a also includes the theoretical predictions calculated using the Jackson–Hunt (JH) model [36]. In the JH model, the equation λG2 Veut = C is postulated, leading to the simplification λG = C Veut−0.5, where C represents a constant. The linear regression analysis applied to the experimental data according to the JH model resulted in λG = 25.20 Veut−0.5, while the constant C in the model would be 21.06. However, this model inadequately represents the experimental λG values, as solidification in this context occurs under transient heat flow conditions, diverging from the assumptions underlying the JH model tailored for steady-state solidification. To optimize the fitting to experimental data, an alternative linear relationship, λG = −1.33 + 53.19 Veut−0.5, was established, incorporating a correction factor (a = −1.33). Notably, the applicability of this equation is confined to Veut = 0.9 mm/s and above. Beyond this range, the equation loses validity due to the introduction of a negative spacing term (a = −1.33), which lacks physical significance.
Figure 13a illustrates stress–strain curves for test specimens obtained at distances of 6 mm, 30 mm, and 58 mm from the metal/mold interface of the eutectic Sn-Mg alloy casting. Notably, samples subjected to more intense cooling regimes exhibited improved mechanical strength. As and decrease, λG increases, resulting in a progressively coarser microstructure, which, in turn, influences the Sn-2.1wt.%Mg alloy’s mechanical behavior. Samples extracted from positions 30 mm and 58 mm display a trend of decreasing stress levels for a given deformation, but there is an increase in deformation until failure occurs. Figure 13b–d correlate the ultimate tensile strength (σU), yield strength (σY), and elongation (δ) with λG−0.5, respectively. Clearly, both σU and σY increase as λG−0.5 increases, reflecting an improvement in these mechanical properties with microstructural refinement. To represent such enhancement, experimental Hall–Petch-type equations are proposed. The transition from coarser to finer microstructures resulted in a significant 37% increase in σU, with values changing from 57 to 78 MPa. On the other hand, σY demonstrated variability within the range of 41 to 54 MPa, with the higher value found in finer microstructures, marking a 31% improvement. In contrast, δ remains unchanged with variations in λG−0.5, maintaining an approximate value of 11.5%. Since σU and σY were the only mechanical properties that significantly varied, Figure 14 associates them with hi, with experimental equations being proposed. It is important to mention that this work found the ranges of values of σU and σY (57 to 78 MPa and 41 to 54 MPa, respectively) comparable to those previously found for an Sn-2.5wt.%Mg alloy (σU = 80 ± 11 and σY = 55 ± 7) [13], but contributes to understanding the impact of microstructural refinement, which in turn is also related to the interfacial heat transfer. The studied alloy also proves to have σU superior to SAC alloys, since previous studies have observed that SAC alloys can have σU ranging from 29.6 MPa to 35.31 MPa [8] or even 50 MPa [37], while Sn-Pb alloys have σU equal to 52.49 MPa [38].
5. Conclusions
This study addressed the critical need for Pb-free solder materials in electronic welding by investigating the Sn-2.1wt.%Mg alloy. Based on the findings of this research, the following conclusions can be drawn:
- The Sn-2.1wt.%Mg alloy exhibits higher interfacial thermal conductance when paired with the Ni substrate, as evidenced by the application of an approach that identifies the best match between simulated and experimental cooling curves obtained during directional solidification.
- The behavior of and , expressed as functions of time, for the Sn-Mg|Ni substrate pair can be represented by the following equations: = 19,335(t)−0.16 and = 10,000(t)−0.1. Furthermore, the thermal resistance caused by a 3 mm thick Ni sheet results in a significant separation between the and profiles.
- The Sn-Mg|Cu substrate combination exhibits and profiles captured by the following equations: = 11,523(t)−0.2 and = 11,000(t)−0.2. Moreover, the thermal resistance caused by a 3 mm thick Cu sheet has a minimal influence on the interfacial heat transfer, so much so that the and profiles are quite close.
- In the Sn-Mg|Cu pair, the Cu substrate side revealed the presence of multiple phases, including β-Sn, Mg2Sn, Cu6Sn5, CuMgSn, Cu4MgSn, and Cu. Conversely, the Sn-2.1wt.%Mg alloy side exhibited all these phases except for Cu4MgSn. In the Sn-Mg|Ni pair, the Ni substrate side comprised the β-Sn, Mg2Sn, Ni3Sn4, and Ni phases. The Sn-2.1wt.%Mg alloy side contained all these phases except Ni.
- σU displayed a considerable 37% increase, rising from 57 MPa for coarser microstructures to 78 MPa for finer ones. σY exhibited variations within the range of 41 to 54 MPa, with the higher value observed in finer microstructures representing a 31% increase. Experimental equations are proposed to relate these variations in σU and σY to λG and . In contrast, δ remains almost constant, with an approximate value of 11.5%.
- Regarding possible practical use, the outcomes of this study provide valuable insights for the development of reliable solder joints in electronic applications, as the mechanical properties of the Sn-2.1wt.%Mg alloy are comparable to those of Sn-Pb and SAC alloys. Furthermore, they offer guidance for selecting a more appropriate substrate, with Ni proving suitable due to improved interfacial heat transfer and bonding. Therefore, this work contributes to the advancement of Pb-free solder materials.
Author Contributions
Conceptualization, C.C. and N.C.; methodology, C.C. and T.S.; formal analysis, C.C., T.S., A.B., A.G. and N.C.; investigation, C.C.; resources, A.G. and N.C.; data curation, C.C., T.S. and A.B. writing—original draft preparation, C.C., A.B. and N.C.; writing—review and editing, A.G. and N.C.; supervision, N.C.; project administration, C.C., A.G. and N.C.; funding acquisition, A.G. and N.C. All authors have read and agreed to the published version of the manuscript.
Funding
This research was funded by FAPESP—São Paulo Research Foundation, Brazil (Grants: 2021/11439-0; 2023/01422-8; 2023/12535-8); CAPES—Coordenação de Aperfeiçoamento de Pessoal de Nível Superior, Brazil (Finance Code 001); and FAEPEX/UNICAMP-Fundo de Apoio ao Ensino, à Pesquisa e à Extensão (grants: 2162/21, 2549/22, and 3044/23).
Data Availability Statement
Data will be made available on request.
Acknowledgments
This research used the facilities of the Brazilian Nanotechnology National Laboratory (LNNano), part of the Brazilian Centre for Research in Energy and Materials (CNPEM), a private nonprofit organization under the supervision of the Brazilian Ministry for Science, Technology, and Innovations (MCTI). The X-ray diffraction staff is acknowledged for their assistance during the experiments (DRXP-19151).
Conflicts of Interest
The authors declare no conflict of interest.
References
- Zhang, P.; Xue, S.; Wang, J. New challenges of miniaturization of electronic devices: Electromigration and thermomigration in lead-free solder joints. Mater. Des. 2020, 192, 108726. [Google Scholar] [CrossRef]
- Gao, H.; Liu, W.; An, R.; Hang, C.; Tian, Y. Thermal cycle reliability and creep behavior of nano-IMC mixed solder joints. J. Mater. Sci. Mater. Electron. 2023, 34, 1919. [Google Scholar] [CrossRef]
- Bashir, M.N.; Haseeb, A.S.M.A.; Naher, S.; Ali, M.M.; Ali Bashir, M.B.; Zaidi, A.A.; Jamshaid, M.; Javed, I. Effects of cobalt nanoparticle on microstructure of Sn58Bi solder joint. J. Mater. Sci. Mater. Electron. 2023, 34, 248. [Google Scholar] [CrossRef]
- Li, F.; Pu, C.; Li, C.; Yang, J.; Jia, Y.; Geng, C.; Zhang, X.; Bao, Q.; Guo, S.; Yi, J.; et al. Study on the effects of Ag addition on the mechanical properties and oxidation resistance of Sn–Zn lead-free solder alloy by high-throughput method. J. Mater. Sci. Mater. Electron. 2023, 34, 322. [Google Scholar] [CrossRef]
- Zhong, S.J.; Zhang, L.; Li, M.L.; Long, W.M.; Wang, F.J. Development of lead-free interconnection materials in electronic industry during the past decades: Structure and properties. Mater. Des. 2022, 215, 110439. [Google Scholar] [CrossRef]
- Bharath Krupa Teja, M.; Sharma, A.; Das, S.; Das, K. A review on nanodispersed lead-free solders in electronics: Synthesis, microstructure and intermetallic growth characteristics. J. Mater. Sci. 2022, 57, 8597–8633. [Google Scholar] [CrossRef]
- Dele-Afolabi, T.T.; Ansari, M.N.M.; Azmah Hanim, M.A.; Oyekanmi, A.A.; Ojo-Kupoluyi, O.J.; Atiqah, A. Recent advances in Sn-based lead-free solder interconnects for microelectronics packaging: Materials and technologies. J. Mater. Res. Technol. 2023, 25, 4231–4263. [Google Scholar] [CrossRef]
- Hyder, J.; Khan, M.M.; Irfan, M.; Masud, M.; Hameed, M.S.; Wakeel, A.; Asim Pasha, R.; Ullah, B.; Ali, U. Analysis of mechanical strength of Indium-doped SAC 105 lead-free solder alloy. Eng. Proc. 2023, 45, 18. [Google Scholar] [CrossRef]
- Ren, G.; Wilding, I.J.; Collins, M.N. Alloying influences on low melt temperature SnZn and SnBi solder alloys for electronic interconnections. J. Alloys Compd. 2016, 665, 251–260. [Google Scholar] [CrossRef]
- Dogan, A.; Arslan, H. An investigation of influencing of Sb and Bi contents on surface tensions associated with Pb-free Sn-Zn-Sb-Bi quaternary and sub-quaternary solder alloys. Philos. Mag. 2019, 99, 1825–1848. [Google Scholar] [CrossRef]
- Ahn, B. Emerging interconnection technology and Pb-free solder materials for advanced microelectronic packaging. Metals 2021, 11, 1941. [Google Scholar] [CrossRef]
- Fouda, A.N.; Eid, E.A. Role of graphene oxide (GO) for enhancing the solidification rate and mechanical properties of Sn–6.5Zn–0.4 wt% Cu Pb-free solder alloy. J. Mater. Sci. Mater. Electron. 2022, 33, 522–540. [Google Scholar] [CrossRef]
- Alam, M.E.; Gupta, M. Development of high strength Sn-Mg solder alloys with reasonable ductility. Electron. Mater. Lett. 2013, 9, 575–585. [Google Scholar] [CrossRef]
- Alsowidy, S.; Aljarbani, A.M.; Gumaan, M.S. Microstructural and creep characterization of Sn-0.7Cu and Sn-0.7Cu-xBi lead-free solders for low cost electronic. Results Mater. 2022, 16, 100319. [Google Scholar] [CrossRef]
- Li, S.; Wang, X.; Liu, Z.; Jiu, Y.; Zhang, S.; Geng, J.; Chen, X.; Wu, S.; He, P.; Long, W. Corrosion behavior of Sn-based lead-free solder alloys: A review. J. Mater. Sci. Mater. Electron. 2020, 31, 9076–9090. [Google Scholar] [CrossRef]
- Cui, Y.; Xian, J.W.; Zois, A.; Marquardt, K.; Yasuda, H.; Gourlay, C.M. Nucleation and growth of Ag3Sn in Sn-Ag and Sn-Ag-Cu solder alloys. Acta Mater. 2023, 249, 118831. [Google Scholar] [CrossRef]
- Tan, C.Y.; Salleh, M.A.A.M.; Tan, X.F.; Yasuda, H.; Saud, N.; Ramli, M.I.I.; Nogita, K. Properties of Sn-3 wt%Ag-5 wt%Cu alloys with Cu6Sn5 intermetallics grain refined by Mg. Mater. Today Commun. 2022, 31, 103221. [Google Scholar] [CrossRef]
- Kim, S.H.; Choi, J.P.; Eom, Y.S.; Nam, Y.; Baek, S.; Aranas, C. A phenomenological study of a Sn–Ag–Al composite solder reinforced with Mg–MWCNT: Improved electrical conductivity and thermo-physical performance. Mater. Des. 2018, 140, 196–208. [Google Scholar] [CrossRef]
- Huang, H.Y.; Yang, C.W.; Peng, Y.C. Effects on the microstructure and mechanical properties of Sn-0.7Cu lead-free solder with the addition of a small amount of magnesium. Sci. Eng. Compos. Mater. 2016, 23, 641–647. [Google Scholar] [CrossRef]
- Huang, X.; Zhang, L.; Chen, C.; Lu, X.; Wang, X. Comprehensive analysis of Sn58Bi/Cu solder joints reinforced with Mg particles: Wettability, thermal, mechanics, and microstructural characterization. J. Mater. Res. Technol. 2023, 27, 2641–2655. [Google Scholar] [CrossRef]
- Chen, C.; Zhang, L.; Wang, X.; Lu, X.; Guo, Y. huan Microstructure and properties of Sn58Bi/Ni solder joint modified by Mg particles. J. Mater. Res. Technol. 2023, 24, 514–526. [Google Scholar] [CrossRef]
- Meydaneri, F.; Saatçi, B. Thermal, electrical, microstructure and microhardness properties of the eutectic magnesium-tin. Arab. J. Sci. Eng. 2014, 39, 5815–5824. [Google Scholar] [CrossRef]
- Cruz, C.; Lima, T.; Soares, M.; Freitas, E.; Fujiwara, E.; Garcia, A.; Cheung, N. Effect of microstructure features on the corrosion behavior of the Sn-2.1 wt%Mg solder alloy. Electron. Mater. Lett. 2020, 16, 276–292. [Google Scholar] [CrossRef]
- Gabalcová, Z.; Gogola, P.; Gerhátová, Ž.; Palcut, M. Corrosion behavior of an Mg2Sn alloy. Materials 2022, 15, 2025. [Google Scholar] [CrossRef]
- Dybeł, A.; Czaja, P.; Sitek, J.; Pstruś, J. Wetting and interfacial chemistry of new Pb-free Sn-Zn-Ag-Al-Li (SZAAL) solder with Cu, Ni, and Al substrates. J. Mater. Eng. Perform. 2023, 32, 5723–5730. [Google Scholar] [CrossRef]
- He, H.; Huang, S.; Ye, Y.; Xiao, Y.; Zhang, Z.; Li, M.; Goodall, R. Microstructure and mechanical properties of Cu joints soldered with a Sn-based composite solder, reinforced by metal foam. J. Alloys Compd. 2020, 845, 156240. [Google Scholar] [CrossRef]
- Pietruszka, A.; Górecki, P.; Wroński, S.; Illés, B.; Skwarek, A. The influence of soldering profile on the thermal parameters of Insulated Gate Bipolar Transistors (IGBTs). Appl. Sci. 2021, 11, 5583. [Google Scholar] [CrossRef]
- Sobolewski, M.; Dziurdzia, B. Experimental approach to thermal conductivity of macro solder joints with voids. Solder. Surf. Mt. Technol. 2019, 31, 181–191. [Google Scholar] [CrossRef]
- Gündüz, M.; Çadirli, E. Directional solidification of aluminium–copper alloys. Mater. Sci. Eng. A 2002, 327, 167–185. [Google Scholar] [CrossRef]
- ASTM E8/E8M-21; Standard Test Methods for Tension Testing of Metallic Materials. ASTM Internacional: West Conshohocken, PA, USA, 2021.
- Silva-Santos, C.H.; Goulart, P.R.; Bertelli, F.; Garcia, A.; Cheung, N. An artificial immune system algorithm applied to the solution of an inverse problem in unsteady inward solidification. Adv. Eng. Softw. 2018, 121, 178–187. [Google Scholar] [CrossRef]
- Ruddle, R.W. The Solidification of Castings, 2nd ed.; Institute of Metals: London, UK, 1957. [Google Scholar]
- MatWeb Online Materials Information Resource. Available online: http://www.matweb.com (accessed on 15 May 2020).
- Jeitschko, W.; Jaberg, B. Structure refinement of Ni3Sn4. Acta Crystallogr. 1982, B38, 598–600. [Google Scholar] [CrossRef]
- Conway, J.O.; Prior, T.J. Interstitial nitrides revisited—A simple synthesis of MxMo3N (M = Fe, Co, Ni). J. Alloys Compd. 2019, 774, 69–74. [Google Scholar] [CrossRef]
- Jackson, K.A.; Hunt, J.D. Lamellar and rod eutectic growth. Dyn. Curved Front. 1988, 236, 363–376. [Google Scholar] [CrossRef]
- Raza, M.; Shewchenko, L.; Olofinjana, A.; Kent, D.; Mata, J.; Haque, R. The effects of Bi substitution for Sn on mechanical properties of Sn-based lead-free solders. J. Mater. Sci. Mater. Electron. 2021, 32, 22155–22167. [Google Scholar] [CrossRef]
- Kumar, K.M.; Kripesh, V.; Tay, A.A.O. Influence of single-wall carbon nanotube addition on the microstructural and tensile properties of Sn–Pb solder alloy. J. Alloys Compd. 2008, 455, 148–158. [Google Scholar] [CrossRef]
Figure 1.
Schematic representation of the water-cooled upward directional solidification apparatus and details of the interchangeable bottom.
Figure 1.
Schematic representation of the water-cooled upward directional solidification apparatus and details of the interchangeable bottom.

Figure 2.
Schematic representation of the sample removal for microstructural analysis and tensile tests with the Sn-2.1wt.%Mg alloy castings.
Figure 2.
Schematic representation of the sample removal for microstructural analysis and tensile tests with the Sn-2.1wt.%Mg alloy castings.

Figure 3.
Experimental thermal profiles and numerical simulations employed to determine profiles for (a) Ni and (b) Cu substrates. (c) Comparison between the = f(t) and = f(t) equations.
Figure 3.
Experimental thermal profiles and numerical simulations employed to determine profiles for (a) Ni and (b) Cu substrates. (c) Comparison between the = f(t) and = f(t) equations.

Figure 4.
(a) SEM image with EDS elemental map analysis for the Sn-2.1wt.%Mg/Ni joint. (b) Punctual EDS analysis in an IMC formed at the interface. Star in the figure represents the location of the punctual analysis.
Figure 4.
(a) SEM image with EDS elemental map analysis for the Sn-2.1wt.%Mg/Ni joint. (b) Punctual EDS analysis in an IMC formed at the interface. Star in the figure represents the location of the punctual analysis.

Figure 5.
(a) SEM image with EDS elemental map analysis for the Sn-2.1wt.%Mg/Cu joint. (b) Punctual EDS analysis in an IMC formed at the interface. Star in the figure represents the location of the punctual analysis.
Figure 5.
(a) SEM image with EDS elemental map analysis for the Sn-2.1wt.%Mg/Cu joint. (b) Punctual EDS analysis in an IMC formed at the interface. Star in the figure represents the location of the punctual analysis.

Figure 6.
Longitudinal view of the Sn-2.1wt.%Mg/Ni joint, illustrating a strong bond.

Figure 7.
XRD patterns for (a) the Ni substrate side and (b) the Sn-2.1wt.%Mg alloy side relative to the Ni substrate after joint detachment, along with images of the analyzed surfaces.
Figure 7.
XRD patterns for (a) the Ni substrate side and (b) the Sn-2.1wt.%Mg alloy side relative to the Ni substrate after joint detachment, along with images of the analyzed surfaces.

Figure 8.
XRD patterns for (a) the Cu substrate side and (b) the Sn-2.1wt.%Mg alloy side relative to the Cu substrate after joint detachment, along with images of the analyzed surfaces.
Figure 8.
XRD patterns for (a) the Cu substrate side and (b) the Sn-2.1wt.%Mg alloy side relative to the Cu substrate after joint detachment, along with images of the analyzed surfaces.

Figure 9.
Characteristic SEM image of the Sn-2.1wt.%Mg alloy along with its corresponding EDS maps for Sn and Mg, illustrating the typical views of transverse sections along the length of the DS casting (from 5 to 70 mm in relation to the metal–mold interface).
Figure 9.
Characteristic SEM image of the Sn-2.1wt.%Mg alloy along with its corresponding EDS maps for Sn and Mg, illustrating the typical views of transverse sections along the length of the DS casting (from 5 to 70 mm in relation to the metal–mold interface).

Figure 10.
(a) and (b) profiles obtained from the experiments involving the Sn-2.1wt.%Mg alloy with Cu and Ni substrates.
Figure 10.
(a) and (b) profiles obtained from the experiments involving the Sn-2.1wt.%Mg alloy with Cu and Ni substrates.

Figure 11.
SEM images of transverse and longitudinal microstructures at three positions in DS castings solidified on (a) Ni and (b) Cu substrates.
Figure 11.
SEM images of transverse and longitudinal microstructures at three positions in DS castings solidified on (a) Ni and (b) Cu substrates.

Figure 12.
Experimental relationships associating λG with (a) Veut and (b) Ṫeut. Black squares represent the experimental values found in the Reference [23].
Figure 12.
Experimental relationships associating λG with (a) Veut and (b) Ṫeut. Black squares represent the experimental values found in the Reference [23].

Figure 13.
(a) Representative stress–strain curves, along with the respective (b) ultimate tensile strength, (c) yield strength, and (d) elongation relationships with λG−0.5.
Figure 13.
(a) Representative stress–strain curves, along with the respective (b) ultimate tensile strength, (c) yield strength, and (d) elongation relationships with λG−0.5.

Figure 14.
Experimental relation of (a) σU and (b) σY with hi.


Table 1.
Chemical compositions (wt.%) of the metals used in the Sn-Mg alloy preparation and those composing the substrates.
Table 1.
Chemical compositions (wt.%) of the metals used in the Sn-Mg alloy preparation and those composing the substrates.
| Metals | Sn | Mg | Cu | Ni | Fe | Zn | Ag | Pb |
|---|---|---|---|---|---|---|---|---|
| Sn | Balance | - | 0.001 | 0.001 | 0.002 | 0.001 | - | 0.028 |
| Mg | - | Balance | - | - | 0.010 | 0.010 | - | - |
| Cu | 0.009 | - | Balance | 0.008 | - | - | - | - |
| Ni | - | - | - | Balance | 0.002 | - | - | - |
Table 2.
Thermophysical properties of the Sn-2.1wt.%Mg alloy obtained from Reference [33] and from the Thermo-Calc software (https://thermocalc.com/). Subscripts S and L correspond to solid and liquid states, respectively.
Table 2.
Thermophysical properties of the Sn-2.1wt.%Mg alloy obtained from Reference [33] and from the Thermo-Calc software (https://thermocalc.com/). Subscripts S and L correspond to solid and liquid states, respectively.
| Property | Symbol | Unit | Sn-2.1wt.%Mg Alloy |
|---|---|---|---|
| Thermal conductivity | kS | W m−1 K−1 | 68.3 |
| kL | W m−1 K−1 | 73.8 | |
| Specific heat | cS | J kg−1 K−1 | 6823.7 |
| cL | J kg−1 K−1 | 6533.2 | |
| Density | ρS | kg m−3 | 251 |
| ρL | kg m−3 | 251 | |
| Latent heat | L | J kg−1 | 48,960 |
| Melting temperature | TM | °C | 202 |
Disclaimer/Publisher’s Note: The statements, opinions and data contained in all publications are solely those of the individual author(s) and contributor(s) and not of MDPI and/or the editor(s). MDPI and/or the editor(s) disclaim responsibility for any injury to people or property resulting from any ideas, methods, instructions or products referred to in the content. |
© 2023 by the authors. Licensee MDPI, Basel, Switzerland. This article is an open access article distributed under the terms and conditions of the Creative Commons Attribution (CC BY) license (https://creativecommons.org/licenses/by/4.0/).
Share and Cite
MDPI and ACS Style
Cruz, C.; Soares, T.; Barros, A.; Garcia, A.; Cheung, N. The Influence of Interfacial Thermal Conductance on the Tensile Strength of a Sn-Mg Solder Alloy. Metals 2023, 13, 1813. https://doi.org/10.3390/met13111813
AMA Style
Cruz C, Soares T, Barros A, Garcia A, Cheung N. The Influence of Interfacial Thermal Conductance on the Tensile Strength of a Sn-Mg Solder Alloy. Metals. 2023; 13(11):1813. https://doi.org/10.3390/met13111813
Chicago/Turabian StyleCruz, Clarissa, Thiago Soares, André Barros, Amauri Garcia, and Noé Cheung. 2023. "The Influence of Interfacial Thermal Conductance on the Tensile Strength of a Sn-Mg Solder Alloy" Metals 13, no. 11: 1813. https://doi.org/10.3390/met13111813
Note that from the first issue of 2016, this journal uses article numbers instead of page numbers. See further details here.