
Recent Advances and Clinical Application of Color Scanning Laser Ophthalmoscope


1
Department of Ophthalmology, Kagoshima University Graduate School of Medical and Dental Sciences, Kagoshima 890-8544, Japan
2
Kagoshima Sonoda Eye & Plastic Surgery Clinic, Kagoshima 890-0053, Japan
*
Author to whom correspondence should be addressed.
J. Clin. Med. 2021, 10(4), 718; https://doi.org/10.3390/jcm10040718
Submission received: 19 December 2020
/
Revised: 5 February 2021
/
Accepted: 9 February 2021
/
Published: 11 February 2021
(This article belongs to the Special Issue Vitreo-Retinal Disorders: Pathogenesis, Diagnosis and Therapies)
Abstract
:Scanning laser ophthalmoscopes (SLOs) have been available since the early 1990s, but they were not commonly used because their advantages were not enough to replace conventional color fundus photography. In recent years, color SLOs have improved significantly, and the colored SLO images are obtained by combining multiple SLO images taken by lasers of different wavelengths. A combination of these images of different lasers can create an image that is close to that of the real ocular fundus. One advantage of the advanced SLOs is that they can obtain images with a wider view of the ocular fundus while maintaining a high resolution even through non-dilated eyes. The current SLOs are superior to the conventional fundus photography in their ability to image abnormal alterations of the retina and choroid. Thus, the purpose of this review was to present the characteristics of the current color SLOs and to show how that can help in the diagnosis and the following of changes after treatments. To accomplish these goals, we will present our findings in patients with different types of retinochoroidal disorders.
1. Introduction
Examinations of the ocular fundus by ophthalmoscopy has been performed since the invention of the ophthalmoscope in 1851 and recording the color fundus photographs was introduced around 1920. Since then, color fundus photography has been used as a documenting device, and the photographs have been used for diagnosing not only ocular but also systemic disorders, e.g., arterial sclerosis, diabetes. [1,2] Color fundus photography has become indispensable for public health assessments including its use in health examinations, clinical practice, and research. However, color fundus photography has limitations such as the image quality being dependent on the pupil diameter, susceptibility to opacities of the media, and a narrow field of view of about 50°.
Scanning laser ophthalmoscopes (SLOs) with multiple laser wavelength sources, or “color SLOs”, were developed by several companies. The characteristics of these color SLOs include the use of multiple wavelength lasers as the light source, confocal technology, and advances in their image acquisition abilities. These improvements have made it possible to obtain clearer fundus images than conventional color fundus photographs. However, there have not been many clinical studies or reviews regarding the advantages and disadvantages of color SLOs.
Thus, the purpose of this review was to present the features of the more recent color SLOs in detail. To accomplish this, we will present the SLO findings in cases of retinal disorders.
1.1. History of SLOs
The SLO was first reported as a “Flying spot TV ophthalmoscope” by Webb et al. in 1980 [3]. In clinical practice, the Rodenstock SLO (SLO-101, Rodenstock, Munich, Germany) was introduced in 1990. This instrument used four wavelengths lasers and had a minimum resolution of 10 to 15 μm, which was similar to that of recent color SLOs. In addition, it was used not only as a fundus imaging device but also used as a fluorescein angiography (FA) [4,5] fundus autofluorescence (FAF) imaging [6], and blood flow measurement [7,8] and perimetry [9,10] device. However, it was not widely used because of its inferiority to the conventional fundus cameras in terms of resolution, physical size, and price.
The first widely used SLO instrument was the Heidelberg Retina Angiograph, the HRA (Heidelberg Engineering, Heidelberg, Germany), which used a high-powered laser and highly sensitive detectors with a smaller confocal aperture than conventional SLOs. This made it possible to record clear images during FA [11]. It was also possible to perform indocyanine green fundus angiography (ICGA) at the same time. Thus, HRA is still used worldwide, especially for the diagnosis of age-related macular degeneration (AMD) where the FA and ICGA findings are crucial [12].
1.2. Recent Advances of Color SLO
The third boom for SLO as an ocular fundus imaging device started in 2013 by the introduction of the SPECTRALIS MultiColor SLO created by Heidelberg Engineering [13]. One advantage of this device was its excellent image quality, which was proven in fundus angiography. In addition, it could be installed together with the HRA and it introduced a new method of combining color images from the images obtained by three different wavelength laser sources. Subsequently, different companies launched new SLOs, e.g., Mirante (Nidec, Gamagori, Japan) and CLARUS (Carl Zeiss Meditec Inc., Dublin, CA, USA). The ultra-widefield fundus camera (Optos PLC, Dunfermline, UK) was released in 2011 and is also an SLO that can record a pseudocolored fundus image with lasers of red and green wavelengths. [14]. In addition, a confocal light-emitting diode-based retinal imaging system (Eidon, Centervue, Padova, Italy), which is a similar concept with the color SLO, was also launched [15,16].
1.3. Characteristics of New SLO Devices
There are several characteristics of the new SLO devices that make them more helpful for ophthalmologists. First, color SLOs can obtain clearer ocular fundus images than conventional fundus cameras even from non-dilated eyes. The conventional fundus cameras record a fundus image by using a flash-lamp source containing different wavelengths, and the film or detector receives the light reflected from the ocular structures. The images taken by conventional fundus cameras are degraded by media opacities, pupillary diameter, and cataracts. In normal, non-dilated eyes, the amount of light entering the eye is reduced, which makes it more difficult to obtain bright and clear images (Figure 1).
SLO uses laser light sources that scan a small area of the ocular fundus at high speed, and the reflected light signal is detected by a recording device. In principle, the laser beam irradiates the fundus of the eye through the same area of the pupil plane so a clear image can be obtained without mydriasis (Figure 1). In addition, lasers with longer wavelengths are less susceptible to corneal opacities and cataracts, and they can record clearer fundus images than conventional fundus cameras in eyes with media opacities (Figure 2).
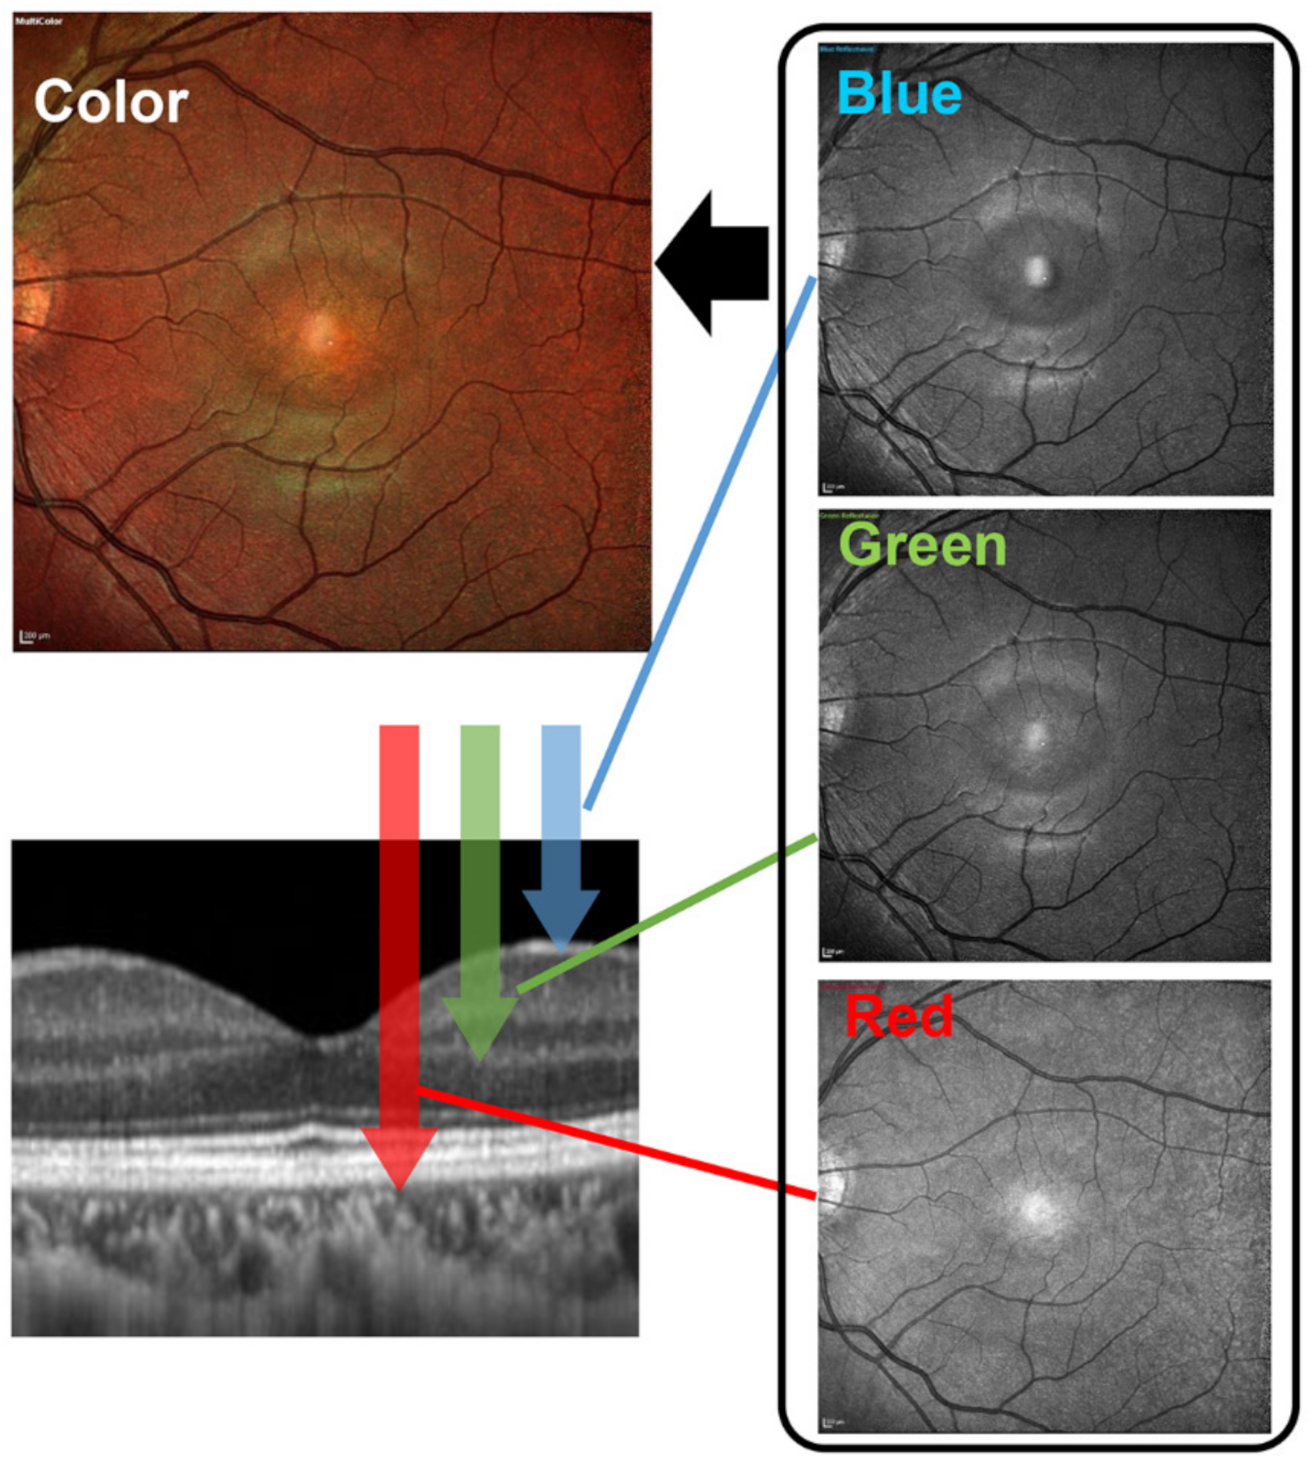
Second, color SLOs can obtain better quality fundus images than conventional fundus cameras. Unlike the conventional fundus camera that uses a light source containing different wavelengths, the recently introduced color SLOs use lasers of two or three different wavelengths to obtain an image of the ocular fundus. Each wavelength reaches a different layer of the retina (Figure 3). The short wavelengths (blue) produce images of the superficial layer of the retina, the intermediate wavelengths (green) produce images of the intermediate layers, and long wavelengths (red) produce images of the deeper layer of the retina. Importantly, each wavelength produces a distinctive image of the different layers of the retina [13]. The width of a scan is about 10 μm but varies with the model [17]. This is about the same as the 6 × 6 mm scan of recent Optical coherence tomography (OCT) devices, making it possible to record changes in a small area. The color SLO superimposed images of those taken by each wavelength are not only of better image quality but also provide more information at different depths in the retina than conventional fundus cameras.
Finally, color SLO can obtain images of a larger area of ocular fundus than conventional fundus cameras. If a larger area of the fundus is needed with color fundus camera, a montage of images obtained from multiple shots can be done. However, this requires the patient to move their eyes, which can be difficult in the elderly patients, montage requires specialized software, and the creation of images takes a lot of manpower and time (Figure 4A).
Recent SLO devices have replaceable lenses that can be used to obtain wider angle images and an automatic image montage function that makes wide-angle imaging easier (Figure 5A). In addition, the SLO devices from Optos can produce ultra-widefield fundus images by taking advantage of the features of SLO of two wavelengths (Figure 5B). The widefield fundus images of a healthy eye taken with the Mirante and Optos California are shown in Figure 5.
2. Recent Clinical Studies Using Color SLOs and the Effects on Clinical Practice
In recent years, a number of studies have demonstrated the usefulness of color SLO in diagnosing and treating retinal diseases. In the AMD-related findings, geographic atrophy [18], polypoidal choroidal vasculopathy [19], subretinal fluid, and photoreceptor layer loss were reported to be recorded more clearly in the color SLO images than conventional color fundus photographs [13,19]. In central serous chorioretinopathy, color SLO was not only able to demonstrate the subretinal fluid more clearly than in the color fundus photographs recorded with the conventional cameras, but also to confirm the leakage points in about 90% of the cases compared to about 30% in the conventional fundus photographs. These findings indicate the usefulness of color SLO [20]. Govindahari et al. compared the findings of color SLO and autofluorescence in detecting macular telangiectasia. They found that the fundus findings related to Mactel, such as retinal crystals, retinal atrophy, intraretinal pigment hyperplasia, and retinal pigment epithelium (RPE) atrophy, which only appeared as hyperfluorescence or hypofluorescence in the FAF images, were recorded with specific and discriminative findings in the color SLO images [21].
As described, color SLO is helpful in detecting abnormal findings in eyes with retinal diseases. Furthermore, some reports have investigated how it is applied in clinical ophthalmology. For example, the authors found that epiretinal membrane (ERM) findings were not only clearly displayed in the color SLO images, but also that medical residents were able to determine ERM findings with high detection rates similar to that of retinal specialists [17]. In addition, Zhang et al. reported that they were able to shorten the time for ERM peeling and improve the outcomes by simulating the surgery using color SLO before the actual surgery [22].
3. Representative Cases
We will present ocular fundus photographs of representative retinal disorders that clearly depict the alterations of the retina as seen in the color SLO images.
3.1. Retinal Nerve Fiber Layer (RNFL) Defects
Defects in the retinal nerve fiber layer are the pathological findings in glaucomatous optic neuropathy, and these defects can precede the changes in the optic disc and visual field [26]. Thus, the detection of RNFL defects can be a diagnostic tool for early glaucoma [27,28].
The ocular fundus of Asian eyes has an orange-colored appearance and RNFL defects have a brown tone. Thus, defects in the RNFL tend to be missed in Asians due to the low contrast between them and the surrounding retina. The images obtained by the SLO with blue wavelength laser light is helpful and easier for detecting the RNFL defects [29]. The RNFL defects are relatively difficult to detect in the images obtained by conventional fundus photography, as seen in a representative case in Figure 4 and Figure 6. The authors reported that they detected the RNFL defects from the color SLO images in patients with retinal diseases who had no glaucomatous changes in the optic nerve in the images obtained by the conventional fundus photography [29]. Such conclusions were confirmed in cases of AMD, macular hole after vitrectomy, and microaneurysms (MAs) after photocoagulation.
3.2. Epiretinal Membrane (ERM)
An ERM is another relatively common disorder that can be clearly seen in color SLO images even though the ERM is not visible in the conventional fundus photographs [17,18]. Although color SLO images tend to focus on color images composed of images of a single wavelength, our study found that the fibrotic membranes of ERMs were more visible in short wavelength images in green and blue, which provided greater contrast with the background (Figure 7) [17]. On the other hand, the retinal fold component was more prominent in the red wavelength SLO images and also in the combined color images. The retinal folds, which are superficial retinal findings, are believed to “show up” in the red wavelength images, which images the structures in the deeper retinal layers. Color SLO images are useful for non-retina specialists to see the findings of ERMs and for an explanation of the disorder to patients.
4. Retinal Capillary Microaneurysms
Retinal capillary microaneurysms (MAs) are usually the first visible sign of diabetic retinopathy. MAs are identified by ophthalmoscopy as red dots varying from 25 μm to 100 μm in diameter. They are commonly found in the posterior pole of the eye [30]. MAs have been recorded in either a green-red, a red, or a green pattern in composite images of color SLO images [31]. Although the first choice of treatment for diabetic macular edema (DME) is anti-vascular endothelial growth factor (VEGF) drugs, laser photocoagulation of MA is useful in resolving the retinal edema that is caused by MAs [32]. Although the gold standard for detecting MAs is FA, patients with MAs are more likely to have systemic diseases, such as diabetes and hypertension, and it is difficult to perform FA frequently on them. The detection of MAs by color SLO is easier than by conventional fundus cameras, and it is helpful in using color SLO images for direct coagulation of MAs (Figure 8).
4.1. Retinal Vein Occlusion (RVO)
A RVO is caused by the blockage of a branch of a retinal vein, which leads to retinal hemorrhages, occasionally subretinal hemorrhages, and macular edema. Branch retinal vein occlusion (BRVO) is easy to diagnose by conventional fundus photographs because of the presence of retinal hemorrhages. Color SLO images can further distinguish between the presence of macular edema and retinal and subretinal hemorrhages (Figure 9). In chronic-stage BRVO, it is easier to distinguish the whitening of the blood vessels and non-perfused areas that are darker in the SLO images recorded with blue wavelengths than that in the conventional fundus photographs.
4.2. Central Serous Chorioretinopathy (CSC)
CSC is a retinochoroidal disorder that is associated with a serous retinal detachment (SRD) in the macula. CSC is now widely considered to be one of the pachychoroidal disorders [30]. The detection of an SRD is important to correctly diagnose CSC because the absence of SRD is now considered a pachychoroid pigment epitheliopathy [33]. Although conventional fundus photographs can be used to detect the SRD at the fovea, CSC can occasionally be missed because the color difference at the site of the SRD is not so sharp. CSC is relatively easy to diagnose in the color SLO images because the color changes in the area associated with the SRD is larger than that seen in the conventional fundus photographs (Figure 10).
4.3. Age-Related Macular Degeneration and Other Acquired Macular Conditions
Color SLO imaging is also helpful in identifying AMD because the pathological changes are present in the retinal pigment epithelium and the choroid. Thus, images obtained with red wavelengths, which are simultaneously taken with OCT scan, are helpful in detecting the abnormal findings in patients with AMD and other acquired macular conditions. [34,35] The choroidal vascular network and pigment epithelial detachments can be seen in the images taken by red wavelength and merged color SLO images, while these findings are undetectable in the conventional fundus photographs (Figure 11).
5. Conclusions
We concluded that color SLO images will be of great help for clinicians because it allows various ocular fundus findings to be seen in a single en face image. The quality of the image is better and is larger. The color SLO images incorporate information at different retinal depths and, once the examinee becomes accustomed to them, it is possible to detect less obvious pathological findings, which are difficult to detect in conventional fundus photographs. In the future, it may be possible to reduce the risk of missing abnormal findings and improve the efficiency of medical care by taking color SLO images without mydriasis for diagnosis before a detailed examination and then including the appropriate tests (Figure 11).
Most of the studies using color SLO have reported higher rates of detection of retinal abnormalities compared to conventional color fundus photographs. In addition, there are also reports of clinical contributions by enabling the making of a correct diagnosis by non-specialists [17] and improving surgical performances [22]. Recently, there has been a lot of research on artificial intelligence (AI) using fundus photographs, OCT, and OCT angiography images [36,37,38,39,40], and there is a highly likelihood that color SLO, which has high image quality with a large amount of information, will be useful for this kind of automatic diagnosis by AI. Indeed, preliminary studies using AI and color SLO have been reported [16,41,42].
It will be necessary to assess whether the results will be superior to those of AI diagnosis using conventional fundus photographs and whether they will contribute to the clarification and finding of new pathological changes in retinochoroidal diseases.
Author Contributions
Conceptualization: H.T. and S.S.; data collection: H.T. and M.T.; interpretation of data: H.T., S.S., and T.S.; writing—original draft preparation: H.T. and M.T.; writing—review and editing: S.S. and T.S.; supervision: T.S. All authors have read and agreed to the published version of the manuscript.
Funding
This study was supported in part by JSPS KAKENHI grant number 18H02957.
Institutional Review Board Statement
Ethical review and approval were not applicable for the current review.
Informed Consent Statement
Informed consent is not applicable for this review.
Data Availability Statement
No new data were created or analyzed in this study. Data sharing is not applicable to this article.
Acknowledgments
The authors thank Duco Hamasaki of the Bascom Palmer Eye Institute of the University of Miami for providing critical discussions and suggestions to our study and revision of the final manuscript. Some figures (Figure 1, Figure 5, Figure 6, and Figure 11) in this manuscript were partly modified and used from the figures in “Rinsho Ganka 75(1):11–19, 2021”, which was written by authors (H.T. and S.S.). The use of the figures was approved by the office (IGAKU-SHOIN Ltd. Tokyo, Japan).
Conflicts of Interest
None of the authors has any conflict of interest in any materials, software, or methods in this manuscript.
References
- Hyman, B.N. The Eye as a Target Organ: An Updated Classification of Hypertensive Retinopathy. J. Clin. Hypertens. 2000, 2, 194–197. [Google Scholar]
- Wilkinson, C.P.; Ferris, F.L., III; Klein, R.E.; Lee, P.P.; Agardh, C.D.; Davis, M.; Dills, D.; Kampik, A.; Pararajasegaram, R.; Verdaguer, J.T.; et al. Proposed international clinical diabetic retinopathy and diabetic macular edema disease severity scales. Ophthalmology 2003, 110, 1677–1682. [Google Scholar] [CrossRef]
- Webb, R.H.; Hughes, G.W.; Pomerantzeff, O. Flying spot TV ophthalmoscope. Appl. Opt. 1980, 19, 2991–2997. [Google Scholar] [CrossRef]
- Gabel, V.P.; Birngruber, R.; Nasemann, J. Das Scanning-Laser-Ophthalmoscope und seine Anwendung als Fluoreszenzangiogrpahie-Gerät [The scanning laser ophthalmoscope and its use as a fluorescein angiography instrument]. Fortschr. Ophthalmol. 1988, 85, 569–573. [Google Scholar] [PubMed]
- Scheider, A.; Schroedel, C. High resolution indocyanine green angiography with a scanning laser ophthalmoscope. Am. J. Ophthalmol. 1989, 108, 458–459. [Google Scholar] [CrossRef]
- Wolf, S. Recent developments in scanning laser ophthalmoscopy. Dev. Ophthalmol. 1997, 29, 1–7. [Google Scholar]
- Tanaka, T.; Muraoka, K.; Shimizu, K. Fluorescein fundus angiography with scanning laser ophthalmoscope. Visibility of leukocytes and platelets in perifoveal capillaries. Ophthalmology. 1991, 98, 1824–1829. [Google Scholar] [CrossRef]
- Wolf, S.; Arend, O.; Toonen, H.; Bertram, B.; Jung, F.; Reim, M. Retinal capillary blood flow measurement with a scanning laser ophthalmoscope. Preliminary results. Ophthalmology 1991, 98, 996–1000. [Google Scholar] [CrossRef]
- Timberlake, G.T.; Mainster, M.A.; Webb, R.H.; Hughes, G.W.; Trempe, C.L. Retinal localization of scotomata by scanning laser ophthalmoscopy. Investig. Ophthalmol. Vis. Sci. 1982, 22, 91–97. [Google Scholar]
- Sunness, J.S.; Schuchard, R.A.; Shen, N.; Rubin, G.S.; Dagnelie, G.; Haselwood, D.M. Landmark-driven fundus perimetry using the scanning laser ophthalmoscope. Investig. Ophthalmol. Vis. Sci. 1995, 36, 1863–1874. [Google Scholar]
- Hassenstein, A.; Meyer, C.H. Clinical use and research applications of Heidelberg retinal angiography and spectral-domain optical coherence tomography—A review. Clin. Exp. Ophthalmol. 2009, 37, 130–143. [Google Scholar] [CrossRef]
- Desmettre, T.; Devoisselle, J.M.; Mordon, S. Fluorescence properties and metabolic features of indocyanine green (ICG) as related to angiography. Surv. Ophthalmol. 2000, 45, 15–27. [Google Scholar] [CrossRef]
- Tan, A.C.; Fleckenstein, M.; Schmitz-Valckenberg, S.; Holz, F.G. Clinical Application of Multicolor Imaging Technology. Ophthalmologica 2016, 236, 8–18. [Google Scholar] [CrossRef] [PubMed]
- Nagiel, A.; Lalane, R.A.; Sadda, S.R.; Schwartz, S.D. Ultra-Widefield Fundus Imaging: A Review of Clinical Applications and Future Trends. Retina 2016, 36, 660–678. [Google Scholar] [CrossRef]
- Olvera-Barrios, A.; Heeren, T.F.; Balaskas, K.; Chambers, R.; Bolter, L.; Tufail, A.; Egan, C.E.; Anderson, J. Comparison of true-colour wide-field confocal scanner imaging with standard fundus photography for diabetic retinopathy screening. Br. J. Ophthalmol. 2020, 104, 1579–1584. [Google Scholar] [CrossRef] [PubMed]
- Olvera-Barrios, A.; Heeren, T.F.; Balaskas, K.; Chambers, R.; Bolter, L.; Egan, C.; Tufail, A.; Anderson, J. Diagnostic accuracy of diabetic retinopathy grading by an artificial intelligence-enabled algorithm compared with a human standard for wide-field true-colour confocal scanning and standard digital retinal images. Br. J. Ophthalmol. 2021, 105, 265–270. [Google Scholar] [CrossRef]
- Terasaki, H.; Sonoda, S.; Shiihara, H.; Kakiuchi, N.; Funatsu, R.; Shirasawa, M.; Sakamoto, T. More Effective Screening for Epiretinal Membranes with Multicolor Scanning Laser Ophthalmoscope than with Color Fundus Photographs. Retina 2020, 40, 1412–1418. [Google Scholar] [CrossRef]
- Graham, K.W.; Chakravarthy, U.; Hogg, R.E.; Muldrew, K.A.; Young, I.S.; Kee, F. Identifying Features of Early and Late Age-Related Macular Degeneration: A Comparison of Multicolor Versus Traditional Color Fundus Photography. Retina 2018, 38, 1751–1758. [Google Scholar] [CrossRef] [PubMed]
- Tan, A.C.S.; Yanagi, Y.; Cheung, G.C.M. Comparison of Multicolor Imaging and Color Fundus Photography in the Detection of Pathological Findings in Eyes with Polypoidal Choroidal Vasculopathy. Retina 2020, 40, 1512–1519. [Google Scholar] [CrossRef]
- He, L.; Chen, C.; Yi, Z.; Wang, X.; Liu, J.; Zheng, H. Clinical Application of Multicolor Imaging in Central Serous Chorioretinopathy. Retina 2020, 40, 743–749. [Google Scholar] [CrossRef]
- Govindahari, V.; Fraser-Bell, S.; Ayachit, A.G.; Invernizzi, A.; Nair, U.; Nair, D.V.; Lupidi, M.; Singh, S.R.; Rajendran, A.; Zur, D.; et al. Multicolor imaging in macular telangiectasia-a comparison with fundus autofluorescence. Graefes. Arch. Clin. Exp. Ophthalmol. 2020, 258, 2379–2387. [Google Scholar] [CrossRef]
- Zhang, Z.; Li, M.; Sun, Y.; Wei, Y.; Zhang, S. Multicolor Scanning Laser Ophthalmoscopy Strengthens Surgeons′ Preoperative Decision-Making and Intraoperative Performance on Epiretinal Membrane. Transl. Vis. Sci. Technol. 2020, 9, 36. [Google Scholar] [CrossRef]
- Ajlan, R.S.; Barnard, L.R.; Mainster, M.A. NONCONFOCAL ULTRA-WIDEFIELD SCANNING LASER OPHTHALMOSCOPY: Polarization Artifacts and Diabetic Macular Edema. Retina 2020, 40, 1374–1378. [Google Scholar] [CrossRef]
- Pang, C.E.; Freund, K.B. Ghost maculopathy: An artifact on near-infrared reflectance and multicolor imaging masquerading as chorioretinal pathology. Am. J. Ophthalmol. 2014, 158, 171–178.e2. [Google Scholar] [CrossRef]
- Feng, H.L.; Sharma, S.; Stinnett, S.; Asrani, S.; Mruthyunjaya, P. Characterization of Artifacts Associated With Multicolor Confocal Scanning Laser Ophthalmoscopy. Ophthalmic Surg. Lasers Imaging Retina. 2017, 48, 810–815. [Google Scholar] [CrossRef] [PubMed]
- Tuulonen, A.; Lehtola, J.; Airaksinen, P.J. Nerve fiber layer defects with normal visual fields. Do normal optic disc and normal visual field indicate absence of glaucomatous abnormality? Ophthalmology 1993, 100, 587–598. [Google Scholar] [CrossRef]
- Leung, C.K.-S.; Medeiros, F.A.; Zangwill, L.M.; Sample, P.A.; Bowd, C.; Ng, D.; Cheung, C.Y.L.; Lam, D.S.C.; Weinreb, R.N. American Chinese glaucoma imaging study: A comparison of the optic disc and retinal nerve fiber layer in detecting glaucomatous damage. Investig. Ophthalmol. Vis. Sci. 2007, 48, 2644–2652. [Google Scholar] [CrossRef] [Green Version]
- Medeiros, F.A.; Vizzeri, G.; Zangwill, L.M.; Alencar, L.M.; Sample, P.A.; Weinreb, R.N. Comparison of retinal nerve fiber layer and optic disc imaging for diagnosing glaucoma in patients suspected of having the disease. Ophthalmology 2008, 115, 1340–1346. [Google Scholar] [CrossRef] [Green Version]
- Terasaki, H.; Sonoda, S.; Kakiuchi, N.; Shiihara, H.; Yamashita, T.; Sakamoto, T. Ability of MultiColor scanning laser ophthalmoscope to detect non-glaucomatous retinal nerve fiber layer defects in eyes with retinal diseases. BMC Ophthalmol. 2018, 18, 324. [Google Scholar] [CrossRef]
- Wiley, H.E.; Ferris, F.L. Nonproliferative Diabetic Retinopathy, Ryan's Retina, 5th ed.; Elsevier: Amsterdam, The Netherlands, 2013; pp. 940–968. [Google Scholar]
- Arrigo, A.; Teussink, M.; Aragona, E.; Bandello, F.; Battaglia Parodi, M. MultiColor imaging to detect different subtypes of retinal microaneurysms in diabetic retinopathy. Eye 2021, 35, 277–281. [Google Scholar] [CrossRef] [PubMed]
- Hirano, T.; Toriyama, Y.; Iesato, Y.; Imai, A.; Hirabayashi, K.; Nagaoka, T.; Takamura, Y.; Sugimoto, M.; Murata, T. Effect of leaking perifoveal microaneurysms on resolution of diabetic macular edema treated by combination therapy using anti-vascular endothelial growth factor and short pulse focal/grid laser photocoagulation. Jpn. J. Ophthalmol. 2017, 61, 51–60. [Google Scholar] [CrossRef] [PubMed]
- Cheung, C.M.G.; Lee, W.K.; Koizumi, H.; Dansingani, K.; Lai, T.Y.Y.; Freund, K.B. Pachychoroid disease. Eye 2019, 33, 14–33. [Google Scholar] [CrossRef] [Green Version]
- Casalino, G.; Arrigo, A.; Introini, U.; Scialdone, A.; Coppola, M.; Bandello, F.; Chakravarthy, U.; Parodi, M.B. Clinical Course of Treated Choroidal Neovascularization in Eyes with Pre-existing Geographic Atrophy: Case Series and Reappraisal of the Literature. Curr. Eye. Res. 2020, 1–7. [Google Scholar] [CrossRef] [PubMed]
- Casalino, G.; Arrigo, A.; Romano, F.; Munk, M.R.; Bandello, F.; Parodi, M.B. Acute macular neuroretinopathy: Pathogenetic insights from optical coherence tomography angiography. Br. J. Ophthalmol. 2019, 103, 410–414. [Google Scholar] [CrossRef] [PubMed]
- Grzybowski, A.; Brona, P.; Lim, G.; Ruamviboonsuk, P.; Tan, G.S.W.; Abramoff, M.; Ting, D.S.W. Artificial intelligence for diabetic retinopathy screening: A review. Eye 2020, 34, 451–460. [Google Scholar] [CrossRef]
- Moraru, A.D.; Costin, D.; Moraru, R.L.; Branisteanu, D.C. Artificial intelligence and deep learning in ophthalmology—present and future (Review). Exp. Ther. Med. 2020, 20, 3469–3473. [Google Scholar]
- Ting, D.S.W.; Pasquale, L.R.; Peng, L.; Campbell, J.P.; Lee, A.Y.; Raman, R.; Tan, G.S.W.; Schmetterer, L.; Keane, P.A.; Wong, T.Y. Artificial intelligence and deep learning in ophthalmology. Br. J. Ophthalmol. 2019, 103, 167–175. [Google Scholar] [CrossRef] [Green Version]
- Shiihara, H.; Sakamoto, T.; Terasaki, H.; Kakiuchi, N.; Shinohara, Y.; Tomita, M.; Sonoda, S. Running pattern of choroidal vessel in en face OCT images determined by machine learning-based quantitative method. Graefes. Arch. Clin. Exp. Ophthalmol. 2019, 257, 1879–1887. [Google Scholar] [CrossRef]
- Yamashita, T.; Asaoka, R.; Terasaki, H.; Murata, H.; Tanaka, M.; Nakao, K.; Sakamoto, T. Factors in Color Fundus Photographs That Can Be Used by Humans to Determine Sex of Individuals. Transl. Vis. Sci. Technol. 2020, 9, 4. [Google Scholar]
- Ometto, G.; Montesano, G.; Afgeh, S.S.; Lazaridis, G.; Liu, X.; Keane, P.A.; Crabb, D.P.; Denniston, A.K. Merging Information From Infrared and Autofluorescence Fundus Images for Monitoring of Chorioretinal Atrophic Lesions. Transl. Vis. Sci. Technol. 2020, 9, 38. [Google Scholar] [CrossRef]
- Cavichini, M.; An, C.; Bartsch, D.-U.G.; Jhingan, M.; Amador-Patarroyo, M.J.; Long, C.P.; Zhang, J.; Wang, Y.; Chan, A.X.; Madala, S.; et al. Artificial Intelligence for Automated Overlay of Fundus Camera and Scanning Laser Ophthalmoscope Images. Transl. Vis. Sci. Technol. 2020, 9, 56. [Google Scholar] [CrossRef] [PubMed]
Figure 1.
Images of a fundus of a normal eye taken by a scanning laser ophthalmoscope (SLO, left) and a color fundus camera through a non-dilated pupil (CFP, right). The subject was a 35-year-old healthy man. The fundus photograph shows a darker area on the temporal side of the macula, while the SLO records a clearer image over a wider area than the fundus camera. The SLO image was taken with the Mirante. The figure was modified with permission from Rinsho Ganka 75(1):11–19, 2021.

Figure 2.
Comparison of color fundus photographs recorded with a conventional fundus camera to that obtained with a SLO device in patients with a cataract and poor mydriasis. (A) Fundus photograph of a 65-year-old man with poor mydriasis and cataracts. The color fundus photograph is blurred (B), but the ultra-widefield fundus images (Optos California, C) and color SLO (MultiColor, D) provide clearer images.

Figure 3.
Schematic diagram of the mechanism of color scanning laser ophthalmoscope. The color SLOs use two or three different wavelength light sources to obtain an image of the ocular fundus. Each wavelength reaches different layers of the retina. The short wavelengths (blue) produce images of the superficial layer of the retina, intermediate wavelengths (green) produce images of the intermediate layers, and long wavelengths (red) produce images of the deeper layers of the retina. Thus, each wavelength produces a distinctive image of the different layers of the retina. A full color SLO image can be obtained by merging the individual wavelength images.

Figure 4.
Comparisons of color fundus montage image and ultra-widefield SLO images. The images are of a 57-year-old woman undergoing treatment for normal tension glaucoma. A montage of color fundus photographs (A) provides a wider field image than the regular color SLO images (B: Mirante, D: MultiColor), but the image preparation was time consuming and required manpower. The ultra-widefield SLO images (C: Optos California) are even wider and can be recorded in a single imaging session. Note that the nerve fiber layer defect is more visible in the color SLO images (B,D) than in the color fundus photograph (A).

Figure 5.
Ultra-widefield images obtained by color SLO devices. The images from the same case as in Figure 1 were taken without mydriasis. The imaging device was Mirante in (A), which was used with permission from Rinsho Ganka 75(1):11–19, 2021, and Optos California in (B).
Figure 5.
Ultra-widefield images obtained by color SLO devices. The images from the same case as in Figure 1 were taken without mydriasis. The imaging device was Mirante in (A), which was used with permission from Rinsho Ganka 75(1):11–19, 2021, and Optos California in (B).

Figure 6.
Findings of a 65-year-old woman with open-angle glaucoma and age-related macular degeneration. The retinal nerve fiber layer (RNFL) defect is difficult to detect in the ocular fundus image obtained by a conventional fundus camera (A), but the defect is easily detected in the blue wavelength image obtained by color SLO (C, arrow head). Composite image of color SLO (B) and OCT thickness map (D). The color SLO image was obtained by a MultiColor. The figure was modified with permission from Rinsho Ganka 75(1):11–19, 2021.

Figure 7.
Fundus images of a 70-year-old woman with an ERM. Although the ERM is not clearly visible in the conventional color fundus photograph (A), it can be seen in the OCT images (B). In the color SLO images (C–F, MultiColor), the ERM membrane is visible in the blue wavelength (D) and green wavelength (E) images. The retinal folds are also visible in the merged color images (C) and red wavelength image (F).

Figure 8.
A case in which direct photocoagulation of microaneurysms (MAs) was performed with guidance from color SLO images. The patient was a 56-year-old woman with diabetic macular edema due to MAs. Prior to treatment, color SLO and retinal thickness map obtained by OCT B-scan were used to identify the MAs on the lateral side of the macula (A–C), and photocoagulation was performed (B, white arrows). One month after the treatment, the edema at the coagulation site was improved and hard exudates were reduced (D–F, red arrow). B and E are magnified images of the yellow square in A and D, respectively. Color SLO was taken with a MultiColor.

Figure 9.
Color SLO images of eyes with BRVO at the acute and chronic phase. BRVO is easy to diagnose by conventional fundus photographs because of the prominence of retinal hemorrhages (A). Color SLO images can further distinguish between the presence of macular edema and retinal and subretinal hemorrhages (B,C, white arrow). In chronic stage of BRVO, it is easy to distinguish the whitening of the blood vessels and non-perfused areas that are darker in the SLO images, especially with blue wavelength images (D,E, white dot circle). This is consistent with the nonperfused areas in fluorescein angiographic image (F). Color SLO was taken with a MultiColor.

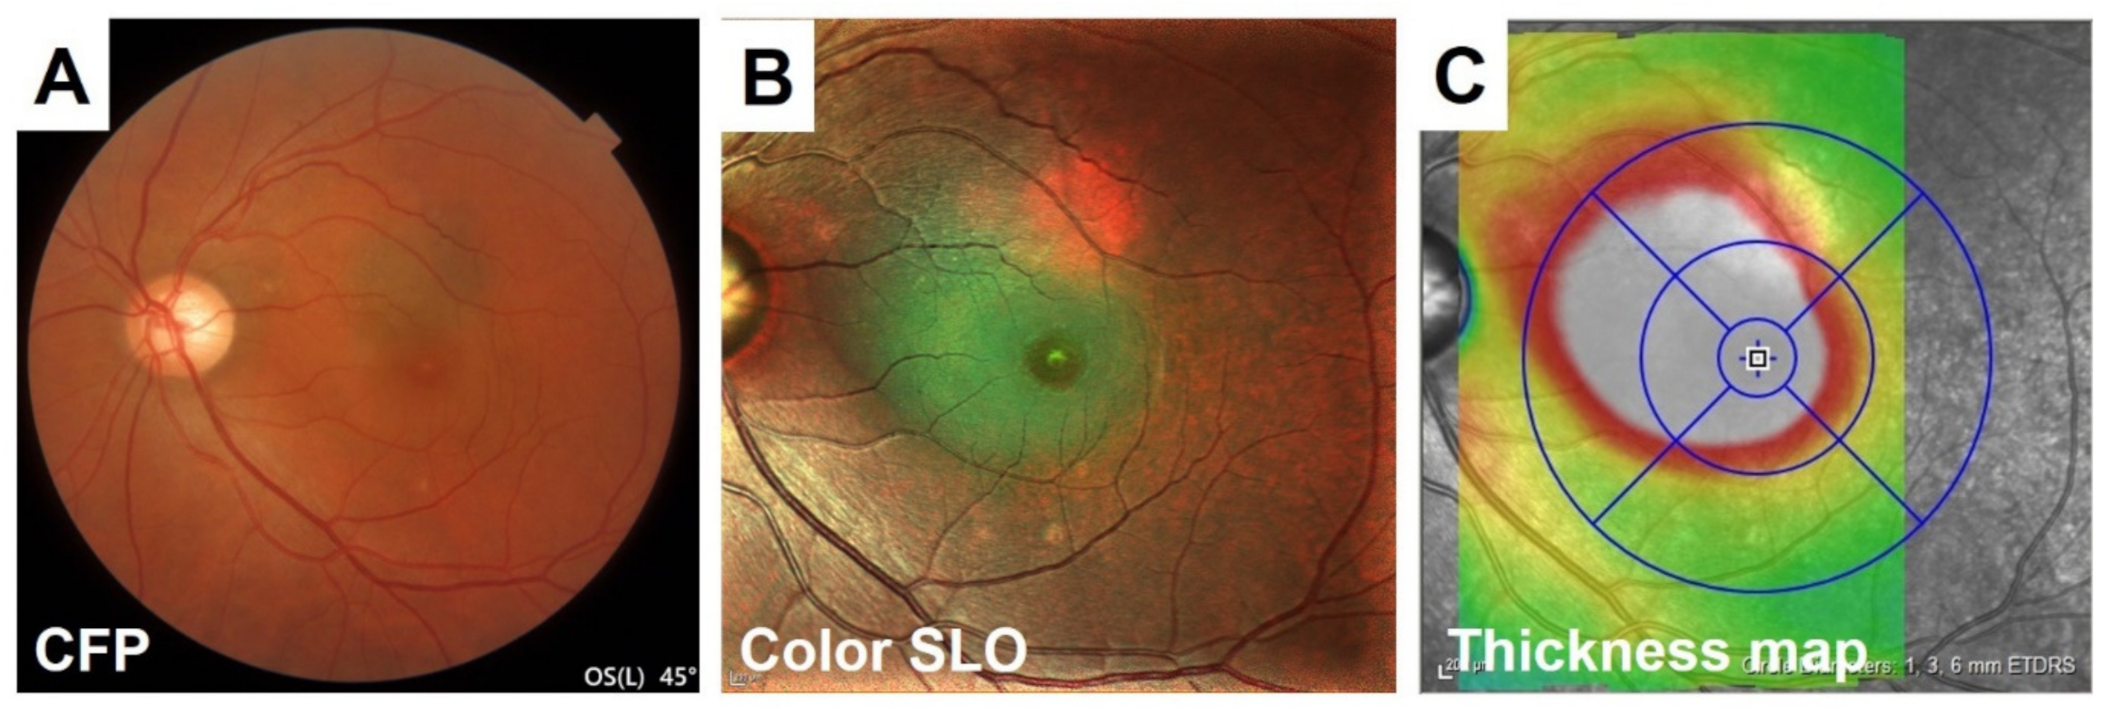
Figure 10.
Comparison of the detection of serous retinal detachment in a CSC patient between conventional color fundus photographs (CFP) and color SLO images. Although the conventional fundus photograph can detect the serous retinal detachment (SRD) at the fovea, it can sometimes be missed because the color change at the SRD site is not so sharp (A). It is relatively easy to diagnose CSC in the color SLO images because of the color change in the area associated with SRD, which is comparable with OCT thickness map and is larger than that of color fundus photographs (B,C). Color SLO was taken with MultiColor.

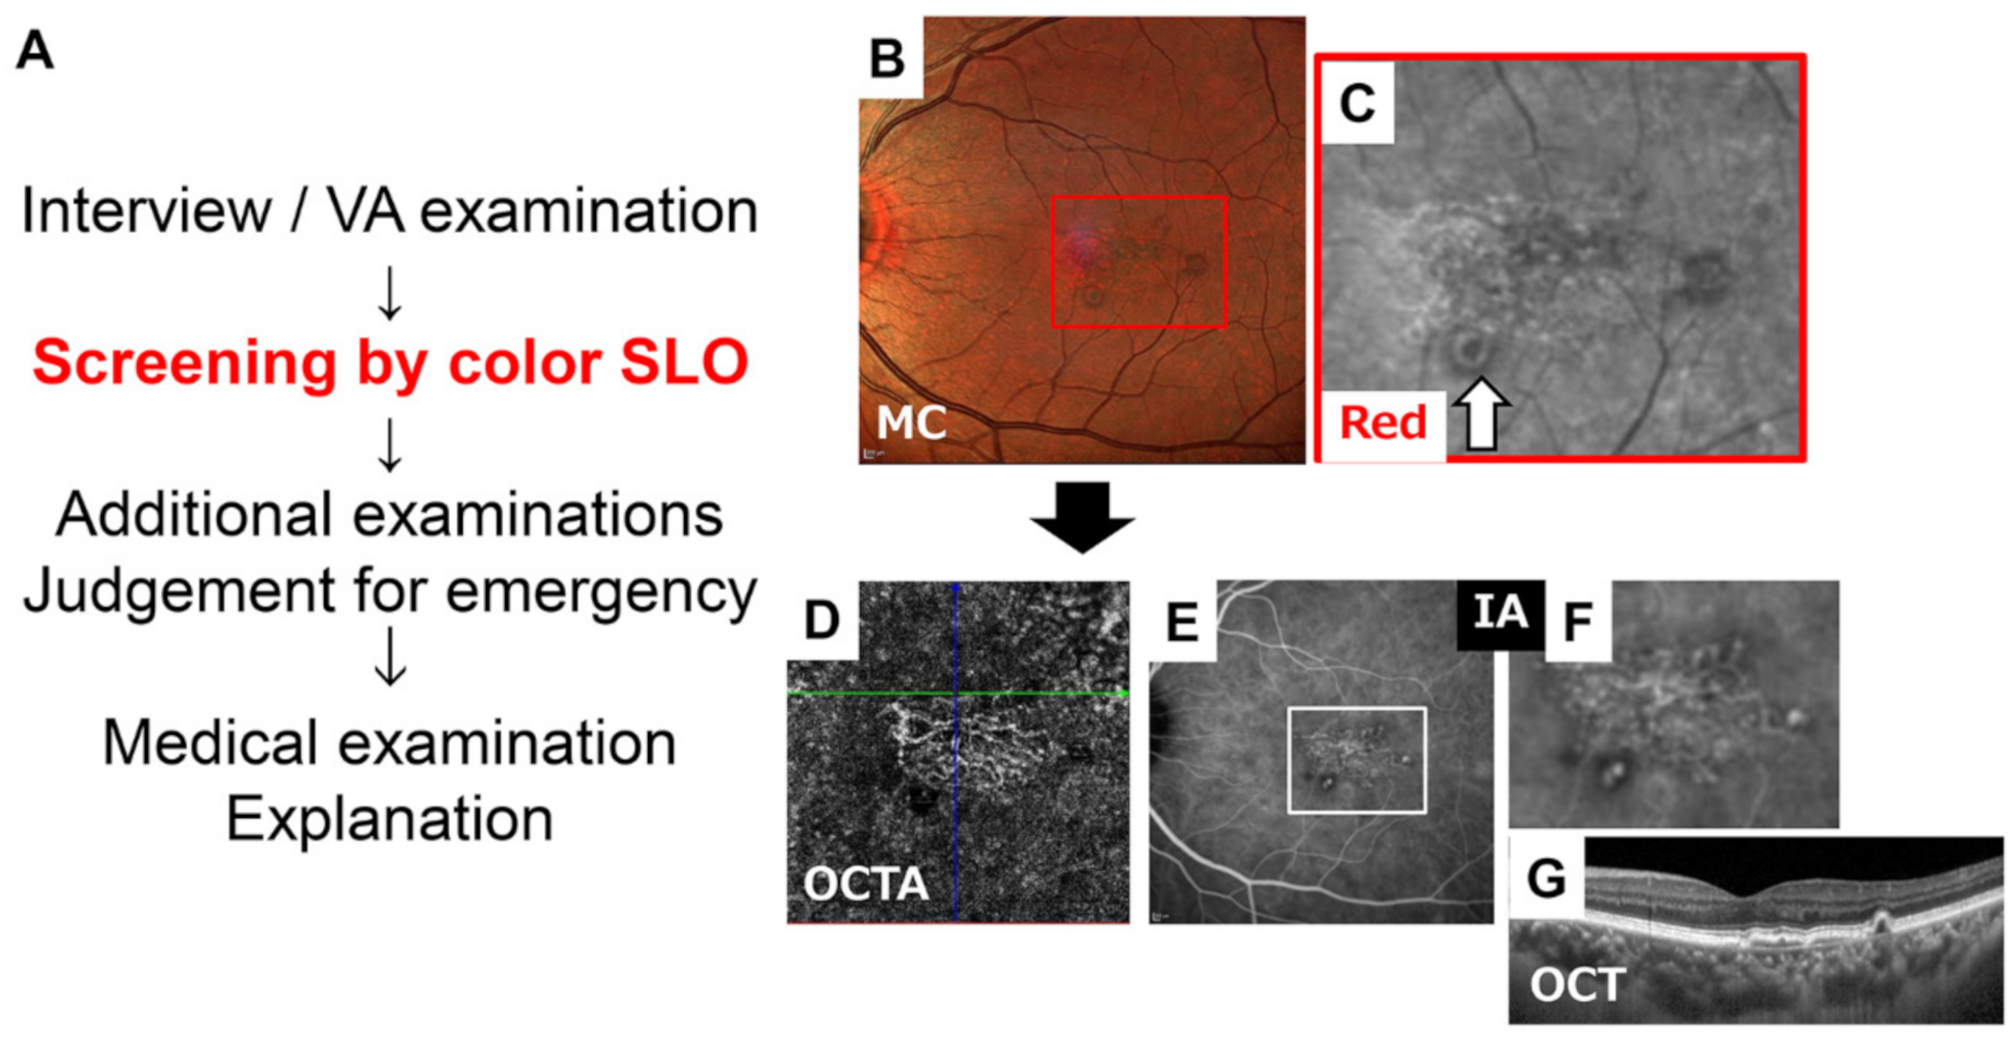
Figure 11.
Flowchart of outpatient care utilizing color SLO. Recording the color SLO without mydriasis in advance following the interview and minimal examination such as the visual acuity (VA) check will improve the efficiency of the examination (A). In this case of AMD, it is possible to diagnose this case as an AMD by color SLO image, especially in the red wavelength images that show the vascular network and suspected polyps (B,C). Then, the clinician can make plans of the next needed examinations. In this case, OCT angiography (D), indocyanine green angiography (E,F) and OCT B-scan around macular area with small interval (G) to validate the diagnosis were performed. (C) is a magnified red wavelength image of red square in (B). (F) is a magnified image of white square in (E). Color SLO was imaged with the MultiColor. The figure was modified with permission from Rinsho Ganka 75(1):11–19, 2021.

Publisher’s Note: MDPI stays neutral with regard to jurisdictional claims in published maps and institutional affiliations. |
© 2021 by the authors. Licensee MDPI, Basel, Switzerland. This article is an open access article distributed under the terms and conditions of the Creative Commons Attribution (CC BY) license (http://creativecommons.org/licenses/by/4.0/).
Share and Cite
MDPI and ACS Style
Terasaki, H.; Sonoda, S.; Tomita, M.; Sakamoto, T. Recent Advances and Clinical Application of Color Scanning Laser Ophthalmoscope. J. Clin. Med. 2021, 10, 718. https://doi.org/10.3390/jcm10040718
AMA Style
Terasaki H, Sonoda S, Tomita M, Sakamoto T. Recent Advances and Clinical Application of Color Scanning Laser Ophthalmoscope. Journal of Clinical Medicine. 2021; 10(4):718. https://doi.org/10.3390/jcm10040718
Chicago/Turabian StyleTerasaki, Hiroto, Shozo Sonoda, Masatoshi Tomita, and Taiji Sakamoto. 2021. "Recent Advances and Clinical Application of Color Scanning Laser Ophthalmoscope" Journal of Clinical Medicine 10, no. 4: 718. https://doi.org/10.3390/jcm10040718
Note that from the first issue of 2016, this journal uses article numbers instead of page numbers. See further details here.