Article

An Empirical Analysis of the Aircraft Emissions by Operating from Scheduled Flights within the Domestic Market in Spain

by
Antonio Martínez Raya
*,
Alejandro Segura de la Cal
and
Rafael Eugenio González Díaz
Department of Organizational Engineering, Business Administration and Statistics, Technical University of Madrid—Universidad Politécnica de Madrid (UPM), 28040 Madrid, Spain
*
Author to whom correspondence should be addressed.
Processes 2023, 11(3), 741; https://doi.org/10.3390/pr11030741
Submission received: 1 February 2023 / Revised: 20 February 2023 / Accepted: 27 February 2023 / Published: 2 March 2023
(This article belongs to the Special Issue Air Quality Monitoring for Smart Cities and Industrial Applications)

Abstract

:
Over the past 20 years, civil aviation has substantially reduced its environmental impact to augment sustainable transportation. In Spain, the domestic market has been habitually characterized by a few enterprises providing air transport services linked to scheduled flights on domestic corridors. Because of geographic diversity and the highly concentrated population characterizing this southern European country, many of them could not be supplied by alternative transport modes in terms of both time and distance by comparison with air transportation. For air quality monitoring from 139 national corridors, this paper aims to study related aviation emissions to conduct an economic analysis in terms of positive or negative externalities. For such purposes, the study focused on these domestic routes served by the five most important Spanish airports, specifically on the number of passengers transported from 2011 to 2020. Up to 10 aircraft types representing no more than 89% of regular operations on these flyways were subsequently identified. In addition, certain engine types also were selected as representatives to evaluate their emissions, depending on the great-circle distance in each route. The research findings, though particularly conditioned by aviation peculiarities of such a domestic market, point decisively to significant dependence upon emissions in connection with the seasonality of the demand and the concentration of flights with low occupancy indices from any one of them. Results suggest that airlines would benefit from operating turboprops instead of turbojets on selected routes, especially when oil prices are high. However, it is not always easy to find a balance between uncompromising economic profitability and effective fleet availability, since nowadays air transport undertakings tend to unify their fleets by using a few aircraft families, mostly powered by jet engines, apart from regional carriers.

1. Introduction

The civil aviation sector is a fundamental part of the planning process for developing sustainable transportation in the European Union (EU), according to one of the Sustainable Development Goals (SDGs), namely Goal 11. The so-called ‘European Green Deal’ has set up an action plan to combat climate change within the EU. With specific regard to the transportation sector and within the scope of EU’s Green Deal’s objectives, specifically, the ‘Fit for 55’ has been included in ambitious proposals to reduce related emissions by up to 55% by 2030 from two transport modes, both maritime and air. For carbon dioxide emissions from aviation, the Emissions Trading System (EU ETS) [1] has increasingly been used since 2005 as the principal instrument for calculating the EU’s total emissions through a system based on allowances (EUA) reporting from the European Union Transaction Log (EUTL). Indeed, to entail adjustments to EU climate legislation, the European Commission (hereafter the Commission) has recently amended ETS Directive [2].
Regarding greenhouse gas emissions from the European aviation sector, air transport has been facing both global warming and climate change and is considered a common priority nowadays for the entire industry within the EU framework on ETS. Over the past years, significant efforts have been made to promote the efficient use of airspace by optimizing flight operations and digitizing airline performance. For that purpose, the whole sector (manufacturers, carriers, airport infrastructure managers, and air navigation service providers) has worked towards this as their sole aim for more sustainable aviation. However, initial allocations of emission permits from the implementation of EU ETS should be continually reassessed and the necessary actions defined and revised to avoid the creation of regulatory trade barriers in the aviation sector [3]. Indeed, such a system has often been adapted to respond to the challenges of the European airline industry. More specifically, after the full inclusion of aviation in the EU ETS on 1 January 2012 [4] in accordance with those aviation activities concerned [5], there was a temporary derogation from the greenhouse gas emission allowance scheme [6], namely “Stop the Clock”, which gave concerned parties time to overcome the constraints arising from the prompt implementation of ETS-related penalty systems. Then, for 2013–2020, there was an application of the system with a narrow scope allowing airlines, among other special dispensations, to use a simplified methodology to report emissions annually of less than 3000 tons of CO2 per year on intra-community flights [7]. Lastly, regarding the emissions for the period 2021–2023, airlines concerned, according to EU ETS, must notify of their emissions by flights operated within the European Economic Area (EEA), in addition to those whose destination is any airport located either in the Swiss Confederation (hereafter, Switzerland) or the United Kingdom of Great Britain and Northern Ireland (hereafter, the United Kingdom) for the previous year every 28 February of the year following [8].
Since sprawled environments contribute to climate change directly and indirectly, due to the certain effects of transportation characteristics, among other factors [9], the air industry has often addressed the question of whether full decarbonization of aviation, using alternative energy sources, is actually practicable in the years to come before 2050. Unlike rail transport, the extensive use of aviation fuels for commercial flying based on renewable energy sources is currently not easy to achieve, as a sort of comprehensive technological solution for a partially optimized sustainable fuel is, for the time being, the only remedy available, including those based on Sustainable Aviation Fuel (SAF). In fact, using SAF in commercial airplanes is currently the most workable solution to mitigate aviation emissions by operating existing aircraft. One of the great assets of SAF is that it can be mixed with any fossil jet fuel to reduce emissions. It could even be beneficial for emissions compared to the baseline scenario where airlines only use conventional jet fuel based on simulations made with the Fleet-Level Environmental Evaluation Tool (FLEET) [10]. However, a solution relying entirely on SAF seems to be a temporary arrangement, since there are still unresolved issues regarding their availability problems and production costs. In addition, alternative energy sources, either through electric or hydrogen engines, cannot completely replace carbon-based fuels in the aviation sector. Nevertheless, promoting the research effort in sustainable alternative fuels for aviation is essential, albeit not sufficient. Building on this basis, the challenge now is how to reduce the impact of commercial flights on public transportation by using affordable and sustainable fuels and operating efficient fleets. Without restricting demand, this is unlikely in terms of emission stabilization at levels consistent with risk-averse climate targets [11]. Research in this field has become even more important as time has gone by, since the question is raised as to the feasibility of supplying domestic short-haul air routes that are sensitive to mitigating climate change through real actions towards sustainability. The present paper aims at achieving precisely that objective, thereby contributing to a knowledge of such an important issue and the search for possible solutions. On one hand, there are precisely framed sectorial matters on aviation-related issues. On the other hand, there is a rather vague global technological order on the current dependence on fossil fuels and moving toward complete decarbonization by 2050, or even earlier.

2. Conceptual Research Framework

As pointed out earlier, it has been wondered whether aviation emissions from domestic scheduled flights can be only reduced by operating more effective aircraft or, failing that, whether further types of real actions, either technical or operational, may be necessary for this matter. To that end, the research has been focused on those flights operating from the most representative airports in Spain. Hence, the study was designed under a mixed approach from a conceptual framework created to find answers to the research question. On one hand, the selection of a primary source for data collection to be properly applied to the study is necessary. On the other hand, an empirical analysis with timely and trusted data for the purpose of contributing to a better understanding of the research scope, not only in terms of emissions, but also concerning fuel consumption, thus affecting variable costs of airlines, is also necessary. From a sectorial perspective, promoting lower emissions among carriers creates a sustainable business culture and efficient mobility. At the same time, stakeholders in the air transport system have been facing several uncertainties, casting a shadow on the economic prospects of the aviation sector. Fleet diversification can be a great ally for airlines in dealing with periodical market swings, whether due to seasonal demand (i.e., tourism) or unexpected events (i.e., coronavirus). However, most airlines are subject to leasing contracts limited to a single manufacturer for reasons of efficiency and cost-effectiveness, either due to maintenance or certification. Consequently, as outlined below, there are only a few commercial aircraft types per carrier, which is often only available to one single aircraft family. Thus, during the period under review (2011–2020), and in accordance with usual classification criteria based on the most representative aircraft of European airlines from previous works [12,13], the most utilized commercial airplanes (10) of only single-aisle families, either turboprop or turbojet, in domestic corridors (139) operating in the busiest airports (5) in Spain have been selected for the study. The case of the Spanish domestic market is also a very good approximation as to what occurs in the European aviation sector in terms of emissions, as almost two-thirds of passenger air traffic correspond to France, Germany, Italy, Spain, and the United Kingdom (UK) [14]. With the approach to sustainability regarding the transport of passengers by air over regular routes, specifically focused on the Spanish domestic market, a few earlier papers have handled the issue of aviation emissions with certain routings. For instance, regarding the specific case of the Public Service Obligation (PSO) schema applied in Spain, the emissions, depending on the aircraft type of some domestic routes, such as those serving island territories [15], the EU territories with special status [16], or even intra-regional routes [17] have been discussed. This article brings a comprehensive and consistent view of the sustainability of passenger air transportation by segmenting emissions per distance band and aircraft type to reveal which corridors contribute more to the overall aviation emissions in the Spanish market.
Although the causes of climate global warming are very diverse and highly disturbing, it is widely accepted that the effect of human activities is one thereof, and even a critical one. Using energy based on fossil fuels in transport creates harmful emissions. Regarding the emission analysis of greenhouse gas (GHG), the research has only been focused on carbon dioxide emissions from the aviation sector, since this is the primary driver of global climate change, in line with scarce similar works focusing on sustainable transportation in Spanish domestic market, though without any concern about passenger transportation, but intra-national freight transport instead [18]. Because commercial aircraft emissions are affected by flight-specific variables that change continuously, it becomes necessary to develop average factors to consider the effect of these flight parameters. While these factors cannot entirely be identified from a specific flight basis, the normal methodology considers them for the purpose of developing a more robust estimation of flight emissions. As shown in Figure 1, the empirical analysis carried out in the study has been mainly supported by two primary sources, one for air traffic statistics and the other for the carbon aircraft emissions database, respectively from AENA [19] and International Civil Aviation Organization (ICAO) [20], in line with International Air Transport Association (IATA). Consequently, Figure 2 summarizes the analysis methodology used in designing the research for the estimation of main climate-related emissions. As a result, the contribution of the paper is intended to evaluate the impact of commercial aviation on carbon dioxide (CO2) emissions from the analysis of representative domestic flights in such a demanding transportation market as the Spanish route. The research question does arise, therefore, whether regular air passenger services on domestic routes can be always sustainable in terms of excessive pollution by scheduling turbojets, or otherwise deploying turboprops on certain regional corridors where feasible and economical.

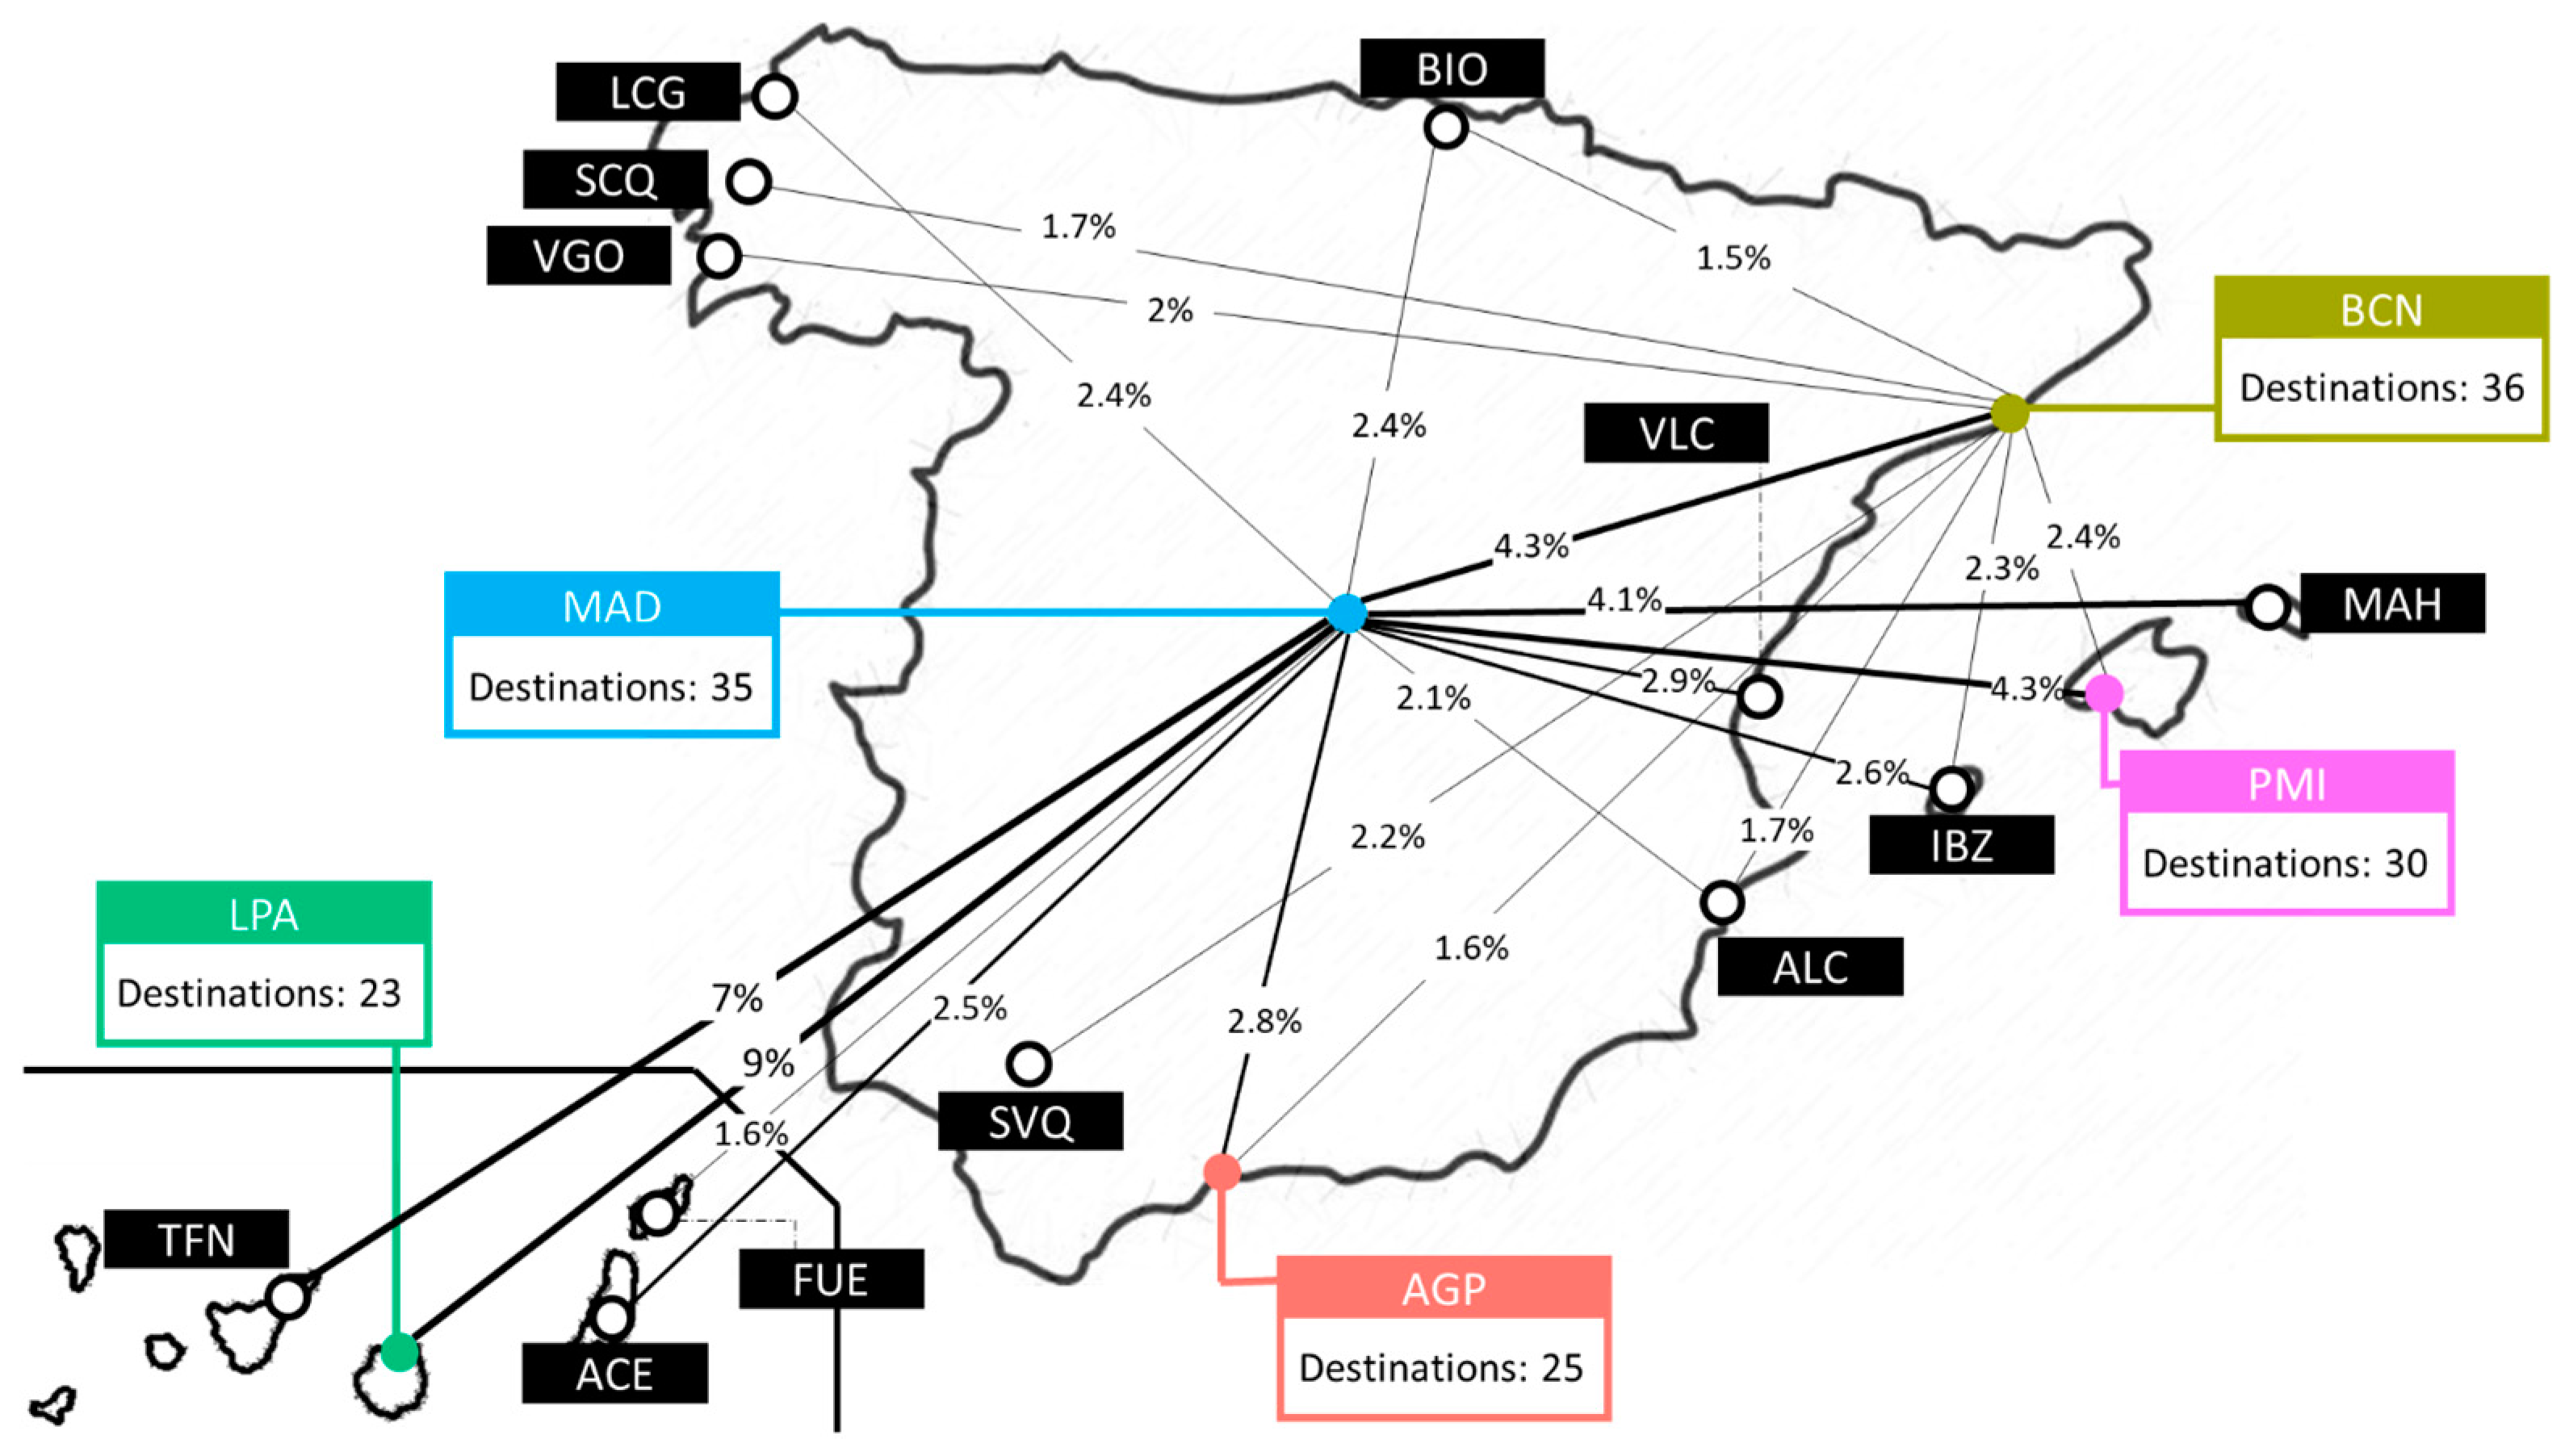
2.1. Related Considerations in Operating within Airport Network in Spain

Spain has a very dense airport network and an extensive aviation infrastructure. Due to the widespread displacement of the population in certain areas by orography, there are air facilities in almost every Spanish province. Most of them belong to a public business entity, officially named Aena SME, S.A. (hereafter, AENA), specifically 46 airports and 2 heliports. Of these, as shown in Table 1, the five most representative airports according to the number of scheduled passengers boarded by commercial airlines from 2001 to 2020 have been selected for research. Furthermore, as can be seen in Table 2, there are a couple of smaller facilities belonging to other public entities, or even semi-public bodies, at the regional level, which have not been considered in the study due to a slight impact on the research matter. This simplification has no significant influence on the result of the CO2 emissions from the aviation sector within the Spanish domestic market, since the five airports cover almost the entire domestic network of corridors. In that regard, such consideration is sufficient to support the research approach and hence the validity of their findings, since the routes displayed in Figure 3 represent 62.5% of total aviation-related emissions. Significantly, the following map shows the set of 149 destinations from Table 2 according to 139 routes from Table 3 that have been analyzed when the scheduled passenger transport service occurs in the operative application of domestic flights during the studied ten-year period for each selected airport. Likewise, such a map shows the distribution of those destinations most representative of the study, and specifically whether or not they have a significant impact on the overall emissions. In all of them, the corridor MAD-LPA (hereafter, EC5, as shown in Table 3) makes the greatest impact on the environmental footprint from aviation activity; nine percent to be precise, as explained later in this article.
Of all possible routes identified among the air facilities identified below operating from the key airports selected in the study, only 139 corridors fulfilled the criteria for the review. From the air traffic database provided by the related trusted source [19] with regard to possible routes analyzed, properly listed, and adequately codified from Table 3, according to the criteria previously noted, the research has evolved around traffic ancillary data in order to calculate jet fuel consumption and evaluate emissions.

2.2. Related Considerations in Supplying Domestic Air Routes in Spain

On the basis of the above considerations, as summarized in Table 4, jet fuel consumption and carbon dioxide emissions have been calculated according to the most representative carrier and airliner on each corridor selected in the study.

3. Results

As pointed out previously, the research analysis has been focused on the empirical evaluation of partial greenhouse gas emissions from the aviation sector in Spain by estimating fuel consumption due to commercial domestic corridors for scheduled passenger air transport services according to the distribution from Table 5. Therefore, significant analysis work has been carried out to evaluate carbon dioxide emissions from commercial aviation activities on major national routes. To that end, after gathering information sourced from the trusted database [19], primary screening of data records was made by identifying relevant passenger flights within the Spanish domestic market, thereby rejecting air services likely operated by charter carriers, as well as those with little significance when compared with the total number of 25,000 flights covered by the preliminary analysis. For instance, those origin-destination-aircraft combinations below 10 flights in the 10-year period studied were removed from the analysis. This has thus made it possible to simplify the subsequent calculation up to 2500 flights. Then, based on the five major airports introduced earlier and the corresponding 139 routes finally identified for the study, the following considerations have been considered throughout the 10-year analysis period. Firstly, the Passenger Load Factor (PLF) is estimated at 82.3% [20] (p. 12). Secondly, as shown in Table 6, the label ‘Distance Segment’ is designed to break down the total of ‘corridors’, and any subtotals, in an attempt to identify the existing different distance segments to said emissions relating to the research matter. While aviation routes are typically categorized by flight time, short-haul flights (0–3 h in duration), medium-haul flights (3–6 h in duration), and long-haul flights (6–12 h in duration), the research has identified three types of segments for classifying the corridors from Table 4, as ranked in Table 6. Thirdly, most representative airplanes (see Appendix A Table A1) have been identified from the corridors previously selected for the emissions analysis. Similarly, as the fourth point, most representative airlines (see Appendix A Table A2) have been identified for the study. Fifthly, similar to above, most representative engine families have been cleared for the study (see Appendix A Table A3). Sixthly, and finally, only narrow-body airplanes have been considered for the analysis of 139 routes, since only intra-country passenger transport services, without distinction for engine families, have been analyzed.
In addition to the aforementioned considerations, the emissions estimation has been subjected to calculation methodology provided by ICAO [20] that is affected by flight-specific variables, which in turn change continuously. According to such guidelines, it has been necessary to develop average factors to consider the effect of various flight parameters. While the factors cannot be captured on a specific flight basis, the methodology considers them to develop a more robust estimation of flight emissions.
Each aircraft has been mapped with one of the 312 equivalent airplane types to calculate fuel consumption per trip based on the driving distance between the airports involved in the routes selected. Based on the traffic and operational data collected by ICAO over several past years, this methodology has been applied according to both PLF and the corresponding weight ratio of freight and passengers, better known as a pax-to-freight factor (PFF), for estimating the total fuel (TF) burned for the passengers carried on each route selected. Then, the average fuel consumption for the journey, weighted by the departure frequency of each equivalent aircraft type, was calculated by dividing the total number of equivalent economy class passengers (Y-seats). This calculates, therefore, an average fuel consumption per such class passenger. Lastly, the result must be multiplied by 3.16 to obtain the carbon dioxide footprint attributed to passengers on each route selected.
Hence, the equation for calculating the CO2 emissions per passenger (Ep):
Ep = 3.16 ∗ (TF ∗ PFF)/(Y-seats ∗ PLF),
where variables are as follows according to ICAO [20] (p. 6):
  • TF = Weighted average fuel consumed on all flights between the departure airport and arrival airport. The weighting factor is thus the ratio between the number of departures for each equivalent aircraft type and the total number of departures;
  • PPF = Ratio calculated from the ICAO statistical database based on the number of passengers and the tonnage of mail and cargo transported on particular routes;
  • Y-seats = Total number of economy class equivalent seats available on all flights serving the given pair of airports;
  • PLF = Ratio calculated from the ICAO statistical database based on the number of passengers transported and the number of seats available on particular routes;
  • 3.16 = Constant representing the number of tons of CO2 produced by burning one ton of aviation fuel.

3.1. Technical and Operational Issues

In addition to the equation above (1), the estimation of carbon dioxide emissions in serving the routes concerned for the analysis period had to consider elements relating to aircraft performance and operating limitations, even though this problem is sometimes exacerbated by a lack of open access databases with full flight records. Looking at air operation when airplanes fly between two points, the pathway used is the distance runs on the great-circle distance (GCD). However, due to temporary limitations of air traffic flow management on certain air routes, as well as temporal and spatial variation of air space and possible restrictions (e.g., night flying restrictions), the performance of both airports and aircraft involved in operating every one of the flights on routes selected for the research could have been deviated from the optimal route to fly, better known as ‘business trajectory’, which is indeed a function of the required time of arrival at the airport. Delayed flights, mainly due to air traffic jams, increase the time of flight and fuel consumption. Airport congestion during the approach to landing is a further cause of leaving airplanes in a holding pattern, which can even result in a total diversion, resulting in significant unnecessary emissions. To confront these uncertainties of calculating emissions, specific considerations relating to technique as well as operation on the 139 routes have been adopted. At the technical level, based on the most common aircraft per route, differentiating between turboprop and turbojet, emissions have been calculated considering the standard engines of each representative aircraft, as expressed in ICAO [20] (p. 9). Regarding operational aspects, the travel distance of each route has been considered without take-off and the landing cycle, while a GCD correction factor (+50 km, +100 km, +125 km) has been made according to guidelines provided by ICAO [20] (pp. 7–8). As shown below, results vary based on the specific airplane model and seasonal pattern, including thus, if relevant, the impact of both technical and operational factors in the emissions calculated.

3.1.1. Aircraft Performance

In line with each representative aircraft, Figure 4 is a graphical view of performances on all the routes selected, showing how they relate to various distance trips identified.

3.1.2. Airport Performance

As shown in Figure 5, an analysis of the scheduled seasons of air transport services operating in the five airports has been provided to identify the seasonal trends of regular flights performed on 139 domestic routes, thus calculating their respective emissions.

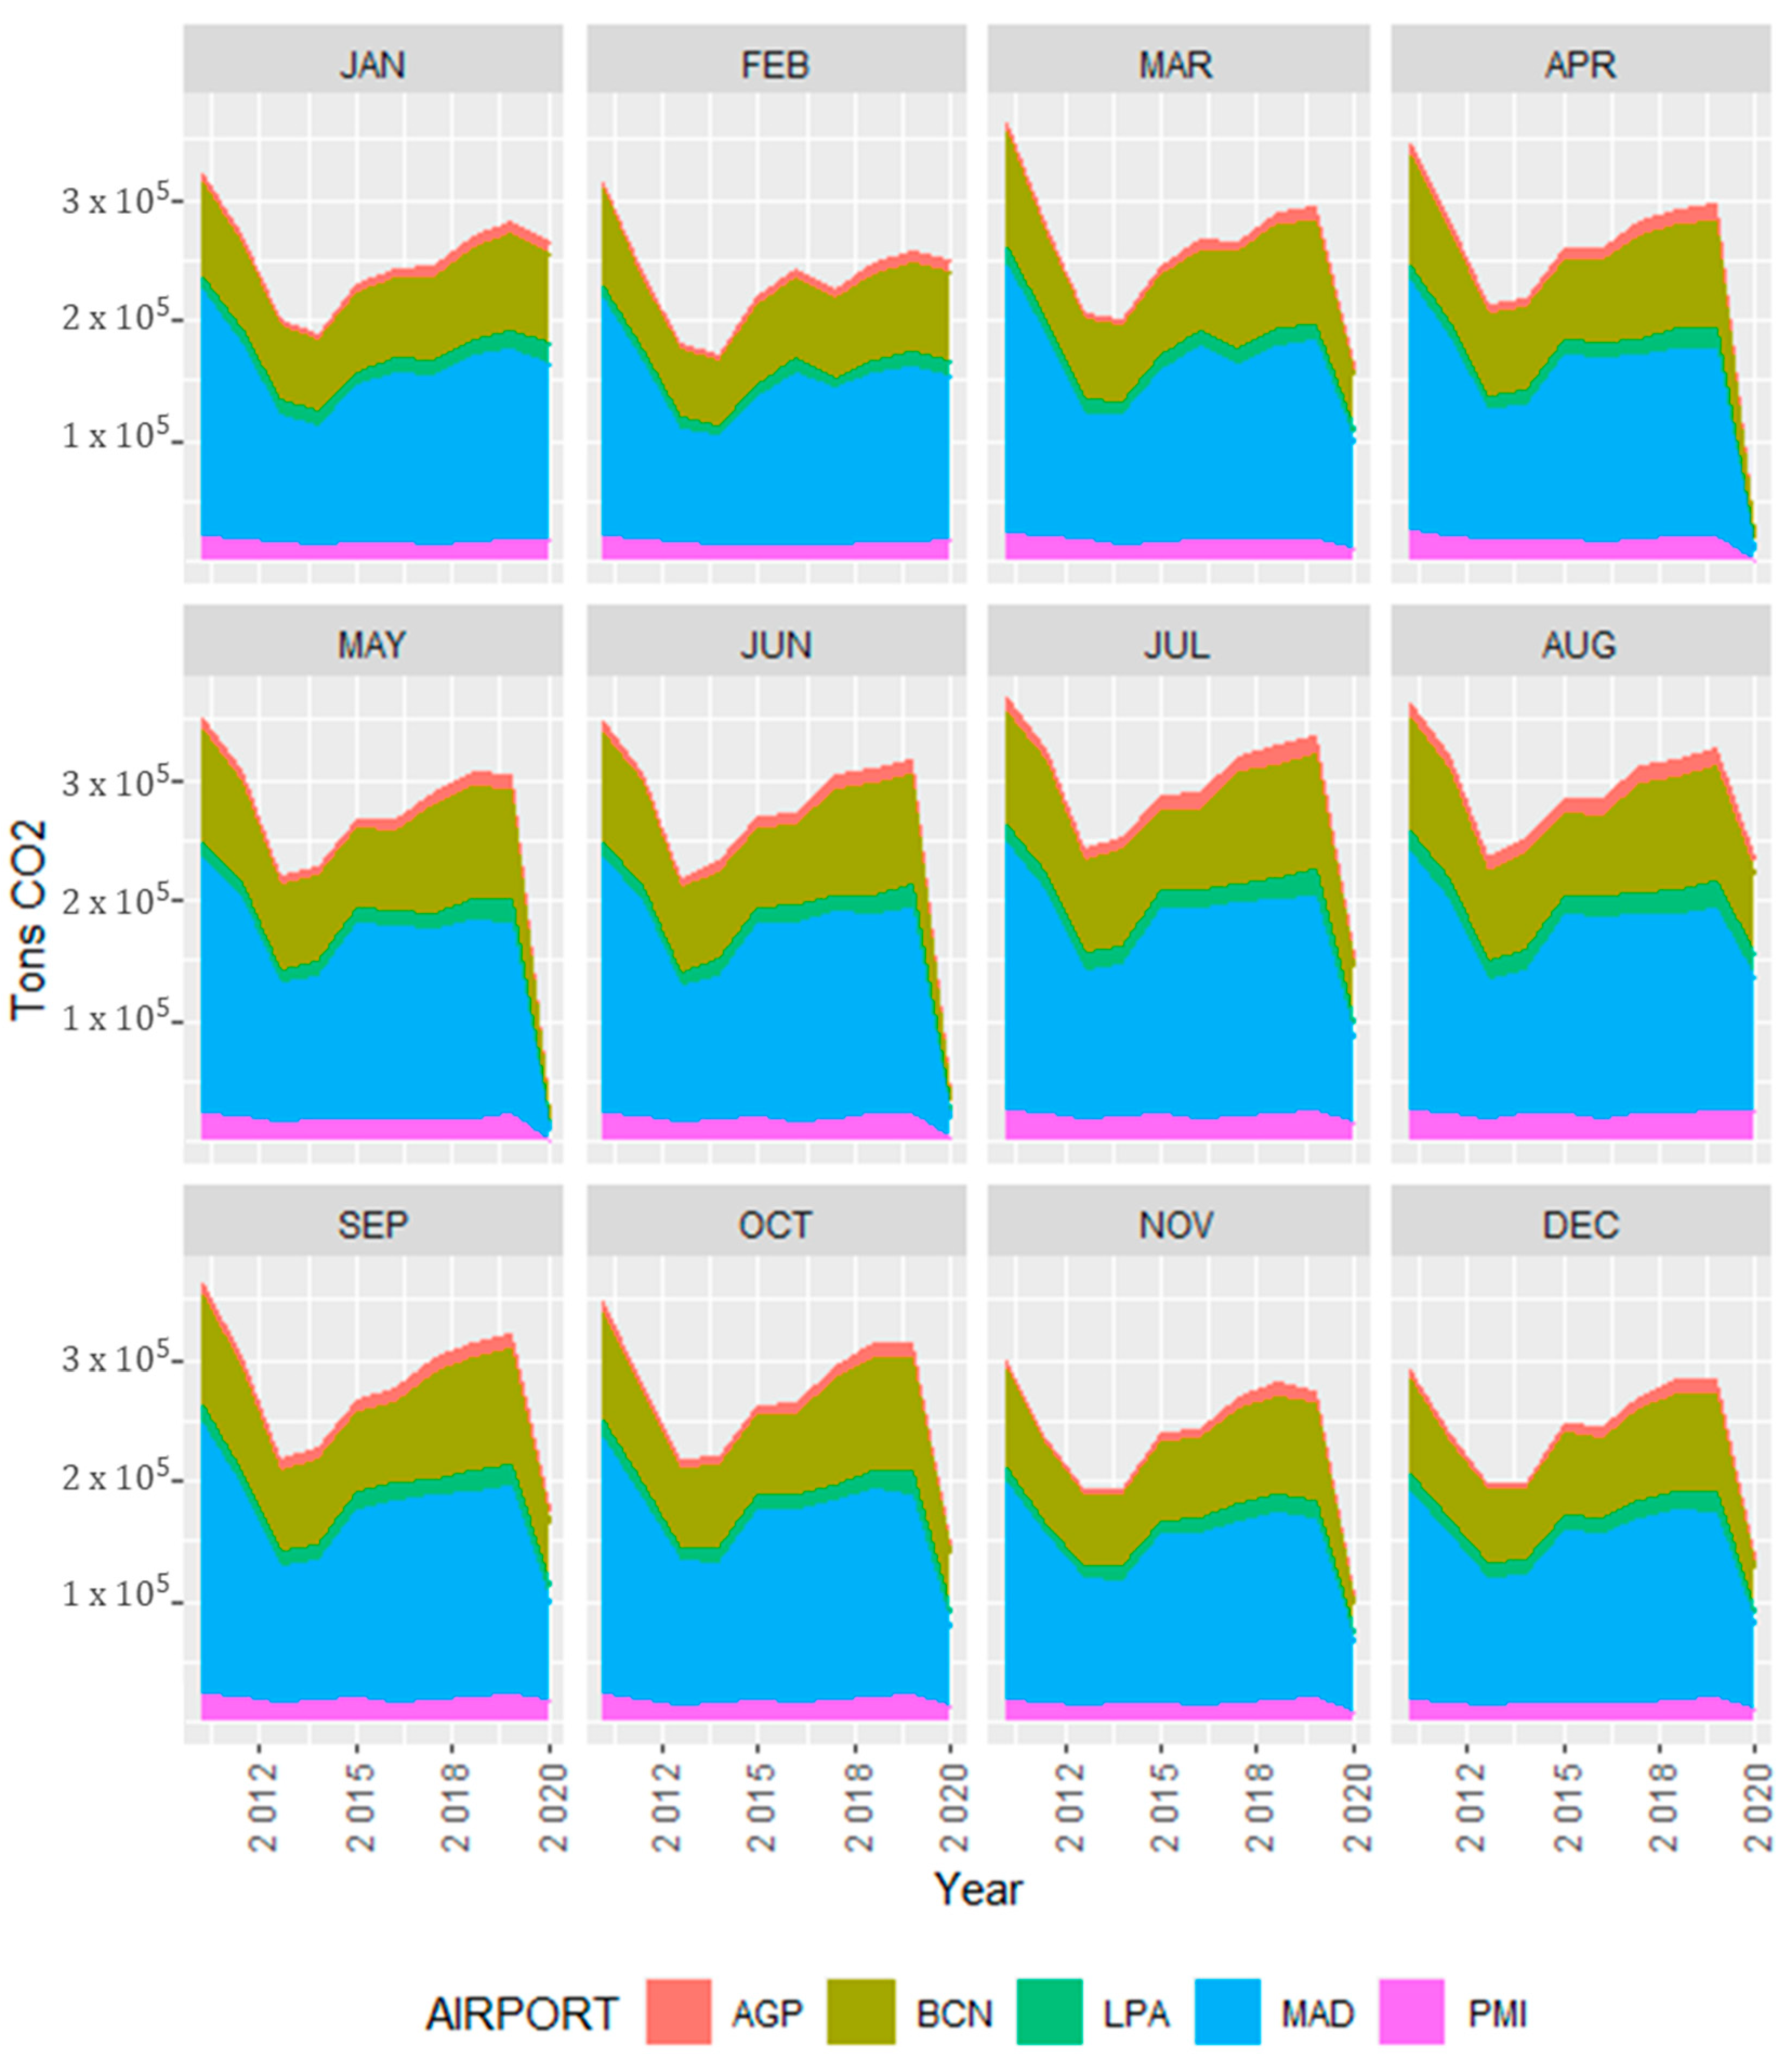
3.2. Emissions Analysis Disaggregated by Airport Concerned

In order to analyze carbon dioxide emissions over the years under the set of 139 routes operating in the airport network identified as representative of the domestic market in Spain, collected flight data has been compiled to explain its monthly evolution, as summarized in Figure 6. These indicate emissions have been estimated on the basis of charging the quantity of fuel consumed monthly per route to the departure airport instead of the destination airport, as with the results shown in Figure 5. In other words, where emissions are associated with a certain corridor whose flights have been operating between two airports (e.g., A and B), the calculation is obliged to count each flight up to two legs, that is, from A to B, and then B to A. However, in this example, to simplify the approach for calculating emissions, the estimation is allocated to airport A. Under this scenario, as can be seen in Figure 6, aside from the effect of travel restrictions due to Coronavirus disease 2019 (hereafter, COVID-19) on mobility, and hence on aviation activity, there is apparently a pronounced relationship between what national demand dropped and what supply has shrunk (see, for example, the period 2013–2014).

3.2.1. Related Aspects Concerning Domestic Routes Operating in the MAD Airport

As noted earlier in Table 1, the Adolfo Suárez Madrid-Barajas airport (IATA: MAD, ICAO: LEMD) concentrates most of the regular flights in the Spanish domestic market. As can be seen in Figure 7a, there are some routes, such as EC83, EC102, and EC24, with very high fuel consumption per passenger, and thus a larger impact on specific emissions. Where total consumption is concerned, though, these routes will have scarcely any effect in terms of emissions from flights operated at such an airport. Indeed, as shown in Figure 7b, only two routes, EC6 and EC8, are significant to the total emissions chargeable to the airport in the specified analysis period. Besides no long-distance segment of both routes (484 and 548 km, respectively), two main factors have a direct impact on emission levels thereof. Both aspects are not connected, but they are weakening the capabilities for reducing emissions per passenger from domestic flights, in comparison with other related corridors, even shorter routes (e.g., EC24). On one hand, the intensive use of turbojets instead of turboprops on paths up to 550 km range, such as EC6 and EC8, and on the other hand, the overall capacity in terms of supplied seats has been especially intense on both routes because they have had a robust demand over the last 10 years analyzed, even after taking account of unfavorable seasonality. Specifically, the EC6 is the legendary air shuttle in Spain, which has been habitually operated by Iberia (IATA: IB, ICAO: IBE), whose offer of flights is primarily targeted at frequent travelers, and mainly for business reasons. Furthermore, other airlines have been operating on the route, such as Vueling (IATA: VY, ICAO: VLG) and Air Europa (IATA: UX, ICAO: AEA). All of them are usually operated using single-aisle jets, either Airbus A320 family or Boeing B737-800 series, which have recently been upgraded by retrofitting scimitar winglets on existing aircraft to cut fuel, or even renewed with A320neo family and B737 MAX series, respectively, and offer enhanced performance in terms of fuel consumption thanks to the improved design of both engines and aerodynamic shapes. Additionally, it should be noted that, within the potential market in Spain of domestic corridors, there are about 30 million passengers in the internal market of air transport services, of which about 2.5 million are concentrated on the EC6, according to the figures of 2019, i.e., over 200,000 passengers carried on such a route monthly before people went into the lockdown in March 2020 because of the COVID-19 outbreak. That and, above all, the importance of this corridor in the overall aviation emissions of domestic flights in Spain is shown.

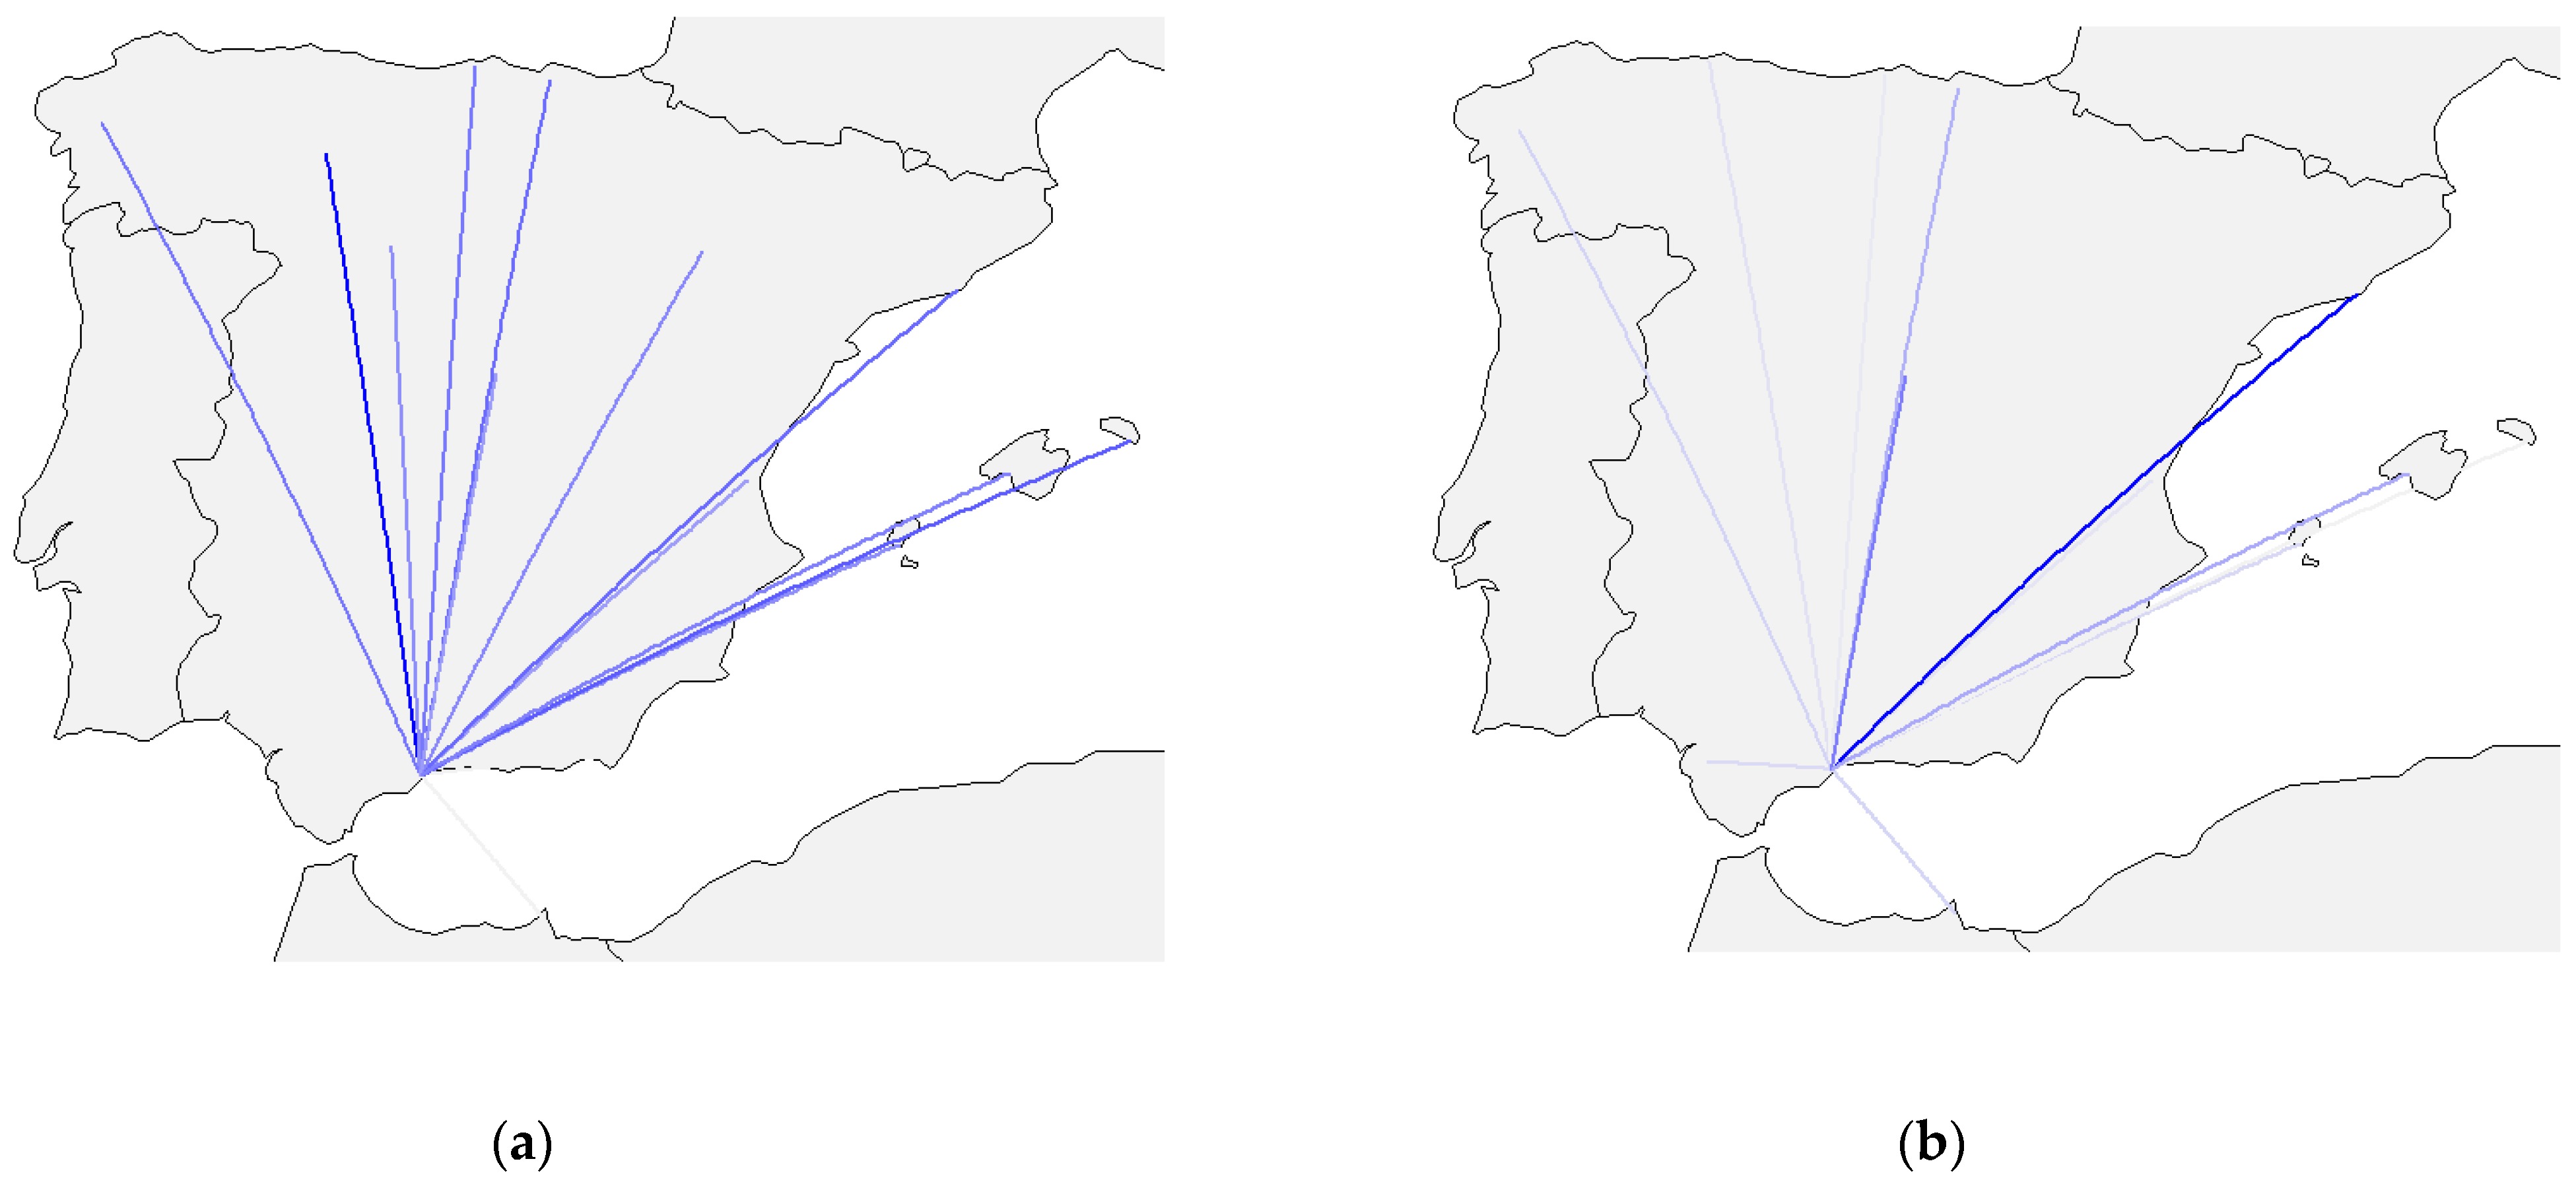
3.2.2. Related Aspects Concerning Domestic Routes Operating in the LPA Airport

The Gran Canaria Airport (IATA: LPA, ICAO: GCLP), as can be seen in Table 1, has habitually held the fifth position in terms of passengers carried within the Spanish domestic market of regular air transport services. Moreover, the airport has a two-fold role: on the one hand, the major destination for flights from the Spanish mainland are always operated with turbojets, either narrow-body or wide-body aircraft; and on the other hand, this airport is headquarters to the main regional airline operating in the Canary Islands, named Binter Canarias (IATA: NT, ICAO: IBB), whose fleet has traditionally been comprised of short-haul regional airliners, mainly turbofans, such as the ATR 72 (IATA: AT7, ICAO: AT72), and more recently of medium-range jet airliners, the newest Embraer E2 (IATA: 295, ICAO: E295). Furthermore, both aircraft types have been designed with tight specifications that are tuned for reduced emissions per passenger carried, even with low levels of PLF. As a result, while the related flights into the Spanish mainland present a high carbon dioxide emission level, inter-island flights in such Spanish archipelago have proved to be the lowest level of the whole study in the specific years examined. Further to be noted is the seasonal character of the demand for air services such as from the main airport of the Canary Islands to mainland Spain, whereas the related inter-island air traffic market in the period being analyzed has become more stable than the supply of flights out of the archipelago, partly owing to generated extra demand for regional routes from subsidizing air transport and Public Service Obligation (PSO) implementation [23]. Moreover, six of the 23 routes so far imposed in Spain as essential transportation services under such EU schema have been linked to LPA, and two of them have been often operating as a type 3 PSO, that is, a closed route with both exclusivity and compensation [24]. Nevertheless, the existence of affordable regular flights from the Canary Islands, belonging to the EU’s outermost regions group, helps to ensure the mobility of their inhabitants. Indeed, the specific matter resulting from such a geographical situation must not be misunderstood. As noted in the pooled results shown below, respectively Figure 8a,b, the highest emissions per passenger carried appear in those corridors to mainland destinations, and concerning absolute values for all of the corridors selected, the EC5 has been intensively operated by twin-engine turbojets, some of them even wide-body, such as the A330 family (IATA: 330, ICAO: A330) due to a greater haul capacity for cargo and mail.

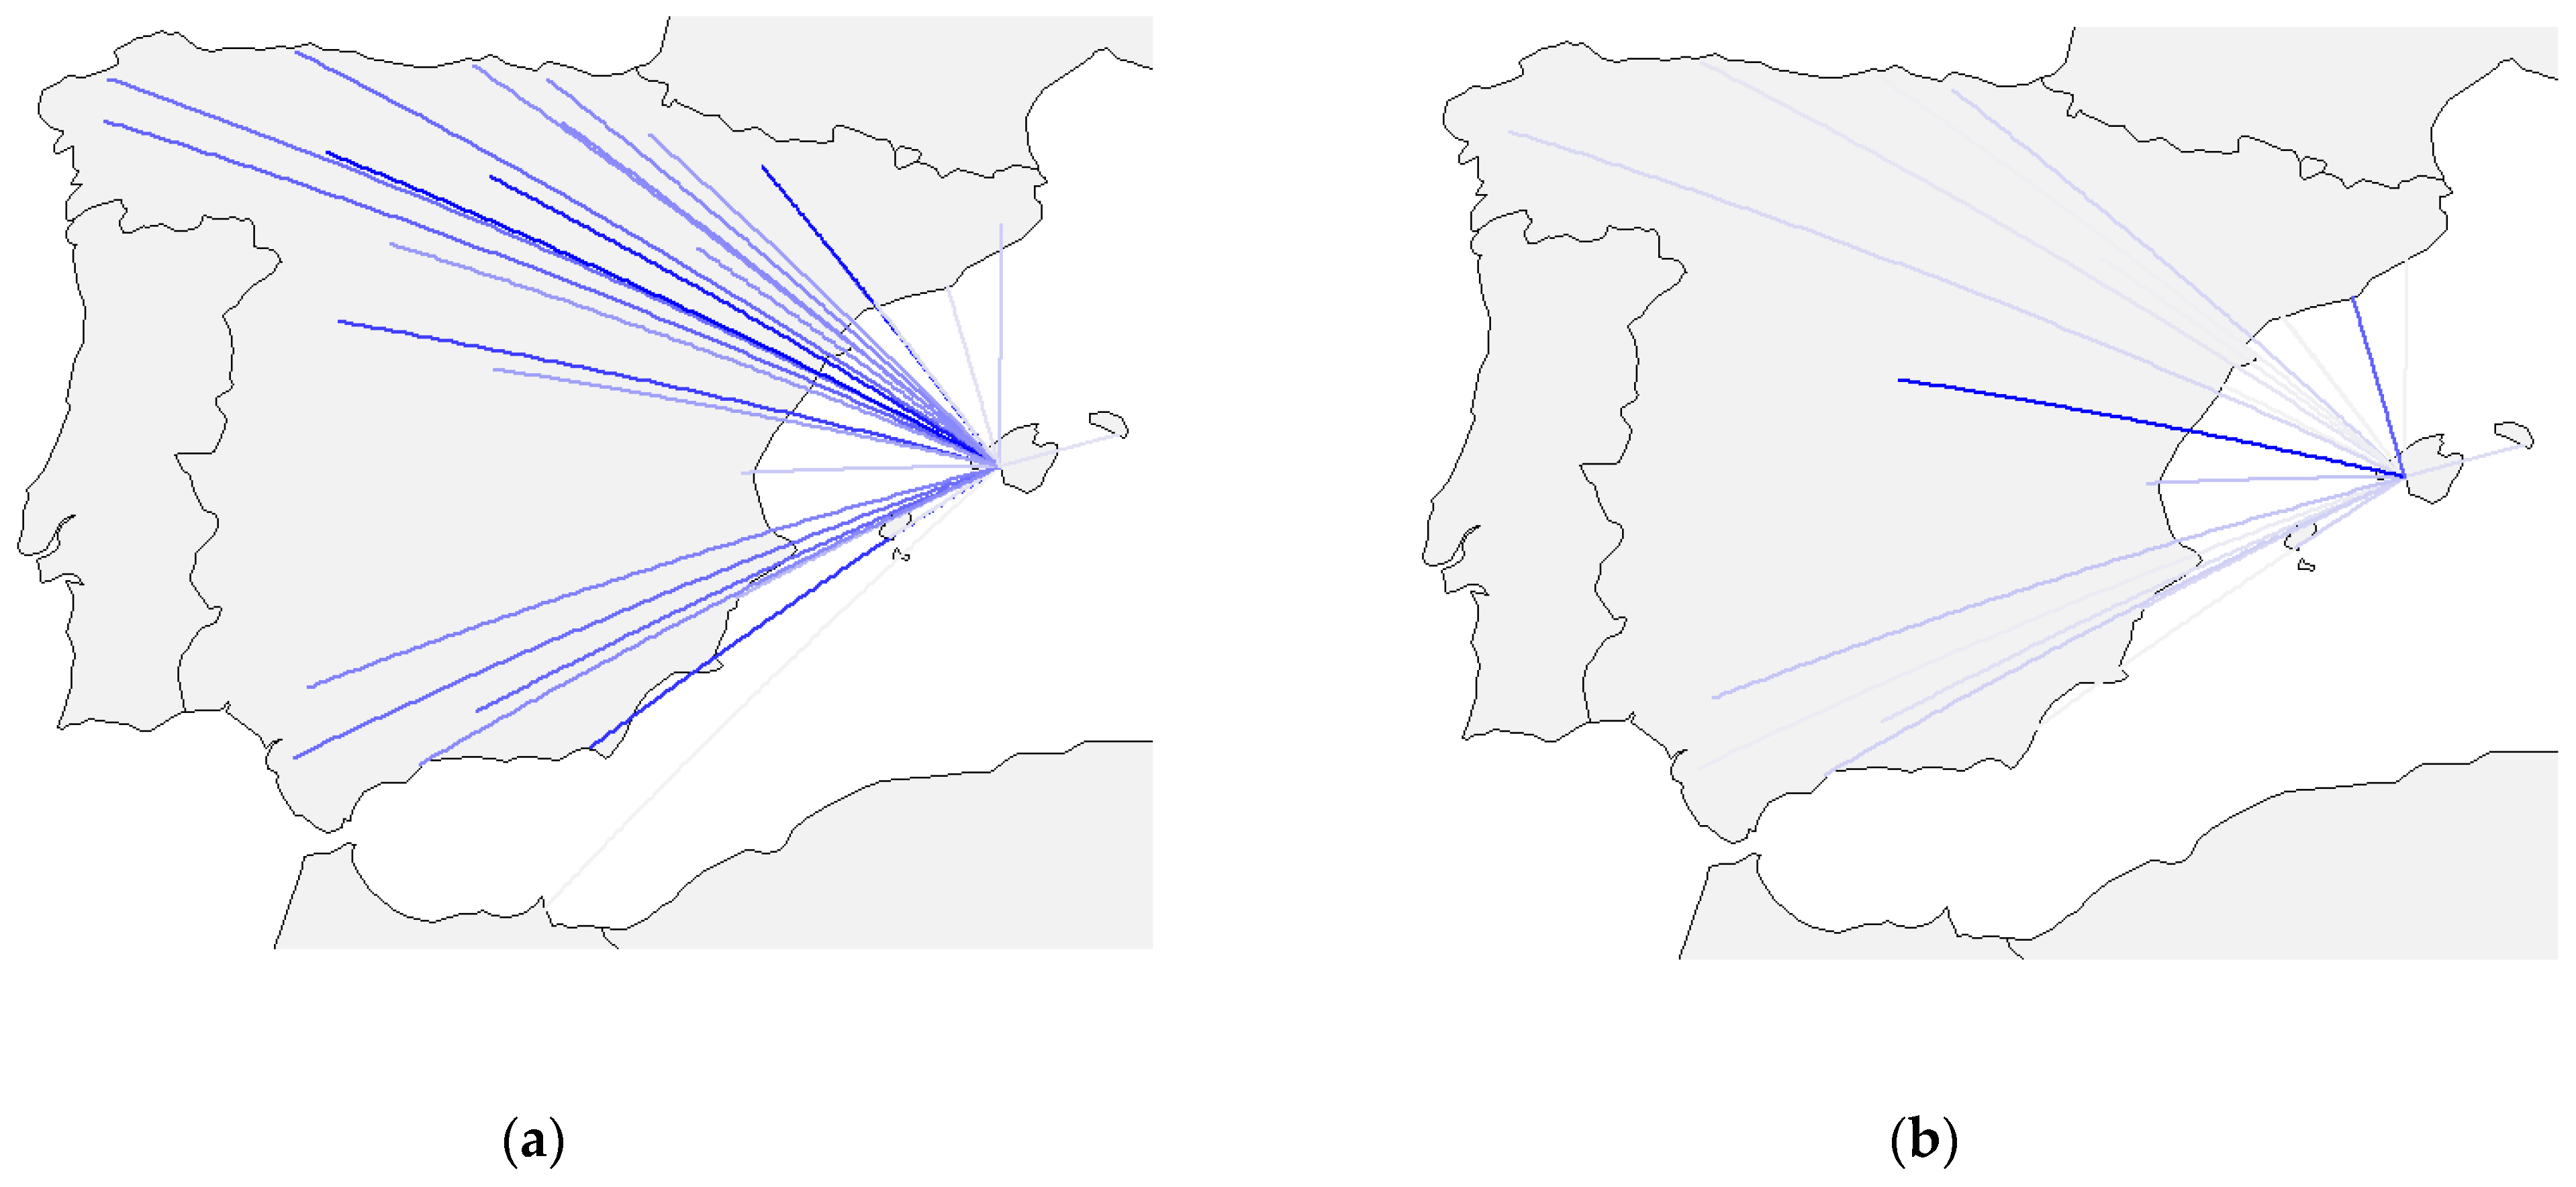
3.2.3. Related Aspects Concerning Domestic Routes Operating in the BCN Airport

As can be seen from Table 1 above, the Josep Tarradellas Barcelona-El Prat Airport (IATA: BCN, ICAO: LEBL) is the second facility belonging to Aena’s network in terms of passenger traffic and aircraft operations. The analysis of domestic flights operated from BCN over the period under study has been summarized in Figure 9. As with the case of MAD, it shows that related routes linking to BCN have had a high impact on the total aviation emissions of the Spanish aviation market, despite comparatively little supply in comparison with the total operations, the majority of which were medium-haul flights to travel destinations in other European countries, and in a few cases, even long-haul flights over the Atlantic Ocean. Interestingly, though being operated at almost full load on national corridors, some of them with a trip distance up to 500 km, carriers still mostly operated turbojets, possibly indicating the limited availability of regional turboprop airliners based especially to such an airport, even because of the absence of eco-friendly planes for regional routes in related airlines’ fleets. For instance, scheduling on short routes, such as EC9, EC12, EC16, and EC25, an AT7 can be used instead of operating small turbojets, such as CJR200 (IATA: CR2, ICAO: CRJ2) and CRJ900 (IATA: CR9, ICAO: CRJ9), which can lead to a reduction of up to 50% less carbon dioxide emissions in similar circumstances [15]. In contrast, regional turbofans in scheduled air carriers are very scarce in Spain and limited to a few airlines. In the absence of any aircraft model of Bombardier Q Series, for example, the DHC-8-400 (IATA: DH4, ICAO: DH8D), the turboprops existing in Spain for commercial purposes belong to the ATR aircraft family, and the vast majority of them are AT7s, habitually operated by Air Nostrum (IATA: YW, ICAO: ANE) in addition to those operated on the Canary Islands’ market mainly by NT, and to a much lesser extent, by Canaryfly (IATA: PM, ICAO: CNF). Nonetheless, in the case at hand, because of increased requirements of payload, a small aircraft operated on short-haul routes has sometimes been replaced by a large aircraft. It is also worth noting the fact of considering fleet availability as a key factor for airlines when scheduling their offer of flights. In such a context, Figure 9a shows a similar impact of specific emissions on each route selected, while Figure 9b highlights significant emissions on domestic routes with high demand, particularly those linking to three major cities in Spain, such as EC6, EC65, and EC109.

3.2.4. Related Aspects Concerning Domestic Routes Operating in the AGP Airport

The Málaga-Costa del Sol airport (IATA: AGP, ICAO: LEMG), as noted in Table 1, is the most important air transport infrastructure situated in Southern Spain, linking to several destinations (mostly European) whose flights have habitually been scheduled by low-cost carriers instead of legacy airlines, that has an enormous presence of international travelers. The airport has witnessed a substantial year-on-year increase in demand as a direct result of recent facility expansion through both terminal building and runway, contributing towards the 6% and 18% increase in traffic according to the growth rate estimation, respectively [25]. The significant improvement of such infrastructure has led to a remarkable increase in airport capacity, not just in terms of passengers, but also in terms of freight carried. Regarding related domestic routes, as can be seen in Figure 10, involves identifying what impacts the overall emissions have and how to explain them. In that sense, Figure 10a shows significant specific emissions per passenger on some air corridors into Northern Spain and Central Spain, such as EC22, EC29, EC73, and EC105. By contrast, despite the EC07 playing the role of a feeder route for both the UX and IB hubs in MAD, the route does not have significant specific emissions since carriers have been flying some of their various regional aircraft just 432 km to MAD for shuttle services according to demand, in particular by using aircraft with extremely low engine emissions figures, such as AT7 and Embraer E195LR (IATA: E95, ICAO: E195). It should also be noted that unit emissions for EC85 lead to a high rate in comparison with the rest of the routes selected in the study. At the same time, the calculated emissions for EC65, in absolute terms, have been revealed to be of critical importance within the overall estimation of emissions with regard to those domestic flights departing from AGP, as shown in Figure 10b. Commercial airlines operating such a corridor have not only operated twinjets, but also all flights under consideration were scheduled by six-abreast cabins belonging both to VY and Ryanair (IATA: FR, ICAO: RYR). In fact, these carriers today operate solely narrow-body aircraft on short-haul routes within Europe (and therefore includes domestic routes in Spain), specifically the Airbus A320 family in VY and Boeing B737-800 series in FR. Interestingly, this was not the case for EC81, since related flights have always been operated with turboprops, mostly AT7, due to the existing approach and landing procedures in Melilla (IATA: MLN, ICAO: GEML). That also made them remarkable for low emissions.

3.2.5. Related Aspects Concerning Domestic Routes Operating in the PMI Airport

The Palma de Mallorca airport (IATA: PMI, ICAO: LEPA), as shown in Table 1, has been identified as Spain’s third leading air facility in terms of the number of passengers and air operations over the study period. Because of the singular nature of the Balearic Islands, which stands as a highly popular tourist destination in Europe, such an airport has been characterized for attracting several air carriers whose total number of seats offered has been growing steadily in the last few years, with the exception of restrictions placed on movement around Europe due to coronavirus lockdowns between the years 2020 and 2021. According to the last expected growth at the airports in the Balearic Islands, PMI has recently led to an increase of 11% in scheduled seats (31.2 million) [26]. Indeed, for the present year, once travel restrictions eased and then completely lifted, the three airports of such a Spanish archipelago have undergone unprecedented growth. All of these factors have created an ample offer of flights at PMI that have not only been operating towards many major European city destinations scheduled and charter services, but also into medium-sized cities, and even sometimes outlying towns to major cities across Europe. All of this means that travelers interested in flying into PMI usually have access to the low prices and wide choices that are available in the truly competitive EU single aviation market. The outcome is an enormous representative offer of the common European air transport sector with great pulling power, which includes both low-cost and legacy airlines. Nonetheless, this great expansion of direct flights into such an attractive tourist destination situated in the Mediterranean Sea has not always ensured that the long-term level of capacity would be better adjusted to meet the level of demand, either in terms of optimizing traffic density or in the range of the destination from tourist source countries. As shown in Figure 11a, in the case of those national departure airports that serve PMI, widespread high specific emission values apart from some routes between islands, respectively EC58 and EC86, have been observed. Unlike domestic routes into mainland Spain, some of them are even related to seasonal flights from small airports, and a very seasonal demand on both corridors, whose usual carriers (YW and UX) have traditionally operated turboprop aircraft (AT7), thus achieving a low emission performance [21], has not been noted. By contrast, as can be seen in Figure 11b, the route (EC8) with the greater choice and the largest number of seats offered has the highest emission levels.

3.3. Overall Findings Based on Key Performance Indicators

In order to make a comparative evaluation of direct impacts resulting from aviation emissions in operational terms, as can be seen below, proper ratios of the specific emissions to air according to the ten selected aircraft types have been calculated and presented.

3.3.1. Benchmarking of Air Pollution

Regarding carbon dioxide emissions on the basis of the distance flown through Spanish airspace in domestic routes only, twin-turboprop aircraft appear to be most appropriate in scheduling corridors up to 550 km, as shown in Figure 12 and Figure 13, respectively.

3.3.2. Benchmarking of Fuel Consumption

Concerning fuel consumption (jet A1) caused by related aviation activity from operating those 139 domestic routes over 10 years between 2011 and 2020, its evolution has been calculated according to the U.S. Gulf Coast Kerosene-Type Jet Fuel Spot Price in terms of Free on Board (FOB) [27]. As presented below in Figure 14 and Figure 15, respectively, there appears to be a trend toward increasing emissions during periods of low fuel prices.

4. Discussion

According to the results obtained, and taking into consideration other previously published works on greenhouse gas emissions from commercial aviation, the findings are now discussed. In most EU member states, over the years, the public transportation sector has been enhancing steadily, with most reporting an increase in the number of routes in operation. Regarding collective modes of transportation until 2020, due to the outbreak of COVID-19, the number of passengers carried by air over regular routes and on regular schedules had experienced vibrant growth in the European aviation market. However, the air transport sector has recently been hampered by structural difficulties that make it more vulnerable to other transport modes. This is because the air sector is both highly cost-intensive and highly dependent on the global aviation leasing market, as well as fuel costs and wage bills due in part to the existence of minimum fuel requirements and high professional qualifications, respectively. Results from the study show there is a wide dynamic performance of air activity and, consequently, jet fuel consumption. Apparently, there are a number of factors that contribute to this fact, such as the aircraft’s operational availability, adequacy of aircraft and crew for operational purposes, and the impact of the offered routes on airline profitability. While many airlines analyzed in this study have different types of cabins and seat configurations on various aircraft in their fleets, it is particularly important to consider their business strategies in which fleet modernization and renewal programs are carried out, not only for enhancing efficiency and profitability in transport activities, but also the promotion of sustainable transport. This statement is also precisely in line with what some previous papers pointed out on such a matter. For instance, regarding carbon emissions of European commercial air traffic, it was found that the main driver for efficiency in emissions is the modernization of the aircraft fleet [12]. The other essential element for more sustainable aviation is related to the use of alternative fuels, including exploring opportunities for alternative raw materials, such as renewable jet fuel by using advanced fermentation (AF) fuel from perennial grasses [30], since scaling up the SAF production is vital to enable an effective aviation’s low-carbon transition.
In the research, only domestic routes have been examined, sometimes of seasonal nature, others even operated on some of the 23 routes under the Public Service Obligation (PSO) scheme so far imposed in Spain [21], the majority being feeder air routes, since legacy airlines are often looking to fly more short-haul domestic routes with regional aircraft with up to 100 seats for more efficient operation under the hub and spoke model. In contrast, low-cost carriers usually fly more point-to-point routes with medium-haul airliners for more profitable operations. Of the 139 corridors analyzed in the study, the highest fuel consumption ratio per kilometer has precisely been found in those serving as feeders to hubs from smaller airports due to the lack of international destinations at the source. Moreover, it is because they have been operated several times with small regional turbojets, such as CR2 or CR9, that emissions have been estimated by exceeding 0.20 kg of CO2 per passenger and kilometer. This concerns in particular the following routes: EC76, EC71, EC24, EC102, EC75, EC89, EC60, EC86, EC58, EC9, EC77, EC91, EC32, EC121, EC88, EC18, EC41, and EC93. Although the research results have been calculated according to the most representative airliner scheduled on each route over the study period, the previous corridors have been operated by using regional airplanes with a low seating capacity that are most suitable for thin route service, as the air traffic density is flat. Furthermore, outcomes of emission monitoring have highlighted the highly varying importance of scheduling airplanes on thin routes over the past years until the beginning of recent trends toward fleet harmonization with the entry of more fuel-efficient aircraft for sustainable transportation. Examples of this are, among others, the EC83, EC72, and EC15, whose scheduled flights had been mostly operated with up to six, three, and five different airplane types, respectively, and then it became necessary to introduce a unique regional jet model, specifically the CRK. These routes account for the most significant cases in facing the challenge of estimation methods used to calculate related emissions. This underlines the need for identifying the most representative airplane on each route at the statistical level.

5. Conclusions

As already stated in the opening of the paper, the principal aim of the research has been to carry out the empirical analysis of commercial airplane emissions on some short-haul flights previously selected for the study in terms of efficient performance and sustainable operation from a representative domestic market in the EU aviation sector. Specifically, this study underscores the influence that various aircraft have, in accordance with their nominal engine performances, on the outdoor air quality of such transport activities concerning environmental pollution from carbon dioxide emissions only. All of that is enveloped by the domestic market of passenger transport in Spain, particularly those air corridors operating from the five main airports, as shown in Table 1. In light of the research findings, this study is meaningful in that it does not simply analyze the emissions before and after the cruise flight as part of commercial transport services, but examines changes in fuel behavior depending on whether the airplane is provided in a situation where the aircraft is fully aware of the system.
Regarding overall consumption, it is important to highlight the routes with a more significant emission impact in the set of 139 routes selected; for instance, those with emissions above 2.2 million tons of carbon dioxide in the 10 years analyzed, such as EC6, EC111, and EC5, and in addition to that, 1.39 million tons emitted in the period (EC8). Despite that EC6 was the corridor most intensively operated in the study period, specifically 178,577 flights, the highest consumption has been detected in the corridors between Madrid and the Canary Islands. This is particularly significant in the case of EC111 and EC116, whose emissions are 2.84 million and 3.30 million of tons CO2 respectively, because of the large number of seats required all year round on such a main air corridor. Globally, as previously noted, five airports have been considered to become the most representative of the Spanish aviation market from the study, with MAD and BCN as the key facilities representing the 84.6% of total emissions. The remaining 15.4% is shared among the other main airports, namely PMI, LPA, and AGP (6.8%, 5%, and 3.6%, respectively).
Concerning consumption per passenger and kilometer, the majority of the 139 routes assessed are highly dependent on the airplane used for each of them, particularly in the case of regional aircraft types, such as CR2 and CRK, with 50 and 100 standard seats, respectively. Consumption is highly dependent on the distance traveled and, on the airliner, either turboprop or turbojet, operating flights scheduled on a given route. In line with some previous works, both in general matters [31] and in specific cases, such as in Georgia [32] and New Zealand [33], this research reinforces the importance of aircraft type used, load factors, and seat configuration to this issue. Such a clear case is that of the former Spanish air carrier named Spanair (IATA: JK, ICAO: JKK), which ceased operations on 28 January 2012, operating airplanes with high fuel costs per seat-mile (or km), such as those belonging to the McDonnell Douglas MD-80 series on routes EC6 and EC8, up to 148 and 212 flights a month in 2011, respectively. Another example can be found in those corridors traditionally operated by CR2, where a CRK has been introduced, thus leading to a significant emission reduction over the analysis period; specifically, from an average of 21,892 tons of carbon dioxide equivalent per month in May 2011 to an average of 398 tons per month in 2020. This was despite the non-variation impact on the supply of flights over the period, mainly on thin routes, such as EC121, EC72, and EC32, as well as a couple of PSO corridors, such as EC24 and EC25. Of particular note is the case of the introduction of CRK at the expense of CR9 in the Spanish domestic market, which had been used intensively on domestic routes selected until 2018, then gradually removed from the active fleet in 2019, and finally withdrawn from the corridors analyzed in April 2020. This has been caused by identifying the less efficient airliners for use on regional routes and even on thin routes, which can be gradually replaced with more efficient and environmentally friendly aircraft. The main example of this is provided by EC102, which was intensively scheduled with CR2, and later passed to be operated with 319 and CRK. This assessment indicates that the implementation of fleet renewal programs has allowed airliners to slash emissions beyond the levels mandated in the EU ETS rules on aviation. That answers the research question as to whether such investment efforts would do sustainable short-haul routes with a traveled distance of up to 500 km, and the answer to that question is an unequivocal yes when mainly operating turboprops. In any event, despite short-haul routes usually being considered as being shorter than 1100–1500 km, only 23 of 139 routes have a greater distance than 1500 km. Therefore, the limited number of medium-haul flights reinforces the idea that most domestic routes can be operated with turboprops.

6. Research Limitations and Future Directions

Despite the limited number of previous works on the matter of aircraft emissions caused by short-haul flights operated by regular airlines in Europe’s single aviation market, in particular very scarce in the case of the Spanish domestic market, the findings of the present paper seem to suggest the opportunity to locate any common patterns among case studies from various geographical areas. However, there are several limitations to the research issue, and the results may not apply to the whole of the wider global aviation market in passenger transport, since fleets are often not homogeneous across the world, so a benchmark is difficult to establish. Owing to the limitations of the study, the research has evolved around two primary sources. On the one hand, related air traffic data were collected from the national airport services operator [19]. On the other hand, standard estimations of fuel consumption and emissions for each type of aircraft were calculated according to guidelines provided by the international organization of reference in the field of aviation [20]. However, all calculations have been based on the average values from aggregated data concerning cruise flights during the sampling period on the 139 routes selected. Thus, it has not been possible to consider a harmonized approach using an adequate intake estimation model based on flight data recorded by the airport operators in Spain, including serial number and registration of the aircraft, engine type, number of passengers carried, and emission factors. The reason for such a research limitation is due to the existence of operational data belonging to the business domain of both airport managers and air navigation service providers being specifically declared as confidential by either party, such as airlines or airliner manufacturers. Despite these limitations, the study has estimated the aggregated emissions per route, thus comparing the situation of each one according to the most representative aircraft operated over the research period. This has made it possible to analyze the difference in emissions per distance, thus highlighting the environmental impact depending on each aircraft type, both in absolute and relative terms (per passenger and kilometer).
Even though findings from the research are confined to the passenger transport services provided by scheduled airlines operating in the Spanish domestic market, it can be assumed that similar results could be achieved by future works on similar cases in the EU single aviation market. To deepen the knowledge of the research issue, it may be interesting to study the behavior of intercontinental air corridors, not only by transport capacity but also by the passenger, hence allowing the assessment of the actual use of the aircraft and its consumption. In that sense, it can be interesting to examine the wage costs of aircraft crews, when available, in order to make a full cost breakdown, thus highlighting the impact of fuel on the total operating costs of the airlines’ operating corridors selected. The research issue also addresses the challenge of sustainable and efficient jet fuel procurement in the aviation sector, which is of great interest to both carriers and public authorities. Hence, it would be of great interest for further studies to focus on the economic viability of alternative fuels for intensive aviation purposes on scheduled flights, since economic analysis is potentially useful in identifying and clarifying the issues involved in making public policies relating to the environmental impact of air transportation. Another environmental challenge with regard to which the aviation sector has lately faced is the intensive use of general aviation for private chartered flights. Given that the present study focuses on carbon emissions from regular commercial flights into and out of Spain, charter flights have not been accounted for in the base of air quality monitoring estimation. Perhaps future research should shed some light on such a particular matter, as business aviation is usually operated with small-engine airplanes, mainly turbojets that often burn excessive fuel per passenger carried. Additionally, it would be interesting to look at how certain airlines are currently managing to evolve their fleet with the worst jet CO2 emissions to eco-efficient, sustainable clean-sheet aircraft, such as the Airbus A320neo family (32D, 32A, 32B), as it would allow to determinate how this contributes to the optimization of the use of more efficient airplanes, and thereby more sustainable scheduled flights.
Although the research approach has only been focusing on carbon dioxide (CO2) emissions from the domestic aviation sector in Spain, it would be interesting to analyze other outdoor air contaminants, such as nitrogen oxides (NOx), hydrocarbons (HC), carbon monoxide (CO), and sulfur gases, as well as soot and metal particles. Future studies on the matter might be carried out in a manner similar to some earlier works about air quality monitoring tools, both with low-cost multi-channel monitors under specific laboratory conditions for indoor environments [34,35] and with low-cost sensors for outdoor environments [36,37]. This could serve as the basis for planning experiments to accurately estimate emissions depending on each model engine if abundant funding from external sources were available, due to the high costs of this kind of testing. Nevertheless, the variety of flight conditions in operating passenger transport services is large and some aspects of aircraft engine emissions may need to be reviewed to understand the performance of the aircraft as a whole.

Author Contributions

Conceptualization, A.M.R., A.S.d.l.C. and R.E.G.D.; methodology, A.M.R. and A.S.d.l.C.; software, A.S.d.l.C.; validation, A.M.R. and A.S.d.l.C.; formal analysis, A.M.R. and A.S.d.l.C.; investigation, A.M.R. and A.S.d.l.C.; resources, A.M.R. and A.S.d.l.C.; data curation, A.M.R. and A.S.d.l.C.; writing—original draft preparation, A.M.R. and A.S.d.l.C.; writing—review and editing, A.M.R.; visualization, A.S.d.l.C.; supervision, R.E.G.D.; project administration, A.M.R. All authors have read and agreed to the published version of the manuscript.

Funding

This research received no external funding.

Institutional Review Board Statement

Not applicable.

Informed Consent Statement

Not applicable.

Data Availability Statement

Data is available on request due to restrictions. The data presented in this study are available on request from the corresponding author. The primary traffic data source is publicly available from the Statistical Site property of Aena SME, S.A., as described in references.

Conflicts of Interest

The authors declare no conflict of interest.

Appendix A

Table A1. List of Commercial Airplanes Considered in the Research.
IATA
Designator
ICAO
Designator
Aircraft
Type
Manufacturer
(as of 14 October 2022)
AT7AT72Aerospatiale-Alenia ATR 72Avions de Transport Régional GIE
319/32DA319Airbus A319 ceo/sharkletsAirbus SAS
320/32AA320Airbus A320 ceo/sharkletsAirbus SAS
321/32BA321Airbus A321 ceo/sharkletsAirbus SAS
738/73HB738Boeing 737-800/wingletsThe Boeing Company
712B712Boeing 717-200The Boeing Company
CR2CRJ2Canadair Regional Jet (CRJ) 200MHI RJ Aviation ULC
CR9CRJ9Canadair Regional Jet (CRJ) 900MHI RJ Aviation ULC
CRKCRJXCanadair Regional Jet (CRJ) 1000MHI RJ Aviation ULC
E95E195Embraer 195Embraer S.A.
295E295Embraer 195-E2Embraer S.A.
M81/M82/M83/M87MD81/MD82/MD83/MD87McDonnell Douglas MD-80/90The Boeing Company
Table A2. List of Scheduled Airlines Considered in the Research.
IATA
Designator
ICAO
Designator
Trade
Name
Air Operator’s Certificate (AOC) Issued by DGAC (as of 14 October 2022)
UXAEAAir EuropaES.AOC.004
X5OVAAir Europa ExpressES.AOC.020
YWANEAir NostrumES.AOC.002
NTIBBBinter CanariasES.AOC.011
PMCNFCanaryflyES.AOC.100
IBIBEIberiaES.AOC.001
I2IBSIberia ExpressES.AOC.117
formerly JKformerly JKKSpanairwithdrawn
V7VOEVoloteaES.AOC.115
VYVLGVuelingES.AOC.060
Table A3. List of Representative Engines Considered in the Research.
PropulsionAircraftEngines
TurbopropATR 72-500 (72-212A)2 × Pratt & Whitney Canada PW100
TurbopropATR 72-600 (72-212A)2 × Pratt & Whitney Canada PW100
TurbofanAirbus A320-271N2 × CFM Leap-1A/PW1100G-JM
TurbofanAirbus A321-271N2 × General Electric CF34-8C5A1
TurbofanAirbus A319-1002 × General Electric CF34-8C5
TurbofanAirbus A320-214 2 × CFM56-5B4/P
TurbofanAirbus A321-231 (WL)2 × IAE V2533-A5
TurbopropATR 72-500 (72-212A)2 × Pratt & Whitney Canada PW100
TurbopropATR 72-600 (72-212A)2 × Pratt & Whitney Canada PW100
TurbofanBoeing 737-8AS (WL)2 × CFM56-7B
TurbofanBoeing 737-85P (WL)2 × CFM56-7
TurbofanBoeing 717-2BL/-23S/-2CM2 × BMW RR BR715
TurbofanBombardier CRJ1000 (CL-600-2E25)2 × General Electric CF34-8C5A1
TurbofanBombardier CRJ900 (CL-600-2D24)2 × General Electric CF34-8C5
TurbofanBombardier CRJ200 (CL-600-2B19)2 × General Electric CF34-3B1
TurbofanEmbraer E195-E2 (ERJ 190-400 STD)2 × Pratt & Whitney Canada PW1900G
TurbofanEmbraer ERJ-195LR (ERJ 190-200 LR)2 × General Electric CF34-10E
TurbofanMcDonnell Douglas MD-80/902 × PW JT8D-219

References

  1. European Union. Directive 2003/87/EC of the European Parliament and of the Council of 13 October 2003 establishing a scheme for greenhouse gas emission allowance trading within the Community and amending Council Directive 96/61/EC. Off. J. Eur. Union 2003, L 275/32, 32003L0087. [Google Scholar]
  2. European Union. Proposal for a Directive of the European Parliament and of the Council amending Directive 2003/87/EC as regards aviation’s contribution to the Union’s economy-wide emission reduction target and appropriately implementing a global market-based measure. Off. J. Eur. Union 2021, COM/2021/552, 52021PC0552. [Google Scholar]
  3. Kopsch, F. Aviation and the EU Emissions Trading Scheme—Lessons learned from previous emissions trading schemes. Energy Policy 2012, 49, 770–773. [Google Scholar] [CrossRef] [Green Version]
  4. European Union. Directive 2008/101/EC of the European Parliament and of the Council of 19 November 2008 amending Directive 2003/87/EC so as to include aviation activities in the scheme for greenhouse gas emission allowance trading within the Community. Off. J. Eur. Union 2009, L 8/3, 32008L0101. [Google Scholar]
  5. European Union. Commission Decision 2009/450/EC of 8 June 2009 on the detailed interpretation of the aviation activities listed in Annex I to Directive 2003/87/EC of the European Parliament and of the Council. Off. J. Eur. Union 2009, L 149/69, 32009D0450. [Google Scholar]
  6. European Union. Decision No 377/2013/EU of the European Parliament and of the Council of 24 April 2013 derogating temporarily from Directive 2003/87/EC establishing a scheme for greenhouse gas emission allowance trading within the Community. Off. J. Eur. Union 2013, L 113/1, 32013D0377. [Google Scholar]
  7. European Union. Regulation (EU) No 421/2014 of the European Parliament and of the Council of 16 April 2014 amending Directive 2003/87/EC establishing a scheme for greenhouse gas emission allowance trading within the Community, in view of the implementation by 2020 of an international agreement applying a single global market-based measure to international aviation emissions. Off. J. Eur. Union 2014, L 129/1, 32014R0421. [Google Scholar]
  8. European Union. Regulation (EU) 2017/2392 of the European Parliament and of the Council of 13 December 2017 amending Directive 2003/87/EC to continue the current limitations of scope for aviation activities and to prepare to implement a global market-based measure from 2021. Off. J. Eur. Union 2017, L 350/7, 32017R2392. [Google Scholar]
  9. Feng, Q.; Gauthier, P. Untangling Urban Sprawl and Climate Change: A Review of the Literature on Physical Planning and Transportation Drivers. Atmosphere 2021, 12, 547. [Google Scholar] [CrossRef]
  10. Jain, S.; Chao, H.; Mane, M.; Crossley, W.; DeLaurentis, D. Estimating the Reduction in Future Fleet-Level CO2 Emissions from Sustainable Aviation Fuel. Front. Energy Res. 2021, 9, 771705. [Google Scholar] [CrossRef]
  11. Macintosh, A.; Wallace, L. International aviation emissions to 2025: Can emissions be stabilized without restricting demand? Energy Policy 2009, 37, 264–273. [Google Scholar] [CrossRef]
  12. Amizadeh, F.; Alonso, G.; Benito, A.; Morales-Alonso, G. Analysis of the recent evolution of commercial air traffic CO2 emissions and fleet utilization in the six largest national markets of the European Union. J. Air Transp. Manag. 2016, 55, 9–19. [Google Scholar] [CrossRef]
  13. Alonso, G.; Benito, A.; Lonza, L.; Kousoulidou, M. Investigations on the distribution of air transport traffic and CO2 emissions within the European Union. J. Air Transp. Manag. 2014, 36, 85–93. [Google Scholar] [CrossRef] [Green Version]
  14. Martínez Raya, A.; González-Sánchez, V.M. Some Considerations about Value Creation in Regard to Entrepreneurship and Innovation from Public Service Obligations on Scheduled Air Transport. In Analyzing the Relationship between Innovation, Value Creation, and Entrepreneurship, 1st ed.; Galindo-Martín, M., Mendez-Picazo, M., Castaño-Martínez, M., Eds.; IGI Global: Hershey, PA, USA, 2020; pp. 289–306. [Google Scholar] [CrossRef]
  15. Martínez Raya, A.; González-Sánchez, V.M. Efficiency and Sustainability of Regional Aviation on Insular Territories of the European Union: A Case Study of Public Service Obligations on Scheduled Air Routes among the Balearic Islands. Sustainability 2021, 13, 3949. [Google Scholar] [CrossRef]
  16. Martínez Raya, A. Sustainable and efficient transportation in special territories of the European Union through public service obligations: The case of scheduled air services serving the Spanish city of Melilla. World Rev. Intermodal Transp. Res. 2021, 10, 361–377. [Google Scholar] [CrossRef]
  17. Martínez Raya, A.; González-Sánchez, V.M. Efficiency and sustainability of public service obligations on scheduled air services between Almeria and Seville. Econ. Res. Ekon. Istraž. 2020, 2751–2768. [Google Scholar] [CrossRef] [Green Version]
  18. Llano, C.; Pérez-Balsalobre, S.; Pérez-García, J. Greenhouse Gas Emissions from Intra-National Freight Transport: Measurement and Scenarios for Greater Sustainability in Spain. Sustainability 2018, 10, 2467. [Google Scholar] [CrossRef] [Green Version]
  19. Aena Air Traffic Statistics. Statistical Data for the Period 2011–2020. Available online: https://www.aena.es/es/estadisticas/inicio.html (accessed on 14 October 2022).
  20. ICAO. Carbon Emissions Calculator. Guidelines Methodology Manual 2018, Version 11; ICAO: Montreal, QC, Canada, 2018. [Google Scholar]
  21. European Union. Council Regulation (EEC) No 95/93 of 18 January 1993 on common rules for the allocation of slots at community airports. Off. J. Eur. Union 1993, L 14/1, 31993R0095. [Google Scholar]
  22. The Kingdom of Spain. Royal Decree 20/2014, of 17 January, supplementing the legal regime on the allocation of slots at Spanish airports. Off. State Gaz. 2014, 16, 2748–2761, BOE-A-2014-508. [Google Scholar]
  23. Martín-Cejas, R.R. The Influence of the Resident Subsidy on Regional Carrier Economies and the Environment in the Canary Interisland Air Traffic Network. Tour. Hosp. 2022, 3, 558–572. [Google Scholar] [CrossRef]
  24. Martínez Raya, A.; González-Sánchez, V.M. Tender Management Relating to Imposition of Public Service Obligations on Scheduled Air Routes: An Approach Involving Digital Transformation of Procurement Procedures in Spain. Sustainability 2020, 12, 5322. [Google Scholar] [CrossRef]
  25. Eugenio-Martin, J.L. Estimating the Tourism Demand Impact of Public Infrastructure Investment: The Case of Malaga Airport Expansion. Tour. Econ. 2016, 22, 254–268. [Google Scholar] [CrossRef]
  26. Aena Press Release of 23 March 2022. Available online: https://www.aena.es/doc/pressdetail/220323-aena-temporada-verano-2022-eng.pdf (accessed on 14 October 2022).
  27. IndexMundi. Commodity Prices Indices. Available online: https://www.indexmundi.com/commodities/?commodity=jet-fuel&months=180 (accessed on 14 October 2022).
  28. IATA. Jet Fuel Price Monitor. Statistical Data for the Period 2011–2020. Available online: https://www.iata.org/en/publications/economics/fuel-monitor/ (accessed on 14 October 2022).
  29. US Energy Information Administration. Spot Prices for Crude Oil and Petroleum Product. Available online: https://www.eia.gov/dnav/pet/hist/eer_epjk_pf4_rgc_dpgD.htm (accessed on 14 October 2022).
  30. Winchester, N.; Malina, R.; Staples, M.D.; Barrett, S.R.H. The impact of advanced biofuels on aviation emissions and operations in the U.S. Energy Econ. 2015, 49, 482–491. [Google Scholar] [CrossRef] [Green Version]
  31. Miyoshi, C.; Mason, K.J. The Carbon Emissions of Selected Airlines and Aircraft Types in Three Geographic Markets. J. Air Transp. Manag. 2009, 15, 138–147. [Google Scholar] [CrossRef] [Green Version]
  32. Tokuslu, A. Estimation of Aircraft Emissions at Georgian International Airport. Energy 2020, 206, 118219. [Google Scholar] [CrossRef]
  33. Tarr, A.P.; Smith, I.J.; Rodger, C.J. Carbon dioxide emissions from international air transport of people and freight: New Zealand as a case study. Environ. Res. Commun. 2022, 4, 075012. [Google Scholar] [CrossRef]
  34. Baldelli, A. Evaluation of a low-cost multi-channel monitor for indoor air quality through a novel, low-cost, and reproducible platform. Meas. Sensors 2021, 17, 100059. [Google Scholar] [CrossRef]
  35. Saini, J.; Dutta, M.; Marques, G. A comprehensive review on indoor air quality monitoring systems for enhanced public health. Sustain. Environ. Res. 2020, 30, 6. [Google Scholar] [CrossRef] [Green Version]
  36. Clements, A.L.; Griswold, W.G.; RS, A.; Johnston, J.E.; Herting, M.M.; Thorson, J.; Collier-Oxandale, A.; Hannigan, M. Low-Cost Air Quality Monitoring Tools: From Research to Practice (A Workshop Summary). Sensors 2017, 17, 2478. [Google Scholar] [CrossRef] [Green Version]
  37. Karagulian, F.; Barbiere, M.; Kotsev, A.; Spinelle, L.; Gerboles, M.; Lagler, F.; Redon, N.; Crunaire, S.; Borowiak, A. Review of the Performance of Low-Cost Sensors for Air Quality Monitoring. Atmosphere 2019, 10, 506. [Google Scholar] [CrossRef] [Green Version]
Figure 1. Block diagram for data set collection. Source: own compilation based on research sources according to Appendix A—Load Factors by Route Group from [20] (pp. 12–13), and Appendix C—ICAO Fuel Consumption Table from [20] (pp. 17–23).
Processes 11 00741 g001
Figure 2. Flow chart research process. Source: own elaboration according to research design.
Processes 11 00741 g002
Figure 3. Overview graphic of the routes analyzed in the study whose pollutant emissions have resulted in estimated tons of carbon dioxide equivalent greater than 1.5% with regard to the five airports. Source: own calculations based on data provided from primary sources ([19,20]). Note: the use of color-coded airports, in addition to their IATA designators, has been harmonized throughout the paper, depending on each of them, for a better understanding.
Processes 11 00741 g003
Figure 4. Overall fleet performance. Source: own elaboration from data published by [19].
Processes 11 00741 g004
Figure 5. Cumulative carbon dioxide emissions in tons (T) of carbon dioxide equivalent associated with scheduled seasons between 2001 and 2020. Source: own calculation based on data published by [19] according to guidelines provided by [20]. Note: although the IATA Summer schedule begins on the last Sunday of March and ends on the last Saturday of October, and the IATA Winter schedule begins on the last Sunday of October and ends on the last Saturday of March, the calculation has been made by considering the same semester period in every year for simplification purposes.
Processes 11 00741 g005
Figure 6. Monthly carbon dioxide emissions (disaggregated by each airport) between 2001 and 2020. Source: own calculation based on data published by [19] according to guidelines provided by [20].
Processes 11 00741 g006
Figure 7. Carbon dioxide emissions from main domestic corridors operating in MAD airport, where a rough sketch means more emissions than the thinner one as follows: (a) Partial emission per passenger and per route (arithmetic average: 72.58, standard deviation: 13.76); (b) Total emission of routes concerned. Source: own elaboration from the data provided by [19,20].
Processes 11 00741 g007
Figure 8. Carbon dioxide emissions from main domestic corridors operating in LPA airport, where a rough sketch means more emissions than the thinner one as follows: (a) Partial emission per passenger and route (arithmetic average: 112.43, standard deviation: 65.99); (b) Total emission of routes concerned. Source: own elaboration from the data provided by [19,20].
Processes 11 00741 g008
Figure 9. Carbon dioxide emissions from main domestic corridors operating in BCN airport, where a rough sketch means more emissions than the thinner one as follows: (a) Partial emission per passenger and route (arithmetic average: 79.39, standard deviation: 25.64); (b) Total emission of routes concerned. Source: own elaboration from the data provided by [19,20].
Processes 11 00741 g009
Figure 10. Carbon dioxide emissions from main domestic corridors operating in AGP airport, where a rough sketch means more emissions than the thinner one as follows: (a) Partial emission per passenger and route (arithmetic average: 75.69, standard deviation: 22.37); (b) Total emission of routes concerned. Source: own elaboration from the data provided by [19,20].
Processes 11 00741 g010
Figure 11. Carbon dioxide emissions from main domestic corridors operating in PMI airport, where a rough sketch means more emissions than the thinner one as follows: (a) Partial emission per passenger and route (arithmetic average: 76.18, standard deviation: 30.21); (b) Total emission of routes concerned. Source: own elaboration from the data provided by [19,20].
Processes 11 00741 g011
Figure 12. The relative ratio of carbon dioxide emissions in kilograms (kg) per passenger (PAX) and kilometer (km) according to the distance traveled in kilometers (km) by each aircraft selected. Source: own elaboration based on data compiled from [19] and weighted from [20].
Processes 11 00741 g012
Figure 13. The relative ratio of carbon dioxide emissions in kilograms (kg) per passenger (PAX) according to the distance traveled in kilometers (km) by each aircraft selected. Source: own elaboration based on data compiled from [19] and weighted from [20].
Processes 11 00741 g013
Figure 14. Comparative performance of carbon dioxide emissions and fuel prices. Source: own elaboration based on data compiled from [19] and weighted from [20] according to [28,29].
Processes 11 00741 g014
Figure 15. Trend analysis of carbon dioxide emissions and fuel prices. Source: own elaboration based on data compiled from [19] and weighted from [20] according to [28,29].
Processes 11 00741 g015
Table 1. Key facts of air passenger traffic at main airports in Spain between 2004 and 2019.
IATA
Code
Airport
Group a
Airport
Typology b
Airport
Category c
Average Annual Passenger Traffic dCAGR e
MADMajorHubLevel 348,414,0000.7
BCNMajorHubLevel 336,116,0001.3
PMIMajorTouristicLevel 323,781,0000.6
AGPITouristicLevel 314,284,0000.8
LPACanaryTouristicLevel 310,747,0000.5
Source: own calculation based on information from Aena database [19]; additional information provided by the Spanish Directorate-General for Civil Aviation (DGAC) upon request. Explanatory notes: a,b according to the classification provided by Aena; c according to the categorization under Article 3 of [21] and Article 4 of [22], Spanish air facilities have been classified as non-coordinated airports (Level 1), airports with schedules facilitated (Level 2), or coordinated airports (Level 3); d total amount, including both arrivals and departures at each airport; e Compound Annual Growth Rate (expressed as a decimal figure).
Table 2. Existing civil air facilities in Spain (as of 14 November 2022).
Airport
Full Name
IATA
Designator
ICAO
Designator
Airport
Operator
Airport
Type
Ownership
Type
A CoruñaLCGLECOAenaGeneral InterestStatewide
Adolfo Suárez Madrid-Barajas MADLEMDAenaGeneral InterestStatewide
AlbaceteABCLEABAenaGeneral InterestStatewide
Algeciras †AEILEAGAenaGeneral InterestStatewide
Alicante-Elche Miguel HernándezALCLEALAenaGeneral InterestStatewide
AlmeríaLEILEAMAenaGeneral InterestStatewide
Andorra–La Seu d’UrgellLEULESUGenCatAutonomic InterestRegional
AsturiasOVDLEASAenaGeneral InterestStatewide
BadajozBJZLEBZAenaGeneral InterestStatewide
BilbaoBIOLEBBAenaGeneral InterestStatewide
Burgos RGSLEBGAenaGeneral InterestStatewide
Castellón-Costa AzaharCDTLECNAerocasGeneral InterestStatewide
Aeropuerto de Ciudad RealCQMLERLCRIAIndustrial InterestPrivate
Ceuta †JCUGECEAenaGeneral InterestStatewide
César Manrique-LanzaroteACEGCRRAenaGeneral InterestStatewide
CórdobaODBLEBAAenaGeneral InterestStatewide
El HierroVDEGCHIAenaGeneral InterestStatewide
Federico García Lorca Granada-JaénGRXLEGRAenaGeneral InterestStatewide
FuerteventuraFUEGCFVAenaGeneral InterestStatewide
Girona-Costa BravaGROLEGEAenaGeneral InterestStatewide
Gran CanariaLPAGCLPAenaGeneral InterestStatewide
Huesca-Pirineos HSKLEHCAenaGeneral InterestStatewide
IbizaIBZLEIBAenaGeneral InterestStatewide
Internacional Región de Murcia *RMULEMIAenaGeneral InterestStatewide
JerezXRYLEJRAenaGeneral InterestStatewide
Josep Tarradellas Barcelona-El PratBCNLEBLAenaGeneral InterestStatewide
La GomeraGMZGCGMAenaGeneral InterestStatewide
La Palma SPCGCLAAenaGeneral InterestStatewide
LeónLENLELNAenaGeneral InterestStatewide
Lleida-AlguaireILDLEDAGenCatAutonomic InterestRegional
Logroño-AgoncilloRJLLERJAenaGeneral InterestStatewide
Madrid-Cuatro Vientos ‡-LECUAenaGeneral InterestStatewide
MelillaMLNGEMLAenaGeneral InterestStatewide
MenorcaMAHLEMHAenaGeneral InterestStatewide
Málaga-Costa del SolAGPLEMGAenaGeneral InterestStatewide
Palma de MallorcaPMILEPAAenaGeneral InterestStatewide
PamplonaPNALEPPAenaGeneral InterestStatewide
ReusREULERSAenaGeneral InterestStatewide
SabadellQSALELLAenaGeneral InterestStatewide
SalamancaSLMLESAAenaGeneral InterestStatewide
San SebastiánEASLESOAenaGeneral InterestStatewide
Santiago-Rosalía de CastroSCQLESTAenaGeneral InterestStatewide
Seve Ballesteros-SantanderSDRLEXJAenaGeneral InterestStatewide
SevillaSVQLEZLAenaGeneral InterestStatewide
Son Bonet ‡-LESBAenaGeneral InterestStatewide
Tenerife Norte-Ciudad de La LagunaTFNGCXOAenaGeneral InterestStatewide
Tenerife SurTFSGCTSAenaGeneral InterestStatewide
TeruelTEVLETLPlataIndustrial InterestSemipublic
ValenciaVLCLEVCAenaGeneral InterestStatewide
ValladolidVLLLEVDAenaGeneral InterestStatewide
VigoVGOLEVXAenaGeneral InterestStatewide
VitoriaVITLEVTAenaGeneral InterestStatewide
ZaragozaZAZLEZGAenaGeneral InterestStatewide
Source: own elaboration based on IATA and ICAO airport codes. Explanatory note: A dagger “†” denotes a heliport with scheduled flights, while a double dagger “‡” indicates an airport mainly intended for general aviation. (*) The last civil airport belonging to Aena’s network, which replaced the former one, named Murcia-San Javier (IATA: MJV, ICAO: LELC), specifically intended for military use so far.
Table 3. Main domestic routes in the Spanish airport network over the study period (2011–2020).
Departure ↓\Arrival →MADLPABCNAGPPMI
LCGEC1EC2EC3 EC4
MADEC5EC6EC7EC8
ABC EC9
AEI
ALCEC10EC11EC12EC13EC14
LEIEC15 EC16EC17EC18
LEU
OVDEC19EC20EC21EC22EC23
BJZEC24 EC25
BIOEC26EC27EC28EC29EC30
RGSEC31 EC32
CDT
CQMEC33 EC34
JCU EC35
ACEEC36EC37EC38EC39
ODB
VDE EC40
GRXEC41EC42EC43EC44EC45
FUEEC46EC47EC48EC49
GROEC50 EC51
LPAEC5EC52EC53EC54
HSK
IBZEC55 EC56EC57EC58
RMU/MJV *EC59 EC60
XRYEC61 EC62EC63EC64
BCNEC6EC52EC65EC66
GMZ EC67
SPCEC68EC69EC70
LENEC71 EC72EC73EC74
ILD EC75
RJLEC76 EC77
LECU **
MLNEC78EC79EC80EC81EC82
MAHEC83 EC84EC85EC86
AGPEC7EC53EC65EC87
PMIEC8EC54EC66EC87
PNAEC88 EC89 EC90
REU EC91 EC92
QSA
SLM EC93 EC94
EASEC95 EC96
SCQEC97EC98EC99EC100EC101
SDREC102EC103EC104EC105EC106
SVQEC107EC108EC109 EC110
LESB **
TFNEC111EC112EC113EC114EC115
TFSEC116EC117EC118EC119EC120
TEV
VLCEC121EC122EC123EC124EC125
VLL EC126EC127EC128
VGOEC129EC130EC131
VITEC132 EC133 EC134
ZAZEC135EC136EC137EC138EC139
Source: own codification based on IATA airport codes. Explanatory note: Black circle “●” denotes an airway whose origin and destination are the same, which applies to non-commercial flights, either for training or calibration purposes, while a blank space indicates “not applicable” according to the analysis carried out on national scheduled air transport services in Spain. (*) For the purpose of the analysis carried out within the research period, both airports have been considered as a unit, since the former one (MJV) remained operating until 15 January 2019, and the new one (RMU) has been active since 16 January 2019. (**) In the absence of the IATA code, the ICAO code is shown.
Table 4. Air routes’ standard operational and emission facts over the study period (2011–2020).
Air
Route Code
Travel
Distance
(km) a
Travel
Time
(h)
Initial
Heading
Vector
Block
Fuel
(kTon) b,c
CO2
Emissions
(kTon) b,c
Emissions CO2/PAX (kg) b,cMost Common
Airline d
Most
Common
Airliner d
Standard Cabin Config.Share of Airliner e
EC15060:54126° (SE) 3.5 11.1 97.67IB319Y1440.31
EC218182:21202° (SSW) 8.9 28.2 190.28IB320CY1800.51
EC38901:19101° (E)5.3 16.7 113.35VY320CY1800.61
EC410171:28110° (ESE)5.0 15.9 107.31IB32ACY1800.59
EC517652:12221° (SW) 10.2 32.1 170.70FR73HY1890.26
EC64840:5277° (ENE)4.0 12.5 81.04IB320CY1800.44
EC74320:49191° (S) 2.4 7.7 77.98I2320CY1800.46
EC85480:5599° (E) 3.7 11.7 80.39FR73HY1890.52
EC94250:5051° (NE)1.7 5.3 127.73YWCR2Y501.00
EC103570:44315° (NW)2.4 7.6 73.45IB320CY1800.34
EC1117942:22234° (SW)6.119.1 234.80YWCR9Y900.40
EC124040:4733° (NNE)3.511.2 76.21VY320CY1800.63
EC133920:53244° (WSW)0.9 2.7 n/an/aCNJVIP1.00
EC143190:4163° (ENE)2.3 7.1 66.57VY320CY1800.33
EC154180:49346° (NNW)2.3 7.1 95.72YWCRKCY1000.38
EC166261:0236° (NE)3.8 11.9 92.87VY320CY1800.41
EC171910:40265° (W) 0.3 0.8 n/an/aBE2VIP0.77
EC185390:5854° (NE) 2.6 8.2 138.74YWCR2Y500.40
EC193960:46148° (SSE)3.1 9.8 89.98V7319Y1440.35
EC2019272:22209° (SSW)8.0 25.4 182.16FR73HY1890.32
EC217131:07108° (ESE)4.6 14.5 98.26VY320CY1800.66
EC227761:17170° (S)4.6 14.4 137.67V7717Y1250.36
EC238561:17118° (ESE)4.4 14.7 110.60V7320CY1800.29
EC243310:4356° (ENE)1.3 4.1 113.77YWCR2Y500.64
EC258041:1568° (ENE)2.5 7.8 137.39YWCR9Y900.40
EC264680:51190° (S)2.8 8.8 79.11IB319Y1440.28
EC2720412:35217° (SW)9.7 30.7 208.06VY320CY1800.39
EC284680:51117° (ESE)3.7 11.8 80.06VY320CY1800.56
EC297481:10191° (S)4.7 14.9 101.54VY320CY1800.60
EC306291:02130° (SE)4.2 13.4 92.99VY320CY1800.39
EC314880:54179° (S)1.9 6.0 133.43YWCR2Y500.75
EC326191:03102° (ESE)2.0 6.3 153.28YWCR2Y501.00
EC331850:3411° (N)0.5 1.6 n/an/aCNJVIP1.00
EC345830:5960° (ENE)4.2 13.4 90.29n/a320CY1801.00
EC351130:3040° (NE)0.1 0.3 n/an/aNDEVIP1.00
EC3615742:0033° (NNE)8.0 25.2 157.27FR73HY1890.55
EC372080:44238° (WSW)0.6 1.9 31.80NTAT7Y680.56
EC3819742:3142° (NE)9.8 31.0 181.56VY32BCY2320.36
EC3912081:4042° (NE) 6.6 20.8 140.95VY320CY1800.43
EC402470:4986° (E) 0.6 1.9 35.13YWAT7Y680.63
EC413670:453° (N)2.5 7.9 91.93YWCRKCY1000.39
EC4214951:59230° (SW) 8.4 26.5 147.39VY32BCY2320.60
EC436811:0546° (NE)4.6 14.7 96.17VY320CY1800.56
EC44860:30229° (SW) 0.1 0.4 n/an/aBE2VIP0.59
EC456271:0363° (ENE) 3.8 12.1 111.62YWE95C12Y1080.55
EC4616342:0432° (NNE) 8.2 25.8 161.34FR73HY1890.44
EC471600:39249° (WSW) 0.5 1.5 25.77NTAT7Y680.62
EC4820322:2941° (NE)9.6 30.2 189.21FR73HY1890.54
EC4912651:4442° (NE) 6.2 19.7 146.16VY320CY1800.43
EC505530:55256° (WSW) 4.1 13.0 83.54FR73HY1891.00
EC512610:37180° (S)2.5 8.0 53.60UX73HY1890.98
EC5221752:4442° (NE) 10.6 33.5 196.04VY32BCY2320.33
EC5314091:5444° (NE) 7.2 22.9 157.57VY320CY1800.48
EC5421102:4448° (NE)8.4 26.6 249.65YWCRKCY1000.28
EC554600:49295° (WNW) 3.0 9.5 75.55FR73HY1890.36
EC562760:3812° (NNE) 2.6 8.2 58.57YW320CY1800.41
EC575720:56246° (WSW) 3.4 10.9 84.30FR73HY1890.66
EC581400:3057° (ENE) 0.7 2.3 42.69YWCRKCY1000.25
EC593660:46323° (NW) 1.7 5.3 123.50YWCR2Y500.79
EC604761:2031° (NNE) 0.9 2.9 n/an/aCNJVIP1.00
EC614690:5127° (NNE) 2.9 9.3 95.05IB319Y1440.36
EC628671:1552° (NE) 5.1 16.0 104.02VY73HY1890.49
EC631400:3693° (E) 0.1 0.3 n/an/aPA1VIP1.00
EC648311:1565° (ENE) 5.2 16.6 108.36VY320CY1800.39
EC657661:11230° (SW) 4.8 15.0 102.83VY320CY1800.45
EC662020:33164° (SSE) 1.9 6.1 43.04FR73HY1890.40
EC671800:4193° (E) 0.6 2.0 51.60NTAT7Y680.45
EC6818472:2341° (NE) 9.3 29.5 192.50I2/IB320CY1800.66
EC692450:49108° (ESE) 0.7 2.2 36.28YWAT7Y680.60
EC7022832:5247° (NE)10.6 33.6 227.04VY320CY1800.60
EC712910:40143° (SE) 1.3 4.2 101.43YWCR2Y501.00
EC726571:06100° (E) 2.4 7.6 154.96YWCR2Y500.45
EC736641:06171° (S) 2.0 6.4 156.14YWCR2Y501.00
EC747821:15113° (ESE) 2.2 7.1 169.14YWCR2Y500.65
EC753050:41142° (SE) 1.4 4.4 103.84YWCR2Y500.44
EC762420:37206° (SSW)1.1 3.6 87.00YWCR2Y501.00
EC775340:57126° (SE)2.0 6.4 156.52YWCR2Y501.00
EC785811:28335° (N)1.2 3.9 70.57YWAT7Y680.97
EC7914323:09239° (WSW)2.5 7.9 140.98YWAT7Y681.00
EC808001:54319° (NW) 1.5 4.9 87.24YWAT7Y681.00
EC812080:45138° (SE) 0.6 1.7 31.80YWAT7Y680.82
EC826921:4145° (NE) 0.6 1.8 31.80YWAT7Y681.00
EC836671:39279° (W) 3.5 10.9 117.65YWCRKCY1000.32
EC842410:48312° (NW) 2.1 6.7 52.41VY320CY1800.50
EC858401:59248° (WSW) 5.1 16.2 109.31VY320CY1801.00
EC861320:35255° (WSW) 0.7 2.1 42.72YWCR9Y900.28
EC877101:0561° (ENE) 4.5 14.2 91.91UX73HY1890.41
EC882990:40213° (SSW) 1.8 5.6 78.74YWCRKCY1000.44
EC893490:44117° (ESE) 1.7 5.3 118.58YWCR2Y500.79
EC905130:56133° (SE) 1.4 4.5 80.83YWAT7Y681.00
EC91780:2577° (ENE) 0.7 2.2 22.70n/a320CY1800.78
EC922220:34143° (SE) 2.3 7.2 46.38FR73HY1890.97
EC936381:0584° (E) 2.0 6.2 153.58YWCR2Y500.98
EC947181:10100° (E) 1.7 5.5 161.71YWCR2Y501.00
EC953501:01205° (SSW) 1.1 3.6 50.13YWAT7Y680.55
EC963920:46124° (SE) 2.6 8.4 89.48VY319Y1440.77
EC974840:52122° (ESE) 3.7 11.6 81.04IB320CY1800.44
EC9817752:13203° (SSW) 7.9 24.9 171.54FR73HY1890.86
EC998851:1698° (E) 5.2 16.5 105.33FR73HY1890.42
EC1007681:09153° (SSE) 4.8 15.1 96.49FR73HY1890.54
EC10110051:24108° (ESE) 5.3 16.8 114.58FR73HY1890.47
EC1023270:43176° (S) 2.0 6.4 112.26YWCR2Y500.28
EC10320082:27215° (SW) 9.0 28.3 187.93FR73HY1890.97
EC1045400:54114° (ESE) 3.5 11.1 79.95FR73HY1890.51
EC1057521:08185° (S) 4.6 14.7 95.39FR73HY1891.00
EC1066961:04126° (SE) 4.3 13.7 91.14FR73HY1890.71
EC1073960:4630° (NNE) 2.8 8.9 75.72I2320CY1800.62
EC10813771:51223° (SW) 7.1 22.6 154.92I2320CY1800.42
EC1098101:1455° (NE) 5.0 15.7 106.55I2320CY1800.48
EC1107891:1070° (ENE) 4.9 15.4 97.96FR73HY1890.53
EC11117712:1238° (NE) 10.5 33.2 171.06UX73HY1890.27
EC1121120:33123° (ESE) 0.5 1.5 19.61NTAT7Y680.45
EC11321952:3945° (NE) 10.5 33.1 200.74FR73HY1890.40
EC11414341:5148° (NE) 7.4 23.3 147.14UX73HY1890.44
EC11521402:4650° (NE) 7.0 22.0 252.24YWCRKCY1000.67
EC11618242:1637° (NE) 8.9 28.3 174.78FR73HY1890.39
EC1171170:3496° (E) 0.5 1.5 20.22NTAT7Y680.28
EC11822462:4244° (NE) 10.0 31.6 204.26FR73HY1890.62
EC11914831:5447° (NE) 7.3 23.0 150.69FR73HY1890.71
EC12021892:4549° (NE) 10.5 33.1223.69VY320CY1801.00
EC1212860:40294° (WNW) 1.5 4.8 75.57YWCRKCY1000.37
EC12218802:19231° (SW) 7.4 23.3 178.80FR73HY1890.59
EC1232960:4146° (NE) 3.2 10.1 n/an/a763C18Y2460.25
EC1244710:50230° (SW) 1.8 5.6 76.26FR73HY1890.33
EC1252770:3888° (E) 2.0 6.4 56.06FR73HY1890.28
EC1265800:5792° (E) 3.5 10.9 84.74FR73HY1890.60
EC1275590:55177° (S) 4.1 13.0 83.82FR73HY1891.00
EC1286851:03108° (ESE) 2.9 9.3 83.82FR73HY1890.66
EC1294650:52113° (ESE) 3.3 10.4 96.00UXE95C12Y1080.37
EC13017012:16203° (SSW) 5.6 17.5 213.49YWCRKCY1000.51
EC1318961:1993° (E)5.3 16.8 113.79VY320CY1800.53
EC1322740:37195° (SSW) 2.9 9.0 n/an/a752Y2160.40
EC1334350:48112° (ESE) 3.2 10.1 n/an/a73YFREIGHT0.39
EC1345890:57127° (SE) 4.5 14.3 91.82UX73HY1891.00
EC1352490:41239° (WSW) 0.6 2.0 n/an/aCNJVIP1.00
EC13620052:27225° (SW) 9.2 29.2 187.58UX73HY1891.00
EC1372640:3798° (E) 2.4 7.6n/an/a734Y1500.63
EC1386291:00209° (SSW) 3.3 10.3 87.78UX73HY1890.80
EC1393970:47125° (SE) 3.0 9.6 90.90UXE95C12Y1080.46
Source: own calculation based on information provided by ICAO [20]. Explanatory note: a an orthodromic distance on cruise flight; b standard assumptions: Jet A1 density as of 0.804 kg/L, CO2 emissions as of 3.16 kg of CO2 per kg of Jet A1; c on route assumptions: maximum payload, no wind, one aircraft per leg under technical specifications by International Standard Atmosphere (ISA), Joint Aviation Requirements (JAR), EU Aviation Safety Agency (EASA), passengers (PAX); d IATA designator; e Emissions share per aircraft of each route regarding total routes thereof (expressed as a decimal figure). Not applicable (n/a) when scheduled flights (i.e., general aviation) have not been identified through analysis based on related air traffic data.
Table 5. Air corridor distribution on the travel distance 1.
Distance Segment (km)Percentage (%)Emission Share (%)Average (km)
Short Route: d ≤ 50067.3139.36296
Medium Route: 501 ≤ d ≤ 100019.9624.57680
Long Route: d ≥ 100112.7336.071799
Average Distance Traveled (km) 564
Source: own calculation in connection with the 2500 routes previously defined for the study. 1 Considered as orthodromic distance on cruise flight.
Table 6. Air corridor distribution on route type 1.
Route TypeNumber of RoutesPercentage
Short5841.73%
Medium4733.81%
Long3424.46%
Source: own calculation in connection with the 139 routes previously defined for the study. 1 According to the classification provided in Table 5.
Disclaimer/Publisher’s Note: The statements, opinions and data contained in all publications are solely those of the individual author(s) and contributor(s) and not of MDPI and/or the editor(s). MDPI and/or the editor(s) disclaim responsibility for any injury to people or property resulting from any ideas, methods, instructions or products referred to in the content.

