
A Case Study for an Assessment of Fire Station Selection in the Central Urban Area


1
School of Safety Science and Engineering, Changzhou University, Changzhou 213164, China
2
School of Environmental and Chemical Engineering, Zhaoqing University, Zhaoqing 526061, China
3
Department of Safety, Health, and Environmental Engineering, National Yunlin University of Science and Technology, Douliou 64002, Taiwan
*
Authors to whom correspondence should be addressed.
Safety 2023, 9(4), 84; https://doi.org/10.3390/safety9040084
Submission received: 18 October 2023
/
Revised: 9 November 2023
/
Accepted: 23 November 2023
/
Published: 4 December 2023
Abstract
:With the continual acceleration of urbanization, the amount of urban infrastructure and the quality of public services are increasing in many cities. A pressing concern in this context is the growing problem of incompatible fire protection construction, indicating a need for urban fire stations with well-planned layouts. However, research on optimizing the layout and placement of fire stations by considering the various factors affecting station layouts is lacking. The current study addressed this gap by establishing an optimal fire station layout by using a geographic information system (GIS) and elucidated the trends of GIS application in firefighting and rescue operations. The study’s findings reveal the benefits of avoiding blind spots, enhancing the selection of fire station sites, and optimizing service coverage. Furthermore, this study optimized the layout of CZ city’s downtown fire stations, which could enhance CZ city’s firefighting capabilities.
1. Introduction
Frequent emergencies in China that have led to considerable losses of both human life and property have limited the country’s overall social development [1,2]. To mitigate such losses, the government and researchers are increasingly emphasizing the need for improved urban public safety [3]. Efforts to prevent and mitigate urban disasters have been gradually increasing, with such efforts taking the form of improving firefighting facilities and the skills of relevant personnel, establishing government departments focused on firefighting, and increasing public awareness regarding fire safety. Despite these initiatives, the incidence of fires and their associated economic losses have not substantially decreased. In this case study, according to unofficial reports, from May 2019 to April 2020, a total of 800 fires occurred in CZ, a city in China, with the fires resulting in a direct economic loss of RMB25.5 million and a burned area of 24,118.8 m2. These statistics indicate that current fire protection planning and construction in the city have numerous problems [4].
Recent studies have highlighted the critical role of strategically located fire stations in urban settings [5]. Scholars have demonstrated that the proximity of fire stations significantly impacts emergency response times and outcomes [6]. Urban fire stations play a pivotal role in the vital task of firefighting and emergency rescue, rendering them an integral component of a city’s infrastructure and the principal responders during emergencies. The establishment of a scientifically sound and practical layout for urban fire stations can effectively protect the lives and property of a city’s residents. Moreover, establishing the optimal layout for CZ city’s downtown fire stations can address the shortcomings of the current layout and serve as a framework for the revision of relevant planning for fire stations [7,8,9].
Given the escalating occurrence and severity of extreme fire incidents on a global scale, our research underscores the criticality of implementing comprehensive fire-risk policies grounded in scientific principles. The significance of transitioning from conventional heuristics to more empirical methodologies in fire-risk management is emphasized by the European Union Civil Protection Peer Review Programme’s recent findings [9]. Making Cities Resilient 2030 webinar suggests that, in order to build efficacious strategies for the management and mitigation of fire risks, inclusive governance structures that include scientific information are necessary, as underlined in the webinar ‘Tackling Ur-ban Heat and Wildfire Risk’. With advances in urban intelligence, geographic information systems (GISs) have emerged as reliable tools with robust spatial analysis capabilities that can be applied for facility layout optimization, traffic accessibility assessment, and urban and rural planning management [10,11]. The network analysis function of the ArcGIS platform can be used to integrate spatial data and geography, thereby facilitating efficient and scientifically precise processing of information and data. This, in turn, can considerably enhance the accuracy of urban planning and development. The past research findings indicate that there are several areas of concern regarding the current state of the city and the fire station layout as outlined in the original plan. These concerns mostly revolve around the presence of multiple blind spots and significant overlap in service scopes. A recommended optimization and adjustment strategy for fire protection layout planning is presented, taking into account the research findings and the current circumstances [12].
Traditionally, the selection of the location and layout of fire stations has predominantly been completed using the circle drawing method, in which the planned area is divided into segments spanning 4–7 km2 [13]. In the United States and the United Kingdom [14,15], researchers have determined the response times for various types of fire engines for fires of different types and severities. Furthermore, the number, location, and jurisdiction of fire stations have been defined using an analytic hierarchy process, which considers factors such as hazard density, population density, proximity to major roads, land cover, and river distance [13,14,15]. A hybrid model based on network analysis and geometric coverage has been established, and it incorporates point of information data and road network and other related data. This model can be used to determine optimal locations for new fire stations and to enhance fire station coverage to ensure a response time of less than 5 min [16,17,18,19,20,21].
The following problems related to the current planning and layout of fire stations in CZ city were identified: First, the insufficient number of fire stations results in generally low coverage. Second, the fire stations are often too remote to provide comprehensive coverage within their designated jurisdictions. To address these challenges, the current study employed GIS network analysis, that is, a positioning-allocation model integrated with a traffic network model. This approach allows for quantitative analysis and spatial optimization, which enables the identification of how fire stations can be strategically positioned to meet the fire safety requirements of the downtown area of CZ city. To evaluate the resilience of our model and the dependability of its forecasts, we performed a quantitative sensitivity analysis. The objective of this research was to determine the parameters that have the most influence on the output of the model; therefore, offering valuable insights into the variables that should be selected with careful consideration. The major factors, including reaction time, road capacity, natural terrain, and economic development, were subjected to variations within a realistic range, taking into account probable fluctuations that may occur in the real world. The model’s sensitivity to these differences was assessed by examining the resultant alterations in the estimated best fire station placements. The sensitivity analysis serves the purpose of both validating the current application of the model and providing guidance for future revisions to the model in response to emerging facts or priorities.
This study optimized CZ city’s fire protection coverage and considered the economic benefits of such optimization. This paper is organized as follows: Section 2 analyzes the relevant literature and details the methodology adopted in the case study, Section 3 and Section 4 give the results and discussion, and Section 5 closes with the implications of our findings for fire station selection and risk management methods.
2. Research Objects and Methods
2.1. Research Objects
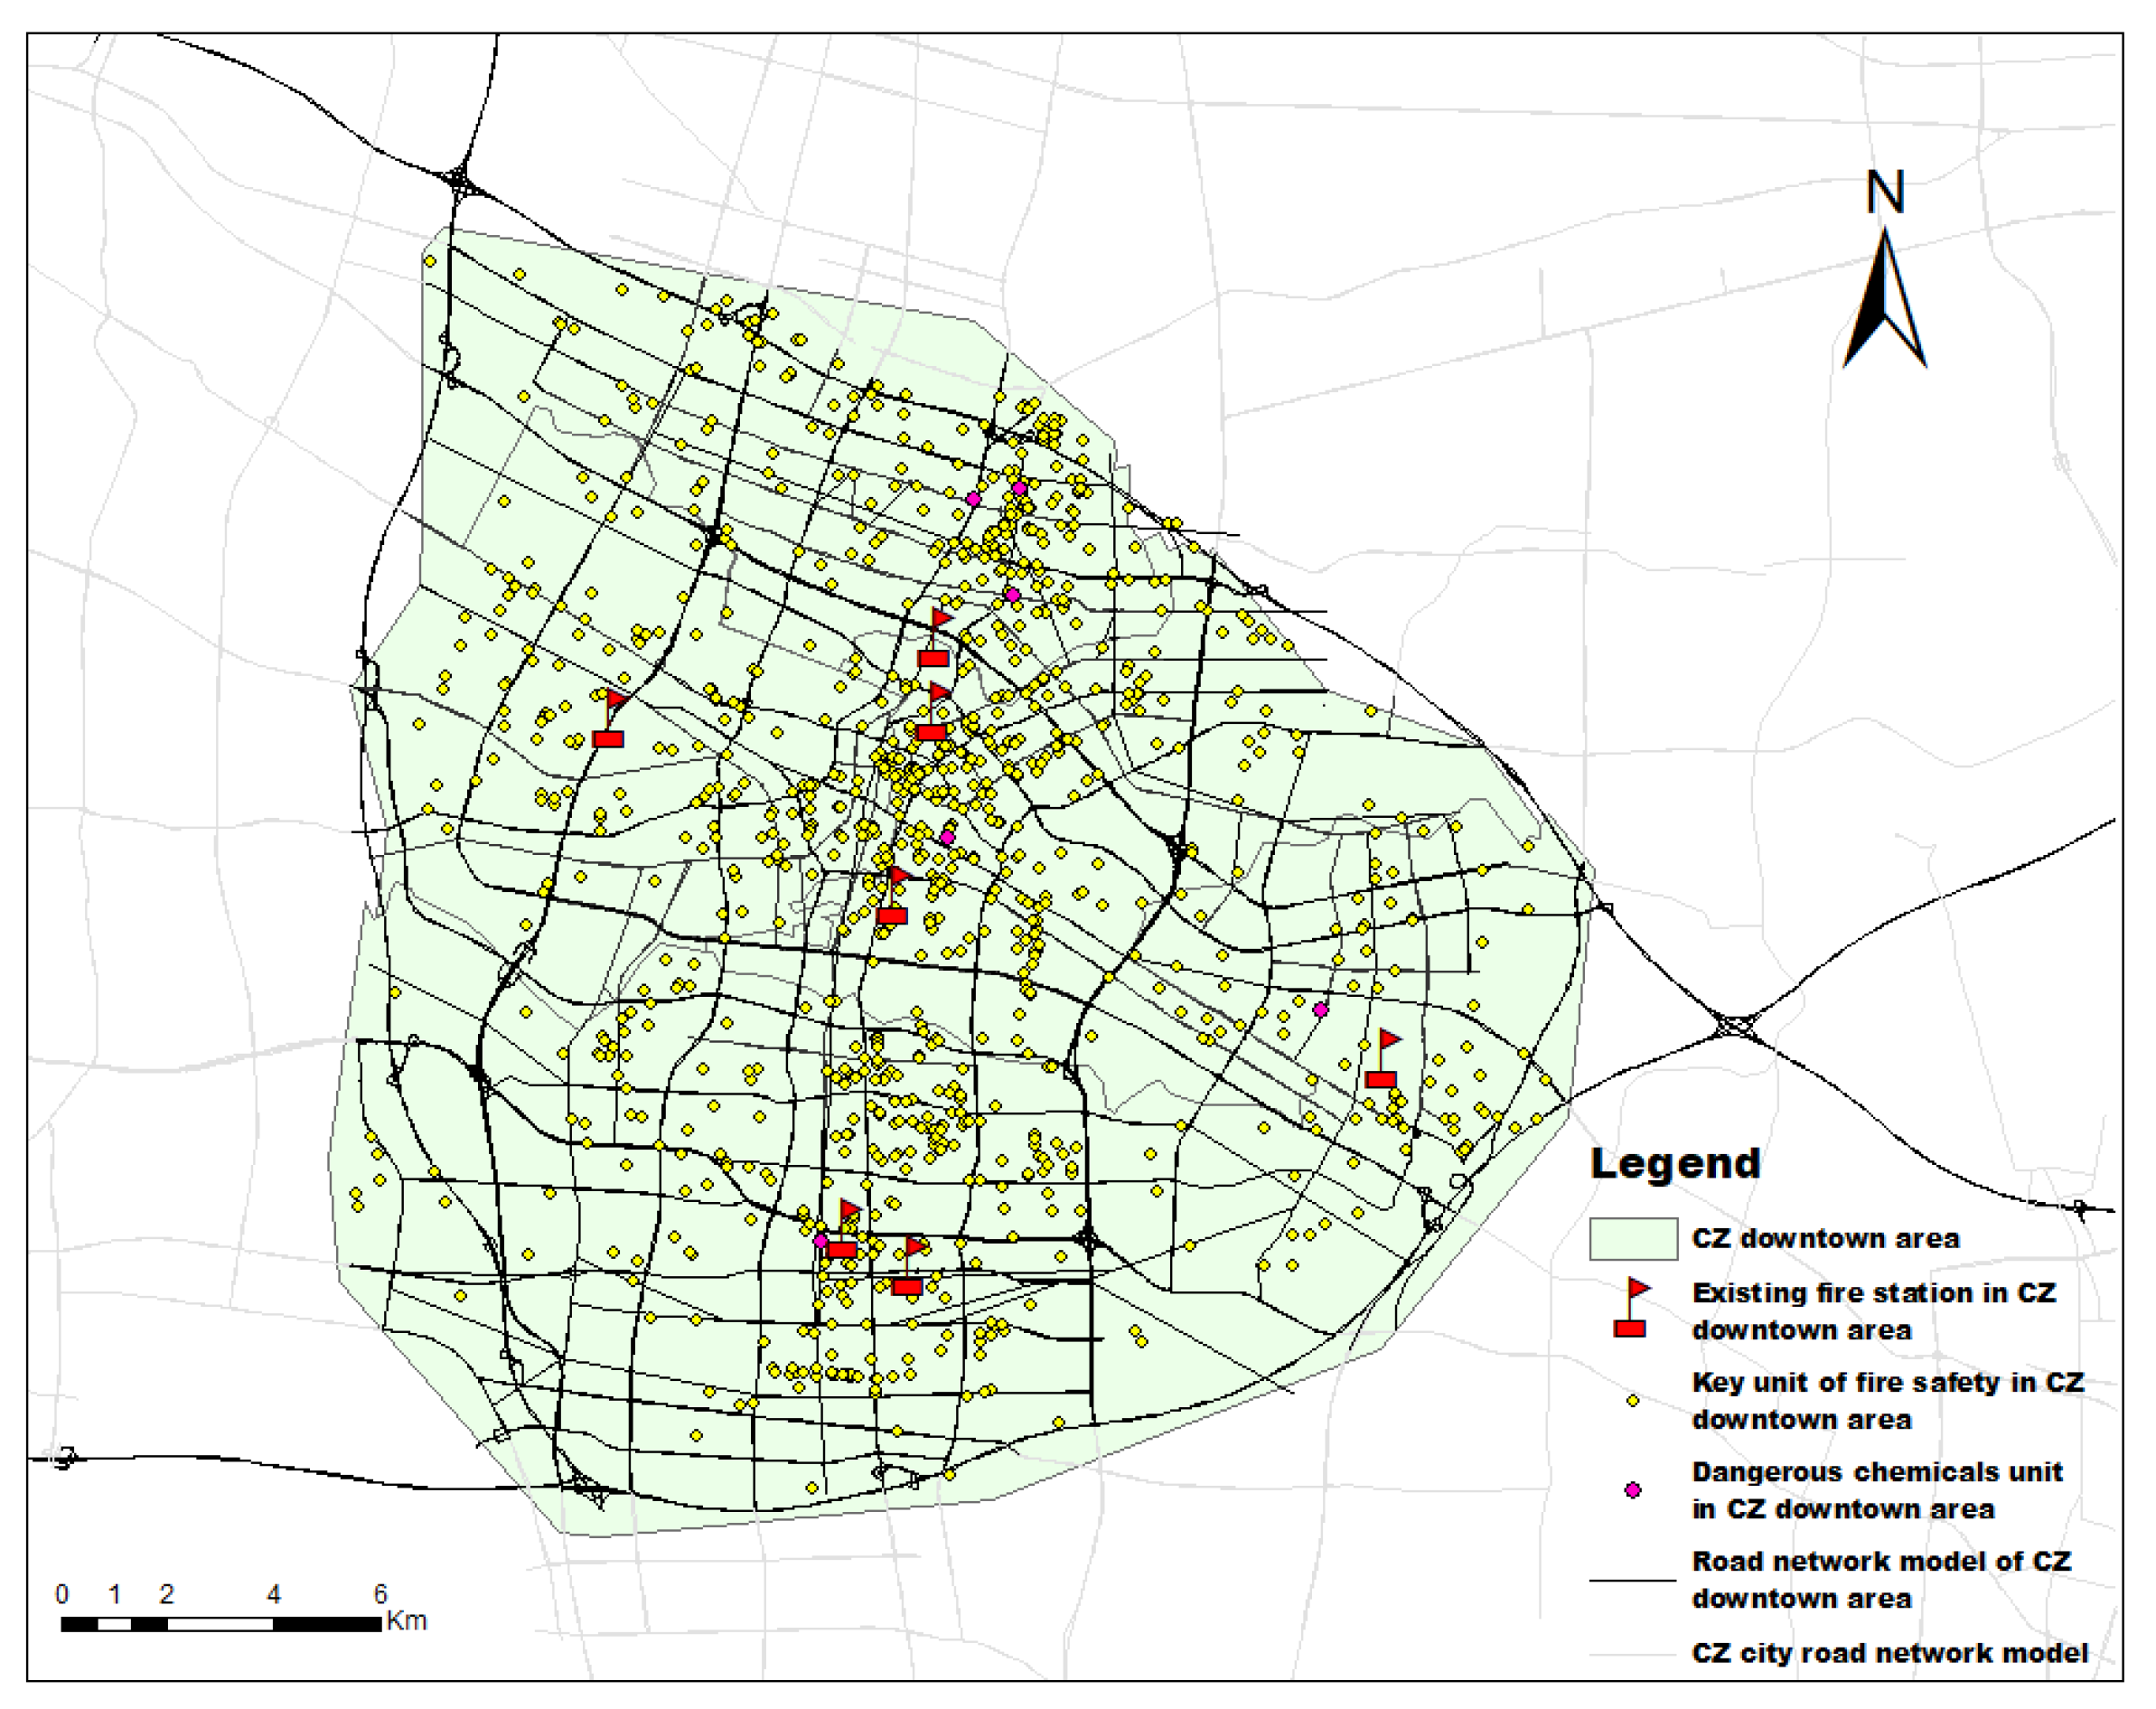
The primary objective of this study is to examine the central metropolitan center of CZ city, which is geographically surrounded by four major expressways. This region is experiencing an increase in population density, leading to a heightened risk of fire events. Consequently, this situation poses a substantial danger to public safety. The existing infrastructure of seven fire stations in CZ city is insufficient to adequately meet the coverage and response needs of the city’s population of 4.73 million persons over an area spanning 438,500 hectares. The main aim of this study is to optimize the allocation and quantity of fire stations within the urban area in order to improve the effectiveness and extent of emergency response. The objective of this study is to employ Geographic Information System (GIS) technology in order to formulate a strategic plan for the optimal placement of fire stations. This plan will take into consideration several factors such as densely populated areas, current fire station locations, hazardous chemical units, and the complex road network. The optimization procedure follows the guidelines established by the “Fire Protection Law of the People’s Republic of China” and the “Determination Standards of Provincial Key Fire Safety Units” [22].
In order to attain these objectives, we have put forth a proposition for the creation of 23 additional fire stations, which represents a substantial augmentation compared to the existing seven stations. This measure aims to provide full geographical coverage and enhance safety measures throughout the entirety of the downtown region. The optimization endeavors are based on a comprehensive dataset obtained from the CZ municipal fire department for the year 2020. This dataset encompasses 2532 simulated fire occurrences that adhere to established criteria and requirements. The evaluation of the optimization criteria will be conducted based on the enhanced response times, expanded coverage area, and strategic placement of fire stations to effectively address the varied requirements of the city’s districts. The status of the research area is illustrated in Figure 1.
The primary objective of this study is to not only effectively solve the current requirements of CZ city but also to establish a model that can be replicated in other urban regions with comparable issues pertaining to fire safety and emergency response planning. The expected result is the development of a more resilient urban environment, characterized by a substantial reduction in the danger of fire through the implementation of strategic planning and the integration of advanced technologies. In order to enhance response times, we utilized the Maximal Coverage Location Problem model to optimize the allocation of fire stations. This model is specifically designed to ensure maximum coverage while adhering to predetermined reaction time limitations.
The selection of the P-median model was based on its ability to strategically find the optimal locations for fire stations. This model aims to reduce the total distance between each demand point and its nearest fire station, thereby immediately enhancing operational efficiency and improving the allocation of resources. The application of the set covering model aimed to guarantee that all demand points located inside CZ city would fall within a predefined response time of a fire station. This target was pursued in order to achieve comprehensive spatial coverage. The maximum coverage model was utilized in order to determine the optimal sites that would maximize the coverage of demand points within a designated response time. This approach was undertaken with the objective of improving the accessibility of emergency services for a larger proportion of the local population. The inverse median model was not chosen as the primary objective of our study was to enhance service provision in densely populated regions, rather than prioritizing the equitable allocation of services based on distance, which is the primary issue of the Inverse Median Model. The anti-center model was subjected to evaluation but ultimately excluded from our final methodology because of its emphasis on the most extreme scenario of distance coverage. This approach did not correspond with our purpose of establishing a well-rounded and efficient network of fire stations across the urban environment.
2.2. Research Methods
Selecting and establishing a layout for fire stations are complex tasks that require consideration of the interrelationships between geographical elements, economic concerns, social activities, and spatial interactions [23]. Facility layout optimization generally involves maximizing economic benefits, pursuing utility maximization, or maximizing social benefits [24]. Because fire stations are public facilities, their layout is established to ensure fairness in service distribution and to maximize social benefits [25,26]. Research on site selection optimization has employed various models designed to address specific layout optimization challenges. Table 1 outlines six such models, each of which has a unique scope and characteristics. These models provide versatile solutions for a range of layout optimization problems related to the object of the research they were established in.
Spatial analysis is an advanced feature of GIS systems. Network analysis is a key component of spatial analysis of geographic information, and it is conducted using a network’s topology. Such analysis involves the identification of the spatial attributes of network elements and subsequent analysis and characterization of various aspects of the network’s performance [27,28,29]. Table 2 presents three of these aspects: GIS-based point, line, and surface data, all of which play a critical role in the strategic placement of fire stations. Simulating the areas that fire trucks can access within 4 min and integrating this information with that regarding existing fire station locations can enable the identification of facility layout candidates. This information can in turn serve as the foundation for devising a scientific and effective plan [30]. The planning of fire station layouts should be centered on the needs of the community, with consideration of factors such as economics, transportation, and land use. Because the focus of such planning is meeting a city’s needs, the guiding principle of such planning should be minimizing the number of facilities and maximizing their coverage to conserve resources and optimize benefits [31].
2.2.1. Set Covering Model
The set covering model can be employed to identify the location at which facilities can be placed to ensure that as many demand points as possible are covered by as few facilities as possible. The minimum number of fire stations required to effectively cover a target service area can be calculated using Equations (1)–(3).
where represents a demand point and I denotes a collection of all demand points, which is given by = {i|i = 1, 2, …, m}. In addition, is a candidate facility point, and J indicates a set of candidate facilities, which is given by J = {j|j = 1, 2, …, n}. Moreover, is the minimum distance between demand point and candidate facility point ,, . Additionally, in the proposed model, the variable D is characterized as the upper limit for the distance that a facility can be located from any demand location, hence guaranteeing adequate accessibility within the designated service area. Simultaneously, the variable dij represents the quantified minimum distance between demand point i and candidate facility j, which plays a crucial role in the process of selecting a facility; denotes the demand point that is served by the candidate facility and is the service capacity of the candidate facility . Furthermore, = 1 indicates that the demand point is selected at candidate facility , and = 0 indicates that the demand point is selected at other positions. The covering model was used to obtain the minimum number of fire stations required to cover all demand points.
2.2.2. Maximum Coverage Model
The maximum coverage model was employed to optimize the layout of fire stations with the goal of expanding the protection range of these stations as far as possible. This model can be used to maximize the coverage of demand points when the number of facilities is limited. The collective coverage model and the maximum coverage model consider various factors that influence the layout of fire stations and incorporate constraint conditions [32]. To maximize the coverage of fire stations, Equations (4)–(7) are applied:
where denotes the demand point and I denotes a collection of all demand points, given by I = {i|i =1, 2, …, m}; is the collection of candidate facilities, given by J = {j|j = 1, 2, …, n}. Additionally, is the minimum distance between demand point and candidate facility point ∈ , ∈ ; is the maximum allowable distance between the demand point and the facility; is the number of candidate facilities. Furthermore, xi is an indicator variable where xi = 1 if a facility is placed at candidate location i, and xi = 0 otherwise. This variable is crucial for determining the optimal configuration of facilities to ensure maximum coverage of demand points within the allowable distance D. Then, = 1 indicates that the demand point is selected at candidate facility , and = 0 indicates that the demand point is selected at other positions. Seek points to be selected in other locations. Finally, is the service capacity of candidate facility , and is the weight of demand point .
This solution model can be effectively used to simultaneously identify locations at which the number of supply points can be limited and ensure coverage of the maximum possible number of demand points. These two solution models are classified as mixed integer programming problems in operations research and are categorized as discrete positioning models [33]. When real-world problems, such as those related to fire station layouts, are being considered, different constraints can be introduced to models to account for the factors influencing the design and optimization of fire station layouts [34].
2.2.3. P-Center Model
The P-center model can be used to identify the closest fire station to each demand point. When the number of fire stations has been established, the maximum distance from any demand point to the nearest fire station can be minimized. This model can be described using Equations (8)–(13):
where represents a demand point and I represents a collection of all demand points, which is given by I = {i|i = 1, 2, …, m}; is a collection of candidate facilities, which is given by J = {j|j = 1, 2, …, n}; is the minimum distance between demand point and the candidate facility ∈, ∈; is the maximum allowable distance between the demand point and the facility and indicates that there is one and only one facility capable of serving one demand point.
This model can be applied to reduce the distance between fire stations and fire sites, which can result in quicker alarm response times and thereby enhance the reliability of fire truck response. Furthermore, the model can be used to improve the ability of CZ city to assess and manage fire-related risks and effectively protect the lives and property of its residents [35].
2.2.4. Calculation of the Area of Fire Station Jurisdiction
The fire protection plan developed for CZ city was designed to cover the entire administrative area of the city. However, because of the dispersed distribution of the urban nonconstruction land as well as the scattered villages and towns within the jurisdiction of the city, reaching the “5 min to reach” requirement of the overall fire protection code for the entire region is unfeasible. Therefore, the primary focus of the plan developed in this study was the CZ downtown area. Furthermore, the arrangement of various construction lands in the developed plan is in line with the city’s long-term development goals. The urban construction land of the city, which covers 165 km2, is the focus of the present research on the fire station layout in downtown CZ city.
The fire station locations were identified with consideration of several factors, including the distance that a fire engine can cover, the speed of the fire engine, and the road conditions. This calculation was completed with consideration of actual test results for 23 metropolitan cities, including Beijing, Shanghai, Shenyang, Guangzhou, Wuhan, and Chongqing, and the actual conditions of urban roads in China. The service scope of each fire station was determined by calculating the fire station area using Equation (14):
where A is the fire station area (km2); p is the straight-line distance from the fire station to the farthest point in the jurisdiction, that is, the protection radius of the fire station (km); S is the actual distance from the fire station to the farthest point on the edge of the jurisdiction, that is the farthest travel distance (km) of the fire truck in 4 min; λ is the curve coefficient of the route, that is, the straight line distance between the actual length of the public transportation route and the starting and ending points, usually 1.3–1.5.
3. Results
3.1. Set Constraints
When the locations of fire stations are being planned, various factors and conditions related to social development and a city’s unique characteristics should be considered. A comprehensive assessment conducted by the Chinese government revealed that the primary aspects that must be considered are as follows [36]:
- (1)
- Response time
Currently, in China, the selection of fire station sites is primarily based on the 5-min-fire-response-time principle. This principle accounts for a dispatch period of 1 min following the receipt of instruction and for a period of 4 min within which the fire rescue vehicle should arrive at the incident scene [2]. In practice, many developed countries have used different levels of fire risk to cope with different response times.
- (2)
- Road capacity
The quality of traffic flow plays a crucial role in determining the response time of fire stations. Therefore, locations that are convenient in terms of transportation and accessibility should be selected as candidate sites for fire stations. In addition, when responsibility jurisdictions for fire stations are being established, factors such as the presence of expressways and urban primary and secondary roads should be considered [37]. The present study considered CZ city’s road design speed and road conditions and set the running speed of fire engines on various types of roads in the central urban as indicated in Table 3.
- (3)
- Natural terrain
A fire station should be located in a flat area, and responsibility jurisdictions for fire stations should be established with consideration of the distribution of elements such as mountains; water systems, including navigation channels and waterways and low-lying terrain within the city. All of these elements should be considered when the layout and placement of fire stations are planned.
- (4)
- Economic development
Factors such as urban population distribution can affect the frequency of urban fires [38], Economic development often influences the distribution of urban populations. Additionally, the availability of a financial budget for fire station construction is a crucial factor. The layout of fire stations should be based on scientific principles, and strategies should be adjusted to account for local conditions.
Response time, road capacity, natural topography, and economic development are critical factors that serve as the foundation for establishing fire station candidate points and revising the selection of fire station sites [38,39]. The measurement of response time is a fundamental indicator of performance within the realm of emergency services. The objective is to reduce this duration in order to guarantee prompt provision of services during critical situations. The capacity of road networks to accommodate emergency vehicle traffic without substantial delays is of paramount importance, as congested roads can hinder response times. This element is taken into consideration in relation to traffic flow and emergency response. The topographical characteristics of a region can have a substantial influence on the ease of access and efficiency of emergency response efforts. For example, hilly topographies may necessitate a greater distribution of strategically positioned stations in comparison to flat regions. The correlation between economic development and the frequency of occurrences, as well as the availability of resources for emergency response, is a significant factor to consider. Regions characterized by greater economic activity may exhibit a heightened vulnerability of infrastructure, hence necessitating a more resilient fire service coverage.
3.2. Building-UpA a Firefighting Traffic Network Model
With the consideration of the road network plan from the CZ city master plan, the ArcGIS network analysis function was adopted to construct the transportation network of downtown CZ city. First, a new file geodatabase was generated, after which line elements were interrupted, topological checks were performed, and any identified errors in the elements were rectified. Second, a feature data set was constructed, and line features (express roads, elevated roads, and trunk roads) were imported into the data set to generate a new network data set. Care was taken to ensure that the feature fields and projected coordinate systems were consistent. Subsequently, data sources were added to the data set, and network attributes, such as network connectivity, travel mode, and travel direction, were established. The network data set was used to simulate common road conditions, such as the presence of one-way lanes, restrictions on turning at intersections, and the presence of red lights at intersections. Fire engines for firefighting or emergency rescue missions have road priority; they are not bound by restrictions related to driving speed, driving route, or driving direction and are not required to abide by traffic signal laws. Therefore, actual road restrictions, such as the presence of one-way lanes and red lights, were not considered [40]. The transportation network constructed in this study is presented in Figure 2.
Fire request points are fundamental components in the GIS-based optimization of fire station layouts. In this study, point data for fire requests were obtained by geocoding coordinates. Fire request points refer to the specific locations within the urban area of CZ city where emergency fire services are potentially required. These points are derived from a combination of historical incident data, areas of high population density, and locations of significant risk such as industrial zones or areas with high levels of human activity. After the data were imported to ArcMap, XY coordinate conversion was performed to derive plane coordinates (Figure 3). Data management tools were used to establish a grid. This grid, measuring 450 m × 450 m [41] and based on the boundary of the downtown area, served as the fundamental unit for fire protection analysis. Abstract grid center points were extracted and designated as revised request points and candidate locations for fire stations [42]. Additionally, specific criteria related to urban fire station construction requirements were considered. Facility candidate points were ideally positioned in street areas, as close as possible to urban emergency rescue channels. Moreover, these candidate locations were intentionally situated at a minimum distance of 50 m from public buildings, such as hospitals, schools, shopping malls, theaters, exhibition halls, and stadiums to ensure they were sufficiently distant from evacuation points. For cases involving hazardous materials, a minimum distance of 300 m from the unit in which dangerous goods were stored was maintained, and therefore, an element buffer distance of 300 m was set. The extracted elements are illustrated in Figure 4 and Figure 5. To test the efficacy of the proposed fire station layout, we conducted a statistical analysis comparing the response times from the present and upgraded designs. Our findings reveal a statistically substantial reduction in response time for the new architecture, particularly when assessing the ‘worst location’ scenario. Statistical analyses, such as the utilization of a paired t-test, were employed to evaluate the disparities in response times between the two layouts. The results showed that the adjustments in layout resulted in a statistically significant decrease in reaction times at a 95% confidence level (p < 0.05). These results substantiate the potential of the improved layout to enhance emergency response efficiency in critical situations, offering a compelling argument for the reconsideration of current fire station placements.
4. Discussion
4.1. Preliminary Optimization of Fire Station Layout
While our optimization model proposes theoretical locations for fire brigade headquarters based on a set of ideal parameters, we recognize that the actual implementation must be grounded in the realities of each municipality, including land availability, legal frameworks, budgetary constraints, and human resources. Furthermore, we acknowledge the critical role of volunteer fire units in augmenting professional services, particularly in regions where they form an integral part of the emergency response system. We will discuss how our model can be adapted to incorporate these local factors and the contributions of volunteer personnel, ensuring that the proposed locations are not only theoretically sound but also practically feasible. The location-allocation function of network analysis in ArcGIS was used to set the road impedance to 4 min. This setting was used to identify candidate points for downtown facilities on the basis of a facility minimization model. A total of 19 facility candidate points were identified. The process of finding the 19 potential facility locations involved thorough research that incorporated many methodologies, including GIS mapping, examination of historical fire occurrence data, and consideration of urban development patterns. The distribution of the 19 candidate points in CZ city was carefully planned to achieve comprehensive coverage. The placement of each point took into consideration various factors, such as population density gradients, the spatial distribution of high-risk zones, and the optimization of response times in relation to the city’s diverse topography and road network configurations [43,44,45,46].
The extraction results are presented in Figure 6. The maximum coverage model was used to finalize the position of the candidate points. The results of this network analysis are presented in Figure 7.
The location-allocation function was further used to incorporate existing fire stations into the network analysis. The road impedance and the number of facilities were set to 4 min and 7, respectively. The results of the analysis are presented in Figure 8.
In the present study, as illustrated in Figure 7 and Figure 8, we provide evidence to support the notion that the enhancement of fire protection coverage in downtown CZ city was achieved with the augmentation of fire stations to a total of 19, along with their strategic repositioning as determined by our optimization model. The coverage rate was increased from 30.13% using the initial seven stations to 98.46% with the optimum arrangement of 19 stations, consequently enhancing the effectiveness and reliability of the fire protection service throughout the urban region. This optimized arrangement would maximize economic and social benefits and effectively meet the fire rescue needs of downtown CZ city. The network analysis–based selection of facility candidate points and consideration of spatial and geographic data from existing fire stations of the present study provide valuable insights. The findings indicate that the operation of four of the original fire stations should be discontinued, the operation of three original stations should be continued, and 12 new fire stations should be established to meet the fire rescue needs of the downtown area.
4.2. Enhanced Optimization Utilizing Revised Demand Points
The application of the P-center model in conjunction with constraint conditions was crucial in the fire station site selection process. This approach ensured that the selected fire station locations met the requirement of reaching the furthest request point within 4 min with consideration of road traffic conditions. The study area was divided into 19 firefighting responsibility jurisdictions. The P-center model was used to adjust the fire station placement plan to achieve the optimal configuration, as depicted in Figure 9. The research findings reveal that because of the influence of road impedance and other factors, the service area boundary of the fire station was not a circle but rather an irregular polygon, which highlights the disadvantages of using the traditional circle drawing method.
The results from the location-allocation analysis were integrated with the calculation formula for the fire station area, that is, Equation (14), to optimize the layout of the fire stations. With the optimized layout for the fire stations, the longest time for a fire truck to reach a request point within its station’s responsible jurisdiction is ≤4 min, and therefore, trucks can arrive in sufficient time to effectively control fires, which can reduce fire-related loss of life and property.
The results of this study indicate that the average fire protection area was 9.6 km2, and the 2nd, 7th, 8th, 9th, and 19th fire protection areas were larger (Table 4). Therefore, the road accessibility in the other responsibility jurisdictions was sufficient, and no responsibility jurisdiction area was larger than 15 km2, indicating the areas in the proposed plan meet the requirement of such areas being smaller than 15 km2.
5. Conclusions
Safety is foundational to both the economic development and the well-being of a community. The present case study focused on downtown CZ city and employed a GIS system to optimize the scope of this area’s fire services by simulating the ability of fire trucks to reach a request point within 4 min. With consideration of this 4-min fire response time, this study study scientifically and reasonably determined the required number and location of fire stations in the area. The resulting fire protection layout is more realistic, instructive, and maneuverable than the current layout.
From an economic standpoint, it is anticipated that the optimum allocation of the 19 fire stations will result in a reduction of roughly 25% in yearly fire damage costs. This reduction may be attributed to the fact that faster response times and enhanced coverage are directly associated with a drop in the severity of fires and property loss. This estimation is derived from a comparative review of historical data regarding fire incidents and reported cost savings in analogous metropolitan environments. From a social perspective, the expanded fire station network is anticipated to strengthen community resilience. This is supported by the possibility of a 40% rise in prompt fire emergency assistance, which has the ability to substantially mitigate the risk to human life. This prognosis is substantiated by empirical research indicating a favorable association between the presence of emergency response infrastructure and the overall welfare of society. Moreover, it is expected that the strategic positioning of fire stations will enhance public trust in emergency services. This is because a more prominent and easily accessible presence of fire protection resources can provide reassurance to people regarding their safety and the city’s dedication to proactive risk mitigation.
This plan can effectively reduce the fire risk in central urban areas of the city and thereby enhance urban fire safety. Supplementing the coverage of existing fire stations through the addition of new stations can ensure comprehensive fire protection coverage. Fire protection plans should consider evolving economic conditions, changes in regional traffic flow, variations in land use, and the presence of key fire protection units and should, therefore, adapt and expand over time.
Author Contributions
Conceptualization, A.-C.H.; methodology, C.-F.H.; writing—original draft preparation, A.-C.H.; writing—review and editing, C.-M.S. All authors have read and agreed to the published version of the manuscript.
Funding
This research received no external funding.
Data Availability Statement
Data will be made available on request.
Acknowledgments
The authors thank Xi-Lin Dong, Qing-Chun Kang and Zhong-Jun Shu and thanks the organizations that provided the original data and software.
Conflicts of Interest
The author declare no conflict of interest.
Nomenclature
| A | Fire station area |
| Minimum distance between demand point and candidate facility point | |
| D | Maximum allowable distance between the demand point and the facility |
| ha | Hectare |
| i | A demand point |
| I | A collection of all demand points |
| j | A candidate facility point |
| J | A set of candidate facilities |
| p | Straight-line distance from the fire station to the farthest point |
| S | Actual distance from the fire station to the farthest point on the edge |
| Demand point that is served by the candidate facility | |
| Service capacity of the candidate facility | |
| λ | Curve coefficient of the route |
References
- Li, G.; Zhang, J.; Liu, S. Determination of urban emergency logistics demand area and classification method. China Saf. Sci. J. 2012, 22, 157–164. [Google Scholar] [CrossRef]
- Liu, D.; Xu, Z.; Yan, L.; Fan, C. Dynamic estimation system for fire station service areas based on travel time data. Fire Saf. J. 2020, 118, 103238. [Google Scholar] [CrossRef]
- Bilham, R. Disaster management: Preparing for the worst. Nature 2013, 205, 438. [Google Scholar] [CrossRef]
- Nisanci, R. GIS based fire analysis and production of fire-risk maps: The Trabzon experience. Sci. Res. Essays 2010, 5, 970–977. [Google Scholar]
- Yao, J.; Zhang, X.; Murray, A.T. Location optimization of urban fire stations: Access and service coverage. Comput. Environ. Urban Syst. 2019, 73, 184–190. [Google Scholar] [CrossRef]
- Nyimbili, P.H.; Erden, T. GIS-based fuzzy multi-criteria approach for optimal site selection of fire stations in Istanbul, Turkey. Socio-Econ. Plan. Sci. 2020, 71, 100860. [Google Scholar] [CrossRef]
- Oliveira, M.; Slezakova, K.; Alves, M.J.; Fernandes, A.; Teixeira, J.P.; Delerue-Matos, C.; Pereira, M.D.C.; Morais, S. Polycyclic aromatic hydrocarbons at fire stations: Firefighters’ exposure monitoring and biomonitoring, and assessment of the contribution to total internal dose. J. Hazard. Mater. 2017, 323, 184–194. [Google Scholar] [CrossRef]
- Marcus, R. Measuring the Capabilities of the Swedish Fire Service to Save Lives in Residential Fires. Fire Technol. 2020, 56, 583–603. [Google Scholar]
- Casartelli, V.; Mysiak, J. European Union Civil Protection—Peer Review Programme for Disaster Risk Management: Wildfire Peer Review Assessment Framework (Wildfire PRAF); European Comission: Brussels, Belgium, 2023. [Google Scholar]
- Wright, J.; Liu, J.; Bain, R.; Perez, A.; Crocker, J.; Bartram, J.; Gundry, S. Water quality laboratories in Colombia: A GIS-based study of urban and rural accessibility. Sci. Total Environ. 2014, 485, 643–652. [Google Scholar] [CrossRef]
- Li, D.; Cova, T.J.; Dennison, P.E. Setting Wildfire Evacuation Triggers by Coupling Fire and Traffic Simulation Models: A Spatiotemporal GIS Approach. Fire Technol. 2019, 55, 617–642. [Google Scholar] [CrossRef]
- Deng, Y.; Li, A.; Dou, W. Comparative analysis of urban fire station layout planning models. J. Geo-Inf. Sci. 2008, 10, 242–246. [Google Scholar]
- Bai, H.; Wu, Y. Study on Layout Optimization of fire stations in old urban areas. China Saf. Sci. J. 2010, 81–87. Available online: http://www.cssjj.com.cn/CN/Y2010/V20/I8/81 (accessed on 17 October 2023).
- NFPA 1710; Standard for the Organization and Deployment of Fire Suppression Operations, Emergency Medical Operations, and Special Operations to the Public by Volunteer Fire Departments. National Fire Protection Association: Boston, MA, USA, 2001.
- Yang, L.; Jones, B.F.; Yang, S. A fuzzy multi-objective programming for optimization of fire station locations through genetic algorithms. Eur. J. Oper. Res. 2006, 181, 903–915. [Google Scholar] [CrossRef]
- Chaudhary, P.; Chhetri, S.K.; Joshi, K.M.; Shrestha, B.M.; Kayastha, P. Application of an Analytic Hierarchy Process (AHP) in the GIS interface for suitable fire site selection: A case study from Kathmandu Metropolitan City, Nepal. Socio-Econ. Plan. Sci. 2016, 53, 60–71. [Google Scholar] [CrossRef]
- Liu, Y.C.; Jiang, J.C.; Huang, A.C. Experimental study on extinguishing oil fire by water mist with polymer composite additives. J. Therm. Anal. Calorim. 2023, 148, 4811–4822. [Google Scholar] [CrossRef]
- Liu, L.; Chen, C. An optimal layout of fire area based on GIS and set coverage method. Sci. Surv. Mapp. 2018, 43, 46–51. [Google Scholar] [CrossRef]
- Davoodi, M.; Mesgari, M.S. A GIS based Fire Station Site Selection using Network Analysis and Set Covering Location Problem. Int. J. Hum. Geogr. Environ. Stud. 2018, 433–436. [Google Scholar] [CrossRef]
- Lin, J.; Jiang, X.; Zhu, J.; Cao, W.; Kong, Y. Application of GIS model in urban fire station layout planning. City Plann. Rev. 2018, 5, 63–68. [Google Scholar]
- Austin, A.; Ezekoye, O.A. Quantifying Generalized Residential Fire Risk Using Ensemble Fire Models with Survey and Physical Data. Fire Technol. 2018, 54, 715–747. [Google Scholar]
- Xu, Z.; Zhou, L.; Lan, T.; Wang, Z.; Sun, L.; Wu, R. Spatial optimization of mega city fire station based on POI data—Taking the area within the Fifth Ring Road of Beijing as an example. Prog. Geogr. 2018, 37, 535–546. [Google Scholar]
- Shahparvari, S.; Fadaki, M.; Chhetri, P. Spatial accessibility of fire stations for enhancing operational response in Melbourne. Fire Saf. J. 2020, 117, 103149. [Google Scholar] [CrossRef]
- Hu, J.; Shu, X.; Xie, S.; Tang, S.; Wu, J.; Deng, B. Socioeconomic determinants of urban fire risk: A city-wide analysis of 283 Chinese cities from 2013 to 2016. Fire Saf. J. 2019, 110, 102890. [Google Scholar] [CrossRef]
- Ahumada, C.B.; Noor, Q.; Sam, M.M. A method for facility layout optimisation including stochastic risk assessment. Process Saf. Environ. Prot. 2018, 117, 616–628. [Google Scholar] [CrossRef]
- Heyns, A.M.; Plessis, W.D.; Curtin, K.M.; Kosch, M.; Hough, G. Analysis and Exploitation of Landforms for Improved Optimisation of Camera-Based Wildfire Detection Systems. Fire Technol. 2021, 57, 2269–2303. [Google Scholar] [CrossRef]
- Rahman, M.; Chen, N.; Islam, M.M.; Dewan, A.; Pourghasemi, H.R.; Washakh, R.M.A.; Nepal, N.; Tian, S.; Faiz, H.; Alam, M.; et al. Location-allocation modeling for emergency evacuation planning with GIS and remote sensing: A case study of Northeast Bangladesh. Geosci. Front. 2021, 12, 101095. [Google Scholar] [CrossRef]
- Burkard, R.E.; Pleschiutschnig, C.; Zhang, J. Inverse median problems. Discret. Optim. 2004, 1, 23–39. [Google Scholar] [CrossRef]
- Song, Z.; Yan, T.; Liu, T.; Huang, T. New gravity P median model and its empirical test in the location decision of urban general hospitals—A case study of Wuxi City. Prog. Geogr. 2016, 35, 420–430. [Google Scholar]
- Sadovnychiy, S. Gabor Features Extraction and Land-Cover Classification of Urban Hyperspectral Images for Remote Sensing Applications. Remote Sens. 2021, 13, 2914. [Google Scholar]
- Liu, B.; Yu, W.K.; Dai, W.J.; Xing, X.M.; Kuang, C.L. Estimation of TerrestrialWater Storage Variations in Sichuan-Yunnan Region from GPS Observations Using Independent Component Analysis. Remote Sens. 2022, 14, 282. [Google Scholar] [CrossRef]
- Qin, K.; He, Q.; Zhang, Y.S.; Cohen, J.B.; Tiwari, P.; Lolli, S. Aloft Transport of Haze Aerosols to Xuzhou, Eastern China: Optical Properties, Sources, Type, and Components. Remote Sens. 2022, 14, 1589. [Google Scholar] [CrossRef]
- Murray, A.T. Optimising the spatial location of urban fire stations. Fire Saf. J. 2013, 62, 64–71. [Google Scholar] [CrossRef]
- Bao, S.; Xiao, N.; Lai, Z.; Zhang, H.; Kim, C. Optimizing watchtower locations for forest fire monitoring using location models. Fire Saf. J. 2015, 71, 100–109. [Google Scholar] [CrossRef]
- Ding, X.; You, J.; Wang, H. Model and optimization algorithm of emergency facility location problem. J. Tongji Univ. (Nat. Sci.) 2012, 40, 1428–1433. [Google Scholar]
- Zhou, H.L.; Jiang, J.C.; Huang, A.C. Thermal hazard assessment of tert-butyl perbenzoate using advanced calorimetric techniques and thermokinetic methods. J. Loss Prev. Process Ind. 2023, 85, 105166. [Google Scholar] [CrossRef]
- Wei, L.; Li, H.; Liu, Q.; Chen, J.; Cui, Y. Fire station planning based on GIS and AHP. Fire Sci. Technol. 2010, 29, 827–831. [Google Scholar]
- Zhang, G. Urban fire risk assessment and application based on spatial analysis—A case study of Xi’an. City Plann. Rev. 2016, 40, 59–64. [Google Scholar]
- Number [2017]75; National Development and Reform Commission of the People’s Republic of China; Revision of Urban FIRE station Construction Standard (Construction Standard); Ministry of Housing and Urban Rural Development of the People’s Republic of China. China Planning Press: Beijing, China, 2017; p. 75.
- Shi, Y.; You, W. Optimization of layout planning of a regional fire station in Xiamen. J. Saf. Sci. Technol. 2013, 10, 152–156. [Google Scholar]
- Nishino, T.; Tanaka, T.; Hokugo, A. An evaluation method for the urban post-earthquake fire risk considering multiple scenarios of fire spread and evacuation. Fire Saf. J. 2012, 54, 167–180. [Google Scholar] [CrossRef]
- Qu, C.; Wang, J.; Huang, J.; He, M. Study on dynamic distribution optimization of post earthquake emergency materials considering timeliness and fairness. Chin. J. Manag. Sci. 2018, 26, 178–187. [Google Scholar]
- Wu, Z.H.; Wu, Y.; Tang, Y.; Jiang, J.C.; Huang, A.C. Evaluation of composite flame-retardant electrolyte additives improvement on the safety performance of lithium-ion batteries. Process Saf. Environ. Prot. 2023, 169, 285–292. [Google Scholar] [CrossRef]
- Ceyhan, E.; Ertuğay, K.; Düzgün, Ş. Exploratory and inferential methods for spatio-temporal analysis of residential fire clustering in urban areas. Fire Saf. J. 2013, 58, 226–239. [Google Scholar] [CrossRef]
- Chen, Z.; Li, J.; Lu, F.; Li, Q. Optimization of site selection and layout of urban fire stations and Its enlightenment to Xiong’an new area. J. Saf. Sci. Technol. 2018, 14, 14–19. [Google Scholar]
- Prampolini, M.; Angeletti, L.; Castellan, G.; Grande, V.; Bas, T.L.; Taviani, M.; Foglini, F. Benthic Habitat Map of the Southern Adriatic Sea (Mediterranean Sea) from Object-Based Image Analysis of Multi-Source Acoustic Backscatter Data. Remote Sens. 2021, 13, 2913. [Google Scholar] [CrossRef]
Figure 1.
Overview of the research area.

Figure 2.
Road network map of CZ downtown area.

Figure 3.
Distribution of fire rescue demand points in CZ downtown area.

Figure 4.
Request points after revision.

Figure 5.
Facility candidate points.

Figure 6.
Set covering model to solve the minimum number of facilities in the research area.

Figure 7.
Set maximum coverage model solves the layout position with the fewest number of facilities.
Figure 7.
Set maximum coverage model solves the layout position with the fewest number of facilities.

Figure 8.
The largest service coverage of the existing fire station in the CZ downtown area.

Figure 9.
Division of fire responsibility areas in CZ downtown area after revision.


Table 1.
Comparison of site selection models.
| Name | Scope of Application | Characteristic |
|---|---|---|
| P-median model | Public sector | Optimize overall or average performance to minimize total transportation costs |
| P-center model | Emergency facilities, public sector | Optimize the worst case to minimize the maximum distance from each demand point to the nearest facility |
| Set covering model | Emergency facilities, public sector | The scope of service covers as many demand points as possible while minimizing the number of facilities |
| Maximum coverage model | Emergency facilities, public sector | The scope of service covers as many demand points as possible |
| Inverse median model | NIMBY (Not in My Back Yard) facilities | Maximize the total weighted distance between the facility and the demand point, as opposed to the P-median model |
| Anti-center model | NIMBY facilities | Maximize the minimum distance between the service facility and the demand point, which is the opposite of the P-center problem |
Table 2.
Data list for optimization of fire station layout in the study area.
| Category | Essential | Factor Content |
|---|---|---|
| Spot | Firefighting facilities | Existing fire station |
| Hazard sources | Hazardous chemicals unit | |
| Key units of fire safety | ||
| Line | Route | Main roads in central urban area |
| Surface | Region | Downtown area |
Table 3.
Road capacity setting of different grades of roads in CZ city.
| Road Names | Design Speed of Road (km/h) | Set Speed of Fire Engines (km/h) |
|---|---|---|
| National highway or expressway | 80 | 80 |
| Primary road | 60 | 50 |
| Secondary trunk road | 40 | 40 |
| Branch road | 30 | 30 |
Table 4.
Area of fire station jurisdiction after layout optimization.
| Jurisdiction Number | Area of Responsibility (km2) |
|---|---|
| ① | 8.60 |
| ② | 14.51 |
| ③ | 8.71 |
| ④ | 9.68 |
| ⑤ | 10.70 |
| ⑥ | 8.60 |
| ⑦ | 12.43 |
| ⑧ | 14.01 |
| ⑨ | 14.51 |
| ⑩ | 12.63 |
| ⑪ | 6.62 |
| ⑫ | 8.50 |
| ⑬ | 12.63 |
| ⑭ | 6.82 |
| ⑮ | 8.93 |
| ⑯ | 5.73 |
| ⑰ | 10.95 |
| ⑱ | 8.65 |
| ⑲ | 14.29 |
Disclaimer/Publisher’s Note: The statements, opinions and data contained in all publications are solely those of the individual author(s) and contributor(s) and not of MDPI and/or the editor(s). MDPI and/or the editor(s) disclaim responsibility for any injury to people or property resulting from any ideas, methods, instructions or products referred to in the content. |
© 2023 by the authors. Licensee MDPI, Basel, Switzerland. This article is an open access article distributed under the terms and conditions of the Creative Commons Attribution (CC BY) license (https://creativecommons.org/licenses/by/4.0/).
Share and Cite
MDPI and ACS Style
Huang, A.-C.; Huang, C.-F.; Shu, C.-M. A Case Study for an Assessment of Fire Station Selection in the Central Urban Area. Safety 2023, 9, 84. https://doi.org/10.3390/safety9040084
AMA Style
Huang A-C, Huang C-F, Shu C-M. A Case Study for an Assessment of Fire Station Selection in the Central Urban Area. Safety. 2023; 9(4):84. https://doi.org/10.3390/safety9040084
Chicago/Turabian StyleHuang, An-Chi, Chung-Fu Huang, and Chi-Min Shu. 2023. "A Case Study for an Assessment of Fire Station Selection in the Central Urban Area" Safety 9, no. 4: 84. https://doi.org/10.3390/safety9040084
Note that from the first issue of 2016, this journal uses article numbers instead of page numbers. See further details here.