Download
1 / 63
800 likes | 1.28k Views
Human Variation and Adaptation. Ancient Racial Classifications. Homer (fl. 1200 - 850 B.C.) Iliad and Odyssey acknowledge variability Aethiopians: People at the eastern and western edges of the known world Cubit-men: African (?) pygmies Herodotus (484?-425? B.C.)

E N D
Ancient Racial Classifications Homer (fl. 1200 - 850 B.C.) Iliad and Odyssey acknowledge variability Aethiopians: People at the eastern and western edges of the known world Cubit-men: African (?) pygmies Herodotus (484?-425? B.C.) Historiae argues for an environmental cause of variability between human groups Egyptians have strong skulls due to exposure Persian skulls are brittle due to the use of felt hats Hippocrates (460 - 377 B.C.) Environmental influences on human variability are noted in Volume I of Corpus Hippocraticum Body build and temperment of different peoples are said to be related to their climate and life style Aristotle (384-322 B.C.) Claims environmental causes of physical variation in humans Wooly hair of Aethiopians due to arid climate Straight hair of Scythians due to moist air St. Augustine (354-430)In De Civitate Dei Contra Paganos he says all men born everywhere, no matter how strange they appear to us, are descended from Adam, i.e., are descended from a single ancestral stock
Early Racial Classifications Leonardo da Vinci (1452-1519) Questioned the environmental hypothesis in accounting for human variation, suggesting an early hereditarian argument based on the power of the mother's seed. Andreas Vesalius (1514-1564) Noted a relationship between race and the shape of the skull
Historical Views of Human Variation • Two schools of thought developed to explain diversity: • Monogenists believed that all humans were descended from a original pair of humans. • Polygenists believed that all humans were descended from a number of pairs of humans.
Racism • Based on false belief that intellect and cultural factors are inherited with physical characteristics. • Uses culturally defined variables to typify all members of particular populations. • Assumes that one's own group is superior. • A cultural phenomenon found worldwide.
Intelligence • Genetic and environmental factors contribute to intelligence. • Many psychologists say IQ scores measure life experience. • Innate differences in abilities reflect variation within populations, not differences between groups. • There is no convincing evidence that populations vary in regard to intelligence.
Types of Human Variation • Genetic variation • Variation due to genes inherited from the parents • Environmental variation • Variation caused by environmental factors such as culture, climate, habitat, or competition from other species
The Big Problem with Understanding Human Variation • It is very difficult to separate the influences of genes, environment, and culture in the variation of actual human individuals • Variation WITHIN groups can have very different causes than variation BETWEEN groups • The definition of a biological population in modern humans is problematic
The differences between two separate lawns planted from the same bag of seed must be environmental. However, if the seed used was genetically variable, the differences within each lawn could be genetic. Influence of Environment
Height in British Soldiers The height of men joining the British army in 1939 varied considerably, illustrating the range of variation in morphological characters within populations. The tallest men joining the army were more than 2 m (84 in., about 7 ft) tall, while others were less than 1.5 m (60 in., or 5 ft) tall.
Historical Views of Human Variation • Biological determinism - cultural and biological variations are inherited in the same way. • Eugenics - "race improvement" through forced sterilization of members of some groups and encouraged reproduction among others.
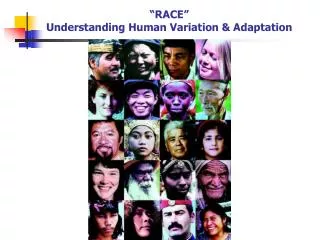
Traditional Concept of Race • Since the 1600s, race has been used to refer to culturally defined groups. • Race is used as a biological term, but has enormous social significance. • "Racial traits" are not the only phenotypic expressions that contribute to social identity: sex and age are also critically important. • In the 1950's the use of the term "race" was replaced with "ethnicity “
Allele FrequenciesWithin and Between Populations • After World War II, the study of human variation shifted to the study of differences in allele frequencies within and between populations. • The application of evolutionary principles to human variation has replaced the view that was based solely on observed phenotype. • Races are no longer viewed as fixed biological entities, composed of individuals fitting a particular type.
Researchers often use short pieces of DNA called Alu polymorphisms to determine whether various populations are related to one another. Alus have no known function, yet they copy and insert themselves at random throughout a person's genome. Because previously inserted Alus do not excise themselves, Alu patterns can be used as yardsticks to estimate how close two people--and, on average, two populations--are genetically.
Counting the number of DNA units called short tandem repeats on chromosomes can allow scientists to group individuals according to probable ancestry. One such repeat, AAAG, occurs between two and seven times in people with African heritage but between five and eight times in those whose ancestors came from Europe or the Middle East. (Every person inherits one set of repeats from their mother and one from their father.)
(a) Evolutionary trees for human populations based on morphological similarity look very different from (b) trees based on genetic similarity. Figure 16.22
This tree, based on the frequencies of 120 genes in 42 populations from every part of the globe, is consistent with the hypothesis that humans originated in Africa and spread from there to the rest of the globe. Figure 16.11
(a) This model of the expansion of early anatomically modern human populations generates the phylogenetic tree shown in (b) if geographically separate populations remain genetically isolated. Figure 16.12
(a) This model of the expansion of early anatomically modern human populations generates the phylogenetic tree shown in (b). Because European populations are assumed to be descended from a relatively recent mixture of African and Asian populations, the genetic distances between Europeans and Asians and between Europeans and Africans is smaller than the distance between Asians and Africans. Figure 16.14
This tree, based on genes from over 100 loci, indicates that European populations have undergone less genetic change than Asian or African populations. The length of the path between any two contemporary populations represents the genetic distance between them. The fact that the genetic distance between African and Asian populations is much greater than the distances between African and European populations or between Asian and European populations indicates that European populations have experienced less genetic change than other populations. Figure 16.13
Distribution of Three Genetic Diseases The distribution of three genetic diseases (PKU, cystic fibrosis, and Tay-Sachs) illustrates the existence of variation among human groups.
Mendelian Genetics in Humans: SLI The pattern of SLI in the KE family tree suggests that some cases of specific language impairment (SLI) are caused by a single dominant gene. Circles represent women, triangles represent men, and blue symbols represent people with SLI. If SLI is caused by a dominant gene, then, since SLI is rare in the population as a whole, we know from the Hardy-Weinberg equations that almost all people with SLI will be heterozygotes. Thus, Mendel’s principles tell us that, on average, half of the offspring of a mating between a person with SLI and a person without it will have SLI, and half the offspring will have normal linguistic skills. Notice how well the family shown in this tree fits this prediction.
Groupings Used by Lewontin in Population Genetics Study (1972)
Adaptive Significance of Human Variation • Human variation is the result of adaptations to environmental conditions. • Physiological response to the environment operates at two levels: • Long-term (genetic) evolutionary changes characterize all individuals within a population or species. • Short-term, temporary physiological response is called acclimatization.
Skin Color Influenced by three substances: • Hemoglobin, when it is carrying oxygen, gives a reddish tinge to the skin. • Carotene,a plant pigment which the body synthesizes into vitamin A, provides a yellowish cast. • Melanin,has the ability to absorb ultraviolet radiation preventing damage to DNA.
Pigmentation and Geographical Divisions • Before 1500, skin color in populations followed a geographical distribution, particularly in the Old World. • Populations with the greatest amount of pigmentation are found in the tropics. • Populations with lighter skin color are associated with more northern latitudes.
Skin Pigmentation This map shows contours in skin color. Notice that there are smooth gradients away from the equator.
Skin Color Skin color varies continuously when a representative sample of the world's populations is analyzed. In other words, it is impossible to establish neat categories or "pigeon holes" for populations or individuals based on this trait (continued below image).
Thermal Environment • Mammals and birds have evolved complex physiological mechanisms to maintain a constant body temperature. • Humans are found in a wide variety of thermal environments, ranging from 120° F to -60° F.
Human Response to Heat • Long-term adaptations to heat evolved in our ancestors: • Sweat Glands • Vasodilation • Bergmann's rule - body size tends to be greater in populations that live in cold environments.
Human Response to Cold • Short-term responses to cold: • Metabolic rate and shivering • Narrowing of blood vessels to reduce blood flow from the skin, vasoconstriction. • Increases in metabolic rate to release energy in the form of heat.
Climate and Body Size People living in colder climates have larger bodies. The vertical axis plots mean chest girth for numerous human groups, and the horizontal axis plots the mean yearly temperature in the regions in which each group lives. Because chest girth is a measure of overall size, these data show that people living in colder climates have larger bodies.
High Altitude • Multiple factors produce stress on the human body at higher altitudes: • Hypoxia (reduced available oxygen) • Intense solar radiation • Cold • Low humidity • Wind (which amplifies cold stress)
Infectious Disease • Caused by invading organisms such as bacteria, viruses, or fungi. • Throughout evolution, disease has exerted selective pressures on human populations. • Disease influences the frequency of certain alleles that affect the immune response.
Impact of Infectious Disease • Before the 20th century, infectious disease was the number one limiting factor to human populations. • Since the 1940s, the use of antibiotics has reduced mortality resulting from infectious disease.
Malaria • Falciparum malaria has historically been the leading killer of children and older adults in the southern hemisphere • Malaria originated as an animal parisite • Malarial strains have afflicted human populations for many thousands of years • Agriculture has significantly spread the disease due to sedentism and irrigation
Hemoglobin S is only common in areas of the world in which falciparum malaria is prevalent. (a) The colors show the frequency of hemoglobin S throughout the world. (b) The regions of the Old World in which falciparum malaria is prevalent are in red. Distribution of Hemoglobin S
The average fitness of the S allele of hemoglobin S declines as the frequency of S increases because more and more S alleles are found in SS homozygotes. Similarly, the average fitness of the A allele of hemoglobin A increases as the frequency of S increases because more and more A alleles are found in AS heterozygotes. A balanced polymorphism occurs when the average fitness of the two alleles is equal. Balanced Polymorphism in hemoglobin S
Small Pox • The only disease considered to be eliminated as a result of medical technology (Polio is close, except in Nigeria) • Smallpox has a higher incidence in those with type A or AB than in those type O blood. • The immune systems of individuals with type A antigen may not recognize the small pox antigen as a threat.
Impact of Infectious Disease in the West • In the late 1960s, the surgeon general declared the war against infectious disease won. • Between 1980 and 1992 deaths from infectious disease increased by 58%. • Increases in the prevalence of infectious disease may be due to overuse of antibiotics.
Environmental Factors. • Global warming may expand the range of tropical diseases. • The spread of disease is associated with encountering people; this includes crossing borders and penetrating remote areas. • The increasingly large human population leads to overcrowding, unsanitary conditions and the spread of communicable disease.
The LAC*P gene could have spread in the 7000 years (300 to 350 generations) since the origin of dairying if the ability to digest lactose as an adult leads to even as little as a 3% increase in fitness (s). Figure 16.09
Dimensions of Stratification • Power—control resources in one’s own interest. • Wealth—accumulation of material resources or access to the means of producing these resources. • Prestige—social honor or respect.
Ascribed Vs. Achieved Status • Ascribed StatusSocial position into which a person is born. (sex, race, kinship group) • Achieved StatusSocial position that a person chooses or achieves. (professor, criminal, artist)
Social Class in the United States • Status depends on occupation, education, and lifestyle. • “The American Dream,” is based on the democratic principle of equality and opportunity for all. • Social class in the United States correlates with attitudinal, behavioral, and lifestyle differences.
Caste System • System of stratification based on birth. • Movement from one caste to another is not possible. • Castes are hereditary, endogamous, ranked in relation to one another and usually associated with a traditional occupation.
Hindu Caste System Four caste categories • Brahmins - priests and scholars • Kshatriyas - ruling and warrior caste • Vaisyas - the merchants • Shudras - menial workers and artisans • Harijans – “untouchables”
U.S. Racial Stratification Systems • Race is constructed on the basis of skin color and presumed ancestry. • Divides people into “blacks” and “whites” ignoring the reality of the skin color spectrum. • By the 20th century, the system of race in the American south was very similar to the caste system in India.
Race Stratification in the U.S. and Brazil • Two largest multiracial societies in the Americas. • In both societies the legacy of slavery continues in the form of racial inequality. • Brazil: 45% of nonwhite families and 25% of white families live below the poverty line. • U.S.: 30% of nonwhite families and 8% of white families live below the poverty line.