2. AVIATION EMISSIONS IN CURACAO 2
ABSTRACT
Greenhouse gas (GHG) emissions from civil aviation contribute to anthropogenic
climate change and are expected to increase significantly in the future. GHG emission
inventories exist for civil aviation at the global scale but not on Curaçao’s subnational scale.
In this thesis, I present what seems to be the first detailed analysis of the carbon footprint
(CF) of civil aviation in Curaçao together with an assessment of what measures can be put in
place to mitigate the CF. I calculated the CF of civil aviation in Curaçao and determined what
measures can be put in place. To reduce the CF of civil aviation in Curaçao, I recommend the
installation of Point of Use (POU) terminals at the passenger boarding bridges, the
construction of renewable energy power-plants for the airport, the use of vectors into final by
airlines wherever possible, the installation of a MD-80 drag reduction package by applicable
airlines, the upgrade of ground support equipment and the lift of the renewable energy power-
plant limit imposed on residential and commercial entities in Curaçao.
3. AVIATION EMISSIONS IN CURACAO 3
Table of Contents
ABSTRACT.................................................................................................................2
Glossary of Terms and Units ...................................................................................6
Acknowledgements...................................................................................................8
Chapter 1: Introduction.............................................................................................9
Curaçao Introduction.............................................................................................................................10
Hypothesis.............................................................................................................................................10
Research Questions ...............................................................................................................................11
Project Plan ...........................................................................................................................................11
Assumptions and Limitations................................................................................................................11
Major Research Results.........................................................................................................................12
Value of Research .................................................................................................................................12
Introduction to Chapters........................................................................................................................12
Chapter 2: Aviation and its Impact on Climate Change: A Literature Review...13
Introduction ...........................................................................................................................................13
Climate Change and its impact on the world ........................................................................................14
Calculating the Carbon Footprint of Civil Aviation..............................................................................14
Reducing the CF of Aviation ................................................................................................................15
Summary ...............................................................................................................................................16
Chapter 3: Methodology .........................................................................................17
Introduction ...........................................................................................................................................17
Methodology for Airlines LTO Cycle...................................................................................................18
Airline Emission Formula.................................................................................................................21
Data Limitations ...............................................................................................................................23
Methodology for Airlines en-route climb, cruise and descent profiles.................................................24
Data Limitations ...............................................................................................................................25
Methodology for Airport Emissions .....................................................................................................26
Data Limitations ...............................................................................................................................26
Chapter 4: Curaçao’s Aviation Carbon Dioxide Emissions ................................27
Introduction ...........................................................................................................................................27
CO2 Emissions of Airlines.....................................................................................................................28
Chart Showing Ratio of CO2 Emissions Among Airlines for 2014...................................................29
Chart Showing Ration of CO2 Emissions Among Airlines for 2015.................................................30
Air Berlin ..........................................................................................................................................30
4. AVIATION EMISSIONS IN CURACAO 4
Air Canada........................................................................................................................................30
American Airlines .............................................................................................................................31
Avianca .............................................................................................................................................31
Avior..................................................................................................................................................31
Copa Airlines ....................................................................................................................................31
InselAir..............................................................................................................................................32
JetBlue...............................................................................................................................................33
KLM ..................................................................................................................................................33
PAWA................................................................................................................................................33
Rutaca ...............................................................................................................................................33
Sunwing Airlines...............................................................................................................................34
Suriname Airways.............................................................................................................................34
TUI....................................................................................................................................................34
Westjet...............................................................................................................................................34
Airport CO2 Emissions..........................................................................................................................34
Summary ...............................................................................................................................................35
Chapter 5: Applicable Carbon Dioxide Reduction Measures..............................36
Introduction ...........................................................................................................................................36
Alternative Airport Energy Sources......................................................................................................36
Solar Energy .....................................................................................................................................37
Wind Energy......................................................................................................................................37
Wave Energy .....................................................................................................................................38
Alternative Aviation Fuels ....................................................................................................................39
Ground Support Equipment ..................................................................................................................39
Point of Use Gate Terminals .................................................................................................................40
Super 98.................................................................................................................................................41
Vectors Into Final..................................................................................................................................41
Summary ...............................................................................................................................................42
Chapter 6: Conclusion............................................................................................43
Summary of Results ..............................................................................................................................43
Recommendations Resulting from Research ........................................................................................44
Recommendation 1: The installation of POU terminals...................................................................44
Recommendation 2: The abolishment or raise in the limit regulation of the feed-in tariff system...44
Recommendation 3: The installation of wind turbines. ....................................................................45
Recommendation 4: The upgrade of ground support equipment......................................................45
Recommendation 5: Increased Vectors into Final Approaches. ......................................................45
5. AVIATION EMISSIONS IN CURACAO 5
Recommendation 6: MD-80 Drag Reduction Packages Installation. ..............................................46
Contributions of Research.....................................................................................................................46
Limitations of Research ........................................................................................................................46
Suggestions for further research............................................................................................................46
Final Thoughts.......................................................................................................................................47
Bibliography ............................................................................................................48
APPENDIX 1: LTO FUEL BURN CALCULATION DATA........................................51
APPENDIX 2: AIRLINE AND GSE CO2 EMISSIONS ..............................................56
Abbreviations ........................................................................................................................................56
Emissions 2014 .....................................................................................................................................58
Emissions 2015 .....................................................................................................................................60
6. AVIATION EMISSIONS IN CURACAO 6
Glossary of Terms and Units
ACERT Airport Carbon Emissions Research Tool
ACI Airport Council International
ACRP Airport Co-operative Research Program
APU Auxiliary Power Unit
ATC Air Traffic Control
CDU Computer Diagnostics Unit
CF Carbon Footprint
CO2 Carbon Dioxide
DC-ANSP Dutch Caribbean Air Navigation Service Provider
EEDB Engine Emission Database
FAA Federal Aviation Administration
FIR Flight Information Region
GHG Greenhouse Gas
ICAO International Civil Aviation Organization
ICE Internal Combustion Engine
IFSET ICAO Fuel Saving Estimate Tool
KW Kilowatt
KWh Kilowatt Hour
LTO Landing and Takeoff Operations
MSL Mean Sea Level
N1 Low Pressure Turbine Rotation Speed
PBN Performance Based Navigation
7. AVIATION EMISSIONS IN CURACAO 7
PCA Pre-conditioned Air
POU Point of Use Terminal
STAR Standard Terminal Arrival Route
ToC Top of Climb
ToD Top of Descent
UID Unique Identification
8. AVIATION EMISSIONS IN CURACAO 8
Acknowledgements
I would like to thank Lt. Col (Ret’d) Oscar Derby for presenting me this rare
opportunity to conduct this assessment of Curacao’s aviation emissions. I would also like to
thank Dr. Meredith Derby, Mr. Leroy Lindsay and Ms. Althea Roper for the much needed
support and advice in regards to this thesis.
I will also like to acknowledge the employees at the CCAA and the DC-ANSP for the
greatly appreciated tireless support and limitless information that I needed to execute this
research.
Last but not least, I would like to thank the pilots and station managers of the airlines,
the managers of the ground handling companies and the airport operations and finance
personnel of Hato International that I have interviewed. Without your co-operation, this
research would not have been possible.
9. AVIATION EMISSIONS IN CURACAO 9
Chapter 1: Introduction
The Aviation Industry serves as an important means of travel in today’s world.
Today’s global economy is dependent on it as one of its key facilitators. Aviation contributes
about 3.5% of the global GDP as it underpins almost every aspect of modern life. It provides
the quickest means for travelers and cargo of all types to span cities and even continents, a
feat that took a considerably longer time less than 100 years ago. Fueled by increasing
demand, the aviation industry continues to grow at a considerable rate with the need of larger
airports, more aircraft and increased usage of airspace to accommodate the need for travel.
Consequently, as the industry grows, so does its carbon footprint on the environment.
The industry is a contributor to one of the most critical environmental problems,
anthropogenic climate change. In 2010, the aviation industry was measured to be accountable
for 2% of the total carbon dioxide (CO2) global and about 12% of CO2 emissions from all
transportation sources(International Civil Aviation Organization, 2010, p. 38). Air travel is
projected to increase at an annual rate of 4.5% per year towards 2020 (International Civil
Aviation Organization, p. 6) therefore; it is imperative that measures are put in place to
achieve a reduction in carbon emissions. In the face of adverse environmental changes caused
by the notable increases in CO2 emissions, numerous companies, organizations and even
individuals have announced their intent and dedication to pursue means and measures to
combat this emissions issue. In 2009 the International Civil Aviation Organization (ICAO),
the global body tasked with the standards and recommended practices of the aviation
industry, put forth a new goal. ICAO agreed for an annual improvement of 2% in fuel
efficiency of the international civil aviation in-service fleet for the medium-term (up to 2020)
and an aspirational global goal for an annual improvement of 2% in fuel efficiency of the
international civil aviation in-service fleet for the long-term (up to 2050) as part of the
contribution of the sector to stabilize and subsequently reduce aviation’s absolute emissions
contribution to climate change (ICAO Comittee on Aviation Environmental Protection, 2010,
p. 9).
There are numerous activities in the aviation industry that contribute to GHG
emissions. These activities all have to be considered in the complete assessment of Curaçao’s
aviation industry. Apart from emissions that are generated by aircraft, significant emissions
are also contributed by the vast supporting infrastructure that is required for aviation. These
include:
10. AVIATION EMISSIONS IN CURACAO 10
• Airport operations – Runway and taxiway lighting, air conditioning
• Auxiliary airport services – Catering, laundry, and ground services
In sight of this, the assessment and mitigation of CO2 emissions in the aviation sector
is one that requires a multi-layered approach.
Curaçao Introduction
Curaçao is a Caribbean island and also a part of the Netherland Antilles. It spans an
area of 444 km2
or 171.4 square miles and as of the 2015 population census, has 156,971
inhabitants (Central Bureau of Statistics Curaçao). Hato International Airport, ICAO code
name TNCC, is the sole airport that serves this island. Annually, it handles on average more
than 1.6 million passengers, greater than 13,000 tonnes of cargo and facilitates in excess of
22,000 aircraft movements (Curaçao Investment and Export Promotion Agency, 2015),
serving as a key facilitator towards Curaçao’s industries. The Dutch Caribbean Aeronautical
Service Provider (DC-ANSP) provides flight services for all aircraft operating within the
Curaçao FIR. In addition, Curaçao’s main sources of economy are petroleum refining and
bunkering, tourism and shipping (Central Intelligence Agency), all of which heavily rely on
the aviation industry.
Curaçao is not a newcomer in the renewable energy industry. Its first wind turbines
became operational in 1993 with a second wind farm constructed in the year 2000, totaling
12 MW. Following their phenomenal success, in 2011 both wind farms were renovated with
5 turbines each with the total power output of 30 MW between them. As of writing, these
wind farms produce approximately 20% of the islands electrical energy needs(National
Renewable Energy Labratory, 2015, p. 3).
Hypothesis
The hypothesis of this thesis is for Curaçao’s aviation sector to achieve a 2%
reduction per year in carbon emissions by 2020.
11. AVIATION EMISSIONS IN CURACAO 11
Research Questions
To prove or disprove my hypothesis I was guided by the following two research
questions
1. What is the Carbon Footprint (CF) of Curaçao ’s aviation sector?
2. What measures can be put in place to reduce the CF of Curaçao ’s aviation sector and
by how much?
Project Plan
This thesis will be focused on two areas of the environment in Curaçao. They are:
• The airlines that both serve Curaçao and operate within the Curaçao FIR
• Hato International Airport
An environmental assessment will be undertaken to determine the current level of
carbon dioxide production in both areas of focus. Measures towards the reduction of
emissions will be theoretically applied and their potential impact calculated. The hypothesis
will be proven or disproven based on the findings of this research. Conclusions will be drawn
to close the document and recommendations will be given for the improvement of the
aviation environment of Curaçao.
Assumptions and Limitations
In order to increase the accuracy and decrease the erroneousness of the data given,
assumptions and limitations have been placed. These are:
1. Airlines, the airport and the aeronautical service provider in this research repeatedly
use unvaried equipment.
2. Airlines in this research repeatedly use unvaried routes.
3. Airlines, the airport and the aeronautical service provider in this research repeatedly
use unvaried procedures.
4. Cargo, state owned and military traffic are not included in this research.
5. Fuel burned by the airport for energy generation is not included in this research.
6. Fuel burned by airport tenants for energy generation is not included in this research.
12. AVIATION EMISSIONS IN CURACAO 12
Major Research Results
In Curaçao, the total aviation CO2 emissions for the year 2014 and 2015 are 69,412
tonnes and 83,773 tonnes respectively. Through this research, it is found that the emissions
can be reduced by a total of 4.67% for the year 2015 using the recommendations within this
thesis. This result is based on the current renewable energy limitation that is imposed on
residential and commercial installations which applies to Hato International Airport. If this
limit was lifted however, the year 2015 emissions can be reduced by a total of 9.86% using
the recommendations within this thesis.
Value of Research
This research will provide multiple benefits. One benefit is that it provides a detailed
snapshot of the aviation-generated CO2 emissions in Curaçao. It is also, to the best of my
knowledge, the first of such work in Curaçao. This snapshot will allow us to understand the
present situation in Curaçao as well as to help pinpoint problem areas for emission reduction
focus. Scholars, policymakers and practitioners in the aviation field should find these results
useful.
Secondly, while this thesis focuses on Curaçao’s aviation environment, it can be used
as a template for emissions research in other jurisdictions.
Introduction to Chapters
Following this introductory chapter, the second chapter presents a review of the
literature on the CF of aviation and of how to assess the emissions of the aviation industry.
The third chapter explains the methodology adopted for this thesis, while the fourth chapter is
a detailed microanalysis of the CF of civil aviation in Curaçao. In the fifth chapter, I discuss
measures that can be implemented to reduce the CF and quantify the reduction effect of each
measure. Recommendations are presented in the concluding sixth chapter.
13. AVIATION EMISSIONS IN CURACAO 13
Chapter 2: Aviation and its Impact on Climate Change: A
Literature Review
Introduction
This chapter contains a review of literature on the carbon footprint (CF) of aviation.
This serves to establish the context for understanding the specific focus chosen for my
research. Most of these documents are published by the International Civil Aviation
Authority, the global body within the United Nations responsible for the standards and
recommended practices in the industry. Due to the growing concerns and interests in the
environment, they are now leading the charge in aviation environmental protection. Other
important documents are from Airport Cooperative Research Programme. From the published
documents of both these organizations, I understood how to conduct a CO2 emission analysis
of my two areas of concern: the airport and the airlines operating in the Curaçao FIR.
In the review of literature for the environment, there is a wide gamut of published
aviation environmental reports, a subset of global reports that address climate change on a
whole. I reviewed a few documents concerning what climate change is and its impact on the
world. My specific focus however was on literature related to the calculation of the CF and
methods to reduce it. With this, the literature is divided into 3 areas, each addressed in a
separate subsection of this chapter.
The first area of work is related to establishing what climate change is and its effect
on the global environment. This details the changes in the earth’s atmosphere and the
subsequent impacts that it has on the land, the people, the economy and the wildlife. This
section will give light to why anthropogenic climate change is a serious threat and the degree
of urgency that we must take action to lower our emissions.
The second area of work is related to analyzing the methods of calculating the CF of a
country. The four main pollutants emitted are aerosols, water vapor, nitrogen oxides, and
CO2. Of these, CO2 emissions are the dominant climate change-related impact of the aviation
transportation system. For this reason, I chose to focus my research on CO2 emissions.
The third area of work is related to analyzing the methods to reduce the CF of the
aviation sector. I establish that there are many options in the implementation of reduction
14. AVIATION EMISSIONS IN CURACAO 14
measures, however reduction measures must be tailored to suit the conditions present in the
environment.
Climate Change and its impact on the world
There are a myriad of climate change documents that exists. The rapid growth of
literature in this subject is a testament to the increasing attention paid to the negative climate
change.
One of the best surmises of the effects of climate change is documented in Turn Down
The Heat (World Bank, 2013). It details the numerous climatic impacts on each continental
region, notably for the Caribbean, a rise in the sea level of over 100 cm and the destruction of
marine ecosystems if temperature climbs above 4 degrees Celsius. As Curacao is a relatively
flat island that heavily relies on tourism, such a rise in sea level would effectively destroy the
beaches and coral reefs that are a main attraction in the tourism industry. As Hato
International Airport’s passengers are mainly tourists, such an environmental change would
have a disastrous impact on tourism and thus, passenger statistics. ICAO’s Aviation’s
Contribution to Climate Change (International Civil Aviation Organization, 2010) and
Environmental Report (International Civil Aviation Organization, 2013) details the various
effects that civil aviation has on the environment, particularly civil aviations role of the CO2
accumulation in the environment.
In addition to expert literature, there exists an increasingly large body of popular
literature discussing the relationship between climate change and aviation emissions. For
example, the BC-based David Suzuki Foundation has analyzed the CO2 intensity of aviation
compared to other modes of transportation, GHGs and contrails produced by airplanes,
aviation emission mitigation measures, and the potential impact of new technologies (David
Suzuki Foundation).
Calculating the Carbon Footprint of Civil Aviation
Upon research, there are a countless number of carbon emission calculators on the
internet with quite a few designed for aviation emission calculation. However, my research
was focused on the emissions contributed within Curacao’s aviation sector. There are
15. AVIATION EMISSIONS IN CURACAO 15
currently no carbon emission calculators that can calculate a detailed snapshot of an aviation
sector. Instead, there are methodologies that are designed to calculate certain prospects of an
aviation sector.
ICAO has produced numerous manuals concerning aviation emissions. These detail
how to calculate the emissions of certain areas of the aviation sector to the potential measures
that exist to reduce these emissions. They are well documented as they layout what data you
will need to calculate the emissions as well as the limitations of each method that is
presented. Airport Air Quality Manual(International Civil Aviation Organization, 2011)
details on how to calculate an Airline Landing and Takeoff (LTO) emissions as well as the
data needed in conducting the research and the limitations of such calculations. Airport
Council Research Programme’s (ACRP) Guidebook on Preparing Airport Greenhouse Gas
Emission Inventories (Airport Cooperative Research Programme, 2009) also gives a
guideline on how to calculate airport and airline emissions as well as details the data needed
in conducting the research and its limitations.
Reducing the CF of Aviation
In general, the motivation for calculating the CF of aviation (or any other human
activity) is to provide a basis or rationale for reducing the footprint. In my research, I have
attempted to not only calculate the CF of aviation in Curacao but also to theoretically apply
efforts to reduce it. I therefore reviewed the literature on reducing the CF of aviation. There
are two main areas of change in the aviation industry to reduce carbon emissions,
technological and non-technological.
The generally accepted idea in the literature is that short and medium term emissions
reduction will come from incremental technological changes. These are composed of
advances in alternative aviation fuels, advances in the renewable energy sector and advances
in engine design. ICAO’s Operational Opportunities to Reduce Fuel Burn and Emissions
(International Civil Aviation Organization, 2014) outlines measures that are applicable in
aviation to reduce the CF. With that document, I was able to get the baseline understanding
of what could be done on an aviation standpoint to lower the CF. ACRP Handbook for
Evaluating Emissions and Costs of APU’s and Alternative Systems(Airport Cooporative
Research Programme, 2012) details the fuel burn of aircraft APU’s and the significant
savings to be obtained by operating POU terminals in place of APU’s. Finally, ICAO’s Flight
16. AVIATION EMISSIONS IN CURACAO 16
Path to Sustainable Future (International Civil Aviation Organization, 2013) reviewed the
positive outcome of numerous bio-fueled flights. Of specific note is that Air Canada, using
alternative aviation fuel and other notable methods, reduced that recorded flight’s CO2
emissions by approximately 40%.
Summary
There is a broad literature on aviation and its impact on climate change, which for
purposes of this review was divided into three topic areas. The impact of climate change on
the environment was reviewed as well as the role that civil aviation plays in climate change.
It was found that ICAO and ACRP have numerous documents that detail how to assess the
aviation CF of a country. Finally, methods to reduce the aviation CF were detailed by ICAO
and ACRP documents.
17. AVIATION EMISSIONS IN CURACAO 17
Chapter 3: Methodology
Introduction
The aviation environment of Curaçao could be split into two main sections, the
emissions of the airport serving Curaçao and the emissions of the airlines serving Curaçao.
The airline emissions can further be split into two categories. First category is the Landing
and Takeoff (LTO) cycles. This would be constituted of the activities between the approach
from and below three thousand feet to the departure below and to three thousand feet. Three
thousand feet is the upper limit mixing altitude regarding the emissions for airports (Airport
Cooperative Research Programme, 2009, p. 22). This height is also important as for my
research as I employ various methods in order to calculate emissions. In terms of emissions
of airlines, this height represents the border between the two methods of data calculation. The
methods of calculations for airlines were derived from various ICAO and ACRP documents,
as well as ICAO and Airport Council International (ACI) tools such as IFSET and Airport
Carbon and Emissions Reporting Tool (ACERT).
There are quite a few aviation emissions calculators that are available online.
However, in my literature review I did not find any similar research completed to wholly
calculate aviation environmental emissions for an airport and the airlines serving it. I did find
however thorough documentation through ICAO and ACRP on how to carry out research in
this field and how to calculate emissions. Through this guide, I devised my own
methodological approach for CO2 emission calculation based on a compilation of existing
methods. In this chapter, the research carried out is divided into three sections with each
explaining the approach used to answer each emission sector that I have established.
There are three separate methods of data calculation that I used in estimating CO2
greenhouse gases for separate areas of my research. These are
1. For the airlines LTO cycle:
This is calculated using the Airport Air Quality Manual’s formulae, ICAO’s
EEDB, data from research regarding equipment description used by the
airlines, data recorded regarding the time in modes for each airline operation
and data from pilots regarding thrust settings for each time in mode. Grounds
18. AVIATION EMISSIONS IN CURACAO 18
Support Equipment (GSE) emissions were also calculated in conjunction with
direct airline emissions.
2. For the airlines en-route climb, cruise and descent profiles:
The IFSET tool was used in this instance to calculate fuel burn in the en-route
climb, cruise and descent profiles of flight. DC-ANSP flight data was used to
provide the altitudes, routes, type of equipment as well as time within the
Curaçao FIR
3. Airport Emissions:
The country’s emission factor and the airports yearly electrical usage were
used to generate emissions data for Hato International. Electrical usage data
was gathered from the airport’s finance department that holds the electrical
energy usage records.
Methodology for Airlines LTO Cycle
To calculate the carbon dioxide emissions generated from airline operations regarding
the LTO cycle, the cycle was split into multiple segments. The segments are comprised of:
1. Aircraft descent and approach from 3,000 feet Mean Sea Level (MSL) to touchdown.
2. Deceleration to taxi.
3. Taxi from the runway to the gate or ramp.
4. Auxilary Power Unit (APU) usage and GSE service.
5. Taxi from gate or ramp to runway.
6. Takeoff.
7. Initial climb from takeoff to 1,000 feet MSL.
8. En-route climb from the 1000 feet MSL throttle back to 3,000 feet MSL.
APU and GSE emissions are not normally included as a component of an LTO.
However, considering the extensive usage of this equipment observed, it was considered
as part of the LTO for ease of data calculation. The mean sea level height of 3,000 feet
was used as the point where I would end one method of calculations used to calculate
emissions and begin another. This point is defined as the mixing height of an aerodrome.
19. AVIATION EMISSIONS IN CURACAO 19
It is used due to the fact that the methodology used to calculate the LTO emissions cannot
account for the decrease in fuel flow as the aircraft gains height. Thus, these emissions
published by the EEDB only refer to operations at or below this mixing height as shown
in the Air Quality Manual (International Civil Aviation Organization, 2011, pp. 3-A1-2).
To lend credibility to my estimates, most of the techniques I used are ICAO and ACRP
defined procedures and certified data to calculate emissions in this section, all of which
are described below.
The Airport Air Quality Manual published by ICAO defines multiple methods in
quantifying the emissions generated by airline activities. As defined by the document, I
used the advanced approach, which requires ICAO’s EEDB database, aircraft fleet
information and thrust settings from the airlines in scope and time-in-mode data from the
airlines in scope. I chose to use the advance approach due to the fact that it is the most
accurate method of quantifying emissions aside from getting actual real-world emission
data from the airlines themselves.
In the advanced approach, the air quality manual defines formulae to be used in
conjunction with the supplied data above. Due to the complexity of the formulae and
large amount of data to be processed, Microsoft Excel was used to calculate the
emissions. ICAO’s EEDB database was downloaded from their website to be used in
conjunction with the model. The aircraft fleet information such as the aircraft, engine and
APU model, APU fuel flow and thrust settings were gathered by interviewing the pilots
directly while in their cockpit during turnaround times. This made it easier as being in the
cockpit, they had the relevant documents at hand to disseminate this information as well
as to retrieve active APU fuel burn information from the Computer Diagnostics Unit
(CDU) equipped on their aircraft. The time-in-mode data was gathered by myself
manually by timing the approach from 3000 feet MSL, landing roll-out, taxi-in, taxi-out,
take-off initial and en-route climb to 3000 feet MSL. I was able to accurately determine
where they crossed 3000 feet and where each phase of operation started by using flight
radar tracking, visual confirmation and live air traffic control (ATC) broadcasts.
20. AVIATION EMISSIONS IN CURACAO 20
The Airlines interviewed and the types of equipment they use are as follows:
AIRLINES AIRCRAFT
AIR BERLIN A330-200
AIR CANADA ROUGE A319-100
AMERICAN AIRLINES B737-800
AVIANCA
A318
A319
A320
A321
AVIOR 737-200
COPA AIRLINES
E190
B737-700
INSEL AIR
MD-83
MD-82
F70
JETBLUE A320
KLM
747-400
A320-200
RUTACA 737-200
Sunwing Airlines 737-800
SURINAM AIRWAYS 737-300
21. AVIATION EMISSIONS IN CURACAO 21
TUI
787-8
767-300
WESTJET 737-700
Airline Emission Formula
As the thrust settings employed by the airlines can vary between different airlines, the
standard certified thrust settings for each engine dataset couldn’t be used for data precision.
Also, due to the fact that the fuel flow varies exponentially with the thrust setting, it cannot
be modeled by a standard linear equation. The Airport Air Quality Manual (International
Civil Aviation Organization, 2011, pp. 3-A1-15) defines two quadratic formulae for use when
varying thrust settings are given, one when commanded thrust is above 85% maximum rated
thrust and the other when commanded thrust is below 85% and above 65% maximum rate
thrust. Due to the fact that on approach and landing, the airlines were observed to be using
thrust settings consistently below 65%, I elected to modify the second formula with
commanded thrust settings from 85% to and above 30% maximum rated thrust. Using the
EEDB, the formula takes specific fuel flow settings from defined thrust points and models a
curve that more precisely emulates the rise in fuel flow with thrust settings than a linear
equation could.
The formula is defined as below:
Y = AX2
+ BX + C
There are three known points as defined by the EEDB:
Y1 = AX12
+ BX1 + C
Y2 = AX22
+ BX2 + C
Y3 = AX32
+ BX3 + C
The calculation of the variables A, B and C are as follows
A = (Y3 –Y1) / ((X3 – X1) * (X1 – X2)) – (Y3 – Y2) / ((X3 – X2) * (X1 – X2))
B = (Y3 – Y1) / (X3 –X1) – A * (X3 + X1)
C = Y3 – A * X32
– B * X3
For each engine Unique Identification (UID), the variables A, B and C are not constant.
22. AVIATION EMISSIONS IN CURACAO 22
X is defined as the thrust setting while Y is defined as the fuel flow. For thrust
settings above 85% maximum rated thrust, X1 is the 30% thrust setting, X2 is the 85% thrust
setting and X3 is the 100% thrust setting. For thrust settings from and below 85% to and
above 30% maximum rated thrust, X1 is the 7% thrust setting, X2 is the 30% thrust setting
and X3 is the 100% thrust setting. Y1, Y2 and Y3 is the corresponding fuel flow in kilograms
per second (kg/s) to the commanded thrust X1, X2 and X3.
If the resulting graph were plotted, it would have an appearance similar to this:
As the formula uses data from the EEDB, it is crucial to get the exact engine model
number, even down to the engine revisions. This is because any revisions to the engine, such
as a new combustor, new injectors, a smoke kit etc. can have a considerable impact on the
fuel consumption and thus CO2 emissions.
The excel sheet used was constructed to automatically retrieve the fuel flow data from
the corresponding thrust points in the EEDB database by using the engine Unique
Identification (UID) entered. From there, it calculates the fuel flow per second from the N1
and Engine Pressure Ratio (EPR) settings collected from the pilots. The N1 and EPR settings
were converted to thrust settings by dividing each setting by the maximum N1 speeds or
EPR’s for each engine. Using the time-in-mode data gathered, the fuel flows in each mode
23. AVIATION EMISSIONS IN CURACAO 23
were multiplied to gain the total fuel burned in each segment of the LTO cycle. This was also
coupled with the fuel burned during APU operation in order to attain the fuel burned during
the LTO cycle, calculated using the APU fuel burn given by the pilots and the gate times
published by the airport. The fuel consumption correction of 3% was also factored into each
LTO phase calculation as recommended by the Air Quality Manual (International Civil
Aviation Organization, 2011, pp. 3-A1-19). Specifically for the Fokker F50 aircraft, as their
Pratt and Whitney PW125 and PW127 engines are not detailed in the EEDB, the LTO fuel
burn figure of 200 kg is used, taken from the Airport Air Quality Manual (International Civil
Aviation Organization, 2011, pp. 3-A1-31).
The DC-ANSP provided me with the traffic data within Curaçao’s Flight Information
Region (FIR) for both the years 2014 and 2015. Using this, I could then extrapolate by excel
query how many times each airline operated a specific aircraft type to and from Curaçao in a
year. This data would then be used to calculate how many LTO’s a particular type of aircraft
had from an airline and as such, how much fuel it burned for that particular year. Using the
standard of 3.157 kg of CO2 emitted for each kilogram of Jet-A burned (International Civil
Aviation Organization, 2011, pp. 3-A1-31), the amount of CO2 that was released for airline
operations in 2014 and 2015 was then calculated. These CO2 results were combined with
GSE equipment CO2 emissions. The emissions for the GSE were calculated using the figures
of 18 kg of CO2 for narrow body aircraft and 58 kg of CO2 for wide-body aircraft, figures
taken from the Airport Air Quality Manual (International Civil Aviation Organization, 2011,
pp. 3-A2-6).
With this, the calculation of aircraft related emissions by in the LTO for Curaçao was
calculated for the years 2014 and 2015.
Data Limitations
My limitations of Curaçao’s airlines LTO CO2 emissions are as follows:
1. EEDB data is created using newly built and certified engines. ICAO recommends a
correction factor of +3% on the fuel flows to simulate operational wear and tear on
the engine. The airlines that serve Curaçao operate an airline fleet that varies wildly in
age. For example, TUI operates a Boeing 787-800, an aircraft that is around 5 years
old in operation while Rutaca operates a Boeing 737-200, an aircraft that is more than
24. AVIATION EMISSIONS IN CURACAO 24
30 years old. While airframe age is not closely representative of the engine age, it
does stand to reason that the engines on a particularly older airframe are more likely
to have greater hours than an engine on a newer airframe. With such a variance, the
correction factor may be over estimating on some airlines and under estimating on
others.
2. EEDB data is created with engines that have no accessories. Accessories such as
engine bleed, hydraulic pumps and electrical generators would increase the load, and
conversely, the fuel burn of an engine. As, in the real world, aircraft engines are
tasked with electrical generation and have hydraulic and pneumatic loads, actual fuel
burn may be higher than estimated.
3. The environment in the EEDB databank is of the international standard atmosphere
(ISA). No corrections have been made for any variances in temperature, pressure and
humidity experienced at Curaçao International Airport, all of which have an impact
on the performance of the engine.
Methodology for Airlines en-route climb, cruise and descent profiles
ICAO’s Fuel Saving Estimate Tool (IFSET) was used to generate the climb fuel burn
from above 3,000 feet MSL to cruise altitude in the departure phase, the cruise altitude fuel
burn within Curaçao’s FIR and the descent fuel burn from cruise altitude to 3,000 feet MSL
in the arrival phase. The program uses fleet data from various airlines around the world to
generate an average performance model that would be used to simulate fuel burns of the
parameters entered by the user. The data used to supplement the program was taken from the
average of the flight levels that the airlines used, the time spent within the Curaçao FIR and
the fleet data of the airlines.
First, a profile of the airline being measured was entered. In filling out the operational
definition, the aircraft entered was the aircraft group that aircraft being tested belonged to.
For base flights, only the figure 1 was entered as I aimed to get the fuel burn of a single cycle
25. AVIATION EMISSIONS IN CURACAO 25
and then use the number of cycles provided by the DC-ANSP. The new flights input box was
left blank, as this was not used. The remaining trip distance was also left blank; the program
however uses a default value based on worldwide data.
Secondly, the current procedure was defined. First, the descent action was listed. The
altitude chosen to descend from was the average cruise altitude of the aircraft in that year.
The altitude chosen to descend to was 3,000 feet MSL. With these two parameters entered,
the program automatically calculates optimally how many nautical miles (NM) it would take
for this aircraft to execute this operation. Next, the cruise operation before descent was
defined. The cruise altitude is the average altitude for the aircraft in that year. The distance in
cruise is the total distance covered in the FIR subtracted by the distance covered in descent
that was calculated by the program previously; this would yield the distance covered in cruise
between entry into the Curaçao FIR and Top of Descent (ToD). Next, the climb operation
from 3,000 feet MSL to cruise altitude was defined. The cruise altitude chosen to climb to is
the average altitude for the aircraft in that year. With the initial and cruise altitudes defined,
the program automatically calculates optimally how many nautical miles it would take for
this aircraft to execute this operation. Lastly, the cruise operation after climb was defined.
The cruise altitude is the average altitude for the aircraft in that year. The distance in cruise is
the distance covered in the FIR subtracted by the distance covered in the climb that was
calculated by the program previously; this would yield the distance covered in cruise between
Top of Climb (ToC) and exit out of the Curaçao FIR.
With the definitions outlined, the program was then run to generate an estimate of the
fuel burned in each phase of operation; cruise, climb and descent. These were then entered
into the excel spreadsheet where it was added to the fuel burn of the LTO’s and multiplied by
the amount of LTO’s for the specific year to attain the total fuel burn for the year. It was then
converted to CO2 emissions by multiplying it by the standard conversion factor of 3.157 kg
per 1 kg of Jet-A.
Data Limitations
My limitations in the calculation of the airlines’ climb, cruise and descent emissions
are as follows:
1. The data the program uses to calculate is a generalization of worldwide data gathered
from airlines. The fuel burn estimates are taken and averaged from a worldwide fleet,
which may not be subject to Curaçao’s environment.
26. AVIATION EMISSIONS IN CURACAO 26
2. The program cannot account for winds aloft, temperature and other environmental
factors that can affect aircraft performance.
3. The program only produces fuel burn results that are rounded to the hundreds of
kilograms. This fuel burn generalized estimate coupled with the aircraft general
estimate may yield a large source of error when compared to each individual aircraft’s
real world fuel burn.
Methodology for Airport Emissions
The CO2 emission regarding Hato International is relatively simple to calculate. Hato
International Airport utilizes Curaçao’s electrical grid to supply it with electricity during
operations. A company called AquaElectra provides the electricity for use to the country.
Hato International currently does not have any alternate means of electrical energy apart from
the backup generators that are used in the event of a power outage. The emission factor for
the country of Curaçao was researched from the ACERT tool and the total electrical
consumption for the year 2014 and 2015 for Hato International Airport were calculated using
data from the finance department of the airport. Multiplying the total Kilowatts hours (KWh)
used by the airport by the emission factor for the country’s electrical grid, the CO2 emissions
that the airport generates off-site can be derived.
Data Limitations
My limitations in the calculation of the airports CO2 emissions are as follows.
1. There may be losses in the transfer of electrical energy from the power station to the
airport. Thus the energy consumed by the airport also would include the energy lost
during transmission, which is not calculated in this research.
27. AVIATION EMISSIONS IN CURACAO 27
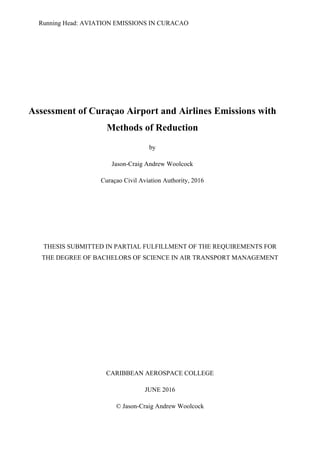
Chapter 4: Curaçao’s Aviation Carbon Dioxide Emissions
Introduction
The purpose of this chapter is to provide a detailed snapshot of the CO2 emissions
being generated by aviation related activities in the country. The CO2 emissions that this
research details for Curaçao are comprised of:
1. The emissions from airlines that are serving Curaçao while within the Curaçao FIR
2. The airport emissions from activities related towards the service of these airlines.
A chart of emissions between the airlines and the airport can be found below, 1 being
year 2014 and 2 being year 2015.
5,555,552 5,939,640
63,856,787
77,833,750
0
10,000,000
20,000,000
30,000,000
40,000,000
50,000,000
60,000,000
70,000,000
80,000,000
90,000,000
1 2
Chart of Emissions by Source
Airport
Airlines
28. AVIATION EMISSIONS IN CURACAO 28
The CO2 emissions for flights are analyzed by airlines. Calculation results are
summarized in this chapter. Detailed numerical results for all calculation can be found in the
tables in Appendix. Calculations are discussed in the following order:
1. CO2 emissions of the airlines
2. CO2 emissions from the airport
CO2 Emissions of Airlines
To determine the CO2 emissions for the airlines, the emissions for the airlines LTO,
cruise, climb and descent within the Curaçao FIR were calculated and totaled. The CO2
emissions for 2014 were calculated to be 63,857 tonnes. For 2015, the CO2 emissions
increased to 77,834 tonnes, a 22% increase of CO2 emissions from the previous year. This
increase can be mostly attributed to increased aircraft movements at Hato International
Airport.
A total of 15 airlines were analyzed for CO2 emissions. Their totals separately can be
found below.
AIRLINES
Tonnes
2014
Tonnes
2015
AIR BERLIN 1,290 1,542
AIR CANADA 224 693
AMERICAN AIRLINES 8,815 9,178
AVIANCA 2,283 2,401
AVIOR 809 1924
COPA AIRLINES 1,205 1,281
INSEL AIR 28,179 33,606
JETBLUE 99 1,131
KLM 13,043 15,605
PAWA 0 971
RUTACA 343 1,173
SUNWING AIRLINES 0 226
SURINAM AIRWAYS 1,496 1,769
29. AVIATION EMISSIONS IN CURACAO 29
TUI 5,865 6,303
WESTJET 206 31
Chart Showing Ratio of CO2 Emissions Among Airlines for 2014
For this year, 63,850 tonnes of CO2 was generated by the airlines. The ratio of which
is shown below:
AIR BERLIN; 2%
AIR CANADA;
0%
AMERICAN
AIRLINES; 14%
AVIANCA; 4%
AVIOR;
1%
COPAAIRLINES;
2%
INSEL AIR; 44%
JETBLUE; 0%
KLM; 21%
PAWA; 0%
RUTACA; 1%
SURINAM
AIRWAYS; 2%
TUI; 9%
WESTJET; 0%
CO2 TONNE RATIO 2014
30. AVIATION EMISSIONS IN CURACAO 30
Chart Showing Ration of CO2 Emissions Among Airlines for 2015
For this year 77,834 tonnes of CO2 was generated by the airlines, the ratio of which is
shown below:
A detailed breakdown of each airline is provided below.
Air Berlin
Air Berlin operates a long haul route between Curaçao and the city of Dusseldorf in
Berlin using Airbus A330 aircraft. In 2014 it was the 7th
most emitter of CO2 emissions in its
operations, emitting 1,290 tonnes of CO2 through the combination of flight and gate
operations. In 2015, it dropped as the 8th
most emitter of CO2 emissions in its operations
though it increased in emissions, emitting 1,542 tonnes of CO2.
Air Canada
Air Canada and Air Canada Rouge operates a medium haul route between Curaçao
and the two cities of Montreal and Toronto respectively in Canada, using the Airbus A319
aircraft. In 2014 it was the 11th
most emitter of CO2 emissions in aircraft operations, emitting
AIR BERLIN; 2%
AIR
CANADA; 1%
AMERICAN
AIRLINES; 12%
AVIANCA; 3%
AVIOR; 3%
COPAAIRLINES;
2%
INSEL AIR; 43%
JETBLUE;
1%
KLM; 20%
PAWA; 1%
RUTACA; 2%
Sunwing
Airlines; 0%
SURINAM
AIRWAYS; 2%
TUI; 8%
WESTJET; 0%
C02 TONNE RATIO 2015
31. AVIATION EMISSIONS IN CURACAO 31
224 tonnes of CO2. In 2015, it dropped as the 13th
most emitter of CO2 emissions, although its
emissions increased to 693 tonnes of CO2.
American Airlines
American Airlines operates a short haul route between Curaçao and Miami in the
United States using the Boeing 737-800. In 2014 it was the 3rd
most emitter of CO2 emissions
in its operations, emitting 8,815 tonnes of CO2. In 2015 it was also the 3rd
most emitter of
CO2 and generated a CO2 increase to 9,178 tonnes.
Avianca
Avianca Airlines operates a short haul route between Curaçao and the city of Bogota
in Colombia using the Airbus A318, A319, A320 and A321 family of aircraft. In 2014 it was
the 5th
most emitter of CO2 emissions, emitting 2,283 tonnes. In 2015 it was also the 5th
most
emitter of CO2 emissions, with its emissions rising to 2,401 tonnes.
Avior
Avior Airlines operates a short haul route between Curaçao and the cities of
Maracaibo and Maiquetia respectively in Venuzuela using the Boeing 737-200. In 2014, it
was the 9th
most emitter of CO2 emissions, emitting 809 tonnes. In 2015 it raised to the 6th
most emitter of CO2 emissions, with its emissions more than doubling to 1,924 tonnes.
Copa Airlines
Copa Airlines operates a short haul route between Curaçao and Panama City in
Panama using both the Embraer E190 and Boeing 737-700 aircraft. In 2014 it was the 8th
most emitter of CO2 emissions, emitting 1,205 tonnes of CO2. In 2015, it fell to the 9th
most
emitter of CO2 emissions although emissions increased slightly to 1,281.
32. AVIATION EMISSIONS IN CURACAO 32
InselAir
InselAir is the national carrier of Curaçao and uses Hato International as its hub for
operations. It operates flights between Curaçao and the countries of:
• United States
! Charlotte
! Miami
• Dominican Republic
! La Romana
! Santo Domingo
• Jamaica
! Kingston
• Cuba
! Havana
• Colombia
! Barranquilla
! Medellin
• Venezuela
! Barquisimeto
! Caracas
! Las Piedras
! Maracaibo
! Valencia
• Suriname
! Paramaribo
• Guyana
! Georgetown
• Aruba
• Bonaire
• Sint Maarten
• Trinidad and Tobago
! Port of Spain
33. AVIATION EMISSIONS IN CURACAO 33
Their fleet is comprised of the Fokker F50 and F70, McDonald Douglas MD-82 and
MD-83 aircraft. Its emissions are consistently the highest in both years, emitting 28,179
tonnes of CO2 in 2014 and 33,606 tonnes of CO2 in 2015.
JetBlue
JetBlue operates a short haul route between Curaçao and the city of New York in the
United States using the Airbus A320 aircraft. In 2014 it was the 13th
most emitter of CO2
emissions, emitting 99 tonnes of CO2. In 2015, it climbed to the 11th
most emitter of CO2
emissions, emitting 1,131 tonnes of CO2.
KLM
KLM operates a long haul route between Curaçao and the city of Amsterdam in the
Netherlands using the Boeing 747-400 and the Airbus A330-200. In 2014 and 2015, it was
the 2nd
most emitter of CO2 emissions, emitting 13,043 tonnes of CO2 of 2014 and 15,605
tonnes of CO2 in 2015.
PAWA
Pawa Dominicana started short haul operations in 2015 between Curaçao and the city
of Santo Domingo in the Dominican Republic. It is the 12th
most emitter of CO2 emissions
for the year 2015 with 971 tonnes of CO2 being emitted.
Rutaca
Rutaca operates a short haul route between Curaçao and the city of Caracas in
Venezuela using the Boeing 737-200. In both 2014 and 2015, it was the 10th
most emitter of
CO2 emissions, emitting 343 tonnes of CO2 in 2014 with an increase to 1,173 tonnes of CO2
in 2015.
34. AVIATION EMISSIONS IN CURACAO 34
Sunwing Airlines
Sunwing Airlines operates a medium haul route between Curaçao and the city of
Toronto in Canada using the Boeing 737-800. It only conducted flights in 2015, generating
226 tonnes of CO2 in the process and becoming the 14th
most emitter of CO2 for that year.
Suriname Airways
Suriname Airways operates a short haul route between Curaçao and the city of Port-
of-Spain in Trinidad and Tobago using the Boeing 737-300. For 2014 it was the 6th
most
emitter of CO2 emissions, emitting 1,496 tonnes of CO2. For 2015 it fell as the 7th
most
emitter of CO2 emissions, however its emissions rose to 1,769 tonnes of CO2.
TUI
TUI operates a long haul route between Curaçao and the city of Amsterdam in the
Netherlands using both the Boeing 787-800 and 767-300. In both 2014 and 2015, it was the
4th
most emitter of CO2 emissions. The airline emitted 5,865 tonnes of CO2 and 6,303 tonnes
of CO2 in 2014 and 2015 respectively.
Westjet
WestJet operates a medium haul route between Curaçao and the city of Toronto in
Canada using the Boeing 737-700. It was the 12th
most emitter of CO2 emissions in 2014,
generating 206 tonnes of CO2 that year. In 2015, it dropped to the 15th
most emitter of CO2
emissions, emitting only 31 tonnes of CO2 that year.
Airport CO2 Emissions
The electrical usage data for the year 2015 was incomplete. To provide an estimate
for the year 2015, the rise in electrical usage in the months January, February and March
were compared between the two years. I then averaged the rise in KWh and applied it to the
remaining months from 2014. For the year 2014, the airport consumed 7,856,812 KWh of
electricity while in 2015; electrical consumption was 8,400,000 KWh of electricity. The CO2
EF for the country of Curaçao is .7071 kg/KWh, taken from ACERT. The off-site CO2
35. AVIATION EMISSIONS IN CURACAO 35
emissions that have been generated by the airport for the years 2014 and 2015 are 5,556
tonnes and 5,940 tonnes respectively.
Summary
In the year 2014, total CO2 emissions from aviation related activities for airlines
serving Curaçao and Hato International Airport were calculated to 69,412 tonnes. This figure
increased to 83,773 tonnes of CO2 for the year 2015. CO2 emissions have thus increased by
20.7% between these two years. This rise is in relation to the fact that passenger and aircraft
movements have increased from 2014 to 2015. Thus aircraft emissions, GSE emissions and
airport emissions would rise as well.
36. AVIATION EMISSIONS IN CURACAO 36
Chapter 5: Applicable Carbon Dioxide Reduction Measures
Introduction
In this chapter, energy saving measures that can be put into effect to lower Curaçao’s
aviation carbon footprint will be outlined. I described 6 methods or equipment that can be
used to lower the CF while quantifying the reduction for four of these methods. These are:
1. Alternative Airport Energy Sources
2. Alternative Aviation Fuels
3. Ground Support Equipment
4. Point of Use Gate Terminals
5. Super 98 Drag Reduction Kit
6. Vectors into Final
Alternative Airport Energy Sources
Renewable Energy has been a focus in other industries recently as they strive for
ways to reduce their Carbon Footprint. The installation cost of the equipment has fallen since
their inception, making renewable energy a more attractive proposition for airports that are
looking not only to reduce their carbon footprints but to reduce their operating costs as well.
From wind farms harnessing wind energy, solar panels that convert light into electricity and
even wave generators that harness the kinetic energy from waves and tides, there is no
shortage of means for airports to harness the natural energy that is in their surrounding
environments. This would lead to lower consumption bills and also helps airports towards a
zero-emission state, where these renewable energy sources are sufficient to power the entire
airport throughout its day-to-day operations.
Many airports have adopted renewable energy generation means to lower their costs
of operation as well as to lower their emissions. La Palma Airport (ICAO: GCLA) operates
two 660 KW wind turbines on the Airports property. In 2011, these turbines produced 27% of
the airport’s electricity needs (La Palma Airport, 2009, p. 16). Conchin International Airport
(ICAO: VOCI) operates a 12 MW solar plant that produces 100% of the airport’s electrical
needs and surplus energy that is sold to the state’s grid (Font, 2015). Even Hato
International’s sister airport, Beatrix International Airport (ICAO: TNCA), has committed to
37. AVIATION EMISSIONS IN CURACAO 37
green energy and has installed a 3.6 MW solar park above its landside parking lot
(Government of Aruba, 2015).
Currently, the renewable energy tariffs in Curaçao limits residential and commercial
generation systems to a 1-megawatt (MW) capacity. Under this rule, it is not possible for
Hato International Airport to generate enough power to cover their electrical energy
requirements, no matter the source of the renewable energy. For the purpose of this research
and in regards to a zero emission airport, the calculations for the required MW generation
needed to fully supply Hato International shall be carried out. The final calculation shall be
carried out with both the 1 MW restriction and non-restrictions.
Solar Energy
In 2015, Hato International Airport consumed approximately 8,400,000 KWh of
electricity. Per year, Curaçao experiences an average 3,199 hours of sunlight with 27% of
those sunlight hours in cloudy or hazy conditions or low sun intensity (Climatemps, 2014). In
cloudy conditions, solar panels can drop to an average of 17.5% of their rated output capacity
(Llorens, 2014). Using this information, it is calculated that a 1 MW solar plant installed at
Hato International would potentially generate 2,486,423 KWh per year, lowering airport
emissions to 4,181 tonnes from the previous 5,940 tonnes of CO2. This is an improvement of
30% in airport CO2 emissions.
However, to achieve a zero emission airport, the solar array would need to provide
enough electricity to cover the yearly energy consumption of the airport. To achieve this
under the existing conditions, the solar array would need to be able to generate at least 3.4
MW of electricity to fully power Hato International, which is over 3 times the current limit
that is imposed. This energy requirement would be similar to the solar panel array that is
installed at Aruba’s Beatrix Airport, which is rated at 3.6 MW.
Wind Energy
The island of Curaçao has a deep history in harnessing the energy from the wind, with
the first wind farm, a 3 MW plant at Terra Kora, gaining huge success when it came online in
1993. This plant and another wind farm that was built at Playa Kanoa in 2000 were two of the
oldest but most productive wind farms in the Caribbean (National Renewable Energy
38. AVIATION EMISSIONS IN CURACAO 38
Labratory, 2015, p. 3). The consistently high average wind speeds that Curaçao experiences
make the island highly attractive to wind energy developments. NuCapital, a renewable
project developer, purchased both the Tera Kora and Playa Kanoa sites and replaced the
existing generators with five 3 MW Vesta turbines at each site, bringing total wind generation
capacity to 30 MW. A second installation is planned in Tera Kora to raise capacity by an
additional 16.5 MW.
Curaçao has great potential for harnessing wind energy and the airport itself can also
take advantage of it. Airport obstacle height requirements have to be taken into consideration
but limiting the size of the wind turbines as well as placing them offshore can mitigate these
issues. Indeed, La Palma International Airport is an example of an airport that has overcome
such issues with the installation of their wind turbines. As Hato International is located on the
coast of Curaçao, the turbines can be placed and distanced offshore from the airport. Vesta
also incorporates design features such as aviation lights to increase visibility of the turbines.
Such features are already installed on the existing turbines in Playa Kanoa and Tera Kora.
As Curaçao has an average wind of 7 meters per second annually (Wind Finder), 2
Vesta V90-1.8 at a combined power output of 3.6 MW would provide approximately 12,000
MWh per year (Vestas). This is approximately 1 ½ times the energy usage of Hato
International. Surplus energy could then be fed into the grid, providing revenue to the airport.
This surplus will also provide Hato International with room to grow their airport with the
assurance that the existing wind generators will supplant the subsequent growth in electrical
needs. As of writing, The Vesta V90-1.8 is also the smallest wind turbine in Vesta’s
portfolio, in both turbine height and blade area, making it the candidate with the highest
potential of implementation.
Wave Energy
In comparison to solar and wind energy generation, wave energy generation is still in
its inception phase. However, it is accepted that the kinetic energy the seas and oceans
possesses are much greater than both wind and solar energy generation, although harder to
access. “Solar photovoltaics (electric solar panels) typically generate power on the order of a
hundred watts per square meter and wind one thousand watts per square meter of swept area,
but wave energy is typically in the range of several tens of thousands of watts per meter of
wave front. This allows wave energy plants to produce comparable power to wind and solar
39. AVIATION EMISSIONS IN CURACAO 39
energy plants while having smaller footprints” (Colombia Power Technologies). As of
writing, there are not many wave generators that are in service, with wave generation being in
its experimental phases. As such, an actual calculation of the benefit to Hato International
Airport is not possible as there are no precise energy generation figures. It is however, safe to
say that wave energy generation has more power per area than both wind and solar energy
generation. Wave energy generation plants could then have a smaller volume footprint than
both a solar and wind energy plant yet still generate a similar power output as both.
Alternative Aviation Fuels
With a finite supply of fossil fuels and the rising concern of CO2 emissions,
alternative aviation fuels are being developed to solve the issue. The alternative fuels are
being designed as a drop-in replacement to fossil fuel derived jet fuel, requiring no
modification to the existing equipment. These fuels also have a reduction in CO2 emissions
per kilogram of jet fuel.
Alternative aviation fuels are still in its experimental phases for commercial jet
aircraft; however there have been numerous test runs that have been highly successful. Air
Canada Flight 991, as part of the ICAO’s Flightpath to a Sustainable Future, realized a 40%
saving in CO2 emissions when using Jet fuel derived from recycled cooking oil as well as
other fuel saving measures (Air Canada, 2012). Alternative aviation fuels can also be made
from waste biomass and from oils such as Camelina and Janthropa. However, no definite
emissions calculations can be made within the scope of this thesis. However, it is positive
that alternative aviation fuels will be engineered to have lower CO2 emissions per kilogram
of jet fuel compared to their fossil fuel derived counterparts.
Ground Support Equipment
During research of the airport equipment, it was found that the age of the ground
support equipment ranged as far back as the 1980’s. This meant that many of the diesel
engines equipped on the GSEs lacked the modern technology such as catalytic converters,
variable valve timing and turbochargers, all of which aims to improve the economy and lower
emissions of the engine.
40. AVIATION EMISSIONS IN CURACAO 40
Electric GSE has been slowly replacing internal combustion engine (ICE) GSEs at
airports around the world. The main advantage of electric GSEs is that they emit no
emissions directly. Emissions attributed to electric GSEs are off-airport emissions, however
these would be lower than the emissions that comparable ICE GSEs emit. These units are not
without their drawbacks. The high initial cost and current battery technology are limiting the
widespread implementation of a fully electric GSE fleet.
If the GSE fleet at Hato International were an all-electric fleet, it would eliminate the
emissions attributed to the ICE GSEs. In 2015, the current fleet of GSE was calculated to
have emitted approximately 237 tonnes of CO2, which is 0.30% of the emissions emitted in
airline operations. Switching to electric GSE would lower the CO2 emissions close to this
amount. Also, if the airport were to become 100% sustained by renewable energy, then the
true emissions of the electric GSE would be neutralized, along with emissions from the rest
of the airport.
Point of Use Gate Terminals
Point of use (POU) gate terminals is usually comprised of pre-conditioned air (PCA)
and electrical inverter units that are used by parked aircraft at the gates during their
turnaround. These units are usually attached to the underside of the passenger boarding
bridge, providing close proximity to the aircraft it will be servicing. They supply pre-
conditioned air and/or electrical energy that would otherwise be supplied by portable ground
power units and air-conditioning carts or the aircraft’s APU. The key difference in the POU
terminals and the other units are that the POU terminals use the airport’s existing electrical
supply to power its systems, emitting no emissions from the unit itself. Currently at Hato
International, most aircraft use APU power to supply cabin air conditioning and electrical
power during its turnaround. Though APU power is readily available to the aircraft, it is an
inefficient source of power compared to both GPU’s, air conditioning carts and POU’s.
Through preliminary calculations, POU terminals were found to emit an average 81% less
CO2 than APUs during regular operation. These calculations were performed on all
commercial aircraft fleet that uses the passenger boarding bridges in the scope of this thesis
using data from ACRP report 64. If all commercial aircraft flights that had used the passenger
boarding bridges in 2015 had used POU’s for aircraft air conditioning and electrical power,
the airline CO2 emissions for the year would have been 76,114 tonnes compared to the actual
41. AVIATION EMISSIONS IN CURACAO 41
emissions of 77,834 tonnes. This is a reduction in CO2 emissions of just over 2%. If the POU
terminals used 100% renewable energy, then the CO2 emissions for the year would then be
75,706 tonnes, a reduction in emissions of nearly 3%.
Super 98
InselAir, the national carrier of Curaçao, has a fleet of 18 aircraft, 7 of which are
McDonald Douglas MD-80 series aircraft (InselAir Airlines). PAWA also uses the MD-80
series aircraft to serve Curaçao. There is a Federal Aviation Administration (FAA) certified
airframe modification company called Super 98 that offers a drag reduction package that
would decrease fuel burn by more than 3.5%. This drag reduction package can be installed
with minimal downtime to the aircraft and decrease emissions for both MD-82 and MD-83
aircraft (Super 98).
Vectors Into Final
Airlines traditionally navigate their way to the Initial approach fix of Hato
International Airport via the Standard Arrival Route (STAR). This is so to facilitate the air
traffic controller and pilots’ job of safely navigating the aircraft to the airport. However it
may encompass additional fuel burn compared to the vector into final approach. For this
approach, the air traffic controller gives heading vectors to the pilots and vectors them into
position for either the downwind, base or final leg pattern of the airport. This may save fuel
as the airline may bypass the STAR that may cover additional nautical miles to the airport. It
does, however, increase the workload of the pilot and the air traffic controller.
During my data gathering, it was noted that KLM, when operating its midday arrival
flight using the Boeing 747-400, repeatedly uses vectors into final. TUI would also use
vectors into final if operating a non-stop route from Amsterdam to Curaçao. Air Berlin, the
other long-haul carrier that serves Curaçao would repeatedly use identical STAR approaches
when arriving into Curaçao. In the case of Air Berlin using the twin engine A330 on the
STAR approach, they spend 7 minutes in the approach phase from 3,000 feet to the runway,
burning 1,455 kilograms of fuel in the process. KLM, using the quadruple engine Boieng
747-400 and the vector into final procedure, would spend 4 minutes in the approach phase
from 3,000 feet to the runway, burning 1,079 kilograms of fuel. TUI, using the 787-800
42. AVIATION EMISSIONS IN CURACAO 42
would also spend 4 minutes in the approach phase from 3,000 feet to the runway. All airlines
enter the Curaçao FIR at the same waypoint, thus needing to cover the same distance to arrive
at Curaçao.
Only a few airlines may significantly benefit from the vector into final procedure,
largely airlines that have Curaçao FIR entry origins that do not closely align with focus
runway of Hato International, runway 11. The table below shows the airlines that strictly
adhere to the STARs and could greatly benefit from a vectored in approach in terms of
emissions reduced for the year 2015.
Airlines that strictly use
STARs
Benefit to vectored
approaches 2015
Air Berlin Reduction in CO2 of 108
tonnes
Avianca Reduction in CO2 of 78
tonnes
A total of 186 tonnes of CO2 could be saved by these airlines using vectored in
approaches, reducing airline emissions by 0.25%
Summary
The carbon dioxide emissions can be reduced by the methods detailed above.
However, the effect of the reduction is largely dependent on the waiving or increase of the
renewable energy power-plant generation limit that is currently imposed 1 MW. Under the
current regulations, the reduction measures can reduce carbon dioxide emissions by 3,901
tonnes, a decrease in carbon dioxide emissions of 4.67%. The reduction measures detailing
the electric GSE and POU terminals both do not produce emissions directly. They do
however produce off-airport emissions due to the airports own reliance on grid electricity. If
the airport is a 100% zero emission airport, meaning that the airports renewable energy
sources produce as much energy as the airport consumes, then the electric GSE and POU
terminals will also produce zero emissions. This would result in a reduction of CO2 emissions
by 8,261 tonnes, decreasing carbon dioxide emissions by 9.86%
43. AVIATION EMISSIONS IN CURACAO 43
Chapter 6: Conclusion
Summary of Results
The goal of my research was to answer two questions.
1. What is the CF of Curaçao ’s aviation sector?
2. What measures can be put in place to reduce the CF of Curaçao ’s aviation sector and
by how much?
What is the CF of Curaçao ’s aviation sector? In this thesis, the aviation sector in Curaçao
is defined to be emissions from commercial airline flights to and from Curaçao, GSE serving
these airlines and the airport. The total emission for the year 2014 was calculated to be
69,412 tonnes of CO2. This was comprised of Airline and GSE CO2 emissions totaling
63,857 tonnes (92%) and airport emissions totaling 5,556 tonnes (8%). In 2015, the CO2
emissions rose by 21.5% to 83,773 tonnes in response to increased passenger traffic and
airline movements. This was comprised of Airline and GSE CO2 emissions totaling 77,834
tonnes (93%) and airport CO2 emissions totaling 5,940 tonnes (7%).
The greatest contributor to the airline CF is InselAir, emitting 28,179 tonnes of CO2 in the
year 2014 and 33,606 tonnes of CO2 in the year 2015. As InselAir is the national flag carrier
of Curaçao, it also has the most flights daily, which is mostly what contributes to its high CF.
The second greatest contributor to the airline CF is KLM, emitting 13,043 tonnes of CO2 in
the year 2014 and 15,605 tonnes of CO2 in the year 2015.
What measures can be put in place to reduce the CF of Curaçao’s aviation sector and by
how much? The effectiveness of the measures described is mostly limited by the current
renewable energy generation limit. If the regulation is abolished or at least raised to a level
where Hato International Airport can be 100% self sufficient on renewable energy, then the
effectiveness of the measures could be raised significantly. If the feed-in tariff stays in effect
and all the recommended reduction measures are implemented, then Curaçao would save
3,801 tonnes of CO2 in aviation related emissions. This is a reduction of 4.67%, enabling
Curaçao to reduce its aviation carbon emissions by 2% for the first two years under the
current renewable energy regulations.
44. AVIATION EMISSIONS IN CURACAO 44
If the feed in tarrif was at least lifted to the recommended amount of 3.4 MW for solar
energy or 3.6 MW for wind energy, Hato International Airport would then be able to become
self sufficient on renewable energy. This would then save 8,261 tonnes of CO2 in aviation
related emissions. This is a reduction of 9.86%, providing room for Hato International to
grow in operations whilst keeping with the mandate of reduced emissions. With a reduction
of 2% every year for the next 4 years now possible, the hypothesis of the reduction of carbon
emissions by 2% per year towards 2020 is proven.
Recommendations Resulting from Research
Based on an analysis of chapter 4 and chapter 5, I have comprised 6
recommendations. They are ordered from highest to lowest by my perception of their
importance towards the reduction of Curaçao ’s aviation CF.
Recommendation 1: The installation of POU terminals.
In my research, APU emissions at the gate accounted for 2.73% of airline emissions.
The installation of POU terminals will reduce emissions by 2.21%. With the addition of
100% renewable airport electricity, gate emissions will be eliminated completely, reducing
airline emissions by 2.73%. In comparison to the other methods that I have detailed to be
implemented, POU terminals are fairly simple to install to the passenger boarding bridges’
existing architecture and depending on the equipment installed, can supply power to a wide
array of aircraft types.
Recommendation 2: The abolishment or raise in the limit regulation of the
feed-in tariff system.
Hato International Airport cannot become energy self-sustaining under the current 1
MW power generation limit. In my research, it was found that it would need more than 3
times that limited capacity in both wind and/or solar generation in order to generate enough
energy to supply the airport with 100% of its energy needs. The reduction in emissions will
also be amplified when coupled with POU terminals and electric ground support equipment,
rising from a 4.67% reduction in total emissions to a 9.86% reduction in total emissions.
45. AVIATION EMISSIONS IN CURACAO 45
Recommendation 3: The installation of wind turbines.
In reference to my research and considering Curaçao’s environmental conditions,
wind turbines are more advantageous than solar panels for the following reasons:
1. Two Vesta ‘V90-1.8’ totaling 3.6 MW would produce 1 ½ times the energy than a 3.4
MW solar energy plant. This is due to the constant average wind on Curaçao and that
the wind turbines would also produce power in the night as well, compared to the
solar turbines only producing power during the day. This would lessen the reliance on
the country’s grid electricity as a power bank and also provide room for growth
without the need to update or add more wind turbines for additional power.
2. The wind turbines would be located off-airport and would occupy less area than a
solar energy plant of similar capacity.
Recommendation 4: The upgrade of ground support equipment.
The current fleet of GSE has equipment that dates as far back as the 1980’s. Although
GSE emissions make up 0.30% of airline emissions, further increase in airline movements
will also result in an increase of GSE emissions. Updating the equipment with retrofits such
as turbochargers, catalytic converters and variable valve timing is the least expensive way of
reducing emissions. Conversely, ground support emissions could be reduced completely by
having electric GSE combined with a 100% electricity generation renewable energy power
plant.
Recommendation 5: Increased Vectors into Final Approaches.
Where possible, vectors into final can shave minutes from the approach phase, saving
hundreds of kilograms of fuel. This practice should be encouraged with safety as this
procedure places additional workload on the pilots and air traffic controllers.
46. AVIATION EMISSIONS IN CURACAO 46
Recommendation 6: MD-80 Drag Reduction Packages Installation.
Both PAWA and InselAir can benefit greatly from the installation of drag reduction
kits on their aircraft. This kit will not only provide a reduction in emissions but also a
reduction in operating costs for the airlines.
Contributions of Research
My research contributes to existing knowledge on both a practical and theoretical
level. On a practical level, I have provided the first detailed snapshot of airline and airport
generated emissions for Curaçao in terms of emission quantities for the years 2014 and 2015.
I have also provided practical measures that can be implemented to lower Curaçao’s CF. This
provides a baseline and guidance for future study and efforts to further reduce aviation GHG
in Curaçao.
At a theoretical level, I have developed a methodology for calculating an aviation CF
portrait. While my research was focused on Curaçao, the methodology can be used as a
template when conducting research in other jurisdictions and other geographical states.
Limitations of Research
The CF calculations in chapter 4 are subject to a number of limitations. First, the
ICAO EEDB engine values were not corrected for variations in temperature and pressure.
Secondly, there were also limitations in my research. The BN-2 Islander operated by
commuter airline DIVI DIVI is not included in this research as the Lycoming TIO-540 also is
not documented in the EEDB. The IFSET generalized specific airframes to fleet type and
then rounded fuel burn estimates to the nearest 100 kg. Finally, the documentation of Hato
International Airport’s electrical usage for 2015 was not complete as of writing. Therefore,
the 2015 energy consumption data had to be modeled from the existing delta between the
months documented in 2015 and the corresponding months in 2014.
Suggestions for further research
This research could be used as a template to further expand on emission calculations.
The emission data for the PW125 and PW127 equipped Fokker 50’s and Lycoming TIO-540
47. AVIATION EMISSIONS IN CURACAO 47
equipped Britten-Norman Islanders could be researched and the emissions for these aircraft
calculated. I would also incorporate the Boeing Fuel Flow Method 2 (BFFM2) into my LTO
calculations to account for the variance in temperature and pressure.
The final step for this research is to expand the emissions to the entirety of the
Curaçao FIR. This would include traffic from neighboring islands Aruba and Bonaire as well
as the traffic passing through the FIR. This would entail greatly expanded data gathering, but
the template I have provided allows for expansion of the geographic scale. Applying this
template to a global scale is possible, but would be extremely labor-intensive, time
consuming and costly.
Final Thoughts
Conducting this research illustrated very clearly the complexity of quantifying CO2
emissions for a state and adopting measures to reduce CO2 emissions. Aviation is an integral
part of everyday life in the 21st century and a vital part of the Curaçao n economy; it is also
controlled and influenced by a multitude of stakeholders. While there can be no debate that
the CF of aviation is an environmental problem that needs to be addressed, doing so requires
not only significant cooperation between the affected stakeholders but also more research,
both in the natural and social sciences, on how aviation affects the environment and how its
impact can be reduced.
With my research, I hope to have contributed to the knowledge and insight of
Curaçao’s aviation emissions and in doing so, translate this knowledge into positive action
and create change for the better. The technological developments in doing so are already
developed, with advancements occurring rapidly. The recommendations derived from my
analysis are designed to spur more action to reduce the carbon footprint of aviation.
48. AVIATION EMISSIONS IN CURACAO 48
Bibliography
Air Canada. (2012, 6 18). Air Canada to Conduct First Flight with Sustainable Biofuel.
Retrieved 6 23, 2016, from Air Canada:
http://aircanada.mediaroom.com/index.php?s=43&item=561
Airport Cooperative Research Programme. (2009). Guidebook On Preparing Airport
Greenhouse Gas Emission Inventories. Transportation Research Board. Washington: Federal
Aviation Administration.
Airport Cooporative Research Programme. (2012). Handbook for Evaluating Emissions and
Costs of APUs and Alternative Systems. Transportation Research Board. Washington: Federal
Aviation Administration.
Central Bureau of Statistics Curaçao. (n.d.). General Facts of Curaçao. Retrieved 10 6, 2015,
from Central Bureau of Statistics Curaçao Website: http://www.cbs.cw/website/general-facts-
curacao_3169/
Central Intelligence Agency. (n.d.). Factbook of Curaçao. Retrieved 10 6, 2015, from Central
Intelligence Agency: https://www.cia.gov/library/publications/the-world-
factbook/geos/cc.html
Climatemps. (2014). Sunshine and Daylight Hours in Willemstad, Curaçao. Retrieved 6 20,
2016, from Climatemps: http://www.curacao.climatemps.com/sunlight.php
Colombia Power Technologies. (n.d.). Why Wave Energy? (Albano Design) Retrieved 6 22,
2016, from Colombia Power Technologies: http://columbiapwr.com/why-wave-energy/
Curaçao Investment and Export Promotion Agency. (2015). Logistics Investment
Oppurtunities. (Green Media) Retrieved 6 18, 2016, from Curaçao Investments:
http://curinvest.com/investment-opportunities/logistics/
David Suzuki Foundation. (n.d.). Air Travel and Climate Change. (Erika Rathje) Retrieved 6
26, 2016, from David Suzuki Foundation: http://www.davidsuzuki.org/issues/climate-
change/science/climate-change-basics/air-travel-and-climate-change/
Font, V. (2015, 9 11). India’s Cochin International Airport Goes 100 Percent Solar.
Retrieved 6 20, 2016, from RenewableEnergyWorld.com:
49. AVIATION EMISSIONS IN CURACAO 49
http://www.renewableenergyworld.com/articles/2015/09/india-s-cochin-international-airport-
goes-100-percent-solar.html
Government of Aruba. (2015, 3 30). Aruba's Solar Park at The Airport is Launched.
Retrieved 6 20, 2016, from Prime Minister of Aruba:
http://www.pmoaruba.com/energy/arubas-solar-park-at-the-airport-is-launched/
ICAO Comittee on Aviation Environmental Protection. (2010). Report of The Independent
Experts On The Medium and Long Term Goals For Aviation Fuel Burn Reduction From
Technology. Doc 9963 . Montreal, Quebec, Canada: International Civil Aviation
Organization.
InselAir Airlines. (n.d.). About InselAir. (E-Sites) Retrieved 6 26, 2016, from InselAir:
https://www.fly-inselair.com/en/about-inselair/
International Civil Aviation Organization. (2011). Airport Air Quality Manual. DOC 9889
(1). Montreal, Quebec, Canada: International Civil Aviation Organization.
International Civil Aviation Organization. (2010). Aviation's Contribution to Climate
Change. Montreal: International Civil Aviation Organization.
International Civil Aviation Organization. (2013). Environmental Report. Environment
Branch. Montreal: International Civil Aviation Authority.
International Civil Aviation Organization. (2013). Flightpath to A Sustainable Future.
Montreal.
International Civil Aviation Organization. (2011). ICAO Review: Sustainable Alternative
Fuels for Aviation. Environment Branch. Montreal: International Civil Aviation
Organization.
International Civil Aviation Organization. (2014). Operational Oppurtunities to Reduce Fuel
Burn and Emissions. DOC 10013 (1). Montreal, Quebec, Canada.
La Palma Airport. (2009). 2009-2011 Environmental Management Report. Government of
Spain, Ministry of Development. Aena Aeropuertos.
50. AVIATION EMISSIONS IN CURACAO 50
Llorens, D. (2014, 2 23). Do Solar Panels Work In Cloudy Weather? Retrieved 6 20, 2016,
from Solar Power Rocks: https://solarpowerrocks.com/solar-basics/how-do-solar-panels-
work-in-cloudy-weather/
National Renewable Energy Labratory. (2015, 6). Energy Transition Initiative Islands. DOE /
GO-102015-4656 .
Super 98. (n.d.). MD-80 Product Overview. Retrieved 4 4, 2016, from Super 98:
http://www.super98.com/products_md80.htm
Vestas. (n.d.). V90-1.8/2.0 MW. Retrieved 6 22, 2016, from Vestas Wind Systems A/S:
https://www.vestas.com/en/products/turbines/v90-2_0_mw#!
Wind Finder. (n.d.). Wind and Weather Statistics Curacao Airport. Retrieved 6 22, 2016,
from WindFinder: https://www.windfinder.com/windstatistics/curacao
World Bank. (2013). Turn Down the Heat: Climate Extremes, Regional Impacts and the Case
for Resilience. Potsdam Institute, Climate Impact Research and Climate Analytics.
Wahington D.C.: World Bank.
56. AVIATION EMISSIONS IN CURACAO 56
APPENDIX 2: AIRLINE AND GSE CO2 EMISSIONS
Abbreviations
• CYUL / YUL: Pierre Elliot Trudeau International Airport, Montreal, Quebec, Canada
• CYYZ / YYZ: Lester B. Pearson International, Toronto, Ontario, Canada
• EDDL / DUS: Düsseldorf International Airport, Düsseldorf, North Rhine-Westphalia,
Germany
• EHAM / AMS: Amsterdam Schiphol Airport, Amsterdam, Netherlands
• KCLT / CLT: Charlotte Douglas International Airport, Charlotte, North Carolina,
United States
• KJFK / JFK: John F. Kennedy International Airport, Queens, New York, United
States
• KMIA / MIA: Miami International Airport, Miami, Florida, United States
• MDLR / LRM: La Romana International Airport, La Romana, Dominican Republic
• MDSD / SDQ: Las Americas International Airport, Santo Domingo, Dominican
Republic
• MKJP / KIN: Norman Manley International Airport, Kingston, Jamaica
• MUHA / HAV: José Martí International Airport, Havana, Cuba
• SKBO / BOG: El Dorado International Airport, Bogota, Colombia
• SKBQ / BAQ: Ernesto Cortissoz International Airport, Barranquilla, Atlántico
department, Columbia
• SKRG / MDE: José María Córdova International Airport, Medellin, Antioquia
department, Columbia
• SMJP / PBM: Johan Adolf Pengel International Airport, Paramaribo, Suriname
• SVBM / BRM: Jancinto Lara International Airport, Barquisimeto, Venezuela
• SVJC / LSP: Josefa Camejo International Airport, Paraguana, Venezuela
• SVMC / MAR: La Chinita International Airport, Maracaibo, Venezuela
• SVMI / CCS: Simón Bolívar International Airport, Caracas, Venezuela
• SVVA / VLN: Arturo Michelena International Airport, Valencia, Venezuela
• SYCJ / GEO: Cheddi Jagan International Airport, Georgetown, Guyana
• TNCA / AUA: Queen Beatrix International Airport, Oranjestad, Aruba
57. AVIATION EMISSIONS IN CURACAO 57
• TNCB / BON: Flamingo International Airport, Kralendijk, Bonaire
• TNCC / CUR: Hato International Airport, Willemstad, Curaçao
• TNCM / SXM: Princess Juliana International Airport, Sint Maarten
• TTPP / POS: Piarco International Airport, Port of Spain, Trinidad and Tobago