Vol 87 2010 The Monthly June.pdf - Central Statistical Office of Zambia
Vol 87 2010 The Monthly June.pdf - Central Statistical Office of Zambia
Vol 87 2010 The Monthly June.pdf - Central Statistical Office of Zambia

You also want an ePaper? Increase the reach of your titles
YUMPU automatically turns print PDFs into web optimized ePapers that Google loves.
Republic <strong>of</strong> <strong>Zambia</strong><br />
<strong>Vol</strong>ume <strong>87</strong> Website: www.zamstats.gov.zm <strong>June</strong>, <strong>2010</strong><br />
Foreword<br />
Welcome to the <strong>Monthly</strong> presentation organised by the<br />
Dissemination Branch <strong>of</strong> the <strong>Central</strong> <strong>Statistical</strong> <strong>Office</strong> (CSO). <strong>The</strong><br />
CSO embarks on vigorous information delivery strategy to major<br />
stakeholders and the media institutions in order to increase<br />
utilisation <strong>of</strong> statistical products and services. <strong>The</strong> <strong>of</strong>fice produces<br />
a number <strong>of</strong> statistical products in the Economic, Social,<br />
Agricultural and Environmental areas. <strong>The</strong> information collected in<br />
these areas may be used for various purposes including policy<br />
formulation, planning, implementation, monitoring and evaluation<br />
<strong>of</strong> programmes and projects.<br />
This <strong>Monthly</strong> publication is an attempt to provide highlights <strong>of</strong><br />
CSO’s work and how it can help media institutions and the<br />
general public to make use <strong>of</strong> data and information for<br />
sustainable national development and decision-making.<br />
I would like to urge our readers and users <strong>of</strong> statistical information<br />
to send to us any comments that may enhance statistical<br />
production and contribute to the improvement <strong>of</strong> this bulletin.<br />
Ms. Efreda Chulu<br />
Director <strong>of</strong> Census and Statistics<br />
1 st July, <strong>2010</strong><br />
<strong>The</strong><br />
<strong>Monthly</strong><br />
<strong>Central</strong> <strong>Statistical</strong> <strong>Office</strong><br />
Inside this<br />
Issue<br />
• Inflation declines to 7.8<br />
percent in <strong>June</strong> <strong>2010</strong><br />
from 9.1 percent in<br />
May <strong>2010</strong><br />
• May <strong>2010</strong> records<br />
Trade Surplus<br />
• Economy grows by 6.4<br />
percent in 2009<br />
• Industrial Output<br />
increases in 2009<br />
• Formal Sector<br />
Employment reduces in<br />
2008<br />
• Knowledge on<br />
HIV/AIDS medication<br />
increases<br />
• Census scheduled for<br />
October <strong>2010</strong><br />
• Selected Socio-<br />
Economic Indicators<br />
<strong>Central</strong> <strong>Statistical</strong> <strong>Office</strong>, Nationalist Road, P.O. Box 31908, Lusaka ● Telefax: 260-1-253468 ● E-mail: info@zamstats.gov.zm
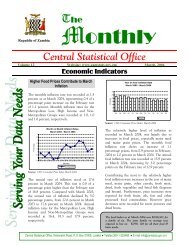
INFLATION<br />
Inflation declines to 7.8 percent in <strong>June</strong> <strong>2010</strong> from 9.1 percent in<br />
May <strong>2010</strong><br />
<strong>The</strong> annual rate <strong>of</strong> inflation, as measured<br />
by the all items Consumer Price Index<br />
(CPI), reduced to 7.8 percent in <strong>June</strong><br />
<strong>2010</strong> from 9.1 percent in May, <strong>2010</strong>. <strong>The</strong><br />
decline is attributed to the decrease in<br />
some food prices such as mealie meal,<br />
maize grain, fresh vegetables and dried<br />
kapenta.<br />
Annual Inflation Rate<br />
<strong>June</strong> 2009- <strong>June</strong> <strong>2010</strong><br />
16<br />
14<br />
12<br />
(Percentage)<br />
10<br />
8<br />
6<br />
4<br />
2<br />
0<br />
Jun Jul Aug Sept Oct Nov Dec Jan Feb Mar Apr May Jun<br />
Composite<br />
Changes in annual inflation rates for CPI Main Groups<br />
Between May <strong>2010</strong> and <strong>June</strong> <strong>2010</strong>,<br />
annual inflation rates declined for food,<br />
beverages and tobacco; clothing and<br />
footwear; furniture and household goods;<br />
medical care, recreation and education;<br />
and other goods and services. <strong>The</strong><br />
annual inflation rates increased for rent,<br />
fuel and lighting; and transport and<br />
communication.<br />
2
Annual Inflation Rate: CPI Main Groups - Percent<br />
Total<br />
Food<br />
And<br />
Beverages<br />
Clothing<br />
And<br />
Footwear<br />
Rent<br />
Fuel<br />
&<br />
Lighting<br />
Furniture<br />
and<br />
Household<br />
Goods<br />
Medical<br />
care<br />
Transport<br />
and<br />
comms<br />
Recreation<br />
And<br />
Education<br />
Other<br />
Goods<br />
And<br />
Services<br />
Jan 07 – Jan 06 9.8 1.0 34.9 15.1 16.5 24.9 22.8 15.9 11.4<br />
Feb 07 – Feb 06 12.6 4.2 28.3 18.3 20.4 23.7 33.9 15.0 10.4<br />
Mar 07 – Mar 06 12.7 4.9 26.9 15.8 21.6 22.1 33.5 14.9 11.0<br />
Apr 07 – Apr 06 12.4 5.5 23.7 15.7 20.0 18.8 32.4 14.8 7.7<br />
May 07 – May 06 11.8 5.7 18.8 17.1 19.2 16.5 28.2 10.4 7.0<br />
Jun 07 – <strong>June</strong> 06 11.1 4.8 20.3 18.1 18.1 14.9 24.6 10.6 7.0<br />
Jul 07 –July 06 11.2 6.7 19.4 14.9 17.4 14.0 18.2 10.0 7.7<br />
Aug 07- Aug 06 10.7 7.9 19.6 11.6 15.2 11.6 11.8 10.0 7.5<br />
Sep 07 – Sep 06 9.3 6.2 17.9 11.2 15.5 11.4 9.7 8.1 7.7<br />
Oct 07 – Oct 06 9.0 5.6 14.7 11.8 16.8 10.9 10.3 7.4 6.3<br />
Nov 07 – Nov 06 8.7 5.2 16.3 10.7 15.8 10.2 11.6 7.1 6.7<br />
Dec 07 – Dec 06 8.9 5.9 14.2 11.2 13.4 9.1 13.6 8.2 6.9<br />
Jan 08 – Jan 07 9.3 6.9 12.5 13.4 17.1 8.4 7.7 6.8 7.0<br />
Feb 08 – Feb 07 9.5 9.1 11.1 12.5 16.0 8.9 0.3 9.0 8.4<br />
Mar 08 – Mar 07 9.8 9.1 11.2 12.2 16.1 10.0 1.1 10.3 9.4<br />
Apr 08 – Apr 07 10.1 9.8 11.1 12.7 16.3 12.2 -0.2 11.1 9.4<br />
May 08 – May 07 10.9 11.7 10.5 12.0 14.9 12.4 0.5 11.4 9.5<br />
Jun 08 – <strong>June</strong> 07 12.1 15.6 9.7 11.4 13.4 12.2 -3.5 10.6 10.4<br />
Jul 08 – Jul 0 7 12.6 14.2 9.3 14.9 14.2 13.9 4.7 11.0 11.3<br />
Aug 08- Aug 07 13.2 16.3 6.3 14.5 13.3 12.9 5.3 11.2 10.7<br />
Sep 08– Sep 07 14.2 16.2 5.6 17.7 14.8 11.8 11.5 11.5 10.4<br />
Oct 08 – Oct 07 15.2 17.6 4.6 14.9 15.1 11.3 19.2 11.6 12.1<br />
Nov 08 – Nov 07 15.3 18.5 2.7 14.5 16.1 10.3 16.4 12.4 12.5<br />
Dec 08 – Dec 07 16.6 20.5 2.5 15.2 18.0 9.9 15.9 12.1 13.2<br />
Jan 09 – Jan 08 16.0 21.3 3.0 8.9 13.8 9.2 18.3 11.7 15.2<br />
Feb 09 – Feb 08 14.0 16.3 3.9 8.6 16.5 9.6 19.4 9.3 15.4<br />
Mar 09 – Mar 08 13.1 13.9 5.9 10.4 16.3 10.1 19.7 7.9 15.2<br />
Apr 09 – Apr 08 14.3 15.9 6.8 10.4 16.1 8.2 22.0 7.1 17.1<br />
May 09 – May 08 14.7 16.1 7.9 10.7 21.2 8.0 16.6 6.0 20.0<br />
Jun 09 – <strong>June</strong> 08 14.4 14.1 9.6 10.1 22.4 10.0 21.0 6.9 22.6<br />
Jul 09 – Jul 08 14.0 14.9 9.9 7.9 22.1 10.2 13.0 8.9 21.6<br />
Aug 09- Aug 08 14.3 14.6 11.4 11.7 21.7 10.3 10.4 10.1 20.6<br />
Sep 09– Sep 08 13.0 13.9 13.6 9.9 21.4 13.3 1.3 9.7 20.5<br />
Oct 09 – Oct 08 12.3 12.3 15.0 11.7 19.4 14.9 -3.2 12.0 24.7<br />
Nov 09 – Nov 08 11.5 11.1 15.0 11.2 19.1 14.4 -3.1 11.0 23.6<br />
Dec 09 – Dec 08 9.9 8.0 15.8 11.4 17.6 15.9 -3.4 10.6 26.0<br />
Jan 10 – Jan 09 9.6 7.1 15.7 14.7 16.4 15.8 -4.0 10.5 23.0<br />
Feb 10 – Feb 09 9.8 8.2 14.7 13.3 14.3 15.7 -1.1 9.9 21.1<br />
Mar 10 – Mar 09 10.2 9.3 11.4 12.9 14.1 15.0 1.6 9.9 19.7<br />
Apr 10 – Apr 09 9.2 7.3 11.4 14.4 13.0 15.0 1.6 9.8 20.2<br />
May 10 – May 09 9.1 6.5 10.5 12.4 12.3 15.3 9.9 11.2 16.8<br />
Jun 10 – <strong>June</strong> 09 7.8 3.8 9.9 15.7 10.1 14.4 11.1 10.8 12.8<br />
3
Contributions <strong>of</strong> different Items to overall inflation<br />
Of the total 7.8 percent annual inflation<br />
in <strong>June</strong> <strong>2010</strong>, food products in the<br />
Consumer Price Index (CPI) accounted<br />
for 1.9 percentage points, while non-food<br />
products accounted for 5.9 percentage<br />
points.<br />
Items<br />
Percentage Points Contributions <strong>of</strong> different items to overall inflation<br />
Jun-09 Jul-09 Aug-09 Sep-09 Oct-09 Nov-09 Dec-09 Jan-10 Feb-10 Mar-10 Apr-10 May-10 Jun-10<br />
Food Beverages and 7 7.3 7.2 6.8 6 5.5 4 3.6 4.1 4.6 3.6 3.2 1.9<br />
Tobacco<br />
Clothing and<br />
0.9 0.9 1 1.2 1.4 1.3 1.3 1.4 1.3 1 1.0 0.9 0.9<br />
Footwear<br />
Rent and household 1.1 0.9 1.3 1.1 1.3 1.3 1.3 1.6 1.5 1.4 1.6 1.4 1.7<br />
energy<br />
Furniture and<br />
2.5 2.5 2.5 2.4 2.2 2.2 2 1.8 1.7 1.6 1.5 1.5 1.2<br />
Household Goods<br />
Medical Care 0.1 0.1 0.1 0.1 0.1 0.1 0.1 0.1 0.1 0.2 0.1 0.2 0.1<br />
Transport (fuel,<br />
1.6 1.1 0.9 0.1 -0.2 -0.3 -0.3 -0.3 -0.1 0.1 0.2 0.7 0.9<br />
airfares, new motor<br />
vehicles)<br />
Recreation and<br />
0.5 0.5 0.7 0.7 0.8 0.7 0.7 0.7 0.6 0.6 0.6 0.7 0.7<br />
Education<br />
Other Goods and 0.7 0.7 0.6 0.6 0.7 0.7 0.8 0.7 0.6 0.7 0.6 0.5 0.4<br />
Services<br />
All Items 14.4 14 14.3 13 12.3 11.5 9.9 9.6 9.8 10.2 9.2 9.1 7.8<br />
<strong>The</strong> annual food inflation rate<br />
<strong>The</strong> annual food inflation rate was recorded at 3.8 percent in <strong>June</strong> <strong>2010</strong>. This is a decline<br />
from 6.5 percent in May <strong>2010</strong>.<br />
Non-food inflation<br />
<strong>The</strong> annual non-food inflation rate was recorded at 11.8 percent in <strong>June</strong> <strong>2010</strong>. This is an<br />
increase from 11.6 percent in May <strong>2010</strong>.<br />
Annual Inflation Rates: Food and Non food<br />
Period Total Food Non-Food<br />
Jan 06 – Jan 05 12.2 12.8 11.5<br />
Feb 06 - Feb 05 10.3 10.2 10.3<br />
Mar 06 - Mar 05 10.7 10.9 10.4<br />
Apr 06 – Apr 05 9.4 8.3 10.6<br />
May 06 – May 05 8.6 5.6 12.0<br />
Jun 06 - Jun 05 8.5 5.4 11.8<br />
Jul 06 - Jul 05 8.7 4.3 13.6<br />
Aug 06 – Aug 05 8.0 0.4 16,4<br />
Sep 06 – Sep 05 8.2 1.5 15.7<br />
Oct 06 - Oct 05 7.9 1.0 15.4<br />
Nov 06 - Nov 05 8.1 0.8 16.2<br />
Dec06 – Dec 05 8.2 -0.2 18.1<br />
Jan 07 - Jan 06 9.8 1.0 20.0<br />
Feb 07 - Feb 06 12.6 4.2 22.1<br />
Mar 07 - Mar 06 12.7 4.9 21.5<br />
Apr 07 – Apr 06 12.4 5.5 20.1<br />
May 07 – May 06 11.8 5.7 18.2<br />
Jun 07 - Jun 06 11.1 4.8 17.7<br />
Jul 07- Jul 06 11.2 6.7 15.6<br />
4
Period Total Food Non-Food<br />
Aug 07– Aug 06 10.7 7.9 13.3<br />
Sep 07 – Sep 06 9.3 6.2 12.4<br />
Oct 07- Oct 06 9.0 5.6 12.2<br />
Nov 07- Nov 06 8.7 5.2 12.2<br />
Dec07 – Dec 06 8.9 5.9 11.9<br />
Jan 08 - Jan 07 9.3 6.9 11.7<br />
Feb 08 - Feb 07 9.5 9.1 10.0<br />
Mar 08 - Mar 07 9.8 9.1 10.4<br />
Apr 08– Apr 07 10.1 9.8 10.5<br />
May 08 – May 07 10.9 11.7 10.1<br />
Jun 08 - Jun 07 12.1 15.6 8.8<br />
Jul 08- Jul 07 12.6 14.2 11.2<br />
Aug 08– Aug 07 13.2 16.3 10.4<br />
Sep 08 – Sep 07 14.2 16.2 12.4<br />
Oct 08- Oct 07 15.2 17.6 13.0<br />
Nov 08- Nov 07 15.3 18.5 12.4<br />
Dec 08 – Dec 07 16.6 20.5 12.9<br />
Jan 09 - Jan 08 16.0 21.3 11.1<br />
Feb 08 - Feb 07 14.0 16.3 11.7<br />
Mar 09 - Mar 08 13.1 13.9 12.3<br />
Apr 09– Apr 08 14.3 15.9 12.7<br />
May 09 – May 08 14.7 16.1 13.3<br />
Jun 09 - Jun 08 14.4 14.1 14.7<br />
Jul 09- Jul 08 14.0 14.9 13.1<br />
Aug 09– Aug 08 14.3 14.6 13.9<br />
Sep 09 – Sep 08 13.0 13.9 12.1<br />
Oct 09- Oct 08 12.3 12.3 12.3<br />
Nov 09- Nov 08 11.5 11.1 11.9<br />
Dec 09 – Dec 08 9.9 8.0 11.8<br />
Jan 10 – Jan 09 9.6 7.1 12.0<br />
Feb 10 – Feb 09 9.8 8.2 11.3<br />
Mar 10 - Mar 09 10.2 9.3 11.0<br />
Apr 10– Apr 09 9.2 7.3 11.2<br />
May 10 – May 09 9.1 6.5 11.6<br />
Jun 10 - Jun 09 7.8 3.8 11.8<br />
National Average Prices <strong>of</strong> Selected Products<br />
A comparison <strong>of</strong> retail prices between<br />
May <strong>2010</strong> and <strong>June</strong> <strong>2010</strong>, shows that the<br />
national average price <strong>of</strong> a 25 kg bag <strong>of</strong><br />
white roller meal reduced by 13.6<br />
percent, from K46,459 to K40,161. <strong>The</strong><br />
average price <strong>of</strong> a 20 litre tin <strong>of</strong> maize<br />
grain also reduced by 4.4 percent, from<br />
K20,473 to K19,570.<br />
<strong>The</strong> national average price <strong>of</strong> 1kg<br />
tomatoes reduced by 8.2 percent, from<br />
K3,806 in May <strong>2010</strong> to K3,493 in <strong>June</strong><br />
<strong>2010</strong>. <strong>The</strong> national average price <strong>of</strong> 1kg<br />
<strong>of</strong> dried kapenta (Siavonga) also<br />
`reduced by 5.9 percent, from K53,<strong>87</strong>4 to<br />
K50,710.<br />
5
National Average Prices for selected Products and Months<br />
Percentage<br />
<strong>2010</strong><br />
Product Description<br />
Changes<br />
January February March April May <strong>June</strong> Jun-10/May-10<br />
White breakfast 25Kg 62,183 62,642 62,868 62,845 61,945 59,959 -3.2<br />
White Roller 25Kg 49,554 49,934 49,194 48,940 46,459 40,161 -13.6<br />
White Maize 20 litre tin 26,247 27,454 27,792 23,<strong>87</strong>1 20,473 19,570 -4.4<br />
Rice Local 1 Kg 7,373 7,414 7,677 7,666 7,790 7,770 -0.3<br />
Rice Imported 1 Kg 37,531 31,468 31,801 31,519 28,739 27,801 -3.3<br />
Wheat Plain Flour (NMC) 2.5 Kg 17,292 17,344 17,357 17,080 17,763 17,275 -2.7<br />
Millet 5 litre tin 10,974 11,278 13,499 13,544 13,573 13,193 -2.8<br />
Sorghum 5 litre tin 8,343 8,840 12,381 12,373 13,114 13,106 -0.1<br />
Fillet Steak 1 Kg 29,427 29,997 29,856 29,661 30,065 29,796 -0.9<br />
Mixed Cut 1 Kg 18,986 18,690 18,506 19,085 19,127 18,953 -0.9<br />
T-bone 1 Kg 26,161 25,847 24,719 24,972 25,401 25,337 -0.3<br />
Beef Sausages 1 Kg 24,393 23,772 24,395 25,220 25,390 24,777 -2.4<br />
Pork Sausages 1 Kg 28,133 28,362 28,582 30,076 29,513 29,389 -0.4<br />
Dressed chicken 1 Kg 17,279 17,252 17,550 18,094 17,322 17,649 1.9<br />
Mutton 1 Kg 34,731 33,628 32,269 32,378 32,200 30,674 -4.7<br />
Dried Kapenta Mpulungu 1Kg 54,382 56,196 56,324 59,356 58,929 55,824 -5.3<br />
Dried Kapenta Siavonga 1Kg 47,761 48,125 54,013 51,982 53,<strong>87</strong>4 50,710 -5.9<br />
Cabbage 1kg 1,575 1,615 1,597 1,912 1,820 1,760 -3.3<br />
Onion 1kg 4,976 5,231 5,649 6,222 6,928 6,589 -4.9<br />
Carrots 1kg 5,182 5,061 5,531 6,165 6,350 4,926 -22.4<br />
Green beans 1kg 6,733 6,451 6,555 6,814 6,849 6,329 -7.6<br />
Tomatoes 1kg 2,976 3,427 4,293 4,011 3,806 3,493 -8.2<br />
Peas 1kg 7,197 7,197 5,453 5,453 6,937 3,972 -42.7<br />
Chinese cabbage 1kg 2,177 2,076 2,312 2,383 2,371 2,314 -2.4<br />
Rape 1kg 2,606 2,801 2,829 2,683 2,916 2,804 -3.8<br />
Dried beans 1kg 8,883 8,985 9,103 8,704 8,768 8,606 -1.8<br />
Shelled groundnut 1kg 7,679 7,<strong>87</strong>7 8,158 8,094 7,604 7,100 -6.6<br />
Sweet potatoes 1kg 2,892 2,521 2,345 1,438 1,342 1,231 -8.3<br />
Paraffin 1 litre 4,460 4,621 4,635 4,635 4,635 5,266 13.6<br />
Petrol Premium 1 litre 6,098 6,985 6,989 6,989 6,989 7,881 12.8<br />
Diesel 1 litre 5,773 6,601 6,603 6,603 6,603 7,207 9.1<br />
Air fare Lusaka/London<br />
British Airways 1 Way<br />
6,001,900 6,129,600 6,129,600 6,129,600 6,380,000 6,744,400 5.7<br />
Air Fare Lusaka/Ndola<br />
Zambezi Airways 1 way<br />
575,000 5<strong>87</strong>,500 600,000 600,000 650,000 650,000 0.0<br />
Bed & continental Breakfast<br />
3 to 5 star hotel<br />
631,423 576,938 590,050 582,225 604,885 616,688 2.0<br />
Bed & Continental Breakfast<br />
2 star Down to motel<br />
139,614 137,091 140,141 140,774 141,264 132,867 -5.9<br />
6
INTERNATIONAL MERCHANDIZE<br />
TRADE<br />
May <strong>2010</strong> Records Trade Surplus<br />
<strong>Zambia</strong> recorded a Trade surplus valued at K 762.9 Billion in May <strong>2010</strong>. This means that the<br />
country exported more in May <strong>2010</strong> than it imported in value terms.<br />
Total Exports (fob) and Imports (cif), January <strong>2010</strong> to May <strong>2010</strong>* (K’ Millions)<br />
Months<br />
Imports(cif)<br />
Domestic<br />
Total<br />
Trade<br />
Re-Exports(fob)<br />
Exports(fob)<br />
Exports(fob) Balance<br />
January® 1,765,443 2,126,<strong>87</strong>5 86,773 2,213,649 448,206<br />
February® 1,868,729 2,301,675 83,337 2,385,012 516,283<br />
March® 2,119,079 3,140,924 122,582 3,263,506 1,144,427<br />
Quarter 1 5,753,251 7,569,474 292,692 7,862,167 2,108,916<br />
April® 2,065,995 3,086,584 113,751 3,200,335 1,134,340<br />
May* 2,170,695 2,808,594 124,968 2,933,562 762,866<br />
Total <strong>2010</strong>: 9,989,941 13,464,652 531,411 13,996,064 4,006,122<br />
Source: CSO, International Trade Statistics, <strong>2010</strong><br />
Note: (*) Provisional<br />
(®) Revised<br />
<strong>The</strong>se Trade Data are Compiled Based on the General Trade System<br />
Total Exports (fob), Imports (cif) and Trade Balance, January <strong>2010</strong> – May <strong>2010</strong>, K’ Millions<br />
3,500,000<br />
3,000,000<br />
2,500,000<br />
2,000,000<br />
1,500,000<br />
1,000,000<br />
500,000<br />
0<br />
Jan-10<br />
Feb-10<br />
Mar-10<br />
Apr-10<br />
May-10<br />
Imports (cif) Total Exports (fob) Trade Balance<br />
Source: CSO, International Trade Statistics, <strong>2010</strong><br />
7
YEAR<br />
Total Exports (fob) and Imports (cif) (2000-2009) in K’ Billions<br />
Domestic<br />
Exports (fob)<br />
Re - Exports<br />
(fob)<br />
Total Exports<br />
(fob)<br />
Imports (cif)<br />
Trade Balance<br />
(Export less<br />
Imports)<br />
2000 2,680 36 2,717 2,752 (35)<br />
2001 3,523 14 3,537 3,900 (363)<br />
2002 4,046 24 4,070 4,733 (663)<br />
2003 4,614 28 4,642 7,440 (2,798)<br />
2004 7,460 66 7,526 10,279 (2,753)<br />
2005 9,565 48 9,613 11,467 (1,854)<br />
2006 13,388 23 13,411 11,050 2,361<br />
2007 18,301 98 18,399 15,945 2,454<br />
2008 17,951 702 18,653 18,476 124<br />
2009 20,312 1,052 21,365 18,941 2,424<br />
Source: CSO, International Trade Statistics, <strong>2010</strong><br />
Exports by major product categories May <strong>2010</strong> and April <strong>2010</strong><br />
<strong>Zambia</strong>’s major export products in May<br />
<strong>2010</strong> were from the intermediate goods<br />
category accounting for 80.5 percent<br />
comprising mainly copper cathodes &<br />
sections <strong>of</strong> refined copper and copper<br />
blister. <strong>The</strong> Raw materials category was<br />
second with 8.4 percent comprising<br />
mainly cobalt ores & concentrates; and<br />
copper ores & concentrates. Other<br />
exports were consumer goods and<br />
capital goods which collectively<br />
accounting for 11.1 percent <strong>of</strong> total<br />
exports for May <strong>2010</strong>.<br />
Product Category<br />
Exports by major product categories May <strong>2010</strong> and April <strong>2010</strong>, K’Millions<br />
May-10*<br />
Apr-10®<br />
Value (K'million) % Share Value (K’million) % Share<br />
Consumer goods 238,377 8.1 116,819 3.7<br />
Raw materials 244,971 8.4 581,678 18.2<br />
Intermediate goods 2,360,973 80.5 2,459,916 76.9<br />
Capital goods 89,240 3.0 41,922 1.3<br />
Total: 2,933,562 100.0 3,200,335 100.0<br />
Source: CSO, International Trade Statistics, <strong>2010</strong><br />
Note: (*) Provisional (R) Revised figures<br />
8
Total Exports (fob) by Product Categories, May <strong>2010</strong> and April <strong>2010</strong> in K’Millions<br />
Apr-10<br />
May*-10®<br />
0 500,000 1,000,000 1,500,000 2,000,000 2,500,000 3,000,000<br />
Source: CSO, International Trade Statistics, <strong>2010</strong><br />
Note: (*) Provisional (R) Revised figures<br />
Consumer goods Raw materials Intermediate goods Capital goods<br />
<strong>Zambia</strong>’s Metal Exports and Non-Traditional Exports (NTEs) May<br />
<strong>2010</strong> and April <strong>2010</strong><br />
<strong>The</strong>re has been a reduction in the total<br />
value <strong>of</strong> exports between May and April<br />
<strong>2010</strong>. <strong>The</strong> country’s ever dominant metal<br />
products recorded a lower value in<br />
revenue growth <strong>of</strong> -8.3 percent in<br />
nominal terms, between May and April<br />
<strong>2010</strong>. <strong>The</strong> overall contribution <strong>of</strong> metal<br />
products to the total exports earnings<br />
was 78.0 and 88.0 percent in May and<br />
April <strong>2010</strong>, respectively.<br />
In terms <strong>of</strong> percentage contribution to<br />
the total export earnings, NTEs recorded<br />
22.0 and 12.0 percent in May and April<br />
<strong>2010</strong>, respectively.<br />
<strong>Zambia</strong>’s Metal Exports and Non-Traditional Exports (NTEs) May <strong>2010</strong> and April <strong>2010</strong>,<br />
K’ Million<br />
GROUP<br />
May-10*<br />
Value<br />
(K'Million)<br />
%<br />
Share<br />
Apr-10®<br />
Value<br />
(K'Million)<br />
%<br />
Share<br />
Traditional Exports (mainly Metals) 2,2<strong>87</strong>,085 78.0 2,815,492 88.0<br />
Non-Traditional Exports 646,477 22.0 384,843 12.0<br />
Total Exports 2,933,562 100.0 3,200,335 100.0<br />
Source: CSO, International Trade Statistics, <strong>2010</strong><br />
Note: (*) Provisional (R) Revised figures<br />
9
<strong>Zambia</strong>’s Metal Exports and Non-Traditional Exports (NTEs) May <strong>2010</strong> and April <strong>2010</strong>,<br />
K’Million<br />
May*-10<br />
646,477<br />
2,2<strong>87</strong>,085<br />
2,933,562<br />
Apr-10®<br />
384,843<br />
2,815,492<br />
3,200,335<br />
0 500,000 1,000,000 1,500,000 2,000,000 2,500,000 3,000,000 3,500,000<br />
Source: CSO, International Trade Statistics, <strong>2010</strong><br />
Note: (*) Provisional (R) Revised figures<br />
Metal NTEs Total Exports<br />
Traditional Exports (fob) versus Non-Traditional Exports, (2000-2009), in K’Billions<br />
YEAR<br />
Traditional<br />
Exports<br />
Non-Traditional<br />
Exports<br />
Total Exports<br />
(fob)<br />
% Share<br />
Non-Traditional<br />
Exports<br />
2000 1,948 769 2,717 28.3<br />
2001 2,380 1,157 3,537 32.7<br />
2002 2,628 1,442 4,070 35.4<br />
2003 2,958 1,684 4,642 36.3<br />
2004 4,412 3,114 7,526 41.4<br />
2005 6,734 2,<strong>87</strong>9 9,613 29.9<br />
2006 10,749 2,662 13,411 19.8<br />
2007 14,572 3,827 18,399 20.8<br />
2008 15,231 3,422 18,653 18.3<br />
2009 16,519 4,846 21,365 22.7<br />
Source: CSO, International Trade Statistics, <strong>2010</strong><br />
10
Traditional Exports (fob) versus Non-Traditional Exports, (2000-2009), in K’ Billions<br />
25,000<br />
20,000<br />
K 'billions<br />
15,000<br />
10,000<br />
5,000<br />
0<br />
2000 2001 2002 2003 2004 2005 2006 2007 2008 2009<br />
T otal E xports 2,717 3,537 4,070 4,642 7,526 9,613 13,41 18,39 18,65 21,36<br />
T raditional E xports 1,948 2,380 2,628 2,958 4,412 6,734 10,74 14,57 15,23 16,51<br />
NT E s 769 1,157 1,442 1,684 3,114 2,<strong>87</strong>9 2,662 3,827 3,422 4,846<br />
Source: CSO, International Trade Statistics, <strong>2010</strong><br />
Traditional Exports versus non Traditional exports (2000-2009) in Millions <strong>of</strong> US Dollar<br />
YEAR Traditional Exports Non-Traditional Exports Total Exports % Share <strong>of</strong> NTEs<br />
2000 623 246 869 28.3<br />
2001 659 320 979 32.7<br />
2002 610 324 944 34.3<br />
2003 624 355 979 36.3<br />
2004 925 653 1,577 41.4<br />
2005 1,525 652 2,177 29.9<br />
2006 2,951 731 3,682 19.9<br />
2007 3,660 958 4,617 20.7<br />
2008 4,164 935 5,099 18.3<br />
2009 3,265 976 4,241 23.0<br />
Source: CSO, International Trade Statistics, <strong>2010</strong><br />
Traditional Exports versus Non-Traditional Exports (2000-2009) in Millions <strong>of</strong> US Dollar<br />
YEAR Traditional Exports % Growth Non-Traditional Exports % Growth Total Exports % Growth<br />
2000 1,948 769 2,717<br />
2001 2,380 22.2 1,157 50.5 3,537 30.2<br />
2002 2,628 10.4 1,442 24.6 4,070 15.1<br />
2003 2,958 12.6 1,684 16.8 4,642 14.1<br />
2004 4,412 49.2 3,114 84.9 7,526 62.1<br />
2005 6,734 52.6 2,<strong>87</strong>9 (7.6) 9,613 27.7<br />
2006 10,749 59.6 2,662 (7.5) 13,411 39.5<br />
2007 14,572 35.6 3,827 43.8 18,399 37.2<br />
2008 15,231 4.5 3,422 (10.6) 18,653 1.4<br />
2009 16,519 8.5 4,846 41.6 21,365 14.5<br />
Source: CSO, International Trade Statistics, <strong>2010</strong><br />
NOTE: GROWTH RATES ARE IN NOMINAL TERMS<br />
11
<strong>Zambia</strong>’s Major Exports Classified by Harmonized Coding System<br />
(HS), May <strong>2010</strong><br />
<strong>Zambia</strong>’s major export products in May<br />
<strong>2010</strong> were copper related including<br />
copper and articles there<strong>of</strong>; and ores, slag<br />
& ash collectively accounting for 80.2<br />
percent <strong>of</strong> total export earnings. Other<br />
export products were, other base metals;<br />
cermets and articles there<strong>of</strong> (2.7 percent);<br />
Boilers, machinery & mechanical<br />
appliances (2.5 percent); and Edible fruit<br />
and nuts (2.4 percent). <strong>The</strong>se five product<br />
categories collectively accounted for <strong>87</strong>.8<br />
percent <strong>of</strong> <strong>Zambia</strong>’s total export earnings<br />
for May <strong>2010</strong>.<br />
<strong>Zambia</strong>’s Major Exports by HS Chapter for May <strong>2010</strong>* (K’ Millions)<br />
May – <strong>2010</strong>*<br />
Chapter<br />
Description<br />
Value % Share<br />
74 Copper and articles there<strong>of</strong> 2,184,405 74.5<br />
26 Ores, slag and ash 168,364 5.7<br />
Cobalt ores and concentrates 62,815 37.3<br />
Copper ores and concentrates 38,570 22.9<br />
Precious metal ores and concentrates (excl. silver 30,734 18.3<br />
Nickel ores and concentrates 18,924 11.2<br />
Manganese ores/concentrates(inc.ferruginous), with 12,154 7.2<br />
81 Other base metals; cermets; articles there<strong>of</strong> 80,481 2.7<br />
84 Boilers, mchy & mech appliance; parts 73,161 2.5<br />
08 Edible fruit and nuts; peel <strong>of</strong> citrus fruit or melons 71,064 2.4<br />
17 Sugars and sugar confectionery 50,654 1.7<br />
24 Tobacco and manufactured tobacco substitutes 49,037 1.7<br />
71 Natural/cultured pearls, prec stones & metals, coin etc 37,713 1.3<br />
25 Salt; sulphur; earth & ston; plastering mat; lime & cem 25,933 0.9<br />
85 Electrical mchy equip parts there<strong>of</strong>; sound recorder etc 21,716 0.7<br />
Other Chapters 171,033 5.8<br />
Total 2,933,562 100.0<br />
Source: CSO, International Trade Statistics, <strong>2010</strong><br />
Note: (*) Provisional<br />
<strong>Zambia</strong>’s Major Export Destinations by Product in May <strong>2010</strong><br />
<strong>The</strong> five major destinations <strong>of</strong> <strong>Zambia</strong>’s<br />
exports in May <strong>2010</strong> were Switzerland<br />
(51.3 percent), China (16.3 percent),<br />
South Africa (12.7 percent), Democratic<br />
Republic <strong>of</strong> Congo (6.6 percent) and<br />
United Arab Emirates (3.6 percent).<br />
<strong>The</strong>se five countries collectively<br />
accounted for 90.4 percent <strong>of</strong> <strong>Zambia</strong>’s<br />
total export earnings.<br />
<strong>Zambia</strong>’s major export destination was<br />
Switzerland accounting for 51.3 percent.<br />
<strong>The</strong> major export products to Switzerland<br />
were, Cathodes & sections <strong>of</strong> cathode <strong>of</strong><br />
refined copper (69.2 percent); Plates,<br />
sheets and strip, <strong>of</strong> refined copper<br />
uncoiled (12.3 percent); Copper blister<br />
(10.1); Cobalt ores and concentrates (3.5<br />
percent) and Copper ores and<br />
concentrates (2.5 percent).<br />
China was the second largest destination<br />
<strong>of</strong> <strong>Zambia</strong>’s total exports accounting for<br />
16.3 percent. <strong>The</strong> major export products<br />
were Copper blister (46.2 percent);<br />
Cathodes & section <strong>of</strong> cathode <strong>of</strong><br />
refined copper (40.1 percent); Copper<br />
(excl. Master) alloys, nes, unwrought (9.1<br />
percent) and Manganese<br />
ores/concentrates (1.1 percent).<br />
<strong>Zambia</strong>’s third major export destination<br />
was South Africa with 12.7 percent. <strong>The</strong><br />
major export products to South Africa<br />
12
were, Wire <strong>of</strong> refined copper, maximum<br />
cross-sectional dimension >6mm (16.7<br />
percent); Other articles <strong>of</strong> cobalt, nes<br />
(16.0 percent); Cathodes and sections<br />
<strong>of</strong> cathodes <strong>of</strong> refined copper (11.8<br />
percent); Machines having individual<br />
functions, nes (11.5 percent); and Semimanufactured<br />
gold (incl. gold plated<br />
with platinum) with 9.4 percent.<br />
<strong>The</strong> Democratic Republic <strong>of</strong> Congo was<br />
the fourth largest destination <strong>of</strong> <strong>Zambia</strong>’s<br />
total exports accounting for 6.6 percent.<br />
<strong>The</strong> major export products were, Raw<br />
cane sugar, in solid form (9.2 percent);<br />
Portland cement (excl. white) with 5.0<br />
percent; Sulphuric acid, oleum in bulk<br />
(4.9 percent); Wheat or meslin flour (3.9<br />
percent); and Other mixtures with basis <strong>of</strong><br />
odoriferous subst.inc (3.4 percent).<br />
<strong>The</strong> United Arab Emirates was the fifth<br />
largest destination <strong>of</strong> <strong>Zambia</strong>’s total<br />
exports accounting for 3.6 percent. <strong>The</strong><br />
major export products were, Cathodes<br />
and sections <strong>of</strong> cathodes <strong>of</strong> refined<br />
copper (51.8 percent); and Plates, sheets<br />
and strip, <strong>of</strong> refined copper, uncoiled<br />
(48.1 percent).<br />
Country / HS-<br />
Code<br />
<strong>Zambia</strong>'s Five Major Export Destinations by Product for May <strong>2010</strong>*<br />
Description<br />
Value<br />
(K'Million)<br />
May-10*<br />
% Share<br />
SWITZERLAND 1,504,957 100.0<br />
74031100 Cathodes and sections <strong>of</strong> cathodes <strong>of</strong> refined copper 1,041,436 69.2<br />
74091900 Plates, sheets and strip, <strong>of</strong> refined copper, uncoi 184,555 12.3<br />
74031910 Copper blister 151,814 10.1<br />
26050000 Cobalt ores and concentrates 52,020 3.5<br />
26030000 Copper ores and concentrates 37,519 2.5<br />
81059000 Other: articles <strong>of</strong> cobalt, nes 17,974 1.2<br />
26169000 Precious metal ores and concentrates (excl. silver 12,342 0.8<br />
74081100 Wire <strong>of</strong> refined copper, maximum cross-sectional dimension >6mm 3,416 0.2<br />
28220010 Cobalt oxides and hydroxides; commercial cobalt ox 3,068 0.2<br />
74031990 Other 618 0.0<br />
Other Products 196 0.0<br />
% <strong>of</strong> Total May Exports 51.3<br />
CHINA 476,707 100.0<br />
74031910 Copper blister 220,437 46.2<br />
74031100 Cathodes and sections <strong>of</strong> cathodes <strong>of</strong> refined coppe 191,256 40.1<br />
74032900 Copper (excl. master) alloys, nes, unwrought 43,157 9.1<br />
26020000 Manganese ores/concentrates(inc.ferruginous), with 5,186 1.1<br />
28220010 Cobalt oxides and hydroxides; commercial cobalt ox 3,863 0.8<br />
26050000 Cobalt ores and concentrates 3,852 0.8<br />
81059000 Other: articles <strong>of</strong> cobalt, nes 2,954 0.6<br />
26040000 Nickel ores and concentrates 2,934 0.6<br />
44079900 Wood, nes sawn or chipped lengthwise, sliced or pe 1,367 0.3<br />
26030000 Copper ores and concentrates 810 0.2<br />
Other Products 890 0.2<br />
% <strong>of</strong> Total May Exports 16.3<br />
SOUTH AFRICA 371,615 100.0<br />
74081100 Wire <strong>of</strong> refined copper, maximum cross-sectional dimension >6mm 62,135 16.7<br />
81059000 Other: articles <strong>of</strong> cobalt, nes 59,554 16.0<br />
74031100 Cathodes and sections <strong>of</strong> cathodes <strong>of</strong> refined coppe 43,780 11.8<br />
84798900 Machines, having individual functions, nes 42,709 11.5<br />
71081300 Semi-manufactured gold (incl. gold plated with pla 34,845 9.4<br />
85444900 Electric conductors, nes, for a voltage
Country / HS-<br />
Code<br />
Description<br />
Value<br />
(K'Million)<br />
May-10*<br />
26169000 Precious metal ores and concentrates (excl. silver 18,392 4.9<br />
26040000 Nickel ores and concentrates 15,989 4.3<br />
17011100 Raw cane sugar, in solid form 7,530 2.0<br />
26050000 Cobalt ores and concentrates 5,469 1.5<br />
Other Products 62,633 16.9<br />
% <strong>of</strong> Total May Exports 12.7<br />
% Share<br />
CONGO DR 192,375 100.0<br />
17011100 Raw cane sugar, in solid form 17,696 9.2<br />
25232900 Portland cement (excl. white) 9,578 5.0<br />
28070010 Sulphuric acid; oleum in bulk 9,343 4.9<br />
11010000 Wheat or meslin flour 7,571 3.9<br />
33029010 Other mixtures with basis <strong>of</strong> odoriferous subst.inc 6,576 3.4<br />
84139100 Parts <strong>of</strong> pumps for liquids 3,722 1.9<br />
84314900 Parts <strong>of</strong> machinery <strong>of</strong> 84.26, 84.29 and 84.30, nes 3,617 1.9<br />
38249000 Chemical products and residual products <strong>of</strong> chemica 3,306 1.7<br />
25199000 Magnesia and other magnesium oxide 3,276 1.7<br />
84304100 Self-propelled boring or sinking machinery 2,724 1.4<br />
Other Products 124,966 65.0<br />
% <strong>of</strong> Total May Exports 6.6<br />
UNITED ARAB ERIMATES 106,922 100.0<br />
74031100 Cathodes and sections <strong>of</strong> cathodes <strong>of</strong> refined coppe 55,428 51.8<br />
74091900 Plates, sheets and strip, <strong>of</strong> refined copper, uncoi 51,478 48.1<br />
72042900 Waste and scrap <strong>of</strong> alloy steel (excl. stainless) 16 0.0<br />
85258000 Television cameras, digital cameras and video camera recorders 1 0.0<br />
01029090 Other live bovine animals---other 0 0.0<br />
01061900 Mammals--other 0 0.0<br />
01062000 Reptiles (including snakes and turtles) 0 0.0<br />
02021000 Frozen bovine carcasses and half carcasses 0 0.0<br />
02032900 Frozen swine meat, nes 0 0.0<br />
02043000 Frozen lamb carcasses and half carcasses 0 0.0<br />
Other Products 0 0.0<br />
% <strong>of</strong> Total May Exports 3.6<br />
Other Destination 280,9<strong>87</strong> 9.6<br />
Total Value <strong>of</strong> May Exports 2,933,562<br />
Source: CSO, International Trade Statistics, <strong>2010</strong><br />
Note: (*) Provisional<br />
Export Market Shares by Regional Groupings, May <strong>2010</strong> and April<br />
<strong>2010</strong><br />
Southern African Development<br />
Community (SADAC) regional grouping<br />
was the largest market for <strong>Zambia</strong>’s total<br />
exports, accounting for 23.2 and 11.5<br />
percent in May and April <strong>2010</strong>,<br />
respectively. Within SADC, South Africa<br />
was the dominant market in both months<br />
with 54.6 and 48.1 percent, in May and<br />
April <strong>2010</strong>, respectively. Congo DR was<br />
the second dominant market with 28.3<br />
and 29.9 percent in May and April <strong>2010</strong>,<br />
respectively. Malawi was the third<br />
largest market with 7.1percent in May<br />
<strong>2010</strong>, while Zimbabwe was third with 7.4<br />
percent in April <strong>2010</strong>. Other notable<br />
markets were Tanzania and Namibia.<br />
Asia was the second largest market for<br />
<strong>Zambia</strong>’s total exports accounting for<br />
21.0 and 26.7 percent in May and April<br />
<strong>2010</strong>, respectively. Within Asia, China was<br />
the dominant market in May and April<br />
<strong>2010</strong> with 77.4 and 76.7 percent,<br />
respectively. <strong>The</strong> United Arab Emirates<br />
14
was the second dominant market with<br />
17.3 and 22.3 percent in May and April<br />
<strong>2010</strong>, respectively. <strong>The</strong> Republic <strong>of</strong> Korea<br />
was the third largest market with 3.4<br />
percent in May and 0.6 percent in April<br />
<strong>2010</strong>. Other key markets were India, <strong>The</strong><br />
Philippines and Hong Kong.<br />
<strong>The</strong> Common Market for Eastern and<br />
Southern Africa (COMESA) grouping <strong>of</strong><br />
countries was the third largest market for<br />
<strong>Zambia</strong>’s total exports accounting for<br />
11.4 and 7.0 percent, in May and April<br />
<strong>2010</strong>, respectively. Within COMESA,<br />
Congo DR was the dominant market in<br />
both months with 57.6 and 49.5 percent<br />
in May and April <strong>2010</strong>, respectively.<br />
Malawi was the second dominant market<br />
in May <strong>2010</strong> with 14.5 percent, while<br />
Egypt was second in April <strong>2010</strong> with 14.8<br />
percent. <strong>The</strong> third largest market was<br />
Zimbabwe with 10.2 and 12.3 percent in<br />
May and April <strong>2010</strong>, respectively. Other<br />
notable markets were Burundi and<br />
Kenya.<br />
<strong>The</strong> European Union (EU) was the fourth<br />
largest market for <strong>Zambia</strong>’s total exports<br />
accounting for 2.6 and 4.1 percent in<br />
May and April <strong>2010</strong>, respectively. Within<br />
the EU market, the United Kingdom was<br />
the dominant market with 64.6 and 53.9<br />
percent in May and April <strong>2010</strong>,<br />
respectively. <strong>The</strong> Netherlands was the<br />
second largest market in May <strong>2010</strong> with<br />
18.2 percent, while Luxembourg was<br />
second in April <strong>2010</strong> with 12.3 percent.<br />
Other notable markets were Belgium,<br />
Germany, Denmark and Sweden.<br />
Export Market Shares by Regional Groupings, May <strong>2010</strong> and April <strong>2010</strong> (K’ Millions)<br />
GROUPING<br />
May-10*<br />
Apr-10®<br />
GROUPING<br />
Value (K'Million) % Share Value (K'Million) % Share<br />
SADC 680,620 100.0 SADC 368,225 100.0<br />
South Africa 371,615 54.6 South Africa 177,078 48.1<br />
Congo DR 192,375 28.3 Congo DR 110,238 29.9<br />
Malawi 48,397 7.1 Zimbabwe 27,364 7.4<br />
Zimbabwe 34,173 5.0 Malawi 26,697 7.3<br />
Tanzania, united 10,780 1.6 Namibia 8,313 2.3<br />
Other SADC 23,280 3.4 Other SADC 18,535 5.0<br />
% <strong>of</strong> Total May Exports 23.2 % <strong>of</strong> Total April Exports 11.5<br />
ASIA 616,274 100.0 ASIA 855,<strong>87</strong>0 100.0<br />
China 476,707 77.4 China 656,328 76.7<br />
United Arab Emirates 106,922 17.3 United Arab Emirates 190,677 22.3<br />
Korea, Republic <strong>of</strong> 20,971 3.4 Korea, Republic <strong>of</strong> 5,331 0.6<br />
India 4,173 0.7 India 1,806 0.2<br />
Philippines 3,504 0.6 Hong Kong 1,009 0.1<br />
Other ASIA 3,997 0.6 Other ASIA 719 0.1<br />
% <strong>of</strong> Total May Exports 21.0 % <strong>of</strong> Total April Exports 26.7<br />
COMESA 333,734 100.0 COMESA 222,612 100.0<br />
Congo DR 192,375 57.6 Congo DR 110,238 49.5<br />
Malawi 48,397 14.5 Egypt 32,927 14.8<br />
Zimbabwe 34,173 10.2 Zimbabwe 27,364 12.3<br />
Egypt 32,460 9.7 Malawi 26,697 12.0<br />
Burundi 13,279 4.0 Kenya 13,755 6.2<br />
Other COMESA 13,050 3.9 Other COMESA 11,631 5.2<br />
% <strong>of</strong> Total May Exports 11.4 % <strong>of</strong> Total April Exports 7.0<br />
EUROPEAN UNION 76,726 100.0 EUROPEAN UNION 132,040 100.0<br />
United Kingdom 49,534 64.6 United Kingdom 71,206 53.9<br />
Netherlands 13,960 18.2 Luxembourg 16,175 12.3<br />
Belgium 6,733 8.8 Netherlands 14,846 11.2<br />
Germany 5,491 7.2 Belgium 11,572 8.8<br />
Denmark 349 0.5 Sweden 7,371 5.6<br />
Other EU 659 0.9 Other EU 10,<strong>87</strong>0 8.2<br />
% <strong>of</strong> Total May Exports 2.6 % <strong>of</strong> Total April Exports 4.1<br />
Total Value <strong>of</strong> May Exports 2,933,562 Total Value <strong>of</strong> April Exports 3,200,335<br />
Source: CSO, International Trade Statistics, <strong>2010</strong><br />
Note: (*) Provisional (R) Revised figures<br />
Some countries are members <strong>of</strong> both SADC and COMESA<br />
15
Total Exports by Major Ports <strong>of</strong> Exit, May and April <strong>2010</strong> (K’ million)<br />
<strong>Zambia</strong>’s six major ports <strong>of</strong> exit for exports<br />
from various sources during the month <strong>of</strong><br />
May <strong>2010</strong>, were Ndola, Chirundu, Kitwe,<br />
Livingstone, Kapiri-Mposhi and<br />
Kasumbalesa port <strong>of</strong>fices. Ndola port was<br />
the major port <strong>of</strong> exit with 28.2 and 30.4<br />
percent <strong>of</strong> <strong>Zambia</strong>’s total exports in May<br />
and April <strong>2010</strong>, respectively. This is<br />
attributed to the copper and cobalt that<br />
are mainly exported through the Ndola<br />
port <strong>of</strong>fice. Chirundu was the second<br />
major port <strong>of</strong> exit with 19.9 and 23.4 in the<br />
month <strong>of</strong> May and April <strong>2010</strong>,<br />
respectively.<br />
Kitwe port <strong>of</strong>fice was third with 17.8 and<br />
14.0 percent in the month <strong>of</strong> May and<br />
April <strong>2010</strong>, respectively. It was followed<br />
by Livingstone (9.6 percent); Kapiri-<br />
Mposhi (8.4 percent); and Kasumbalesa<br />
(5.1 percent). <strong>The</strong> six ports collectively<br />
accounted for 89.0 percent.<br />
Total Exports by Major Ports <strong>of</strong> Exit, May and April <strong>2010</strong> (K’ million)<br />
Port <strong>of</strong> Exit<br />
May-10*<br />
Apr-10®<br />
Port <strong>of</strong> Exit<br />
Value % Share Value % Share<br />
Ndola port <strong>of</strong>fice 826,955 28.2 Ndola port <strong>of</strong>fice 972,433 30.4<br />
Chirundu 583,446 19.9 Chirundu 748,403 23.4<br />
Kitwe Port <strong>Office</strong> 522,430 17.8 Kitwe Port <strong>Office</strong> 448,588 14.0<br />
Livingstone Port <strong>Office</strong> 282,747 9.6 Livingstone Port <strong>Office</strong> 262,926 8.2<br />
Kapiri Mposhi 246,099 8.4 Nakonde 235,691 7.4<br />
Kasumbalesa 149,574 5.1 Kapiri Mposhi 229,137 7.2<br />
Nakonde 67,367 2.3 Chingola 103,215 3.2<br />
Kazungula 53,336 1.8 Kasumbalesa 65,104 2.0<br />
Chingola 50,222 1.7 Kazungula 42,089 1.3<br />
Mwami Border Post 47,438 1.6 Mwami Border Post 24,740 0.8<br />
Others 103,948 3.5 Others 68,008 2.1<br />
Total 2,933,562 100.0 Total 3,200,335 100.0<br />
Source: CSO, International Trade Statistics, <strong>2010</strong><br />
Note: (*) Provisional (R) Revised figures<br />
Some countries are members <strong>of</strong> both SADC and COMESA<br />
<strong>Zambia</strong>’s major exports by Mode <strong>of</strong> Transport, May and April <strong>2010</strong><br />
(K’ million)<br />
Road was the major mode <strong>of</strong> transport<br />
for <strong>Zambia</strong>’s exports with 78.5 and 84.1<br />
percent in May and April <strong>2010</strong>,<br />
respectively. Rail was the second major<br />
mode <strong>of</strong> transport in May and April <strong>2010</strong>,<br />
with 19.0 and 14.9 percent, respectively.<br />
Other notable modes <strong>of</strong> transport in May<br />
<strong>2010</strong> were Air transport (2.2 percent) and<br />
Electric power line (0.4 percent).<br />
<strong>Zambia</strong>’s major exports by Mode <strong>of</strong> Transport, May and April <strong>2010</strong> (K’ million)<br />
Mode <strong>of</strong> Transport<br />
May-10*<br />
Apr-10®<br />
Port <strong>of</strong> Exit<br />
Value % Share Value % Share<br />
Road Transport 2,301,7<strong>87</strong> 78.5 Road Transport 2,691,384 84.1<br />
Rail Transport 557,376 19.0 Rail Transport 477,988 14.9<br />
Air Transport 63,852 2.2 Air Transport 20,505 0.6<br />
Electric Power Line 10,452 0.4 Electric Power Line 10,452 0.3<br />
Other 95 0.0 Other 5 0.0<br />
Total 2,933,562 100.0 Total 3,200,335 100.0<br />
Source: CSO, International Trade Statistics, <strong>2010</strong><br />
Note: (*) Provisional (R) Revised figures<br />
16
Imports by Major Product Categories, May <strong>2010</strong> and April <strong>2010</strong><br />
<strong>Zambia</strong>’s major import products by<br />
category in May <strong>2010</strong> were from the<br />
Capital goods category accounting for<br />
35.7 percent. <strong>The</strong>se mostly comprised <strong>of</strong><br />
Self-propelled graders and levellers;<br />
Diesel non-dual purpose vehicles for<br />
either person or goods; Self-propelled<br />
bulldozers, excavators, nes; Dumpers for<br />
<strong>of</strong>f-highway use; Diesel non-dual purpose<br />
vehicles for either person or goods; and<br />
vehicles with engine capacity exceeding<br />
1500cc. <strong>The</strong> Intermediate goods<br />
category was second with 31.6 percent.<br />
Other notable imports were Raw<br />
materials and Consumer goods<br />
accounting for 21.4 and 11.3 percent, in<br />
May <strong>2010</strong>, respectively.<br />
Imports (cif) by major product categories May * <strong>2010</strong> and APRIL <strong>2010</strong>, K’ Millions<br />
Description<br />
May-10*<br />
Apr-10®<br />
Value % Share Value % Share<br />
Consumer goods 244,258 11.3 234,611 11.4<br />
Raw materials 463,892 21.4 589,971 28.6<br />
Intermediate goods 686,528 31.6 813,254 39.4<br />
Capital goods 776,018 35.7 428,159 20.7<br />
Total 2,170,696 100.0 2,065,995 100.0<br />
Source: CSO, International Trade Statistics, <strong>2010</strong><br />
Imports (cif) by major product categories May <strong>2010</strong> and APRIL <strong>2010</strong>, K’Millions<br />
May-10*<br />
Apr-10®<br />
0 100,000 200,000 300,000 400,000 500,000 600,000 700,000 800,000 900,000<br />
Source: CSO, International Trade Statistics, <strong>2010</strong><br />
Note: (*) Provisional, (R) Revised figures<br />
Consumer goods Raw materials Intermediate goods Capital goods<br />
17
<strong>Zambia</strong>’s Major Imports by Broad Economic Category (BEC) for May<br />
<strong>2010</strong> and APRIL <strong>2010</strong><br />
<strong>The</strong> total value <strong>of</strong> imports by Broad<br />
Economic Category (BEC) in May <strong>2010</strong><br />
was K2,170.7 billion compared to K2,066.0<br />
billion in April <strong>2010</strong>. <strong>The</strong> most prominent<br />
imports were Industrial supplies mainly<br />
those in their primary and processed form<br />
which accounted for 41.4 and 54.1<br />
percent in May and April <strong>2010</strong>,<br />
respectively. Industrial supplies; and<br />
Capital goods (excluding transport<br />
equipment), parts & accessories<br />
collectively accounted for 73.0 percent.<br />
Other notable imports in May and April<br />
<strong>2010</strong> were Transport equipment, parts<br />
and accessories there<strong>of</strong>; and Fuels &<br />
lubricants.<br />
CODE<br />
Imports (cif) by Broad Economic Category (BEC), May <strong>2010</strong> and April <strong>2010</strong><br />
(K ’Millions)<br />
DESCRIPTION<br />
May-10*<br />
Value<br />
(K'million)<br />
%<br />
Share<br />
Apr-10®<br />
Value<br />
(K'million)<br />
%<br />
Share<br />
1 Food and beverages 74,165 3.4 70,515 3.4<br />
2 Industrial supplies not elsewhere specified 898,641 41.4 1,117,668 54.1<br />
3 Fuels and lubricants 175,074 8.1 225,762 10.9<br />
4<br />
Capital goods (excl'transport equipment),<br />
parts & accessories 686,590 31.6 361,077 17.5<br />
5<br />
Transport equipment,parts and accessories<br />
there<strong>of</strong> 205,553 9.5 153,895 7.4<br />
6 Consumer goods not elsewhere specified 127,445 5.9 132,571 6.4<br />
7 Goods not elsewhere specified 3,228 0.1 4,505 0.2<br />
Total 2,170,695 100.0 2,065,995 100.0<br />
Source: CSO, International Trade Statistics, <strong>2010</strong><br />
Note: (*) Provisional (R) Revised figures<br />
<strong>Zambia</strong>’s Major Imports by the Harmonised Coding System (HS) in<br />
May <strong>2010</strong><br />
<strong>Zambia</strong>’s major import products in May<br />
<strong>2010</strong> were Boilers, machinery and<br />
mechanical appliances & parts,<br />
accounting for 28.3 percent. Other<br />
important import products during the<br />
same period were: Ores, slag & ash;<br />
Mineral fuels, oils & products <strong>of</strong> their<br />
distillation; Vehicles o/t railw/tranw roolstock,<br />
parts & accessories; Copper and<br />
articles there<strong>of</strong>; Inorganic chemical<br />
compounds <strong>of</strong> precious metals,<br />
radioactive elements etc; and Fertilizers.<br />
All these products collectively accounted<br />
for 40.0 percent.<br />
18
<strong>Zambia</strong>’s Major Imports by HS Chapters for May <strong>2010</strong>*, K’ Millions<br />
May-10*<br />
Chapter Description<br />
Value % Share<br />
84 Boilers, mchy & mech appliance; parts 613,315 28.3<br />
Self-propelled graders and levellers 303,785 49.5<br />
Parts <strong>of</strong> machinery <strong>of</strong> 84.26, 84.29 and 84.30, nes 35,008 5.7<br />
Parts <strong>of</strong> machinery <strong>of</strong> 84.74 25,846 4.2<br />
Self-propelled bulldozers, excavators..., nes 19,385 3.2<br />
Self-propelled bulldozers and angledozers, (excl. 12,732 2.1<br />
Self-propelled front-end shovel loaders 10,728 1.7<br />
Pumps for liquids, nes 10,554 1.7<br />
Machinery and apparatus for filtering/purifying wa 9,430 1.5<br />
Parts <strong>of</strong> pumps for liquids 9,328 1.5<br />
Machinery for projecting... liquids/powders for ag 8,466 1.4<br />
Rest <strong>of</strong> Chapter 168,053 27.4<br />
26 Ores, slag and ash 189,832 8.7<br />
Cobalt ores and concentrates 132,060 69.6<br />
Copper ores and concentrates 57,320 30.2<br />
Aluminium ores and concentrates 441 0.2<br />
Other ores and concentrates, nes 10 0.0<br />
27 Mineral fuels, oils & product <strong>of</strong> their distillation; etc 183,660 8.5<br />
<strong>87</strong> Vehicles o/t railw/tranw rool-stock, pts & accessories 165,772 7.6<br />
74 Copper and articles there<strong>of</strong> 136,221 6.3<br />
28 Inorgn chem; compds <strong>of</strong> prec met, radioact elements etc 100,557 4.6<br />
31 Fertilisers 94,192 4.3<br />
85 Electrical mchy equip parts there<strong>of</strong>; sound recorder etc 77,527 3.6<br />
39 Plastics and articles there<strong>of</strong> 56,026 2.6<br />
73 Articles <strong>of</strong> iron and steel 54,058 2.5<br />
72 Iron and steel 53,896 2.5<br />
30 Pharmaceutical products 52,901 2.4<br />
38 Miscellaneous chemical products 36,956 1.7<br />
40 Rubber and articles there<strong>of</strong> 34,812 1.6<br />
15 Animal/veg fats & oil & their cleavage products; etc 28,631 1.3<br />
29 Organic chemicals 26,985 1.2<br />
48 Paper & paperboard; art <strong>of</strong> paper pulp, paper/paperboard 21,330 1.0<br />
25 Salt; sulphur; earth & ston; plastering mat; lime & cem 21,318 1.0<br />
90 Optical, photo, cine, meas, checking, precision, etc 14,895 0.7<br />
63 Other made up textile articles; sets; worn clothing etc 14,159 0.7<br />
94 Furniture; bedding, mattress, matt support, cushion etc 13,891 0.6<br />
34 Soap, organic surface-active agents, washing prep, etc 13,543 0.6<br />
33 Essential oils & resinoids; perf, cosmetic/toilet prep 9,642 0.4<br />
82 Tool, implement, cutlery, spoon & fork, <strong>of</strong> base met etc 8,817 0.4<br />
36 Explosives; pyrotechnic prod; matches; pyro alloy; etc 8,730 0.4<br />
69 Ceramic products 8,069 0.4<br />
49 Printed books, newspapers, pictures & other product etc 7,115 0.3<br />
21 Miscellaneous edible preparations 7,101 0.3<br />
32 Tanning/dyeing extract; tannins & derivs; pigm etc 6,194 0.3<br />
22 Beverages, spirits and vinegar 6,002 0.3<br />
76 Aluminium and articles there<strong>of</strong> 5,827 0.3<br />
Other Chapters 98,724 4.5<br />
Total 2,170,695 100.0<br />
Source: CSO, International Trade Statistics, <strong>2010</strong><br />
Note: (*) Provisional<br />
<strong>Zambia</strong>’s Major Import Sources by Product, May <strong>2010</strong><br />
<strong>The</strong> major source <strong>of</strong> <strong>Zambia</strong>’s imports in<br />
May <strong>2010</strong> was South Africa accounting<br />
for 32.9 percent. <strong>The</strong> major import<br />
products from South Africa were, Other<br />
fertilizers, nes (3.4 percent); Self-propelled<br />
bulldozers, excavators, nes (2.6 percent)<br />
and Parts <strong>of</strong> machinery <strong>of</strong> 84.26, 84.29 &<br />
84.30, nes (2.3 percent). Other notable<br />
import products were Parts <strong>of</strong> machinery<br />
<strong>of</strong> 84.74 and Dumpers for <strong>of</strong>f-highway<br />
use.<br />
<strong>The</strong> second main source <strong>of</strong> <strong>Zambia</strong>’s<br />
imports in May <strong>2010</strong> was Congo DR<br />
accounting for 18.7 percent <strong>of</strong> the total<br />
value <strong>of</strong> imports. <strong>The</strong> major import<br />
products from Congo DR were: Cobalt<br />
ores and concentrates (65.6 percent);<br />
Cobalt oxides and hydroxides;<br />
Commercial cobalt oxides (18.2<br />
percent); and Copper ores and<br />
concentrates (14.1 percent).<br />
19
Other notable sources <strong>of</strong> <strong>Zambia</strong>’s imports were Belgium, Kuwait and India, collectively<br />
accounting for 24.4 percent <strong>of</strong> <strong>Zambia</strong>’s total imports in May <strong>2010</strong>.<br />
<strong>Zambia</strong>’s Major Import Sources by Products, May <strong>2010</strong>* (K’Millions)<br />
May-10*<br />
Country /<br />
Description<br />
HS-Code<br />
Value<br />
% Share<br />
(K'Million)<br />
SOUTH AFRICA 713,358 100.0<br />
31059000 Other fertilizers, nes 24,440 3.4<br />
84295900 Self-propelled bulldozers, excavators..., nes 18,741 2.6<br />
84314900 Parts <strong>of</strong> machinery <strong>of</strong> 84.26, 84.29 and 84.30, nes 16,702 2.3<br />
84749000 parts <strong>of</strong> machinery <strong>of</strong> 84.74 15,099 2.1<br />
<strong>87</strong>041000 Dumpers for <strong>of</strong>f-highway use 13,476 1.9<br />
73261100 Grinding balls... for mills, forged or stamped, <strong>of</strong> 12,184 1.7<br />
<strong>87</strong>042190 Diesel non dual purpose vehicles for either person 10,374 1.5<br />
31023000 Ammonium nitrate 9,554 1.3<br />
84291900 Self-propelled bulldozers and angledozers, (excl. 9,055 1.3<br />
84139100 Parts <strong>of</strong> pumps for liquids 8,986 1.3<br />
Other Products 574,747 80.6<br />
% <strong>of</strong> Total May Imports 32.9<br />
CONGO DR 406,974 100.0<br />
26050000 Cobalt ores and concentrates 266,851 65.6<br />
28220010 Cobalt oxides and hydroxides; commercial cobalt ox 73,890 18.2<br />
26030000 Copper ores and concentrates 57,320 14.1<br />
84291900 Self-propelled bulldozers and angledozers, (excl. 2,718 0.7<br />
<strong>87</strong>041000 Dumpers for <strong>of</strong>f-highway use 2,067 0.5<br />
2930<strong>2010</strong> Thiocarbamates and dithiocarbamates in bulk 1,544 0.4<br />
84294000 Self-propelled tamping machines and road-rollers 1,015 0.2<br />
84742000 Crushing or grinding machines for earth, stone, ores, etc 637 0.2<br />
84264100 Derricks, cranes, etc, nes, self-propelled, on tyr 231 0.1<br />
84261900 Transporter cranes,gantry cranes/bridge cranes,ove 223 0.1<br />
Other Products 477 0.1<br />
% <strong>of</strong> Total May Imports 18.7<br />
BELGIUM 307,854 100.0<br />
84292000 Self-propelled graders and levellers 300,725 97.7<br />
38220000 Diagnostic/lab.reagents on backing;prep'd diagnost 2,095 0.7<br />
11071010 Malted barley not roasted 1,417 0.5<br />
84314900 Parts <strong>of</strong> machinery <strong>of</strong> 84.26, 84.29 and 84.30, nes 1,358 0.4<br />
84148000 Other: air pumps; air or gas compressors; hoods wi 501 0.2<br />
63090000 Worn clothing and other worn articles 282 0.1<br />
84149000 Parts <strong>of</strong> air/vacuum pumps, <strong>of</strong> air/gas compressors, 244 0.1<br />
<strong>87</strong>083000 Brakes and servo-brakes; parts there<strong>of</strong> 164 0.1<br />
38089300 Herbicides, anti-sprouting products and plant grow 156 0.1<br />
30061000<br />
Materials for surgical sutures; laminaria ; absorbable<br />
haemostatics<br />
106 0.0<br />
Other Products 806 0.3<br />
% <strong>of</strong> Total May Imports 14.2<br />
KUWAIT 146,453 100.0<br />
27090000 Petroleum oils and oils obtained from bituminous m 146,453 100.0<br />
01019000 Other 0 0.0<br />
01061900 Mammals--other 0 0.0<br />
01069000 Other live animals 0 0.0<br />
20
May-10*<br />
Country /<br />
Description<br />
HS-Code<br />
Value<br />
% Share<br />
(K'Million)<br />
02089000 Other meat and edible meat <strong>of</strong>fals 0 0.0<br />
02102000 Other meat <strong>of</strong> bovine animals including edible flou 0 0.0<br />
02109900 Other meat <strong>of</strong> bovine animals 0 0.0<br />
03019900 Other live fish 0 0.0<br />
03023900 Fresh or chilled tunas, nes 0 0.0<br />
03037900 Frozen fish, nes 0 0.0<br />
Other Products 0 0.0<br />
% <strong>of</strong> Total May Imports 6.7<br />
INDIA 75,566 100.0<br />
30049000 Other medicaments <strong>of</strong> mixed or unmixed products, fo 22,300 29.5<br />
84212100 Machinery and apparatus for filtering/purifying wa 9,025 11.9<br />
30039000 Other medicaments with >=2 constituents, not for r 5,784 7.7<br />
84388000<br />
Machinery for the preparation or manufacture <strong>of</strong> food or drink,<br />
nes<br />
2,343 3.1<br />
<strong>87</strong>019010 Tractors (excl. tractors <strong>of</strong> <strong>87</strong>.09), nes - for use 1,636 2.2<br />
30042000 Medicaments <strong>of</strong> other antibiotics, for retail sale 1,541 2.0<br />
84552200 Cold metal-rolling mills 1,376 1.8<br />
30066010 Chemical contraceptive preparations based on spermicides 1,370 1.8<br />
84431100 Offset printing machinery, reel fed 1,343 1.8<br />
39206310 Plates..., <strong>of</strong> unsaturated polyesters, not reinforc 1,319 1.7<br />
Other Products 27,527 36.4<br />
% <strong>of</strong> Total May Imports 3.5<br />
Other Destination 520,490 24.0<br />
Total Value <strong>of</strong> May Imports 2,170,695<br />
Source: CSO, International Trade Statistics, <strong>2010</strong><br />
Import Market Shares by Regional Groupings, May <strong>2010</strong> and April<br />
<strong>2010</strong><br />
<strong>The</strong> Southern African Development<br />
Community (SADC) regional grouping<br />
was the largest source <strong>of</strong> <strong>Zambia</strong>’s<br />
imports accounting for 55.4 and 64.5<br />
percent in May and April <strong>2010</strong>,<br />
respectively. Within the SADC region,<br />
South Africa was the major source <strong>of</strong><br />
<strong>Zambia</strong>’s imports in May <strong>2010</strong> accounting<br />
for 59.3 percent while Congo (DR) was<br />
the major source <strong>of</strong> <strong>Zambia</strong>’s imports in<br />
April <strong>2010</strong> with 47.3 percent. However,<br />
Congo (DR) was the second major<br />
source <strong>of</strong> <strong>Zambia</strong>’s imports with 33.8<br />
percent in May <strong>2010</strong>, while South Africa<br />
was second in April <strong>2010</strong> with 46.7<br />
percent. Other key market sources were<br />
Zimbabwe, Tanzania, Mozambique and<br />
Malawi.<br />
21<br />
<strong>The</strong> Common Market for Eastern and<br />
Southern Africa (COMESA) grouping <strong>of</strong><br />
countries was the second largest source<br />
<strong>of</strong> <strong>Zambia</strong>’s imports accounting for 22.0<br />
and 34.1 percent in May and April <strong>2010</strong>,<br />
respectively. Within COMESA, Congo<br />
(DR) was the main source <strong>of</strong> <strong>Zambia</strong>’s<br />
imports with 85.1 and 89.6 percent in May<br />
and April <strong>2010</strong>, respectively. Zimbabwe<br />
was the second major source with 6.6<br />
and 4.5 percent in May and April <strong>2010</strong>,<br />
respectively. Other notable sources were<br />
Kenya, Malawi and Egypt.<br />
<strong>The</strong> European Union (EU) was the third<br />
largest source <strong>of</strong> <strong>Zambia</strong>’s imports with<br />
21.3 percent in May <strong>2010</strong> while it was the<br />
fourth largest source <strong>of</strong> <strong>Zambia</strong>’s imports<br />
in April <strong>2010</strong>. Within the EU, Belgium was<br />
the major source <strong>of</strong> <strong>Zambia</strong>’s imports<br />
accounting for 66.5 percent in May <strong>2010</strong>,<br />
while the United Kingdom was the major<br />
source in April <strong>2010</strong> with 23.7 percent.<br />
Other key markets were Sweden, Ireland<br />
and Finland.
Asia was the fourth largest market for<br />
<strong>Zambia</strong>’s imports accounting for 19.2<br />
percent in May <strong>2010</strong> while it was the third<br />
largest market in April <strong>2010</strong>. Within Asia,<br />
Kuwait was the dominant market in May<br />
and April <strong>2010</strong> with 35.2 and 43.7<br />
percent, respectively. India was the<br />
second largest market with 18.2 percent<br />
in May <strong>2010</strong>, while China was second<br />
with 15.0 percent in April <strong>2010</strong>. Other<br />
notable markets were the United Arab<br />
Emirates and Japan.<br />
Import Market shares by major Regional groupings, May <strong>2010</strong> and APRIL <strong>2010</strong><br />
GROUPING<br />
May-10*<br />
Apr-10®<br />
GROUPING<br />
Value (K'Million) % Share Value (K'Million) % Share<br />
SADC 1,203,083 100.0 SADC 1,333,410 100.0<br />
South Africa 713,358 59.3 Congo DR 630,917 47.3<br />
Congo DR 406,974 33.8 South Africa 622,401 46.7<br />
Zimbabwe 31,717 2.6 Zimbabwe 31,592 2.4<br />
Tanzania, united 15,181 1.3 Tanzania, united 25,386 1.9<br />
Mozambique 10,319 0.9 Malawi 6,075 0.5<br />
Other SADC 25,534 2.1 Other SADC 17,039 1.3<br />
% <strong>of</strong> Total May Imports 55.4 % <strong>of</strong> Total April Imports 64.5<br />
COMESA 478,429 100.0 COMESA 703,867 100.0<br />
Congo DR 406,974 85.1 Congo DR 630,917 89.6<br />
Zimbabwe 31,717 6.6 Zimbabwe 31,592 4.5<br />
Kenya 24,1<strong>87</strong> 5.1 Kenya 21,490 3.1<br />
Malawi 6,771 1.4 Egypt 8,867 1.3<br />
Egypt 3,929 0.8 Malawi 6,075 0.9<br />
Other COMESA 4,850 1.0 Other COMESA 4,925 0.7<br />
% <strong>of</strong> Total May Imports 22.0 % <strong>of</strong> Total April Imports 34.1<br />
EUROPEAN UNION 463,066 100.0 EUROPEAN UNION 144,371 100.0<br />
Belgium 307,854 66.5 United Kingdom 34,220 23.7<br />
United Kingdom 57,610 12.4 Germany 25,805 17.9<br />
Sweden 18,234 3.9 Ireland 16,568 11.5<br />
Ireland 15,057 3.3 Finland 11,704 8.1<br />
Germany 12,181 2.6 Sweden 11,219 7.8<br />
Other EU 52,130 11.3 Other EU 44,857 31.1<br />
% <strong>of</strong> Total May Imports 21.3 % <strong>of</strong> Total April Imports 7.0<br />
ASIA 415,778 100.0 ASIA 458,329 100.0<br />
Kuwait 146,453 35.2 Kuwait 200,236 43.7<br />
India 75,566 18.2 China 68,706 15.0<br />
United Arab Emirates 63,612 15.3 United Arab Emirates 62,142 13.6<br />
China 56,005 13.5 India 55,618 12.1<br />
Japan 38,707 9.3 Japan 27,759 6.1<br />
Other ASIA 35,435 8.5 Other ASIA 43,868 9.6<br />
% <strong>of</strong> Total May Imports 19.2 % <strong>of</strong> Total April Imports 22.2<br />
Total Value <strong>of</strong> May Imports 2,170,695 Total Value <strong>of</strong> April Imports 2,065,995<br />
Source: CSO, International Trade Statistics, <strong>2010</strong><br />
Note: (*) Provisional (R) Revised figures<br />
Some countries are members <strong>of</strong> both SADC and COMESA<br />
<strong>Zambia</strong>’s major Imports by Mode <strong>of</strong> Transport, May and April <strong>2010</strong><br />
<strong>Zambia</strong>’s major mode <strong>of</strong> transport for<br />
imports was by Road in May (51.5<br />
percent) and April (61.7 percent) <strong>2010</strong>.<br />
<strong>The</strong> second major mode <strong>of</strong> transport was<br />
Multimode (Sea & Road) which<br />
accounted for 32.2 and 20.2 percent in<br />
May and April <strong>2010</strong>, respectively.<br />
Other notable modes <strong>of</strong> transport in May<br />
<strong>2010</strong> were, Multimodal – other (6.8<br />
percent) and Air transport (6.7 percent).<br />
22
<strong>Zambia</strong>’s major Imports by Mode <strong>of</strong> Transport, May and April <strong>2010</strong> (K’ million)<br />
Mode <strong>of</strong> Transport<br />
May-10*<br />
Apr-10®<br />
Port <strong>of</strong> Exit<br />
Value % Share Value % Share<br />
Road Transport 1,118,226 51.5 Road Transport 1,274,307 61.7<br />
Multimodal- Sea & Road 698,355 32.2 Multimodal- Sea & Road 417,984 20.2<br />
Multimodal - Other 146,706 6.8 Multimodal - Other 204,071 9.9<br />
Air Transport 145,765 6.7 Air Transport 125,927 6.1<br />
Other 61,644 2.8 Other 43,706 2.1<br />
Total 2,170,695 100.0 Total 2,065,995 100.0<br />
Source: CSO, International Trade Statistics, <strong>2010</strong><br />
Note: (*) Provisional (R) Revised figures<br />
Imports by Major Ports <strong>of</strong> Entry, May and April <strong>2010</strong><br />
<strong>Zambia</strong>’s six major ports <strong>of</strong> entry for<br />
imports from various sources in May <strong>2010</strong><br />
were Chirundu, Ndola, Livingstone,<br />
Nakonde, Kasumbalesa and Lusaka<br />
International Airport. Chirundu port was<br />
the major port <strong>of</strong> entry for <strong>Zambia</strong>’s<br />
imports in May <strong>2010</strong> with 37.6 percent<br />
while the Ndola port was the major port<br />
in April <strong>2010</strong> with 37.6 percent. Ndola was<br />
the second major port <strong>of</strong> entry in May<br />
<strong>2010</strong> with 19.9 percent while Chirundu<br />
was the second major port in April <strong>2010</strong><br />
with 25.5 percent.<br />
Livingstone was the third major port <strong>of</strong><br />
entry with 8.1 and 8.0 percent in May and<br />
April <strong>2010</strong>, respectively. Other ports were<br />
Nakonde (7.4 percent); Kasumbalesa (6.4<br />
percent) and Lusaka International Airport<br />
(5.3 percent). <strong>The</strong> six ports collectively<br />
accounted for 84.7 percent.<br />
Imports by Major Ports <strong>of</strong> Entry, May and April <strong>2010</strong> (K’ million)<br />
Port <strong>of</strong> Entry<br />
May-10*<br />
Apr-10®<br />
Port <strong>of</strong> Entry<br />
Value % Share Value % Share<br />
Chirundu 815,097 37.6 Ndola port <strong>of</strong>fice 777,793 37.6<br />
Ndola port <strong>of</strong>fice 431,369 19.9 Chirundu 526,486 25.5<br />
Livingstone Port <strong>Office</strong> 174,960 8.1 Livingstone Port <strong>Office</strong> 164,999 8.0<br />
Nakonde 161,697 7.4 Nakonde 144,510 7.0<br />
Kasumbalesa 138,904 6.4 Lusaka International Airport 99,833 4.8<br />
Lusaka International Airport 115,<strong>87</strong>6 5.3 Lusaka Port <strong>Office</strong> 77,016 3.7<br />
Lusaka Port <strong>Office</strong> 89,157 4.1 Kazungula 69,493 3.4<br />
Kazungula 88,868 4.1 Kasumbalesa 67,103 3.2<br />
Kitwe Port <strong>Office</strong> 55,470 2.6 Kitwe Port <strong>Office</strong> 37,799 1.8<br />
Kapiri Mposhi 18,259 0.8 Chanida 20,869 1.0<br />
Others 81,039 3.7 Others 80,095 3.9<br />
Total 2,170,695 100.0 Total 2,065,995 100.0<br />
Source: CSO, International Trade Statistics, <strong>2010</strong><br />
Note: (*) Provisional (R) Revised figures<br />
NATIONAL ACCOUNTS<br />
Economy Grows by 6.4 percent in 2009<br />
<strong>The</strong> revised estimates <strong>of</strong> Gross Domestic<br />
Product based on data for all the four<br />
quarters <strong>of</strong> 2009 show that the economy<br />
grew by 6.4 percent in 2009 compared to<br />
5.7 percent recorded in 2008. This is 0.1<br />
percentage-points higher than the 6.3<br />
percent preliminary estimate which was<br />
mostly based on data for the first three<br />
quarters.<br />
This growth was spurred by increased<br />
output in Metal Mining, Construction,<br />
Agriculture and Communications.<br />
However, the Hotels, Bars and<br />
Restaurants, Rail and Air Transport and<br />
the Textiles and Leather industries<br />
recorded declines.<br />
23
Percentage Changes in GDP by Kind <strong>of</strong> Economic Activity, 2005-2009<br />
KIND OF ECONOMIC ACTIVITY 2005 2006 2007 2008 2009**<br />
(Preliminary)<br />
2009*<br />
(Revised)<br />
Agriculture, Forestry and Fishing (0.6) 2.2 0.4 2.6 7.1 7.2<br />
Mining and Quarrying 7.9 7.3 3.6 2.5 15.8 20.3<br />
PRIMARY SECTOR 2.5 4.1 1.7 2.5 10.5 12.4<br />
Manufacturing 2.9 5.7 3.0 1.8 2.5 2.2<br />
Electricity, Gas and Water 5.4 10.5 1.0 (1.2) 8.6 6.8<br />
Construction 21.2 14.4 20.0 8.7 15.5 9.5<br />
SECONDARY SECTOR 10.0 9.8 10.0 4.7 9.4 6.2<br />
Wholesale and Retail trade 2.4 2.0 2.4 2.7 3.0 2.3<br />
Restaurants, Bars and Hotels 11.7 16.1 9.6 5.0 (14.5) (13.4)<br />
Transport, Storage and Communications 11.0 22.1 19.2 15.8 3.1 7.6<br />
Financial Institutions and Insurance 3.3 4.0 4.1 8.7 5.0 5.2<br />
Real Estate and Business services 3.2 3.2 3.1 3.0 3.1 2.8<br />
Community, Social and Personal Services 11.4 9.0 12.5 11.7 6.8 8.6<br />
TERTIARY SECTOR 5.4 6.7 7.1 7.2 3.0 3.9<br />
Less: FISIM 2.5 2.5 2.5 2.5 2.5 3.3<br />
TOTAL GROSS VALUE ADDED 5.8 7.0 6.7 5.7 6.3 6.4<br />
Taxes less subsidies on Products (0.1) (3.1) (0.3) 5.7 6.3 6.4<br />
TOTAL G.D.P. AT MARKET PRICES 5.3 6.2 6.2 5.7 6.3 6.4<br />
Source: 2009 National Accounts Statistics, CSO<br />
**Preliminary<br />
**Revised<br />
<strong>The</strong> Mining and Quarrying industry grew<br />
by 20.3 percent in 2009, up from only 2.5<br />
percent in 2008. This is mainly due to an<br />
increase in copper output, which<br />
increased by 21.1 percent from 575, 036.8<br />
metric tonnes produced in 2008 to 696,<br />
411.1 metric tonnes in 2009. This is despite<br />
the price <strong>of</strong> copper declining from an<br />
average <strong>of</strong> 315.39 US Cents per pound in<br />
2008 to 233.71 US Cents per pound in<br />
2009.<br />
Trend in Copper Prices in US Cents/lb, 2007-2009<br />
Source: Statistics Fortnightly, Bank <strong>of</strong> <strong>Zambia</strong><br />
24
<strong>The</strong> Agriculture, forestry and fishing<br />
industry registered a growth <strong>of</strong> 7.2<br />
percent in 2009 from 2.6 percent in 2008.<br />
Maize production is estimated to have<br />
increased by 30.7 percent from 1.4 million<br />
metric tonnes in the 2007/2008<br />
agriculture season to 1.9 million metric<br />
tonnes in the 2008/2009 agriculture<br />
season.<br />
<strong>The</strong> Construction industry is estimated to<br />
have grown by 9.5 percent in 2009<br />
compared to a growth <strong>of</strong> 8.7 percent in<br />
2008. With increased production and the<br />
general decline in the price <strong>of</strong> cement,<br />
domestic cement sales increased by 38.1<br />
percent in 2009. <strong>The</strong> average price <strong>of</strong> a<br />
50 kg bag <strong>of</strong> Portland cement declined<br />
from K71, 093 in December 2008 to K61,<br />
168 in December 2009.<br />
Decline in the Price <strong>of</strong> Cement in 2009<br />
Source: Prices Statistics, CSO<br />
While the primary and secondary sectors<br />
registered strong growth, the tertiary (or<br />
services) sector registered relatively<br />
modest growth. All industries in this sector<br />
recorded lower growths in 2009<br />
compared to 2008, with noticeable<br />
declines in the Hotels, bars and<br />
restaurants, Rail and the Air transport<br />
industries.<br />
Industry Percentage Point Contribution to GDP Growth Rate<br />
<strong>The</strong> Agriculture, forestry and fishing,<br />
Mining and quarrying and the<br />
Construction industries collectively<br />
accounted for nearly three-fifths <strong>of</strong> the<br />
overall growth rate <strong>of</strong> 6.4 percent.<br />
Mining and quarrying regained its<br />
dominant position as the main<br />
contributor to the total economy. Of the<br />
6.4 percent GDP growth rate, the Mining<br />
and Quarrying industry contributed 1.7<br />
percentage points, followed by<br />
Construction (1.1 percentage points) and<br />
Agriculture, forestry and fishing (0.9<br />
percentage points). This was followed by<br />
Transport and Communications as well as<br />
Community, social and personal services,<br />
each accounting for 0.7 percentage<br />
points.<br />
25
Percentage Point Contribution <strong>of</strong> the Industries to the 6.4 Percent Overall Growth<br />
C ommunity, social<br />
& personal<br />
S ervices, 0.7<br />
R eal estate &<br />
business S ervices,<br />
0.2<br />
F inancial&<br />
insurance, 0.4<br />
F IS IM, -0.1<br />
T axes, 0.4<br />
Agriculture, forestry<br />
& fishing, 0.9<br />
Mining&Quarrying,<br />
1.7<br />
T ransport, 0.7<br />
Hotels, bars&<br />
restaurants, -0.4<br />
T rade, 0.4<br />
C onstruction, 1.1<br />
E lectricity&water,<br />
0.2<br />
Manufacturing, 0.2<br />
Source: 2009 National Accounts Statistics, CSO<br />
26
INDUSTRIAL PRODUCTION<br />
Industrial Output increases in 2009<br />
<strong>The</strong> total volume index <strong>of</strong> industrial<br />
production increased by 8.7 percent in<br />
2009 compared to an increase <strong>of</strong> 4.9<br />
percent in 2008. <strong>The</strong> increase was mainly<br />
attributed to the growth in mining and<br />
electricity generation sectors.<br />
Quarterly Index <strong>of</strong> Industrial Production for 2008 and 2009 (2000=100)<br />
PERIOD<br />
TOTAL<br />
INDEX<br />
TOTAL<br />
MININ<br />
G<br />
Coal<br />
MINING<br />
Nonferrou<br />
s Ore<br />
Stone<br />
Quarr<br />
ying<br />
TOTAL<br />
MANUFA<br />
CTURING<br />
Food,<br />
Beverage<br />
s &<br />
Tobacco<br />
Source: 2008 and 2009 Index <strong>of</strong> Industrial Production, CSO<br />
Textile,<br />
Clothing &<br />
Leather<br />
Wood &<br />
Wood<br />
Products<br />
MANUFACTURING<br />
Paper<br />
&<br />
Paper<br />
Produ<br />
cts<br />
Chemicals<br />
, Rubbers<br />
& Plastics<br />
Nonmetallic<br />
Mineral<br />
Products<br />
Copper and coal output up, cobalt output down<br />
Basic<br />
Metal<br />
Industries<br />
WEIGHT 1.000 0.350 0.005 0.242 0.103 0.511 0.235 0.060 0.006 0.017 0.059 0.025 0.009 0.100 0.139<br />
TOTAL<br />
ELECTRICI<br />
TY<br />
2008 Q1 159.0 243.1 7.4 227.8 289.4 113.5 131.9 54.8 205.3 107.4 134.2 125.4 80.2 88.8 114.6<br />
2008 Q2 158.1 219.5 0.1 197.0 281.9 125.3 169.0 37.3 216.8 123.1 98.2 152.7 86.6 82.5 124.1<br />
2008 Q3 163.5 217.9 0.0 196.2 278.3 137.8 189.5 21.7 159.5 88.4 95.0 155.1 84.8 118.3 121.8<br />
2008 Q4 164.0 209.8 0.0 196.8 249.6 142.5 196.4 48.7 167.2 135.2 76.3 164.2 68.9 112.0 127.8<br />
2008 161.1 222.5 1.9 204.4 274.8 129.8 171.7 40.6 1<strong>87</strong>.2 113.5 101.0 149.3 80.1 100.4 122.1<br />
2009 Q1 174.0 276.3 0.0 265.9 312.8 114.7 136.9 45.5 219.4 118.8 137.1 136.7 82.1 81.2 134.9<br />
2009 Q2 173.3 253.7 83.1 250.4 269.0 129.2 177.3 29.2 230.3 132.1 98.9 166.6 84.9 81.9 132.8<br />
2009 Q3 179.9 258.6 48.6 252.2 282.7 138.9 196.7 15.2 162.2 96.7 85.9 181.2 76.9 109.0 133.0<br />
2009 Q4 173.4 226.0 0.0 210.1 273.1 149.6 209.9 40.1 156.2 134.8 80.8 182.9 61.0 116.0 128.7<br />
2009 175.2 253.6 32.9 244.7 284.4 133.1 180.2 32.5 192.1 120.6 100.7 166.9 76.2 97.0 132.3<br />
YEAR-ON-YEAR PERCENTAGE CHANGES e.g.( Q2 2005/Q2 2004-1)x100<br />
2008 Q1 8.5 17.5 (12.8) 15.8 20.7 3.3 2.2 (10.2) 16.4 16.3 15.2 6.5 24.3 (2.4) (11.5)<br />
2008 Q2 3.2 3.8 (99.0) (1.7) 14.4 3.7 4.2 (12.1) 26.4 32.8 2.9 3.0 41.8 (3.5) (0.8)<br />
2008 Q3 5.5 8.7 (99.8) (6.7) 49.5 3.0 6.3 (34.4) (3.1) 27.6 (1.2) 1.1 26.2 (2.5) 2.0<br />
2008 Q4 2.8 7.1 (99.9) 2.8 16.4 (0.9) (0.4) (35.7) 7.7 39.5 6.0 9.7 1.6 (1.8) 1.3<br />
2008 4.9 9.3 (77.4) 2.4 23.9 2.2 3.0 (23.4) 12.1 29.3 6.2 5.0 23.0 (2.5) (2.4)<br />
2009 Q1 9.5 13.7 (99.9) 16.8 8.1 1.1 3.8 (17.0) 6.9 10.6 2.1 9.0 2.3 (8.5) 17.7<br />
2009 Q2 9.6 15.6 82990.9 27.1 (4.6) 3.2 4.9 (21.7) 6.2 7.3 0.6 9.1 (1.9) (0.8) 7.0<br />
2009 Q3 10.0 18.7 441336.4 28.6 1.6 0.8 3.8 (29.8) 1.7 9.4 (9.6) 16.8 (9.2) (7.8) 9.1<br />
*2009 Q4 5.7 7.7 0.0 6.8 9.4 5.0 6.9 (17.7) (6.6) (0.3) 5.8 11.4 (11.4) 3.6 0.6<br />
2009 8.7 14.0 1648.9 19.7 3.5 2.6 4.9 (20.0) 2.6 6.2 (0.3) 11.7 (4.8) (3.4) 8.4<br />
Fabricat<br />
ed<br />
Metal<br />
Product<br />
s<br />
<strong>The</strong> mining and quarrying sector<br />
recorded an increase <strong>of</strong> 14.0 percent in<br />
2009 compared to an increase <strong>of</strong> 9.3<br />
percent in 2008. <strong>The</strong> growth in output was<br />
due to increased production <strong>of</strong> copper<br />
and coal.<br />
Quarterly Production <strong>of</strong> Copper, Cobalt and Coal in metric tonnes for 2008 and 2009<br />
PERIOD<br />
2008 2009<br />
Q1 Q2 Q3 Q4 Total Q1 Q2 Q3 Q4 Total<br />
%Change<br />
COPPER 139,2<strong>87</strong>.5 136,523.0 144,186.4 155,039.9 575,036.8 164,810.0 169,935.0 191,859.3 169,807 696,411.1 21.1<br />
COBALT 1,014.7 960.7 1,105.2 972.8 4,053.4 1,040.0 1,360.0 666.5 593.4 3,659.9 (9.7)<br />
COAL 3,481.0 12.0 0.0 0.0 3,493.0 0.0 34,280.0 21,703.0 0.0 55,983.0 1,502.7<br />
Source: 2008 and 2009 Index <strong>of</strong> industrial production, CSO<br />
27
<strong>The</strong> coal mining industry increased its<br />
output by a colossal 1648.9 percent in<br />
2009 compared to a decline <strong>of</strong> 77.4<br />
percent in 2008. <strong>The</strong> resumption <strong>of</strong><br />
production at one <strong>of</strong> the major coal<br />
mines was the main reason for the<br />
increase in production. <strong>The</strong> actual<br />
production <strong>of</strong> coal increased by 1,502.7<br />
percent from 3493.0 metric tonnes in 2008<br />
to 55,983.0 metric tonnes in 2009.<br />
<strong>The</strong> Non-ferrous mining sectors, which<br />
include copper and cobalt mining,<br />
increased output by 19.7 percent in 2009<br />
compared to a growth <strong>of</strong> 2.4 percent in<br />
2008. <strong>The</strong> increase in production is<br />
mainly attributed to increased<br />
production <strong>of</strong> copper.<br />
<strong>The</strong> actual copper production increased<br />
by 21.1percent from 575,036.8 metric<br />
tonnes in 2008 to 696,411.1 metric tonnes<br />
in 2009. However, the actual cobalt<br />
production declined by 9.7 percent from<br />
4,053.4 metric tonnes in 2008 to 3,659.9<br />
metric tonnes in 2009.<br />
Manufacturing goes up marginally<br />
<strong>The</strong> manufacturing industry showed an<br />
increase <strong>of</strong> 2.6 percent in 2009<br />
compared to an increase <strong>of</strong> 2.2 percent<br />
in 2008. <strong>The</strong> increase is mainly attributed<br />
to growth in the food, beverages and<br />
tobacco sector. A notable growth was<br />
also registered in the Non-metallic<br />
mineral products sector.<br />
Food, beverages & tobacco, Nonmetallic<br />
mineral products, Wood and<br />
Paper output increases. Textiles, Basic<br />
mineral products, Fabricated mineral<br />
products and Chemical products output<br />
decreases<br />
<strong>The</strong>re was a 4.9 percent growth in output<br />
for the food, beverages and tobacco<br />
industry in 2009 compared with a growth<br />
<strong>of</strong> 3.0 percent in 2008. Increased<br />
production <strong>of</strong> grain mill products, sugar,<br />
carbonated s<strong>of</strong>t drinks and clear beer<br />
were the main reason for the increase in<br />
output.<br />
Output for the non-metallic mineral<br />
products industry went up by 11.7<br />
percent in 2009 compared to a growth <strong>of</strong><br />
5.0 percent in 2008. This is mainly due to<br />
increased production <strong>of</strong> cement. Recapitalization<br />
<strong>of</strong> the industry was cited as<br />
one <strong>of</strong> the major reason to the increase<br />
in production.<br />
<strong>The</strong> output in Textile, clothing and leather<br />
products further reduced by 20.0 percent<br />
in 2009 compared with a reduction <strong>of</strong><br />
23.4 percent in 2008. <strong>The</strong> sector has been<br />
experiencing negative growth since<br />
2004.<br />
Output in chemicals, rubber and plastic<br />
products declined marginally by about<br />
0.3 percent in 2009 compared to that <strong>of</strong><br />
the year 2008. <strong>The</strong> negative growth was<br />
attributed to decreases in the production<br />
<strong>of</strong> chemical fertilizers, detergents, soaps,<br />
cosmetics and rubber lining.<br />
Production <strong>of</strong> basic metals reduced by<br />
4.8 percent in 2009 in comparison with a<br />
significant growth <strong>of</strong> 23.0 percent in 2008.<br />
<strong>The</strong> decline is mainly due to reduced<br />
production <strong>of</strong> iron and steel castings.<br />
Electricity generation increases<br />
Electricity generation index has shown an<br />
increase <strong>of</strong> 8.4 percent in the period<br />
under review. This was mainly because <strong>of</strong><br />
increased electricity output at Kafue<br />
Gorge Power Station. <strong>The</strong> Mainhydropower<br />
stations, that account for<br />
about 99 percent <strong>of</strong> the total generation<br />
<strong>of</strong> electricity, increased generation by 8.2<br />
percent from 9.4 million kwh in 2008 to<br />
10.2 million kwh in 2009. In the same<br />
period, an increase <strong>of</strong> 8.8 percent in<br />
generation was registered by the minihydropower<br />
stations. Diesel power<br />
generation also increased output by 8.6<br />
percent.<br />
28
Quarterly Generation <strong>of</strong> Electricity for 2008 and 2009 (KWh)<br />
2008<br />
Generation Q1 Q2 Q3 Q4 Total Q1 Q2 Q3 Q4 Total<br />
2009<br />
%<br />
Change<br />
Main Hydro 2,049,162 2,351,470 2,519,217 2,518,169 9,438,018 2,410,800 2,519213 2,753,570 2,528,997 10,212,580 8.2<br />
Mini Hydro 16,468 21,715 26,245 19,772 84,200 21,609 21,221 23,898 24,849 91,577 8.8<br />
Diesel 3,014 3,019 2,694 3,056 11,783 3,035 2,994 3,243 3,521 12,793 8.6<br />
Total 2,068,644 2,376,204 2,548,156 2,540,997 9,534,001 2,435,444 2,543,428 2,780,711 2,557,367 10,316,950 8.2<br />
Source: 2008 and 2009 Index <strong>of</strong> industrial production, CSO<br />
LABOURFORCE<br />
Formal Sector Employment reduces in 2008<br />
<strong>The</strong> 2008 Employment and Earnings<br />
Inquiry Report reveals that the estimated<br />
number <strong>of</strong> workers in the formal sector<br />
reduced as the year progressed. Though<br />
the number <strong>of</strong> workers increased from<br />
541,548 in the first quarter to 544,339 in<br />
the second quarter, it reduced to 532,274<br />
and 533,530 in the third and fourth<br />
quarters, respectively.<br />
Formal Sector Employment by Quarter<br />
No. <strong>of</strong> workers<br />
546,000<br />
544,000<br />
544,339<br />
542,000<br />
540,000<br />
541,548<br />
538,000<br />
536,000<br />
534,000<br />
532,000<br />
530,000<br />
528,000<br />
532,274<br />
533,530<br />
526,000<br />
1st Quarter 2nd Quarter 3rd Quarter 4th Quarter<br />
Reference Period<br />
Source: 2008 Employment and Earnings Inquiry Report<br />
<strong>The</strong> Community, social and personal<br />
services industry continued to have the<br />
highest percentage share <strong>of</strong> workers in all<br />
the quarters in the formal sector while the<br />
Electricity, Gas and Water industry had<br />
the lowest. Wholesale and retail trade<br />
industry accounted for the second<br />
largest percentage share <strong>of</strong> workers in<br />
the formal sector. For instance in the<br />
fourth quarter, Community, social and<br />
personal services industry accounted for<br />
37 percent, followed by Wholesale and<br />
retail trade which had 16 percent and<br />
Electricity, Gas and water had 2 percent.<br />
29
Formal Sector Employment by Quarter and Industry<br />
Industry<br />
2008 Formal sector Employment<br />
1st Quarter 2nd Quarter 3rd Quarter 4th Quarter<br />
Number % Number % Number % Number %<br />
Agriculture, Forestry and Fishing 72,246 13.3 60,265 11.1 71,619 13.5 59,684 11.2<br />
Mining and Quarrying 53,610 9.9 47,910 8.8 52,477 9.9 46,829 8.8<br />
Manufacturing 46,884 8.7 45,2<strong>87</strong> 8.3 45,471 8.5 43,594 8.2<br />
Electricity, Gas and Water 11,410 2.1 11,054 2.0 11,284 2.1 10,858 2.0<br />
Construction 12,840 2.4 14,075 2.6 11,566 2.2 13,136 2.5<br />
Wholesale and Retail Trade 83,534 15.4 <strong>87</strong>,296 16.0 81,420 15.3 84,883 15.9<br />
Transportation and Storage 22,442 4.1 28,098 5.2 22,080 4.1 27,222 5.1<br />
Financial, Insurance and Real Estate 54,918 10.1 52,550 9.7 54,286 10.2 51,726 9.7<br />
Community, Social and Personal 183,664 33.9 197,804 36.3 182,071 34.2 195,599 36.7<br />
Total 541,548 100 544,339 100 532,274 100 533,530 100<br />
Source: CSO, 2008 Employment and Earnings Inquiry Report<br />
<strong>The</strong> results also show that the general<br />
decline in the number <strong>of</strong> workers<br />
between first and fourth quarters was<br />
due to reductions in the number <strong>of</strong><br />
workers mainly in the Agriculture, Forestry<br />
and Fishing; Mining and Quarrying;<br />
Manufacturing; and Financial, Insurance<br />
and Real estate industries. <strong>The</strong> number<br />
<strong>of</strong> workers in the Agriculture, Forestry and<br />
Fishing industry reduced from 72,246 in<br />
the first quarter to 59,684 in the fourth<br />
quarter. Similarly, those in the Mining and<br />
Quarrying industry also reduced from<br />
53,610 in the first quarter to 46,829 in the<br />
fourth quarter while those in the<br />
Manufacturing industry declined from<br />
46,884 to 43,594 over the same period.<br />
However, other industries like<br />
Construction; Wholesale and Retail trade;<br />
Transportation and Storage; and<br />
Community, Social and Personal services<br />
registered increases in the number <strong>of</strong><br />
workers.<br />
In terms <strong>of</strong> quarterly percentage<br />
changes, industries like Agriculture,<br />
Forestry and Fishing, and the Mining and<br />
Quarrying experienced major declines in<br />
the number <strong>of</strong> workers <strong>of</strong> 17 percent and<br />
11 percent, respectively, during the first<br />
and second quarter period. During the<br />
second and third quarter period, major<br />
declines were observed in the<br />
Transportation and Storage industry (21<br />
percent) and Construction industry (18<br />
percent).<br />
Formal Sector Employment percent change between quarters<br />
No. Of<br />
workers<br />
in the<br />
1st<br />
Quarter<br />
No. Of<br />
workers<br />
in the<br />
2nd<br />
Quarter<br />
Percent<br />
Change<br />
between<br />
1st Qtr &<br />
2ndQtr<br />
No. Of<br />
workers<br />
in the<br />
2nd<br />
Quarter<br />
No. Of<br />
workers<br />
in the<br />
3rd<br />
Quarter<br />
Percent<br />
Change<br />
between<br />
2nd Qtr<br />
& 3rd Qtr<br />
No. Of<br />
workers<br />
in the<br />
3rd<br />
Quarter<br />
No. Of<br />
workers<br />
in the<br />
4th<br />
Quarter<br />
Percent<br />
Change<br />
between<br />
3rd Qtr &<br />
4th Qtr<br />
Industry<br />
Agriculture, Forestry and Fishing 72,246 60,265 -16.6 60,265 71,619 18.8 71,619 59,684 -16.7<br />
Mining and Quarrying 53,610 47,910 -10.6 47,910 52,477 9.5 52,477 46,829 -10.8<br />
Manufacturing 46,884 45,2<strong>87</strong> -3.4 45,2<strong>87</strong> 45,471 0.4 45,471 43,594 -4.1<br />
Electricity, Gas and Water 11,410 11,054 -3.1 11,054 11,284 2.1 11,284 10,858 -3.8<br />
Construction 12,840 14,075 9.6 14,075 11,566 -17.8 11,566 13,136 13.6<br />
Wholesale and Retail Trade 83,534 <strong>87</strong>,296 4.5 <strong>87</strong>,296 81,420 -6.7 81,420 84,883 4.3<br />
Transportation and Storage 22,442 28,098 25.2 28,098 22,080 -21.4 22,080 27,222 23.3<br />
Financial, Insurance and Real Estate 54,918 52,550 -4.3 52,550 54,286 3.3 54,286 51,726 -4.7<br />
Community, Social and Personal 183,664 197,804 7.7 197,804 182,071 -8.0 182,071 195,599 7.4<br />
Total 541,548 544,339 0.5 544,339 532,274 -2.2 532,274 533,530 0.2<br />
Source: 2008 Employment and Earnings Inquiry Report<br />
30
DEMOGRAPHY<br />
Knowledge on HIV/AIDS medication increases<br />
<strong>The</strong> 2009 Sexual Behavior survey results<br />
show that knowledge on anti-retroviral<br />
medication for the treatment <strong>of</strong> HIV/AIDS<br />
has increased over the years. <strong>The</strong> results<br />
show that the proportion <strong>of</strong> persons with<br />
knowledge <strong>of</strong> special medications for the<br />
treatment <strong>of</strong> HIV/AIDS increased from<br />
55.2 percent in 2005 to 94.0 percent in<br />
2009.<br />
Analysis by residence shows that the<br />
increase in knowledge <strong>of</strong> HIV/AIDS<br />
medication was more in rural areas than<br />
in urban areas. <strong>The</strong> results indicate that<br />
knowledge <strong>of</strong> HIV/AIDS medication in<br />
rural areas increased from 46.2 percent in<br />
2005 to 92.3 percent in 2009. In urban<br />
areas, Knowledge <strong>of</strong> HIV/AIDS<br />
medication increased from 71.8 percent<br />
in 2005 to 96.7 percent in 2009.<br />
Analysis by sex shows that in 2005,<br />
knowledge <strong>of</strong> HIV/AIDS medication was<br />
higher among males (57.4 percent) than<br />
females (53.1 percent). However, in 2009,<br />
knowledge on HIV/AIDS was widespread<br />
for both males and females with 93.8<br />
percent and 94.2 percent, respectively.<br />
Percent <strong>of</strong> respondents with knowledge <strong>of</strong> special medications for the treatment <strong>of</strong><br />
HIV/AIDS and <strong>of</strong> where to obtain these medications by sex and residence, 2005 and 2009<br />
Knows about anti-retroviral medications for Knows where to obtain anti-retroviral<br />
Background<br />
treating HIV/AIDS (%)<br />
medications (%)<br />
Characteristics<br />
2005 2009 2005 2009<br />
Males<br />
Urban 73.2 96.3 68.3 93.3<br />
Rural 48.8 92.2 43.0 88.8<br />
Total 57.4 93.8 51.9 90.6<br />
Females<br />
Urban 70.4 97.1 66.2 93.2<br />
Rural 43.7 92.4 37.7 88.1<br />
Total 53.1 94.2 47.7 90.1<br />
Residence<br />
Urban 71.8 96.7 67.2 93.2<br />
Rural 46.2 92.3 40.3 88.5<br />
All respondents 55.2 94.0 49.7 90.3<br />
Source: 2005 and 2009 <strong>Zambia</strong> Sexual Behavior Survey<br />
<strong>The</strong> results further show that the<br />
proportion <strong>of</strong> persons who know where to<br />
obtain medications for treating HIV/AIDS<br />
has also increased over the years. <strong>The</strong><br />
proportion <strong>of</strong> persons who know where to<br />
obtain medications for treating HIV/AIDS<br />
has increased from 49.7 percent in 2005<br />
to 90.3 percent in 2009. In rural areas, the<br />
proportion <strong>of</strong> persons with knowledge <strong>of</strong><br />
where to get medication increased from<br />
40.3 percent in 2005 to 88.5 percent in<br />
2009. In urban areas the increase was<br />
from 67.2 percent to 93.2 percent during<br />
the same period.<br />
31
LAYMAN AND STATISTICS<br />
An index <strong>of</strong> industrial production (IIP) measures changes over time in the volume <strong>of</strong> work<br />
done in various sectors <strong>of</strong> industry, limited to the production <strong>of</strong> commodities, excluding<br />
agriculture and services. More precisely, it is defined as the ratio <strong>of</strong> the volume <strong>of</strong><br />
commodities produced within a specified group <strong>of</strong> industries in a given time period to<br />
the volume produced in the same group <strong>of</strong> industries in a specified base period.<br />
Note that the IIP only covers mining and quarrying, manufacturing, and electricity.<br />
IIP growth rate<br />
<strong>The</strong> growth rate in the IIP refers to the change between the current and the previous<br />
period indices expressed as a percentage. This is a measure <strong>of</strong> the increase/decrease in<br />
output (production) from one period to another.<br />
CENSUS SCHEDULED FOR OCTOBER<br />
<strong>2010</strong>!<br />
<strong>The</strong> Census <strong>of</strong> Population and Housing is carried out under the provisions <strong>of</strong> the Census<br />
and Statistics ACT Chapter 127 <strong>of</strong> the laws <strong>of</strong> <strong>Zambia</strong>. Under this ACT the <strong>Central</strong><br />
<strong>Statistical</strong> <strong>Office</strong> is mandated to carry out a Census <strong>of</strong> Population and Housing every ten<br />
years. <strong>The</strong> first comprehensive census was carried out in 1969. Since then, three more<br />
censuses have been carried out, in 1980, 1990 and 2000. <strong>The</strong> next census will be carried<br />
out this year (<strong>2010</strong>).<br />
Under this ACT, all persons residing in <strong>Zambia</strong>, except foreign diplomats accredited to<br />
<strong>Zambia</strong> are required to provide the necessary information.<br />
WHAT IS A CENSUS?<br />
A Census <strong>of</strong> Population and Housing is defined as the total process <strong>of</strong> collecting,<br />
compiling, evaluating, analyzing and publishing demographic, economic and social data<br />
pertaining, at a specified time or times, to all persons in a designated area or the whole<br />
country. It is the primary source <strong>of</strong> information about the population <strong>of</strong> a country. It is<br />
undertaken at regular intervals, usually after ten years.<br />
WHY HOLD A CENSUS?<br />
<strong>The</strong> main objective <strong>of</strong> conducting a Population Census is to enumerate all the people in<br />
the country in order to provide the Government, private organizations, individuals, and<br />
other stakeholders with the number <strong>of</strong> persons in each district, township, locality, village,<br />
etc., according to age, sex, and other characteristics. For every aspect <strong>of</strong> planning, it is<br />
essential to know the size, structure and distribution <strong>of</strong> the population <strong>of</strong> a country. For<br />
instance, to plan for education, the country needs to have numbers <strong>of</strong> the school going<br />
population by sex and age.<br />
CENSUS ACTIVITIES<br />
Being a huge undertaking, the census encompasses various activities for its success. <strong>The</strong>se<br />
include pre census, census and post census activities. Pre census activities include census<br />
32
mapping, pilot census, formation <strong>of</strong> committees to coordinate all aspects <strong>of</strong> the census,<br />
publicity, stakeholder consultations, recruitment and procurement.<br />
<strong>The</strong> pilot census is carried out on sample basis to test the methodology <strong>of</strong> the census<br />
including questionnaire suitability, logistical arrangements, mapping, staffing and other<br />
resource requirements. <strong>The</strong> main census involves collection <strong>of</strong> data on all persons in the<br />
country. <strong>The</strong> post census activities include Post Enumeration Survey, data processing and<br />
analysis, report writing and dissemination.<br />
CENSUS MAPPING<br />
One <strong>of</strong> the most important activities that the <strong>of</strong>fice carries out before a census is the<br />
census mapping exercise. <strong>The</strong> objective <strong>of</strong> this exercise is to delineate the country into<br />
enumeration areas (EAS) to ensure that there is no duplication or omission <strong>of</strong> persons or<br />
households during the Census.<br />
A census mapping is also undertaken in order to:<br />
• Determine the location <strong>of</strong> the population in advance <strong>of</strong> the census enumeration in<br />
order to make possible the recruitment, training and allocation <strong>of</strong> a sufficient<br />
number <strong>of</strong> enumerators to ensure that census enumeration is completed in time<br />
without omissions or duplications;<br />
• Establish the framework for sample surveys prior to, during or after census<br />
enumeration;<br />
• Enable the <strong>Central</strong> <strong>Statistical</strong> <strong>Office</strong> to provide results <strong>of</strong> the census for areas whose<br />
locations are known.<br />
<strong>The</strong> <strong>2010</strong> census mapping strategy has involved the use <strong>of</strong> the Global Positioning System<br />
(GPS) in rural areas and satellite imagery in major and small urban areas to delineate<br />
enumeration areas. <strong>The</strong> GPS is a modern tool that enables collection <strong>of</strong> precise geo<br />
codes. So far, 69.4 percent <strong>of</strong> wards in the county have been mapped.<br />
PILOT CENSUS<br />
<strong>The</strong> Pilot Census was conducted in February, <strong>2010</strong>. Two districts were selected from each<br />
<strong>of</strong> the provinces except for <strong>Central</strong>, Copperbelt and Lusaka where three districts were<br />
selected from each. Both rural and urban districts were selected in each province. In<br />
each <strong>of</strong> the selected districts, mapped and unmapped areas were selected. This was<br />
done in order to have a “feel” <strong>of</strong> enumeration in rural and urban areas; and in mapped<br />
and unmapped areas, even when it is anticipated that mapping will be completed at the<br />
time <strong>of</strong> enumeration.<br />
HELP THE CENSUS HELP YOU, BE COUNTED!<br />
For details, visit the CSO website: www.zamstats.gov.zm<br />
33
SELECTED SOCIO-ECONOMIC INDICATORS<br />
PROJECTED MID-YEAR POPULATION 2000-<strong>2010</strong><br />
2000 2001 2002 2003 2004 2005 2006 2007 2008 2009 <strong>2010</strong><br />
Total Population 9,885,591 10,089,492 10,409,441 10,744,380 11,089,691 11,441,461 11,798,678 12,160,516 12,525,791 12,896,830 13,272,553<br />
Population Growth<br />
2.8<br />
Rate 2.5 3.1 3.1 3.1 3.1 3.1 3 3 2.9 2.9<br />
Life Expectancy at<br />
Birth 50 51.8 51.9 52.4 52.4 52.6 51.9 51.4 51.3 51.2<br />
51.3<br />
POPULATION BY PROVINCE<br />
<strong>Central</strong> 1,012,257 1,032,574 1,066,992 1,103,3<strong>87</strong> 1,141,256 1,180,124 1,219,980 1,260,491 1,301,776 1,343,835 1,386,628<br />
Copperbelt 1,581,221 1,611,569 1,662,155 1,714,225 1,767,165 1,820,443 1,<strong>87</strong>4,081 1,927,576 1,980,824 2034012 2,088,14<br />
Eastern 1,306,173 1,348,070 1,391,690 1,436,120 1,482,290 1,530,118 1,579,960 1,631,890 1,684,910 1,740,180 1,797,7<strong>87</strong><br />
Luapula 775,353 791,067 817,326 845,076 <strong>87</strong>3,969 903,746 934,317 965,605 997,579 1,030,572 1,064,422<br />
Lusaka 1,391,329 1,413,010 1,453,690 1,495,730 1,538,000 1,579,769 1,620,730 1,660,070 1,697,730 1,733,830 1,768,205<br />
Northern 1,258,696 1,277,250 1,315,650 1,357,540 1,401,340 1,445,730 1,490,330 1,534,170 1,577,310 1,619,980 1,662,241<br />
North-western 583,350 596,010 616,496 638,004 660,322 683,367 707,074 731,351 756,261 781,800 808,046<br />
Southern 1,212,124 1,235,134 1,275,470 1,318,161 1,362,382 1,407,433 1,453,324 1,499,462 1,545,880 1,592,864 1,706,468<br />
Western 765,088 774,929 795,247 816,983 839,757 863294 8<strong>87</strong>,540 912,226 937,419 963,107 989,345<br />
Source: CSO, Population Projections Report<br />
Note: 2000 figures are from the 2000 Census <strong>of</strong> Population and Housing while the 2001 to <strong>2010</strong> figures are the Population Projections Report<br />
34
GROSS DOMESTIC PRODUCT 2001-2009<br />
2001 2002 2003 2004 2005 2006 2007 2008 2009*<br />
Total GDP in current prices (K' billion) 13,194 16,324 20,551 25,993 32,042 38,561 46,195 55,079 64,326<br />
Total GDP in constant 1994 prices (K'billion) 2,620 2,707 2,845 2,999 3,159 3,356 3,564 3,765 4,003<br />
Population 10,089,492 10,409,441 10,744,380 11,089,691 11,441,461 11,798,678 12,160,516 12,525,791 12,896,830<br />
GDP per capital in current prices 1,307,669 1,568,234 1,912,731 2,343,902 2,800,474 3,268,231 3,798,753 4,397,227 4,9<strong>87</strong>,744<br />
GDP per capita in constant 1994 prices 259,656 260,024 264,835 270,454 276,141 284,450 293,079 300,615 310,388<br />
GDP growth rates in constant 1994 prices 4.9 3.3 5.1 5.4 5.3 6.2 6.2 5.7 6.3<br />
Growth in GDP per capita at constant prices 1.8 0.1 1.9 2.1 2.1 3.0 3.0 2.6 3.3<br />
PERCENTAGE CHANGES IN GROSS DOMESTIC PRODUCT BY KIND OF ECONOMIC ACTIVITY - CONSTANT 1994 PRICES<br />
KIND OF ECONOMIC ACTIVITY 2001 2002 2003 2004 2005 2006 2007 2008 2009*<br />
Agriculture, Forestry and Fishing (2.6) (1.7) 5.0 4.3 (0.6) 2.2 0.4 2.6 7.1<br />
Agriculture (6.0) (6.3) 8.0 6.1 (4.0) 3.0 (2.7) 1.9 12.4<br />
Forestry 4.3 4.3 4.3 4.3 3.6 1.4 3.7 3.7 3.6<br />
Fishing (5.0) (0.7) (0.7) (0.7) 0.5 1.8 1.8 1.8 1.5<br />
Mining and Quarrying 14.0 16.4 3.4 13.9 7.9 7.3 3.6 2.5 15.8<br />
Metal Mining 15.0 17.1 3.3 13.5 7.1 9.0 4.4 2.5 15.9<br />
Other mining and quarrying (15.0) (13.0) 10.7 35.8 42.9 (45.8) (45.5) (3.5) 1.8<br />
PRIMARY SECTOR 1.9 3.8 4.5 7.5 2.5 4.1 1.7 2.5 10.5<br />
Manufacturing 4.2 5.7 7.6 4.7 2.9 5.7 3.0 1.8 2.5<br />
Food, Beverages and Tobacco 5.3 5.4 8.6 5.8 3.6 8.9 7.6 3.0 4.4<br />
Textile, and leather industries 2.3 6.2 3.2 (1.9) (2.9) (1.3) (19.5) (23.6) (18.9)<br />
Wood and wood products 5.7 7.5 11.4 4.2 3.6 0.7 3.7 12.1 6.6<br />
Paper and Paper products 3.8 2.2 8.2 2.5 10.6 0.3 0.7 29.3 8.8<br />
Chemicals, rubber and plastic products 4.3 10.0 4.9 8.5 3.2 4.6 4.2 5.2 1.5<br />
Non-metallic mineral products 3.5 1.7 14.9 14.4 7.4 (5.2) 2.3 5.0 9.0<br />
Basic metal products (18.0) 4.3 15.1 3.1 (2.0) 1.9 (4.8) 23.0 0.1<br />
Fabricated metal products (8.0) (4.0) 5.3 4.8 7.4 5.0 7.8 (2.5) (4.8)<br />
Electricity, Gas and Water 12.6 (5.2) 0.4 (1.7) 5.4 10.5 1.0 (1.2) 8.6<br />
Construction 11.5 17.4 21.6 20.5 21.2 14.4 20.0 8.7 15.5<br />
SECONDARY SECTOR 7.5 7.2 10.8 9.1 10.0 9.8 10.0 4.7 9.4<br />
Wholesale and Retail trade 5.4 5.0 6.1 5.0 2.4 2.0 2.4 2.5 3.0<br />
Restaurants, Bars and Hotels 24.4 4.9 6.9 6.4 11.7 16.1 9.6 5.0 (14.5)<br />
Transport, Storage and Communications 2.8 1.8 4.8 6.4 11.0 22.1 19.2 15.8 3.1<br />
Rail Transport 7.6 6.0 (8.1) (1.8) (11.6) (2.6) (18.7) (20.2) (31.2)<br />
Road Transport 0.5 1.9 3.9 4.2 6.3 6.4 6.4 13.2 13.3<br />
Air Transport 10.6 (8.4) 3.9 18.1 10.8 33.5 24.1 13.7 (29.0)<br />
Communications 0.6 7.9 10.0 5.0 23.2 40.5 33.6 21.1 12.0<br />
Financial Institutions and Insurance 0.1 3.5 3.5 3.5 3.3 4.0 4.1 8.7 5.0<br />
Real Estate and Business services 3.5 4.4 4.0 4.0 3.2 3.2 3.1 3.1 3.1<br />
Community, Social and Personal Services 5.8 1.6 1.6 0.6 11.4 9.0 12.5 11.7 6.8<br />
Public Administration & Defence/Public sanitary services 1.0 (1.0) 0.2 0.2 6.2 (8.7) 14.8 2.2 (10.4)<br />
Education 13.5 7.0 3.0 0.3 22.2 35.3 13.6 19.6 22.5<br />
Health 16.5 1.0 2.5 (0.8) (2.2) 5.2 1.0 18.3 3.3<br />
Recreation, Religious,Culture 10.0 (2.0) 4.5 4.3 34.1 22.8 9.3 26.7 8.5<br />
Personal Services 3.5 3.5 3.5 3.5 3.5 3.5 3.5 3.5 3.5<br />
TERTIARY SECTOR 4.7 3.8 4.5 4.2 5.4 6.7 7.1 7.1 3.0<br />
Less: FISIM 2.5 2.5 2.5 2.5 2.5 2.5 2.5 2.5 2.5<br />
Total Gross Value Added 4.6 4.6 6.0 6.2 5.8 7.0 6.7 5.7 6.3<br />
Taxes less subsidies 7.0 (6.7) (2.7) (2.7) (0.1) (3.1) (0.3) 5.7 6.3<br />
TOTAL G.D.P. AT MARKET PRICES 4.9 3.3 5.1 5.4 5.3 6.2 6.2 5.7 6.3<br />
Source: CSO, National Accounts Statistics *Preliminary<br />
35
INFLATION TRENDS 2000-2009<br />
Year<br />
Year on Year Inflation<br />
1990 110.6<br />
1991 99.7<br />
1992 180.7<br />
1993 128.1<br />
1994 38.3<br />
1995 46.0<br />
1996 35.2<br />
1997 18.6<br />
1998 30.6<br />
1999 20.6<br />
2000 30.1<br />
2001 18.7<br />
2002 26.7<br />
2003 17.2<br />
2004 17.5<br />
2005 15.9<br />
2006 8.2<br />
2007 8.9<br />
2008 16.6<br />
2009 9.9<br />
Source: CSO, Prices Statistics<br />
ROAD TRAFFIC ACCIDENT POLICE REPORTS, 2006 TO 2007<br />
NUMBER OF ROAD TRAFFIC<br />
NUMBER OF PERSONS NUMBER OF PERSONS SLIGHTLY ADMISSION OF GUILTY RAISED<br />
POLICE<br />
NUMBER OF PERSONS KILLED<br />
ACCIDENTS<br />
SERIOUSLY INJURED<br />
INJURED<br />
(kwacha)<br />
DIVISION/PROVINCE<br />
%<br />
%<br />
%<br />
%<br />
2006 2007<br />
2006 2007<br />
2006 2007<br />
2006 2007<br />
2006 2007<br />
Change<br />
Change<br />
Change<br />
Change<br />
<strong>Central</strong> 1,047 1,382 32 191 158 (17) 520 548 5 376 269 (28) 214,433,570 274,002,608<br />
Copperbelt 4,105 5,400 32 265 301 14 1,031 1,300 26 1,250 1,664 33 1,888,762,000 2,907,262,000<br />
Eastern 632 693 10 79 85 8 159 129 (19) 140 207 48 2<strong>87</strong>,050,916 359,249,000<br />
Luapula 185 190 3 54 51 (6) 166 203 22 17 41 141 212,895,100 332,581,000<br />
Lusaka 10,513 10,889 4 335 413 23 938 915 (2) 2,177 2,158 (1) 1,569,921,500 1,695,469,000<br />
N/Western 549 735 34 32 56 75 185 223 21 126 229 82 77,666,000 203,912,000<br />
Nothern 443 569 28 89 71 (20) 366 391 7 131 217 66 208,817,000 248,637,500<br />
Southern 1,279 1,431 12 100 105 5 407 290 (29) 234 160 (32) 958,622,500 1,106,798,000<br />
Western 342 401 17 25 26 4 191 182 (5) 127 132 4 130,000,000 1<strong>87</strong>,608,500<br />
TOTAL 19,095 21,690<br />
Source: <strong>Zambia</strong> police, road traffic section<br />
14<br />
1,170 1,266<br />
8<br />
3,963 4,181<br />
6<br />
4,578 5,077<br />
11<br />
5,548,168,586 7,315,519,608<br />
36
NUMBER OF MOTOR VEHICLE ACCIDENTS BY PROVINCE FROM 2004 TO 2008<br />
Province 2004 2005 2006 2007 2008<br />
Lusaka 6222 6646 10513 10889 11180<br />
Copperbelt 3173 3530 4105 5400 3442<br />
<strong>Central</strong> 918 937 1047 1382 1311<br />
Southern 1130 1010 1279 1431 1234<br />
N/Western 537 171 549 693 882<br />
Eastern 293 1267 632 401 469<br />
Western 314 260 342 735 470<br />
Northern 254 101 443 569 493<br />
Luapula 164 153 185 190 246<br />
Total 13005 14075 19095 21690 19727<br />
Source: RTSA/<strong>Zambia</strong> Police<br />
VEHICLE POPULATION, NUMBER OF ACCIDENTS AND NUMBER OF FATALITIES PER 10,000 VEHICLES<br />
Number <strong>of</strong> Accidents per 10, 000 Number <strong>of</strong> Fatalities per 10, 000<br />
Year Number <strong>of</strong> vehicles registered Number <strong>of</strong> Accidents Number <strong>of</strong> fatalities<br />
Vehicles<br />
Vehicles<br />
2004 111,460 13,005 892 1,167 80<br />
2005 140,225 14,075 869 1,004 62<br />
2006 183,701 19,095 1,176 1,039 64<br />
2007 227,950 21,690 1,277 952 56<br />
2008 277,<strong>87</strong>0 19,727 1,238 710 45<br />
Source: RTSA/<strong>Zambia</strong> Police<br />
POPULATION OF MOTOR VEHICLES BY CATEGORY FOR THE YEAR 2008<br />
Vehicle Category Number Percentage<br />
Motorcycle 7113 2.6<br />
Motor tricycle 83 0.0<br />
Light passenger vehicle 167055 60.1<br />
Heavy passenger vehicle 5615 2.0<br />
Light load Vehicle(GVM 3500KG or less) 56935 20.5<br />
Agriculture Tractor 1167 0.4<br />
Agriculture Trailer 167 0.1<br />
Heavy load Vehicle(GVM >3500KG ) 34900 12.6<br />
Trailers 4835 1.7<br />
Total 277<strong>87</strong>0 100.0<br />
Source: RTSA/<strong>Zambia</strong> Police<br />
37
Flow<br />
ZAMBIA’S ANNUAL TOTAL EXPORTS IN ABSOLUTE ZAMBIAN KWACHA AND U S DOLLAR 2000-2009<br />
Total Exports<br />
Year ZMK USD<br />
2000 2,716,557,648,136 869,485,416<br />
2001 3,537,206,913,419 978,788,277<br />
2002 4,069,916,925,012 944,356,533<br />
2003 4,642,039,643,203 979,298,782<br />
2004 7,526,280,115,612 1,577,240,766<br />
2005 9,612,909,460,<strong>87</strong>1 2,176,641,598<br />
2006 13,410,945,234,225 3,681,524,702<br />
2007 18,399,133,746,013 4,617,454,325<br />
2008 18,653,009,286,684 5,098,688,004<br />
2009 21,031,172,451,720 4,241,014,377<br />
Total: 82,567,998,973,175 20,923,478,403<br />
NOTE: 2000-2007 FIGURES ARE UNDER SPECIAL TRADE SYSTEM WHILE 2008 AND 2009<br />
FIGURES ARE UNDER GENERAL TRADE SYSTEM<br />
Source: CSO, International Trade Statistics, <strong>2010</strong><br />
Note: (*) Provisional (R) Revised figures<br />
Flow<br />
ZAMBIA’S ANNUAL IMPORTS IN ABSOLUTE ZAMBIAN KWACHA AND U S DOLLAR 2000-2009<br />
IMPORT<br />
Year ZMK USD<br />
2000 2,751,563,199,592 <strong>87</strong>1,386,492<br />
2001 3,900,496,869,495 1,079,955,769<br />
2002 4,732,881,915,324 1,103,070,912<br />
2003 7,439,867,256,553 1,573,309,968<br />
2004 10,279,302,826,391 2,150,649,040<br />
2005 11,466,668,652,907 2,579,688,391<br />
2006 11,049,770,813,126 3,023,996,472<br />
2007 15,945,289,847,742 4,006,980,3<strong>87</strong><br />
2008 18,476,489,239,723 5,060,482,666<br />
2009 18,941,257,150,282 3,792,668,160<br />
Total: 86,042,330,620,853 21,449,520,097<br />
Source: CSO, International Trade Statistics, <strong>2010</strong><br />
Note: (*) Provisional (R) Revised figures<br />
38
Interest Rates<br />
End <strong>of</strong><br />
COMMERCIAL BANKS CENTRAL BANK TREASURY BILLS<br />
Period Weighted Lending Rates Lending Rates Interest Rates YIELD RATE 91 DAYS<br />
1990 - - 34.0 -<br />
1991 - - 47.0 -<br />
1992 - - 54.0 -<br />
1993 - - 72.0 -<br />
1994 36.2 - 25.4 -<br />
1995 47.7 - 51.5 -<br />
1996 57.4 69.0 70.0 -<br />
1997 37.9 49.3 23.3 -<br />
1998 37.4 37.0 43.4 -<br />
1999 42.6 40.4 46.2 -<br />
2000 37.6 45.9 44.1 -<br />
2001 46.7 54.6 52.5 -<br />
2002 42.5 50.0 34.0 -<br />
2003 38.0 45.3 21.3 -<br />
2004 MAR 31.8 39.1 9.6 -<br />
Jun 29.8 36.9 7.8 -<br />
Sep 30.0 37.4 14.7 -<br />
Dec 29.8 37.1 18.3 -<br />
2005 JAN 28.0 35.3 18.4 -<br />
Feb 28.6 35.9 18.8 -<br />
Mar 28.1 35.4 18.2 -<br />
Apr 28.0 35.1 17.8 -<br />
May 28.1 35.1 16.0 -<br />
Jun 28.6 35.6 15.9 -<br />
Jul 28.2 35.2 16.5 -<br />
Aug 28.3 35.3 16.4 -<br />
Sep 28.2 34.9 16.9 -<br />
Oct 28.2 34.5 16.9 -<br />
Nov 28.2 34.5 17.4 -<br />
Dec 27.6 33.9 17.1 -<br />
2006 JAN 26.7 33.0 17.1 15.1<br />
Feb 26.4 32.7 16.1 14.1<br />
Mar 25.4 31.6 14.7 12.7<br />
Apr 25.2 31.4 11.0 9.0<br />
May 22.8 29.0 8.4 6.4<br />
Jun 21.6 27.8 7.5 5.5<br />
Jul 21.7 27.9 8.6 6.6<br />
Aug 21.7 27.9 9.6 7.6<br />
Sep 21.6 27.8 10.9 8.6<br />
Oct 21.6 27.8 12.3 10.3<br />
Nov 21.6 27.8 11.1 9.1<br />
Dec 21.6 27.9 10.7 8.7<br />
2007 JAN 21.0 27.3 11.1 9.1<br />
Feb 21.0 27.3 11.8 9.8<br />
Mar 20.3 26.4 12.8 10.8<br />
Apr 18.2 24.3 14.0 12.0<br />
May 18.2 24.3 13.2 11.2<br />
Jun 18.2 24.3 12.9 10.9<br />
Jul 18.2 24.3 13.6 11.6<br />
Aug 18.2 24.3 13.4 11.4<br />
Sep 18.2 24.3 14.0 12.0<br />
Oct 18.2 24.3 13.5 11.5<br />
Nov 18.2 24.3 12.8 10.8<br />
Dec 18.3 24.4 13.5 11.5<br />
2008 JAN 18.4 24.5 13.2 11.2<br />
Feb 18.3 24.4 12.6 10.6<br />
Mar 18.2 24.3 12.9 10.9<br />
Apr 18.2 24.3 13.0 11.0<br />
May 18.2 24.3 14.1 12.1<br />
Jun 18.5 24.6 14.1 12.1<br />
Jul 18.6 24.7 14.1 12.1<br />
39
End <strong>of</strong><br />
COMMERCIAL BANKS CENTRAL BANK TREASURY BILLS<br />
Period Weighted Lending Rates Lending Rates Interest Rates YIELD RATE 91 DAYS<br />
Aug 18.6 24.7 14.3 12.3<br />
Sep 19.6 25.7 14.5 12.5<br />
Oct 20.6 26.7 15.3 13.3<br />
Nov 20.6 26.7 12.0 13.9<br />
Dec 20.8 26.9 15.9 13.9<br />
2009 JAN 20.9 27.0 15.8 13.8<br />
Feb 20.9 27.0 16.3 14.3<br />
Mar 20.9 27.0 16.0 14.0<br />
Apr 20.7 26.6 16.2 14.2<br />
May 21.6 27.8 15.9 13.9<br />
Jun 22.4 28.9 15.6 13.6<br />
Jul 22.4 28.9 17.1 15.1<br />
Aug 23.0 29.5 18.1 16.1<br />
Sep 23.1 29.6 17.5 15.5<br />
Oct 23.1 29.6 16.6 14.6<br />
Nov<br />
Dec<br />
Source: Bank <strong>of</strong> <strong>Zambia</strong><br />
40
Surveys/Activities being undertaken<br />
<br />
<br />
<br />
<br />
<br />
<strong>2010</strong> Census Mapping<br />
<strong>2010</strong> Pilot Census<br />
2008 Labour-force Survey<br />
<strong>2010</strong> Living Conditions Monitoring Survey VI<br />
Available<br />
2009/<strong>2010</strong> Crop Forecasting Survey<br />
2009 <strong>Zambia</strong> Sexual Behaviour Survey (ZSBS)<br />
Employment and Earnings Inquiry Report, January 2006<br />
National Accounts Statistics Bulletin No.9 2005<br />
Labour-Force Survey Report, 2005<br />
2007 <strong>Zambia</strong> Demographic and Health Survey (ZDHS)<br />
Subscribe for your free electronic copy <strong>of</strong> “<strong>The</strong> <strong>Monthly</strong>” online at www.zamstats.gov.zm<br />
<strong>The</strong> Editorial Team would like to thank all Media Institutions and Users <strong>of</strong>…..<br />
“<strong>The</strong> <strong>Monthly</strong> Bulletin”<br />
Thank you for supporting us<br />
Secretariat<br />
Efreda Chulu<br />
- Director<br />
John Kalumbi - Deputy Director<br />
Felix Muchingile - Research and Marketing Manager<br />
Mate Mate<br />
- Principal Research <strong>Office</strong>r<br />
Richard Kaela - Senior Research <strong>Office</strong>r<br />
Linda N. Chonya - Senior Research <strong>Office</strong>r<br />
Janet N. Zulu<br />
- Senior Gender Analyst<br />
Anthony Nkole - Desktop Publishing <strong>Office</strong>r<br />
Perry Musenge - Assistant Desktop Publishing <strong>Office</strong>r<br />
Petronella Kaputu - Press Liaison <strong>Office</strong>r<br />
Humphrey Zimba - Dissemination <strong>Office</strong>r<br />
Etambuyu Lukonga - Documentalist<br />
Cecilia M. Munjita - Librarian<br />
Chisuwa S. Nalishuwa - Assistant Field Co-ordinator<br />
Editorial Team<br />
Efreda Chulu<br />
John Kalumbi<br />
Modesto Banda<br />
William Mayaka<br />
Peter Mukuka<br />
Shebo Nalishebo<br />
Josephine C. Banda<br />
Gerson Banda<br />
Palver Sikanyiti<br />
Lubinda Mukata<br />
- Director<br />
- Deputy Director (IRD)<br />
- Deputy Director (AG)<br />
- Deputy Director (SOC)<br />
- Deputy Director (ECON)<br />
- Statistician<br />
- Statistician<br />
- Statistician<br />
- Statistician<br />
- Statistician<br />
41