FLORIDA COASTAL ECOLOGICAL CHARACTERIZATION: A ...
FLORIDA COASTAL ECOLOGICAL CHARACTERIZATION: A ...
FLORIDA COASTAL ECOLOGICAL CHARACTERIZATION: A ...

Create successful ePaper yourself
Turn your PDF publications into a flip-book with our unique Google optimized e-Paper software.
FWS/OBS-83/15<br />
August 1983<br />
Escambia Santa Rosa Okaloosa Walton<br />
<strong>ECOLOGICAL</strong><br />
<strong>CHARACTERIZATION</strong> :<br />
A Socioeconomic Study of the<br />
Northwestern Region<br />
VOLUME II<br />
DATA APPENDIX Part 2 ~-<br />
I! ; r, D<br />
Fish and Wildlife Service<br />
U .S. Department of the Interior<br />
D<br />
1983 - 26
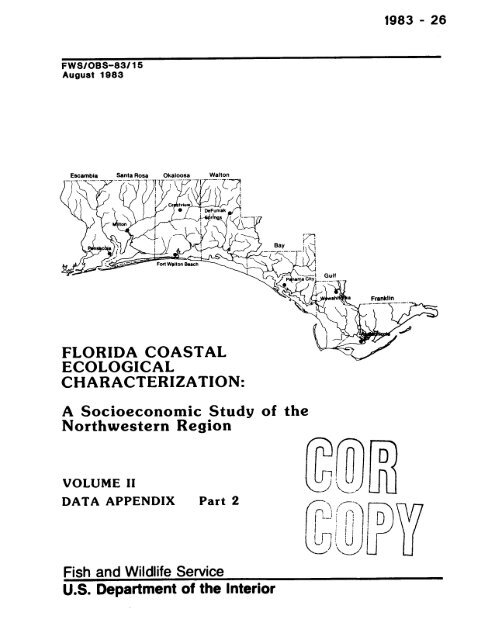
<strong>FLORIDA</strong> <strong>COASTAL</strong> <strong>ECOLOGICAL</strong> <strong>CHARACTERIZATION</strong> : A<br />
SOCIOECONOMIC STUDY OF THE NORTHWESTERN REGION<br />
Volume II<br />
DATA APPENDIX<br />
Part 2<br />
Edited by<br />
Carolyn 0 . French, Project Officer<br />
and<br />
John W . Parsons<br />
National Coastal Ecosystems Team<br />
U .S . Fish and Wildlife Service<br />
1010 Gause Boulevard<br />
Slidell, LA 70458<br />
Robert M . Rogers<br />
Contracting Officer's Authorized Representative<br />
Minerals Management Service<br />
P .O . Box 7944<br />
Metairie, LA 70010<br />
FWS/OBS-83/15<br />
August 1983<br />
This study was co-sponsored by the Minerals Management Service<br />
U :S . Department of the Interior<br />
and the<br />
Division of Biological Services<br />
Fish and Wildlife Service<br />
U .S . Department of the Interior<br />
Washington, DC 20240
PREFACE<br />
The purpose of this socioeconomic characterization study is to compile and<br />
synthesize information from existing sources about the social and economic<br />
characteristics of the northwestern coastal region of Florida, which is made up<br />
of Charlotte, Collier, DeSoto, Hillsborough, Lee, Manatee, Monroe, Pasco,<br />
Pinellas, and Sarasota Counties . This report and the data appendix should<br />
prove useful for coastal planning and management ; it is one in a series of<br />
characterizations of coastal socioeconomic systems produced by the U .S . Fish<br />
and Wildlife Service . The series describes the components and interrelationships<br />
among complex processes that include population and demographic characteristics,<br />
mineral production, multiple-use conflicts, recreation and tourism, agricultural<br />
production, sport and commercial fishing, transportation, industrial and<br />
residential development, and environmental issues and regulations .<br />
This study originally was under contract with the NANEX Systems Corporation,<br />
Crestview, Florida . The corporation is responsible for the compilations and<br />
accuracy of the Data Appendices and their lists of references . Most of the<br />
first drafts of the various chapters were prepared in 1980 . Only a few of the<br />
sections of some of the reports have since been updated .<br />
This project was conducted under Contract FWS 14-16-0009-074 . Funding was<br />
provided by the Minerals Management Service and the Fish and Wildlife Service,<br />
U .S . Department of the Interior . Questions or requests for this publication<br />
should be directed to :<br />
Information Transfer Specialist<br />
National Coastal Ecosystems Team<br />
U .S . Fish and Wildlife Service<br />
NASA-Slidell Computer Complex<br />
1010 Gause Boulevard<br />
Slidell, Louisiana 70458<br />
This report should be cited :<br />
French, Carolyn 0 ., and John W . Parsons (editors) . 1983 . Florida coastal<br />
ecological characterization : a socioeconomic study of the northwestern<br />
region . U .S . Fish and Wildlife Service, Division of Biological Services,<br />
Washington, D .C . FWS/OBS-83/15 .<br />
ii
CONTENTS<br />
Part 2<br />
PREFACE . . . . . . . . . . . . . . . . . . . . . . . . . . . . . . . . . . . . . . . . . . . . . . . . . . . . . . . . . . . . . .<br />
CONTENTS . . . . . . . . . . . . . . . . . . . . . . . . . . . . . . . . . . . . . . . . . . . . . . . . . . . . . . . . . . . . .<br />
FIGURES . . . . . . . . . . . . . . . . . . . . . . . . . . . . . . . . . . . . . . . . . . . . . . . . . . . . . . . . . . . . . .<br />
TABLES . . . . . . . . . . . . . . . . . . . . . . . . . . . . . . . . . . . . . . . . . . . . . . . . . . . . . . . . . .<br />
ABBREVIATIONS . . . . . . . . . . . . . . . . . . . . . . . . . . . . . . . . . . . . . . . . . . . . . . . . . . . . . . . .<br />
SYMBOLS . . . . . . . . . . . . . . . . . . . . . . . . . . . . . . . . . . . . . . . . . . . . . . . . . . . . . . . . . . . . . .<br />
METRIC-ENGLISH EQUIVALENTS . . . . . . . . . . . . . . . . . . . . . . . . . . . . . . . . . . . . . . . . . . .<br />
PUBLIC UTILITIES (.PU) . . . . . . . . . . . . . . . . . . . . . . . . . . . . . . . . . . . . . . . . . . . . . . . .<br />
TRANSPORTATION ( TRANS) . . . . . . . . . . . . . . . . . . . . . . . . . . . . . . . . . . . . . . . . . .<br />
RECREATION AND TOURISM (R/T) . . . . . . . . . . . . . . . . . . . . . . . . . . . . . . . . . . . . .<br />
MINERAL AND OIL PRODUCTION (MP) .o . . . . . . . . . . . . . . . . . . . . . . . . . . .<br />
ENVIRONMENTAL ISSUES AND REGULATIONS (EIR) . . . . . . . . . . . . . . . . . . . . . . . . . . .<br />
REFERENCES . . . . . . . . . . . . . . . . . . . . . . . . . . . . . . . . . . . . . . . . . . . . . . . . . . . . . . . . . . .<br />
iii<br />
Page<br />
iv<br />
xvi<br />
xvi i<br />
xix<br />
xix 1<br />
35<br />
129<br />
207<br />
239<br />
355
FIGURES<br />
Category and<br />
Number Page<br />
Public Utilities . . . . . . . . . . . . . . . . . . . . . . . . . . . . . . . . . . . . . . . . . . . . . . . . . . . 1<br />
Figure 1 Publicly owned utilities . . . . . . . . . . . . . . . . . . . . . . . . . . . . . . . 2<br />
Figure 2 Privately owned utilities . . . . . . . . . . . . . . . . . . . . . . . . . . . . . . 3<br />
Figure 3 Rural electric cooperatives . . . . . . . . . . . . . . . . . . . . . . . . . . . . 14<br />
Transportation . . . . . . . . . . . . . . . . . . . . . . . . . . . . . . . . . . . . . . . . . . . . . . . . . . . . . . . . 35<br />
Figure 4 Ports and waterways in Florida . . . . . . . . . . . . . . . . . . . . . . . . . 36<br />
Figure 5 Passenger and freight railroads in Florida . . . . . . . . . . . . . 92<br />
Figure 6 Pipelines in Florida . . . . . . . . . . . . . . . . . . . . . . . . . . . . . . . . . . . 119<br />
Figure 7 Florida highways . . . . . . . . . . . . . . . . . . . . . . . . . . . . . . . . . . . . . . . 122<br />
Recreation and Tourism . . . . . . . . . . . . . . . . . . . . . . . . . . . . . . . . . . . . . . . . . . . . . . . . 129<br />
Figure 8 Natural vegetation of Florida . . . . . . . . . . . . . . . . . . . . . . . . . . 130<br />
Figure 9 Critical habitats in Florida . . . . . . . . . . . . . . . . . . . . . . . . . . . 134<br />
Figure 10 State Wildlife Management Areas . . . . . . . . . . . . . . . . . . . . . . . . 136<br />
Figure 11 State preserves, forests, and parks . . . . . . . . . . . . . . . . . . . . 173<br />
Figure 12 National seashores, memorials, historic sites,<br />
marine sanctuaries, wilderness areas, forests,<br />
parks, wildlife refuges, and preserves . . . . . . . . . . . . . . . . . . 182<br />
Figure 13 State Aquatic Preserves . . . . . . . . . . . . . . . . . . . . . . . . . . . . . . . . 184<br />
Mineral and Oi l Production . . . . . . . . . . . . . . . . . . . . . . . . . . . . . . . . . . . . . . . . . . . . 207<br />
Figure 14 Florida mineral resources . . . . . . . . . . . . . . . . . . . . . . . . . . . . . . 208<br />
Figure 15 Florida mineral industries . . . . . . . . . . . . . . . . . . . . . . . . . . . . . 211<br />
Figure 16 0i1 and gas production curves for the Gulf of<br />
Mexico to the year 2000 . . . . . . . . . . . . . . . . . . . . . . . . . . . . . . . . 218<br />
Figure 17 Producing and plugged oil and gas fields in<br />
Florida . . . . . . . . . . . . . . . . . . . . . . . . . . . . . . . . . . . . . . . . . . . . . . . . 219<br />
Figure 18 Status of OCS lease areas off the Florida<br />
Gulf Coast . . . . . . . . . . . . . . . . . . . . . . . . . . . . . . . . . . . . . . . . . . . . . 221<br />
Environmental Issues . . . . . . . . . . . . . . . . . . . . . . . . . . . . . . . . . . . . . . . . . . . . . . . . . . 239<br />
Figure 19 Areawide wastewater management planning areas . . . . . . . . . . 240<br />
Figure 20 Regional Planning Council area boundaries . . . . . . . . . . . . . . 241<br />
Figure 21 U .S . Army Corps of Enqineers regulatory districts . . . . . . 253<br />
Figure 22 Local pollution control programs . . . . . . . . . . . . . . . . . . . . . . . 254<br />
Figure 23 State Water Management Districts . . . . . . . . . . . . . . . . . 273<br />
Figure 24 Districts and sub-districts of the Florida<br />
Department of Environmental Regulation . . . . . . . . . . . . . . . . . 277<br />
Figure 25 Areas of Critical State Concern . . . . . . . . . . . . . . . . . . . . . . . . 324<br />
iv
Category and<br />
Number<br />
Figure 26<br />
Figure 27<br />
Figure 28<br />
Figure 29<br />
Figure 30<br />
Figure 31<br />
Federal air quality control regions . . . . . . . . . . . . . . . . . . . .<br />
Jurisdictional interrelationships in coastal areas . . . . .<br />
Interrelationships of agencies in the environmental<br />
review process in transportation planning . . . . . . . . . . . . . .<br />
Contamination of the groundwater system by waste<br />
disposal practices . . . . . . . . . . . . . . . . . . . . . . . . . . . . . . . . . . . . .<br />
Underground injection control program<br />
classification of wells . . . . . . . . . . . . . . . . . . . . . . . . . . . . . . . .<br />
Matrix of State agencies involved in land<br />
development control . . . . . . . . . . . . . . . . . . . . . . . . . . . . . . . . . . . .<br />
v<br />
Page<br />
339<br />
341<br />
342<br />
343<br />
345<br />
346
TABLES<br />
Number P age<br />
PU 1 Counties served by electrical utilities in 1979 . . . . . . . . . . . . . . 4<br />
PU 2 :- Net generation, amount, and price of fuel consumed, and<br />
British thermal unit (Btu) per kilowatthour (kWh) for<br />
steam-electric plants in 1955 . . . . . . . . . . . . . . . . . . . . . . . . . . . . . . . . . 5<br />
PU 3 Net generation, amount, and price of fuel consumed, and<br />
British thermal unit (Btu) per kilowatthour (kWh) for<br />
steam-electric plants in 1960 . . . . . . . . . . . . . . . . . . . . . . . . . . . . . . 8<br />
PU 4 Net generation, amount, and price of fuel consumed, and<br />
British thermal unit (Btu) per kilowatt'hour (kWh) for<br />
steam-electric plants in 1965 .. . . . . . . . . . . . . . . . . . . . . . . . . . . . . . . 11<br />
PU 5 Net generation, amount, and price of fuel consumed, and<br />
British thermal unit (Btu) per kilowatthour (kWh) for<br />
steam-electric plants in 1970 .. . . . . . . . . . . . . . . . . . . . . . . . . . . . . . . 15<br />
PU 6 Net generation, amount, and price of fuel consumed, and<br />
British thermal unit (Btu) per kilowatthour (kWh) for<br />
steam-electric plants in 1975 .. . . . . . . . . . . . . . . . . . . . . . . . . . . . . . . 18<br />
PU 7 Net generation, amount, and price of fuel consumed, and<br />
British thermal unit (Btu) per kilowatthour (kWh) for<br />
steam-electric plants in 1978~ . . . . . . . . . . . . . . . . . . . . . . . . . . . . . . . 21<br />
PU 8 Sales by generating utilities to final consumers from<br />
1955 to 1977 .. . . . . . . . . . . . . . . . . . . . . . . . . . . . . . . . . . . . . . . . . . . . . . . . 24<br />
PU 9 - Sales by non-generating rural electric cooperatives to<br />
final consumers in 1975 and 1978 . . . . . . . . . . . . . . . . . . . . . . . . . . . . 28<br />
PU 10 Initial year of operation for steam electric plants<br />
serving the region in 1978 . . . . . . . . . . . . . . . . . . . . . . . . . . . . . . . . . . . 29<br />
PU 11 Initial year of operation for gas turbine electric plants<br />
serving northwestern and southwestern Florida 1977 ., . . . . . . . . . 30<br />
PU 12 Major interconnections for bulk power transactions for the<br />
Florida subregion . . . . . . . . . . . . . . . . . . . . . . . . . . . . . . . . . . . . . . . . . . . 31<br />
PU 13 Major interconnections for bulk power transactions for the<br />
southern subregion .. . . . . . . . . . . . . . . . . . . . . . . . . . . . . . . . . . . . . . . . . . 34<br />
TRANS 1 Identification and classification of ports, including<br />
beginning dates of operation under jurisdiction of local<br />
port authorities . . . . . . . . . . . . . . . . . . . . . . . . . . . . . . . . . . . . . . . . . . . . 37<br />
vi
Number<br />
TRANS 2 Port tonnage in short tons for 1960, 1965, 1970,<br />
1975, 1978 . . . . . . . . . . . . . . . . . . . . . . . . . . . . . . . . . . . . . . . . . . . . . . . . . . 38<br />
TRANS 3 Flori da port accessibility by mode of transportation in<br />
1978 . . . . . . . . . . . . . . . . . . . . . . . . . . . . . . . . . . . . . . . . . . . . . . . . . . . . . . . 38<br />
TRANS 4 Sourc es of funding for major ports as of 1978 . . . . . . . . . . . . . . 39<br />
TRANS 5 Port of Panama City freight traffic (short tons) in<br />
1960 . . . . . . . . . . . . . . . . . . . . . . . . . . . . . . . . . . . . . . . . . . . . . . . . . . . . . . . 40<br />
TRANS 6 Port of Panama City freight traffic (short tons) in<br />
1965 . . . . . . . . . . . . . . . . . . . . . . . . . . . . . . . . . . . . . . . . . . . . . . . . . . . . . . . 43<br />
TRANS 7 Port of Panama City freight traffic (short tons) in<br />
1970 . . . . . . . . . . . . . . . . . . . . . . . . . . . . . . . . . . . . . . . . . . . . . . . . . . . . . . . 47<br />
TRANS 8 Port of Panama City freight traffic (short tons) in<br />
1975 . . . . . . . . . . . . . . . . . . . . . . . . . . . . . . . . . . . . . . . . . . . . . . . . . . . . . . . 50<br />
TRANS 9 Port of Panama City freight traffic (short tons) in<br />
1978 . . . . . . . . . . . . . . . . . . . . . . . . . . . . . . . . . . . . . . . . . . . . . . . . . . . . . . . 53<br />
TRANS 10 Port of St . Joe freight traffic (short tons) in 1960 . . . . . . . 57<br />
TRANS 11 Port of St . Joe freight traffic (short tons) in 1965 . . . . . . . 58<br />
TRANS 12 Port of St . Joe freight traffic (short tons) in 1970 . . . . . . . 60<br />
TRANS 13 Port of St . Joe freight traffic (short tons) in 1975 . . . . . . . 62<br />
TRANS 14 Port of St . Joe freight traffic (short tons) in 1978 . . . . . . . 63<br />
TRANS 15 Port of Pensacola freight traffic (short tons) in 1960 . .,,, 66<br />
TRANS 16 Port of Pensacola freight traffic (short tons) in 1965 . . . . . 72<br />
TRANS 17 Port of Pensacola freight traffic (short tons) in 1970 . . . . . 78<br />
TRANS 18 Port of Pensacola freight traffic (short tons) in 1975 .,,, . 83<br />
TRANS 19 Loadi ng and unloading equipment availability at ports<br />
as of December 1978 . . . . . . . . . . . . . . . . . . . . . . . . . . . . . . . . . . . . . . . . 89<br />
TRANS 20 Port of Panama City storage and capacity in 1978 . . . . . . . . . . . 90<br />
TRANS 21 Port of Pensacola storage and capacity in 1978 . . . . . . . . . . . . . 91<br />
TRANS 22 Port of St . Joe storage and capacity in 1978 . . . . . . . . . . . . . . . 93<br />
vii<br />
Page
Number<br />
TRANS 23 Port of Apalachicola storage and capacity in 1978 . . . . . . . . . . .<br />
TRANS 24 Road miles of track by class of railroad for 1973, 1974,<br />
1975 and 1980 . . . . . . . . . . . . . . . . . . . . . . . . . . . . . . . . . . . . . . . . . . . . . . .<br />
TRANS 25 Road miles of track by railroad line, operating revenue<br />
and operating expense for 1973, 1974 and 1975- . . . . . . . . . . . . . .<br />
TRANS 26 Total road miles of track in 1980 for selected Florida<br />
railroads . . . . . . . . . . . . . . . . . . . . . . . . . . . . . . . . . . . . . . . . . . . . . . . . . . .<br />
TRANS 27 Total revenue freight (tons) carried by Class I railroads<br />
in Florida in 1971 . . . . . . . . . . . . . . . . . . . . . . . . . . . . . . . . . . . . . . . . . .<br />
TRANS 28<br />
TRANS 29<br />
TRANS 30<br />
TRANS 31<br />
TRANS 32<br />
Total revenue f reight (tons) carried by Class I railroads<br />
in Florida in 1972 . . . . . . . . . . . . . . . . . . . . . . . . . . . . . . . . . . . . . . . . . .<br />
Total revenue f reight (tons) carried by Class I railroads<br />
in Florida in 1973 . . . . . . . . . . . . . . . . . . . . . . . . . . . . . . . . . . . . . . . . . .<br />
Total revenue f reight (tons) carried by Class I railroads<br />
in Florida in 1974 . . . . . . . . . . . . . . . . . . . . . . . . . . . . . . . . . . . . . . . . . .<br />
Total revenue freight (tons) carried by Class I railroads<br />
in Florida in 1975 . . . . . . . . . . . . . . . . . . . . . . . . . . . . . . . . . . . . . . . . . .<br />
Page<br />
Total revenue freight ( tons) carried by Class I railroads<br />
in Florida in 1976 . . . . . . . . . . . . . . . . . . . . . . . . . . . . . . . . . . . . . . . . . . 107<br />
TRANS 33 Location and identification of commercial and general<br />
aviation airports in 1979 . . . . . . . . . . . . . . . . . . . . . . . . . . . . . . . . . . . 109<br />
TRANS 34 Number of airports by type in 1980 . . . . . . . . . . . . . . . . . . . . . . . . . . 109<br />
TRANS 35 Commercial airport passenger, cargo and mail i n 1960,<br />
1965, 1970, 1975, 1978 and 1979 . . . . . . . . . . . . . . . . . . . . . . . . . . . . . 110<br />
TRANS 36 Total air carrier operations first and second level for<br />
Florida commercial airports for 1970, 1975 and 1980< . . . . . . . . 112<br />
TRANS 37 Commercial airport facility characteristics in 1980 . . . . . . . . . 113<br />
TRANS 38 Commercial airport based aircraft history and projections<br />
for 1970 ', 1974, 1980, 1985 and 1990 . . . . . . . . . . . . . . . . . . . . . . . . . 114<br />
TRANS 39 Commercial airport annual aircraft movements history and<br />
projections for 1970, 1974, 1980, 1985 and 1990~ . . . . . . . . . . . . . 114<br />
viii<br />
93<br />
93<br />
94<br />
96<br />
97<br />
99<br />
101<br />
103<br />
105
Number Page<br />
TRANS 40 Commercial airports, air carrier enplanements, history<br />
and projections for 1960, 1965, 1970, 1974, 1980, 1985<br />
and 1990 . . . . . . . . . . . . . . . . . . . . . . . . . . . . . . . . . . . . . . . . . . . . . . . . . . . 115<br />
TRANS 41 Florida road mileage as of 31 December 1971 . . . . . . . . . . . . . . . . 116<br />
TRANS 42 Florida road mileage as of 31 December 1975 . . . . . . . . . . . . . . . . 117<br />
TRANS 43 Florida road mileage as of 31 December 1979 . . . . . . . . . . . . . . . . 118<br />
TRANS 44 Total number of motor vehicle license tags sold for<br />
1955, 1960, 1965, 1970-71, 1975-76 and 1979-80 . . . . . . . . . . . . . 120<br />
TRANS 45 Florida pipeline volumes in tons per day and annually by<br />
Department of Transportation District for 1970, 1972, 1973<br />
and 1974-75 . . . . . . . . . . . . . . . . . . . . . . . . . . . . . . . . . . . . . . . . . . . . . . . . 120<br />
TRANS 46 Florida pipeline mileage in 1975 . . . . . . . . . . . . . . . . . . . . . . . . . . . 121<br />
TRANS 47 Roadway characteristics and volume range of average daily<br />
traffic in 1965 and 1977 . . . . . . . . . . . . . . . . . . . . . . . . . . . . . . . . . . . 123<br />
TRANS 48 Interstate natural gas pipeline statistics in 1972-79 . . . . . . 125<br />
TRANS 49 Miles of gas transmission pipe by diameter in inches in<br />
1979 . . . . . . . . . . . . . . . . . . . . . . . . . . . . . . . . . . . . . . . . . . . . . . . . . . . . . . . 127<br />
TRANS 50 Average daily traffic at Department of Transportation<br />
permanent traffic recording stations . . . . . . . . . . . . . . . . . . . . . . . 128<br />
R/T 1 Average temperatures in 1955 . . . . . . . . . . . . . . . . . . . . . . . . . . . . . . . 131<br />
.<br />
R/T 2 Average temperatures in 1960 . . . . . . . . . . . . . . . . . . . . . . . . . . . . . . . 131<br />
R/T 3 Average temperatures in 1965 . . . . . . . . . . . . . . . . . . . . . . . . . . . . . . . 132<br />
R/T 4 Average temperatures in 1970 . . . . . . . . . . . . . . . . . . . . . . . . . . . . . . . 132<br />
R/T 5 Average temperatures in 1975 . . . . . . . . . . . . . . . . . . . . . . . . . . . . . . . 133<br />
R/T 6 Average temperatures in 1980 . . . . . . . . . . . . . . . . . . . . . . . . . . . . . . . 133<br />
R/T 7 Climate and geography in 1980 . . . . . . . . . . . . . . . . . . . . . . . . . . . . . . 135<br />
R/T 8 Demand, supply and need, history and projections for<br />
selected outdoor recreation activities in Bay County for<br />
1980, 1985 and 1990 . . . . . . . . . . . . . . . . . . . . . . . . . . . . . . . . . . . . . . . . 137<br />
ix
Number Page<br />
R/T 9 Demand, supply and need, history and projections for<br />
selected outdoor recreation activities in Escambia County<br />
for 1980, 1985 and 1990 . . . . . . . . . . . . . . . . . . . . . . . . . . . . . . . . . . . . 141<br />
R/T 10 Demand, supply and'need, history and projections for<br />
selected outdoor recreation activities in Franklin County<br />
for 1980, 1985 and 1990 . . . . . . . . . . . . . . . . . . . . . . . . . . . . . . . . . . . . 145<br />
R/T 11 Demand, supply and need, history and projections for<br />
selected outdoor recreation activities in Gulf County for<br />
1980, 1985 and 1990 . . . . . . . . . . . . . . . . . . . . . . . . . . . . . . . . . . . . . . . . 148<br />
R/T 12 Demand, supply and need, history and projections for<br />
selected outdoor recreation activities in Okaloosa County<br />
for 1980, 1985 and 1990 . . . . . . . . . . . . . . . . . . . . . . . . . . . . . . . . . . . . 151<br />
R/T 13 Demand, supply and need, history and projections for<br />
selected outdoor recreation activities in Walton County<br />
for 1980, 1985 and 1990 . . . . . . . . . . . . . . . . . . . . . . . . . . . . . . . . . . . . 154<br />
R/T 14 Federal public recreation and park facility inventory in<br />
1980 . . . . . . . . . . . . . . . . . . . . . . . . . . . . . . . . . . . . . . . . . . . . . . . . . . . . . . . 157<br />
R/T 15 State public recreation and park facility inventory in<br />
1980 . . . . . . . . . . . . . . . . . . . . . . . . . . . . . . . . . . . . . . . . . . . . . . . . . . . . . . . 161<br />
R/T 16 County public recreation and park facility inventory in<br />
1980 . . . . . . . . . . . . . . . . . . . . . . . . . . . . . . . . . . . . . . . . . . . . . . . . . . . . . . . 165<br />
R/T 17 Municipal public recreation and park facility inventory in<br />
1980 . . . . . . . . . . . . . . . . . . . . . . . . . . . . . . . . . . . . . . . . . . . . . . . . . . . . . . . 169<br />
R/T 18 Private recreation and park facility inventory in 1980 . . . . . 174<br />
R/T 19 Air and auto tourists to Florida for 1976, 1979 and 1980 . . . 178 .<br />
R/T 20 Number of visitors, visitor characteristics, and visitor<br />
expenditures in 1976 . . . . . . . . . . . . . . . . . . . . . . . . . . . . . .. . . . . . . . . . 179<br />
R/T 21 Number of visitors, visitor characteristics, and visitor<br />
expenditures in 1979 . . . . . . . . . . . . . . . . . . . . . . . . . . . . . . . . . . . . . . . 180<br />
R/T 22 Number of visitors, visitor characteristics, and visitor<br />
expenditures in 1979 . . . . . . . . . . . . . . . . . . . . . . . . . . . . . . . . . . . . . . . 181<br />
.<br />
R/T 23 Number of assigned archaeological and historical sites<br />
in northwestern Florida as of 4 November 1980 . . . . . . . . . . . . . . 183<br />
R/T 24 Sites in northwestern Florida listed on the<br />
Register . . . . . . . . . . . . . . . . . . . . . . . . . . . . . . . . . . . . . . . . . . . . . . . . . . . 185<br />
x
Number<br />
R/T 25 Recreat ional properties under the jurisdiction of the<br />
Florida Department of Natural Resources 1980 . . . . . . . . . . . . . . . 186<br />
R/T 26 Visitor utilization of recreational properties under the<br />
jurisdiction of the Florida Department of Natural Resources<br />
for fiscal years 1965-66, 1970-71, 1974-75 and<br />
1979-80 . . . . . . . . . . . . . . . . . . . . . . . . . . . . . . . . . . . . . . . . . . . . . . . . . . . . 188<br />
R/T 27 Florida boat registrations by type of vessel for FY<br />
1965-66 . . . . . . . . . . . . . . . . . . . . . . . . . . . . . . . . . . . . . . . . . . . . . . . . . . . . 190<br />
R/T 28 Florida boat registrations by type of vessel for FY<br />
1970-71 . . . . . . . . . . . . . . . . . . . . . . . . . . . . . . . . . . . . . . . . . . . . . . . . . . . . 190<br />
R/T 29<br />
Page<br />
Florida boat registrations by type of vessel for FY<br />
1975-76 . . . . . . . . . . . . . . . . . . . . . . . . . . . . . . . . . . . . . . . . . . . . . . . . . . . . 191<br />
R/T 30 Florida boat registrations by type of vessel for FY<br />
1978-79 . . . . . . . . . . . . . . . . . . . . . . . . . . . . . . . . . . . . . . . . . . . . . . . . . . . . 191<br />
R/T 31 Leading metropolitan markets for outboard motors in 1978<br />
and 1979 . . . . . . . . . . . . . . . . . . . . . . . . . . . . . . . . . . . . . . . . . . . . . . . . . . . 192<br />
R/T 32 Hunting and fishing licenses sold by series in FY 1954-55 . . 194<br />
R/T 33 Hunting and fishing licenses sold by series in FY 1959-60 . . 196<br />
R/T 34 Hunting -and fishing licenses sold by series in FY 1964-65 . . 198<br />
R/T 35 Hunting and fishing licenses sold by series in FY 1969-70 . . 200<br />
R/T 36 Hunting and fishing licenses sold by series in FY 1974-75 . . 202<br />
R/T 37 Hunting and fishing licenses sold by series in FY 1979-80 . . 204<br />
MP 1<br />
Value in dollars ($) of all minerals produced, in order<br />
of value, for 1955, 1960, 1965, 1970, 1975 and 1979 . . . . . . . . 209<br />
MP 2 Non-fuel mineral production and value in dollars ($) in<br />
Florida for 1955, 1960, 1965, 1970, 1975 and 1979 . . . . . . . . . . 212<br />
MP 3<br />
Marketable production of phosphate rock in dollars ($) in<br />
Florida for 1955, 1960 and 1965 . . . . . . . . . . . . . . . . . . . . . . . . . . . . 213<br />
MP 4 Phosphate reserves and resources (million metric tons)<br />
for the world, the United States and central'Florida . . . . . . . 214<br />
MP 5 Active sand producers in the northwest region . . . . . . . . . . . . . . 215<br />
MP 6 Non-fuel mineral supply in dollars ($) for Florida in<br />
1978 . . . . . . . . . . . . . . . . . . . . . . . . . . . . . . . . . . . . . . . . . . . . . . . . . . . . . . . 216<br />
xi
Number Page<br />
MP 7 Crude petroleum and natural gas production and value<br />
($) for Florida for 1955, 1960, 1965, 1970, 1975 and<br />
1979 . . . . . . . . . . . . . . . . . . . . . . . . . . . . . . . . . . . . . . . . . . . . . . . . . . . . . . . 216<br />
MP 8 Natural gas production (1,000 ft3) by field for 1970<br />
1975'and 1979 . . . . . . . . . . . . . . . . . . . . . . . . . . . . . . . . . . . . . . . . . . . . . . 217<br />
MP 9 Crude oil production (barrels) by field for 1970, 1975<br />
and 1979 . . . . . . . . . . . . . . . . . . . . . . . . . . . . . . . . . . . . . . . . . . . . . . . . . . . 220<br />
MP 10 Oil and gas drilling permits since 1973 . . . . . . . . . . . . . . . . . . . . 222<br />
MP 11 OCS oil and gas lease sales ($) in Florida for selected<br />
dates . . . . . . . . . . . . . . . . . . . . . . . . . . . . . . . . . . . . . . . . . . . . . . . . . . . . . . 226<br />
MP 12 Crude oil and natural gas reserves and production in<br />
Florida for 1955, 1960, 1965, 1970, 1975, 1977 and 1979 . . . . 227<br />
MP 13 Estimated crude oil and natural gas reserves in 1972-77 . . . . 228<br />
MP 14 Gulf of Mexico OCS oil and gas resource and reserve<br />
estimates in 1979,,,,,,,,,,,,,,,,,,,,,,,,,,,,,,,,,,,,,,,,,, 229<br />
MP 15 Dollar value of mineral production as a percent of the<br />
State total for 1965, 1975 and 1976 . . . . . . . . . . . . . . . . . . . . . . . . 229<br />
MP 16 Value ($) of mineral production for 1960 and 1975 . . . . . . . . . . 230<br />
MP 17 Minerals production establishments by county in 1972 . . . . . . . 230<br />
MP 18 Mississippi, Alabama and Florida (MAFLA) lease sales for<br />
1959, 1973, 1976 and 1978 . . . . . . . . . . . . . . . . . . . . . . . . . . . . . . . . . . 231<br />
MP 19 Factors affecting the number and locations of onshore<br />
support facilities . . . . . . . . . . . . . . . . . . . . . . . . . . . . . . . . . . . . . . . . . 232<br />
MP 20 Types and quantities of materials transported offshore for<br />
one-year periods . . . . . . . . . . . . . . . . . . . . . . . . . . . . . . . . . . . . . . . . . . . 232<br />
MP 21 General f actors affecting location and service bases . . . . . . . 233<br />
MP 22 Site considerations and impacts of facilities associated<br />
with pipelines . . . . . . . . . . . . . . . . . . . . . . . . . . . . . . . . . . . . . . . . . . . . . 234<br />
MP 23 Site considerations and impacts for berthing facilities . . . . 235<br />
MP 24 Siting considerations and impacts of onshore processing<br />
and treatment facilities . . . . . . . . . . . . . . . . . . . . . . . . . . . . . . . . . . . 236<br />
xii
Number<br />
Page<br />
MP 25 Site considerations and impacts associated with oil<br />
refineries . . . . . . . . . . . . . . . . . . . . . . . . . . . . . . . . . . . . . . . . . . . . . . . . . 237<br />
MP 26<br />
Site conditions and impacts for platform fabrication<br />
yards . . . . . . . . . . . . . . . . . . . . . . . . . . . . . . . . . . . . . . . . . . . . . . . . . . . . . . 238<br />
EIR 1 Location and description of solid waste problem areas . . . . . . 242<br />
EIR 2 Location and description of solid waste facilities by 248<br />
county . . . . . . . . . . . . . . . . . . . . . . . . . . . . . . . . . . . . . . . . . . . . . . . . . . . . .<br />
EIR 3 Hazardous waste incident, Youngstown train derailment . . . . . . 255<br />
EIR 4 Hazardous waste incident, Fanning Bayou fish kill . . .• . . . .•• 256<br />
EIR 5 Hazardous waste incident, Crestview train derailment,<br />
Okaloosa County<br />
EIR 6 Hazardous waste incident, demolition of out-of-date<br />
laboratory reagents from Escambia County schools . . . . . . . . . . . 258<br />
EIR 7<br />
Hazardous waste incident, phenolic sludges discharged into .<br />
Bayou Chico, Escambia County . . . . . . . . . . . . . . . . . . . . . . . . . . . . . .<br />
EIR 8 Hazardous waste incident, industrial waste discharge into . .<br />
Airplane Bayou, Esc ambia County . . . . . . . . . . . . . . . . . . . . . . . . . .<br />
EIR 9 Hazardous waste incident, stored pesticide at Escambia<br />
County Rodent Control . . . . . . . . . . . . . . . . . . . . . . . . . . . . . . . . . . . . . . 261<br />
EIR 10<br />
Hazardous waste incident, Molino train derailment, Escambia<br />
County . . . . . . . . . . . . . . . . . . . . . . . . . . . . . . . . . . . . . . . . . . . . . . . . . . 262<br />
EIR 11 Inventory of potential hazardous waste sites by county . . . . . 263<br />
EIR 12 Total number of industrial surface impoundments in Florida<br />
by size in acres . . . . . . . . . . . . . . . . . . . . . . . . . . . . . . . . . . . . . . . . . . . 265<br />
EIR 13<br />
Total number of industrial impoundments and total number<br />
with monitoring wells and liners . . . . . . . . . . . . . . . . . . . . . . . . . . . . 265<br />
EIR 14 Identified air quality problems . . . . . . . . . . . . . . . . . . . . . . . . . . . . 266<br />
EIR 15 Florida class II waters presently closed to shellfishing . . . 268<br />
EIR 16 Identified water quality problems-y . . .• . . . . . . . . . . .••••••••• 269<br />
EIR 17 Known case of groundwater contamination, . . . . . . . .• .••••••••• 271<br />
xiii<br />
257<br />
259<br />
260
Number Page<br />
EIR 18 Summary of oil spill investigations from 1 January 1975 to<br />
31 August 1980 by the Florida Department of Natural<br />
Resources . . . . . . . . . . . . . . . . . . . . . . . . . . . . . . . . . . . . . . . . . . . . . . . . . . . . 272<br />
EIR 19 Geographic areas considered by the Florida Department of<br />
Environmental Regulation as having the greatest potential<br />
for agricultural non-point water quality problems . . . . . . . . . . . 274<br />
EIR 20 Florida surf ace water dischargers with current wasteload<br />
allocations (WLA's),,,,,,,,,,,,,,,,,,,,,,,,,,,,,,,,,,,,,,,,, 275<br />
EIR 21 Permanent Network Stations (PNS) water quality violations<br />
from 1974-78 . . . . . . . . . . . . . . . . . . . . . . . . . . . . . . . . . . . . . . . . . . . . . . . . . 278<br />
EIR 22 Water used for public supplies in Water Resources Council<br />
(WRC) subregions in 1970 . . . . . . . . . . . . . . . . . . . . . . . . . . . . . . . . . . . . 279<br />
EIR 23 Water used for irrigation in Water Resources Council<br />
(WRC) subregions in 1970 . . . . . . . . . . . . . . . . . . . . . . . . . . . . . . . . . . . . 281<br />
EIR 24 Self-supplied water for industrial use in Water Resources<br />
Council (WRC) subregions in 1970 . . . . . . . . . . . . . . . . . . . . . . . . . . . 282<br />
EIR 25 Water used for thermoelectric power in Water Resources<br />
Council (WRC) subregions in 1970 . . . . . . . . . . . . . . . . . . . . . . . . . . . . . 284<br />
EIR 26 Water used for publi .c supplies in 1975 . . . . . . . . . . . . . . . . . . . . . . . 286<br />
EIR 27 Rural water use in 1975 . . . . . . . . . . . . . . . . . . . . . . . . . . . . . . . . . . . . . 288<br />
EIR 28 Water used for irrigation in 1975 . . . . . . . . . . . . . . . . . . . . . . . . . . . . 289<br />
EIR 29 Self-supplied water for industrial use in 1975 . . . . . . . . . . . . . . . 290<br />
EIR 30 Water used for thermoelectric power in 1975 . . . . . . . . . . . . . . . . . 292<br />
EIR 31 Water used for public supplies by hydrologic unit in<br />
1975 . . . . . . . . . . . . . . . . . . . . . . . . . . . . . . . . . . . . . . . . . . . . . . . . . . . . . . . . 293<br />
EIR 32 Rural water use by hydrologic unit in 1975 . . . . . . . . . . . . . . . . . . 295<br />
EIR 33 Water used for irrigation by hydrologic unit in 1975 . . . . . . . . 296<br />
EIR 34 Self supplied water for industrial use by hydrologic unit<br />
in 1975 . . . . . . . . . . . . . . . . . . . . . . . . . . . . . . . . . . . . . . . . . . . . . . . . . . . . . 297<br />
EIR 35 Water used for thermoelectric power by hydrologic unit in<br />
1975 . . . . . . . . . . . . . . . . . . . . . . . . . . . . . . . . . . . . . . . . . . . . . . . . . . . . . . . . 300<br />
EIR 36 Water used for public supplies in 1977 . . . . . . . . . . . . . . . . . . . . . . . 302<br />
xiv
Number<br />
Pag e<br />
EIR 37 Rural water use in 1977 . . . . . . . . . . . . . . . . . . . . . . . . . . . . . . . . . . . . . 303<br />
EIR 38 Water used for irrigation in 1977, . . .• .•• .•••••••••••••••••• 304<br />
EIR 39 Self-supplied water for industrial use for 1977 .•••••••••••• 305<br />
EIR 40 Water used for thermoelectric power in 1977 . . . . . . . . . . . . . . . . . 307<br />
EIR 41 Water used for public supplies by hydrologic unit in<br />
1977 . . . . . . . . . . . . . . . . . . . . . . . . . . . . . . . . . . . . . . . . . . . . . . . . . . . . . . . . . 308<br />
EIR 42 Rural water use by hydrologic unit in 1977 . . . .• . . . . .••••••••• 310<br />
EIR 43 Water used for irrigation by hydrologic unit in 1977•••••••• 312<br />
EIR 44 Self-supplied water for industrial use by hydrologic unit<br />
in 1977 . ;. . . . . . . . . . . . . . . . . . . . . . . . . . . . . . . . . . . . . . . . . . . . . . . . . . . . 313<br />
EIR 45 Water used for thermoelectric power by hydrologic unit in<br />
1977 . . . . . . . . . . . . . . . . . . . . . . . . . . . . . . . . . . . . . . . . . . . . . . . . . . . . . . . . 316<br />
EIR 46 Endangered and threatened species in Bay County . . . . . . . . . . . . . 318<br />
EIR 47 Endangered and threatened species in Escambia County . . . . . . . . 319<br />
EIR 48 Endangered and threatened species in Franklin County .••••••••• a20<br />
EIR 49 Endangered and threatened species in Gulf County • .• . ••••••••• 321<br />
EIR 50 Endangered and threatened species in Okaloosa County . . . . . . . . 322<br />
EIR 51 Endangered and threatened species in Santa Rosa County . . . . . . . 323<br />
EIR 52 Endangered and threatened species in Walton County,,,,,,,,,,, 325<br />
EIR 53 Identification of beach and river erosion problems : . . . . . . . . . . 326<br />
EIR 54 Destruction of natural vegetation and habitat . . . . . . . . . . . . .•• . . 328<br />
EIR 55 Aquatic plant problems and/or eutrophication . . . . . . . . . . . . . . . . . 329<br />
EIR 56 Summary of U .S . Army Corps of Engineers projects in<br />
northwest Florida . . . . . . . . . . . . . . . . . . . . . . . . . . . . . . . . . . . . . . . . . . . . 330<br />
EIR 57 Developments of regional impact, binding letters of<br />
interpretation, requests for determination for 1973, 1974,<br />
1975, 1976, 1977, 1978, 1979 and 1980 .;••••••••••••••••••••••• 333<br />
xv
Number Page<br />
EIR 58 Developments of Regional Impact (DRI), type size and<br />
status for fiscal years 1973-74, 1974-75, 1975-76, 1976-<br />
77, 1977-78 and 1978-79 as of 10 October 1980 . . . . . . . . . . . . . . . . 335<br />
EIR 59 Permanent network stations in northwest Florida by geographical<br />
areas . . . . . . . . . . . . . . . . . . . . . . . . . . . . . . . . . . . . . . . . . . . . . 337<br />
EIR 60 Treatment capacity needs and costs through the year<br />
2000 . . . . . . . . . . . . . . . . . . . . . . . . . . . . . . . . . . . . . . . . . . . . . . . . . . . . . . . . 338<br />
EIR 61 National and Florida ambient air quality standards . . . . .••••• 340<br />
xv i
A/ C<br />
A F B<br />
AFDC<br />
AGR<br />
Ave<br />
bbl<br />
Btu<br />
BOD<br />
Co<br />
Corp<br />
Ct<br />
c wt<br />
D<br />
dB<br />
Dr<br />
DRI<br />
du<br />
E<br />
E<br />
EIR<br />
EMP<br />
ENE<br />
EPA<br />
est<br />
FCOLI<br />
ft2<br />
ft<br />
ft3<br />
FSH<br />
FY<br />
gal<br />
GFWFC<br />
GW<br />
ha<br />
HH<br />
Hwy<br />
Inc<br />
Jct<br />
km<br />
kWh<br />
kV<br />
lb<br />
lf<br />
1 in ft<br />
LPG<br />
LU<br />
Ltd<br />
m/day<br />
Mcf<br />
ABBREVIATIONS<br />
Air conditioning<br />
Air Force Base<br />
Aid to families with dependent children<br />
Agriculture<br />
Avenue<br />
Barrel, barrels<br />
British thermal unit<br />
Biochemical oxygen demand<br />
Company<br />
Corporation<br />
Court<br />
Hundredweight<br />
Data withheld to avoid disclosure of individual establishments<br />
Decibel<br />
Drive<br />
Development of regional impact<br />
Dwelling units<br />
Endangered<br />
East<br />
Environmental Issues and Regulations<br />
Employment<br />
East northeast<br />
Environmental Protection Agency<br />
Estimate<br />
Fecal coliform<br />
Foot, feet<br />
Square foot, square feet<br />
Cubic foot, cubic feet<br />
Fish<br />
Fiscal year<br />
Gallon, gallons<br />
Game and Fresh water Fish Commission<br />
Ground water<br />
Hectare, hectares<br />
Head of household<br />
Highway<br />
Incorporated<br />
Junction<br />
Kilometer<br />
Kilowatthour<br />
Kilovolt<br />
Pound, pounds<br />
Landf i l l<br />
Linear foot, linear feet<br />
Liquid petroleum gas<br />
Land use<br />
Limited<br />
Meters per day<br />
Million cubic feet<br />
xv i i
Mgal/d Million gallons per day<br />
mg/l Milligrams per liter<br />
MHP Mobile home park<br />
mi2 Mile, miles<br />
mi Square mile, square miles<br />
misc . Miscellaneous<br />
mm Millimeter<br />
MP Minerals Production<br />
MW Monitoring wells, megawatts<br />
MWh Megawatthours<br />
N . North<br />
N A . Not appl icable<br />
N .D . No data<br />
NE . Northeast<br />
NNW . North northwest<br />
NRP No reported production<br />
NTSB National Transportation Safety Board<br />
NW . Northwest<br />
oz Ounce<br />
POP Population<br />
ppm Parts per million<br />
PU Public utilities<br />
Rd . Road<br />
RR . Railroad<br />
Rt . Route<br />
R/T Recreation and Tourism<br />
RV Recreational vehicle<br />
S . South<br />
SCi Special category item<br />
SD Subdivision<br />
SE . Southeast<br />
SER Services (health)<br />
SIC Standard Industrial Code<br />
slf Sanit ary landfill<br />
SR State road<br />
SSC Species of special concern<br />
St . Street<br />
STP Sewage treatment plant<br />
SW . Southwest<br />
SW Surface water<br />
T Threatened<br />
tbbl Thousand barrels<br />
TCOLI Total coliform<br />
TP Trailer park<br />
TRANS Transportation<br />
TSS Total suspended solids<br />
ug/m2 Micrograms per square meter<br />
UR Under review<br />
W . West<br />
WLA Waste load allocation<br />
yd3 Yard, yards<br />
yd3 Cubic yards<br />
yd /d Cubic yards per day<br />
xviii
$ Dollar, dollars<br />
% Percent<br />
" Inch, inches<br />
# Number<br />
& And<br />
Distance<br />
SYMBOLS<br />
METRIC-ENGLISH EQUIVALENTS<br />
1 cm = 0 .39 i n 1 i n= 2 .54 cm<br />
1 m= 39 .38 i n 1 f t= 0 .30 m<br />
1 km=0.62mi 1yd=0 .91m<br />
1 m i= 1 .61 k m<br />
Area<br />
1m2= 1 .2yd2 1 ft2= 0 .09m2<br />
1 km2 =0 .39mi2 1 yd2= 0 .83m2<br />
1 ha = 2 .5 acres 1 acr2e = 0 .40 ~a<br />
1 mi = 2 .59km<br />
Weight<br />
1 g= 0 .035 oz l oz = 28 .35 g<br />
1 kg = 2 .20 1 b 1 1 b= 453 .60 g<br />
1 mt (1,000 kg) = 1 .1 t (2,204 .6 lb) 1 lb = 0 .45 kg<br />
1t=0 .91mt<br />
Volume<br />
lml =0 .03f1 oz l fl oz=29 .57m1<br />
1 1 i ter = 2 .1 pt 1 pt = 0 .47 1 i ter<br />
1 l i ter = 1 .06 qt 1 qt = 0 .95 l i ter<br />
1 b4l = 42 g i l 1 gal = 3 .79 liter<br />
1m =35 ft<br />
1 3=1 3 d3<br />
1<br />
1 ft m . y y d3<br />
=0 .03m<br />
=0 . 76m3<br />
Temperature<br />
C ° = 5/9 ( F °-32 ) F ° = 9/5C ° + 32<br />
xix
PUBLIC UTILITIES (PU)
15<br />
0 11 13<br />
3 0 2e ~32 1<br />
32 13 14<br />
10<br />
9•<br />
10<br />
~~ 24009<br />
350<br />
1 Alachua 16 uk.lana 280<br />
2 Bartow<br />
3 8lountstown<br />
4 8ushnNl<br />
19 Lake HotINM<br />
20 Lake Worth<br />
21 Lsasburp<br />
10 190<br />
25<br />
023<br />
40 21<br />
1~ r 27 27<br />
5 Chattahoochs . 22 Moore Haven 17•_<br />
6 Cl .wlston<br />
7 Fort Msada<br />
23 Mount Dora<br />
24 N.wbarry<br />
~ 31<br />
18 30<br />
2<br />
8 Fort Plarc.<br />
9 O;alnssvllh 26 Ocala<br />
a. J . R. K .Ilsy<br />
25 Naw 8myma B..oh .<br />
27 OrlafWo<br />
b. Deerhaven a. Laka Hiphland<br />
07 3 3<br />
340 290<br />
10 On»n Cdva Sprin9s<br />
b . Indian Riwr<br />
22<br />
11 Havanna 26 Oulncy 2 0<br />
12 Homestead 29 BsOrin9 1j~ b<br />
13 Jacksonvllla<br />
a . Northsid.<br />
30 8tarka<br />
31 8aint Cloud<br />
b. Kennedy 32 Tallahassss<br />
o . Southslds<br />
a . A. B . Hopkins<br />
12<br />
14 Jacksonvill . Beach b . 8.0 . Purdom 0 :<br />
15 Jlm Woodruff Dam• 33 Varo Beach<br />
16 K.y Wast<br />
34 Wauchula<br />
17 Klsslmmea 35 Wllltston 0<br />
Do~.CJ<br />
• Oansratinp<br />
O Non43ansratlnp<br />
Approximate service area<br />
boundarlas for major<br />
public utllitss<br />
Figure 1 . Publicly owned utilities (Florida Public Service Cormii .ssion 1979) .<br />
2<br />
18<br />
. 101<br />
8<br />
~
1L I ID<br />
A. <strong>FLORIDA</strong> POWER AND UGHT<br />
1 Cape Canawrai<br />
2 Cutler<br />
3 Ft. Lauderdale<br />
4 Ft. Myers<br />
5 Manatee<br />
6 Martin<br />
7 Miami<br />
8 Palatka<br />
9 Port Everglades<br />
10 Rivera<br />
11 Sanford<br />
12 St. Lucie<br />
13 Turkey Point<br />
B. <strong>FLORIDA</strong> POWER CORPORATION<br />
1 Anclote<br />
2 Avon Park<br />
3 Bartow<br />
4 Bayboro<br />
5 Crystal River<br />
6 Higgins<br />
7 Intercession City<br />
8 Inplls<br />
9 Port St. Joe<br />
10 Rio Pinar<br />
11 Suwannee River<br />
12 Turner<br />
C . TAMPA ELECTRIC COMPANY<br />
1 Blp Bsnd<br />
2 Gannon<br />
3 Hookers Point<br />
2<br />
9<br />
D. GULF POWER CORPORATION<br />
I Crist<br />
2 Lansinq Smith<br />
3 Scholtz<br />
E. <strong>FLORIDA</strong> PUBLIC UTIUTIEB<br />
1 Fsmandlna<br />
F. REEDY CREEK<br />
STEAM GENERATION<br />
0 Opsratinp<br />
O Under Construction<br />
NUCLEAR GENERATION<br />
A Operatlny<br />
A Under Construction<br />
INTERNAL COMBUSTION OR<br />
GAS TURBINE<br />
/ Operating<br />
O Under Construction<br />
* IOU HEADOUARTERS<br />
Figure 2 . Privately owned utilities (Florida Public Service Commission 1979) .<br />
3<br />
„<br />
B<br />
5<br />
B<br />
E<br />
Os<br />
11<br />
f 1<br />
1 7<br />
el C<br />
31<br />
4<br />
1 •<br />
~<br />
2<br />
/ 1<br />
5 2<br />
\!' •<br />
1<br />
10<br />
A<br />
13<br />
3=
~<br />
Table PU 1 . Counties served by electrical utilities in 1979 (Florida Public Service Commission, Research<br />
and Management Studies Department 1980) .<br />
Florida Power Gulf Power Escambiaa<br />
County Corporation Corporation Choctawhatcheea River<br />
Bay X X<br />
Escambia x<br />
Franklin X ' X<br />
Gulf X<br />
Okaloosa X X<br />
Santa Rosa X X X<br />
Walton X X<br />
Alabama Gulfa<br />
County Power Coast Talquina<br />
Bay<br />
Escambia<br />
Franklin<br />
Gulf X<br />
Okaloosa X<br />
Santa Rosa<br />
Walton X<br />
a Non-generating rural electric cooperatives .
Ln<br />
Table PU 2 . Net generation, amount, and price of fuel consumed, and British thermal unit (Btu) per kilowatthour<br />
(kWh) for steam-electric plants in 1955 (U .S . Federal Power Commission ca . 1965c) .<br />
Fuel consumed in 1955<br />
Generating plant Net generation Coal Oil<br />
(million kWh) 0 tons Cost per ton 0 Cost per b<br />
($) ($)<br />
Florida Power Corp .<br />
Avon Park<br />
Bayboro<br />
Higgins<br />
Inglis<br />
Suwanee River<br />
G .E . Turner<br />
Florida Power and Light Co .<br />
Cutler<br />
Lauderdale<br />
Miami<br />
Miami Beach<br />
Palatka<br />
Riviera<br />
Sarasota<br />
242 .00 0 0 436 .50 2 .51<br />
349 .90 0 0 745 .50 2 .16<br />
817 .60 0 0 1,435 .00 2 .16<br />
204 .70 0 0 471 .20 2 .24<br />
381 .10 0 0 476 .80 2 .65<br />
230 .10 0 0 450 .90 2 .34<br />
1,418 .70 0 0 2,480 .80 2 .30<br />
269 .40 0 0 620 .20 2 .23<br />
279 .00 0 0 608 .20 2 .24<br />
155 .20 0 0 318 .30 2 .27<br />
252 .50 0 0 490 .90 2 .31<br />
695 .50 0 0 1,263 .80 2 .20<br />
216 .30 0 0 438 .70 2 .29<br />
Continued
Table PU 2 . Continued .<br />
Generating plant<br />
Fuel consumed in 1955<br />
Gas Average<br />
Million ft3 Cost per 1000 ft3 Btu per kWh<br />
Florida Power Corp .<br />
Avon Park 0 0 11,370<br />
Bayboro 0 0 13,465<br />
Higgins 0 0 11,100<br />
Inglis 0 0 14,575<br />
Suwanee River 0 0 11,885<br />
G .E . Turner 0 0 12,265<br />
Florida Power and Light Co .<br />
C' Cutler 0 0 11,059<br />
Lauderdale 0 0 14,499<br />
Miami 0 0 13,802<br />
Mi ami Beach 0 0 12,954<br />
Palatka 0 0 12,164<br />
Riviera 0 0 11,493<br />
Sarasota 0 0 12,737<br />
Continued
V<br />
Tab le PU 2 . Concluded .<br />
Fuel consumed in 1955<br />
Generating plant Net generation Coal Oil<br />
(million kWh) tons ost per on Cost per<br />
(E) ($)<br />
Gulf Power Co .<br />
Pensacola (Crist) 456 .60 0 0 0 0<br />
River Junction (Scholz) 398 .10 174 .90 6 .75 0 0<br />
Utility Board of the City of<br />
Key We s t 58 .30 0 0 138 .20 2 .58<br />
Tampa Electric Co .<br />
Hookers Point 1,053 .10 0 0 1,940 .90 2 .15<br />
Peter 0 . Knight 225 .50 0 0 552 .60 2 .15
00<br />
Table PU 3 . Net generation, amount, and price of fuel consumed, and British thermal unit (Btu) per kilowatthour<br />
(kWh) for steam-electric plants in 1960 (U .S . Federal Power Commission ca . 1961c) .<br />
Generating plant Net generation<br />
(million kWh) 1000 tons<br />
Fuel<br />
Coal<br />
os per<br />
($)<br />
consumed in 1960<br />
Oil<br />
ton Cost per<br />
M<br />
Florida Power Corp .<br />
Avon Park 227 .00 0 0 39 .90 2 .57<br />
Bayboro 256 .10 0 0 549 .70 2 .32<br />
G .E . Turner 798 .50 0 0 41 .20 2 .44<br />
Higgins 621 .90 0 0 1,043 .40 2 .28<br />
Inglis 140 .60 0 0 57 .10 2 .48<br />
P .L . Bartow 755 .00 0 0 37 .40 2 .29<br />
-Suwanee River 366 .80 0 0 18 .00 2 .91<br />
Florida Power and Light Co .<br />
Cutler 1,846 .20 0 0 495 .40 2 .34<br />
Fort Myers 779 .10 0 0 123 .10 2 .23<br />
Lauderdale 1,958 .70 0 0 840 .10 2 .33<br />
Mi ami 219 .10 0 0 370 .80 2 .36<br />
Miami Beach 52 .80 0 0 117 .30 2 .37<br />
Pal atka 516 .20 0 0 461 .50 2 .13<br />
Riviera 631 .00 0 0 1,059 .20 2 .04<br />
Port Evergl ades 695 .90 0 0 1,079 .60 2 .05<br />
Sanford 914 .10 0 0 41 .60 2 .18<br />
Sarasota 51 .40 0 0 89 .10 2 .24<br />
Continued
%0<br />
Table PU 3 . Continued .<br />
Generating plant<br />
Florida Power Corp .<br />
Avon Park<br />
Bayboro<br />
G .E . Turner<br />
Higgins<br />
Inglis<br />
P .L . Bartow<br />
Suwanee River<br />
Florida Power and Light Co .<br />
Cutler<br />
Fort Myers<br />
Lauderdale<br />
Miami<br />
Miami Beach<br />
Pal atka<br />
Riviera<br />
Port Everglades<br />
Sanford<br />
Sarasota<br />
Fuel consumed in 1955<br />
Gas Average<br />
Million ft3 Cost per 1000 ft3 Btu per kWh<br />
~$)<br />
0 0 12,879<br />
549 .70 2 .32 13,617<br />
0 0 11,118<br />
0 0 11,847<br />
1,475 .80 35 .20 13,825<br />
7,106 .40 34 .64 10,364<br />
3,768 .80 37 .96 11,112<br />
17,780 .30 34 .80 11,316<br />
0 0 9,971<br />
16,239 .10 34 .90 10,983<br />
656 .10 34 .80 13,636<br />
0 0 13,959<br />
2,291 .00 34 .80 11,252<br />
799 .80 34 .90 11,848<br />
0 0 9,755<br />
9,271 .60 34 .80 10,430<br />
175 .50 34 .80 14,369<br />
Continued
~<br />
Table PU 3 . Concluded .<br />
Fuel consumed in 1955<br />
Generating plant Net generation Coal Oil<br />
(million kWh) 1000 tons Cost per ton 0 Cost per<br />
($) M<br />
GU 1 f Power Co .<br />
Pensacola (Crist) 710 .90 212 .80 6 .07 0 0<br />
River Junction (Scholz) 364 .90 166 .00 7 .50 0 0<br />
Utility Board of the City of<br />
Key West 99 .70 0 0 209 .30 2 .51<br />
Tampa Electric Co .<br />
Hookers Point 686 .90 0 0 1,349 .00 2 .21<br />
Peter 0 . Kn i ght 181 .50 0 0 552 .60 2 .15<br />
F .J . Gannon 1,629 .10 725 .70 7 .78 0 0<br />
Generating plant<br />
Fuel consumed in 1955<br />
Gas Average<br />
Million ft3 Cost per 1000 ft3 Btu per kWh<br />
($)<br />
Gu l f Power Co .<br />
Pensacola (Crist) 2,322 .40 29 .67 23,886<br />
River Junction (Scholz) 0 0 11,649<br />
Utility Board of the City of<br />
Key West 0 0 0<br />
Tampa Electric Co .<br />
Hookers Point 0 0 10,760<br />
Peter 0 . Knight 0 0 15,957<br />
F .J . Gannon 0 0 10,760
~<br />
Table PU 4 . Net generation, amount, and price of fuel consumed, and British thermal unit (Btu) per kilowatthour<br />
(kWh) for steam-electric plants in 1965 (U .S . Federal Power Commission 1966a) .<br />
Fuel consumed in 1965<br />
Generating plant Net generation Coal Oil<br />
(million kWh) 1000 tons Cost per ton 0 Cost per BET<br />
($) ($)<br />
Florida Power Corp .<br />
Avon Park<br />
P .L . Bartow<br />
Bayboro<br />
Higgins<br />
Suwanee<br />
G .E . Turner<br />
Florida Power and Light Co .<br />
Cape Kennedy<br />
Fort Myers<br />
Lauderdale<br />
Palatka<br />
Cutler<br />
Port Everglades<br />
Riviera<br />
Sanford<br />
186 .20 0 0 0 0<br />
2,413 .00 0 0 3,489 .20 2 .31<br />
186 .30 0 0 412 .50 2 .37<br />
536 .70 0 0 249 .60 2 .43<br />
540 .00 0 0 38 .90 2 .69<br />
999 .80 0 0 11 .60 2 .63<br />
1,572 .10 0 0 2,391 .00 2 .06<br />
457 .50 0 0 746 .70 2 .25<br />
706 .70 0 0 359 .90 2 .17<br />
427 .50 0~ 0 0 0<br />
1,090 .80 0 0 6 .40 2 .21<br />
5,565 .80 0 0 8,491 .90 2 .06<br />
2,835 .70 0 0 3,116 .20 2 .03<br />
576 .00 0 0 198 .30 2 .14<br />
Continued
~<br />
N<br />
Table PU 4 . Continued .<br />
Fuel consumed in 1965<br />
Generating plant Gas Average<br />
Million ft3 Cost per 1000 ft3 Btu per kWh<br />
($)<br />
Florida Power Corp .<br />
Avon Park 2,143 .90 31 .99<br />
P .L . Bartow 1,740 .50 32 .40<br />
Bayboro 0 0<br />
Higgins 4,759 .50 32 .18<br />
Suwanee 5,578 .40 36 .51<br />
G .E . Turner 10,789 .60 32 .28<br />
Florida Power and Light Co .<br />
Cape Kennedy 0 0<br />
Fort Myers 0 0<br />
Lauderdal e 5,360 .70 34 .50<br />
Pal atka 2,072 .00 34 .40<br />
Port Everglades 0 0<br />
Riviera 8,226 .80 34 .50<br />
Sanford 4,969 .10 34 .50<br />
Continued<br />
11,922<br />
9,857<br />
14,068<br />
12,051<br />
11,327<br />
11,190<br />
9,537<br />
10,330<br />
10,830<br />
11,003<br />
9,606<br />
9,791<br />
10,776
~<br />
w<br />
Table PU 4 . Concluded .<br />
Fuel consumed in 1965<br />
Generating plant Net generation Coal Oil<br />
(million kWh) 100 tons Cost per ton 1000 Cost per bbl<br />
($) ($)<br />
Gulf Power Co .<br />
Pensacola (Crist) 1,303 .00 455 .70 6 .28 0 0<br />
River Junction (Scholz) 267 .90 128 .20 7 .44 0 0<br />
Utility Board of the City of<br />
Key We s t 177 .20 0 0 390 .30 0<br />
Lansing Smith 507 .60 212 .30 5 .74 0 0<br />
Tampa Electric Co .<br />
Hookers Point 627 .60 0 0 1,272 .20 2 .07<br />
F .J . Gannon 3,441 .00 1,526 .40 6 .60 0 0<br />
Fuel consumed in 1965<br />
Generating plant Gas Average<br />
Million ft3 Cost per 1000 ft3 Btu per kWh<br />
($)<br />
Gulf Power Co .<br />
Pensacola (Crist) 1,718 .20 23 .97 10,231<br />
River Junction (Scholz) 0 0 12,041<br />
Utility Board of the City of<br />
Key West 0 0 13,769<br />
Tampa Electric Co .<br />
Hookers Point 0 0 12,775<br />
F .J . Gannon 0 0 10,278
~ 5 '<br />
0<br />
0 16<br />
90 O14<br />
I A<br />
0<br />
150 / 10<br />
I Alabama Electric Cooperative, Inc.•Andalusia, Ala. ~ 1<br />
2 Central Florida Electric Cooperative-Chiefland<br />
3 Choctawhatchee Electric Cooperative-Defuniak Springs<br />
4 Clay Electric Cooperative-Keystone Heights (<br />
.`<br />
5 Escambia River Electric Cooperative, Inc.Jacksonville 110<br />
•<br />
6 Florida Keys Electric Cooperative-Tavernier ~<br />
7 Glades Electric Cooperative, Inc: Moore Haven , ~<br />
8 Gul/ Coast Electric Cooperative, Inc: Wewahitcha ~<br />
9 Lee County Electric Cooperative-North Fort Myers ~~<br />
10 Okefenokee Rural Electric Membership Cooperative-Nahunta, Ga .<br />
11 Peace River Electric Cooperative-Wauchula<br />
12 Sumter Electric Cooperative, Inc .•Sumterville (~<br />
13 Suwannee Valley Electric Cooperative, Inc .•Live Oak<br />
14 Talpuin Electric Cooperative, Inc .-Oulncy ~<br />
00<br />
15 Tri-County Electric Cooperative, Inc .-Madison<br />
16 West Florida Electric Cooperative, Inc .-Graceville<br />
17 Withlacoochee River Electric Cooperative, Inc .•Dade City<br />
0 Non-Generating • Generating<br />
F%gure.3, Rural electric cooperatives (Florida Public Service Comission<br />
1Q74) .<br />
14<br />
02<br />
1<br />
17<br />
7<br />
~
~_A<br />
Ln<br />
Table PU 5 . Net generation, amount, and price of fuel consumed, and British thermal unit (Btu) per kilowatthour<br />
(kWh) for steam-electric plants in 1970 (U .S . Federal Power Commission 1972c) .<br />
Fuel consumed in 1970<br />
Generating plant Net generation Coal Oil<br />
(million kWh) 100 tons Cost per ton 1000 b Cost per<br />
($) ($)<br />
Florida Power Corp .<br />
Avon Park<br />
P .L . Bartow<br />
Crystal River<br />
Higgins<br />
Suwanee<br />
G .E . Turner<br />
Florida Power and Light Co .<br />
Cape Kennedy<br />
Cutler<br />
Fort Myers<br />
Lauderdale<br />
Palatka<br />
Port Everglades<br />
Riviera<br />
Sanford<br />
Turkey Point<br />
228 .40 0 0 102 .10 2 .34<br />
2,987 .00 0 0 4,325 .20 1 .71<br />
3,503 .30 1,072 .30 6 .85 1,707 .10 1 .83<br />
700 .70 0 0 855 .00 1 .77<br />
839 .40 0 0 680 .60 2 .33<br />
1,059 .50 0 0 54 .80 2 .39<br />
4,224 .30 0 0 3,177 .30 1 .87<br />
858 .00 0 0 215 .60 2 .26<br />
2,341 .00 0 0 3,606 .50 2 .13<br />
1,655 .00 0 0 764 .70 1 .89<br />
341 .90 0 0 438 .30 1 .83<br />
6,798 .90 0 0 6,660 .20 2 .09<br />
3,776 .50 0 0 2,464 .30 1 .75<br />
600 .70 0 0 817 .30 1 .88<br />
4,342 .00 0 0 4,615 .10 1 .82<br />
Continued
I.o,<br />
Table PU 5 . Continued .<br />
Generating plant<br />
Fuel consumed in 1970<br />
Gas Average<br />
Million ft3 Cost per 1000 ft3 Btu per kWh<br />
~$)<br />
Florida Power Corp .<br />
Avon Park 2,134 .90 38 .67 12,404<br />
P .L . Bartow 1,790 .80 41 .70 9,643<br />
Crystal River 9,936<br />
Higgins 2,944 .30 41 .16 12,006<br />
Suwanee 4,967 .60 36 .31 11,259<br />
G .E . Turner 11,545 .70 39 .30 11,504<br />
Florida Power and Light Co .<br />
Cape Kennedy 21,748 .60 36 .60 9,873<br />
Cut l er 9,205 .10 36 .30 12,305<br />
Fort Myers 9,745<br />
Lauderdale 12,783 .80 36 .50 10,619<br />
Pal atka 1,317 .30 37 .30 11,850<br />
Port Everglades 1,000 .00 36 .10 10,035<br />
R i v i era 23,114 .60 36 .60 10,308<br />
Sanford 1,194 .10 38 .90 10,466<br />
Turkey Point 13,232 .80 36 .30 9,691<br />
Continued
~<br />
v<br />
Tab l e PU 5 . Conc l uded .<br />
Fuel consumed in 1970<br />
Generating plant Net generation Coal Oil<br />
(million kWh) 100 tons Cost per ton 1000 bb Cost per b<br />
($) ($)<br />
Gul f Power Co .<br />
Pensacola (Crist) 2,555 .60 351 .00 7 .56 0 0<br />
River Junction (Scholz) 389 .40 186 .00 9 .17 0 0<br />
Lansing Smith 1,961 .50 868 .00 6 .79 0 0<br />
Tampa Electric Co .<br />
Hookers Point 960 .90 0 0 1,903 .30 1 .77<br />
F .J . Gannon 5,350 .00 2,466 .30 6 .79 0 0<br />
Generating plant<br />
Fuel consumed in 1970<br />
Gas Average<br />
Million ft3 Cost per 1000 ft3 Btu per kWh<br />
($)<br />
Gu l f Power Co .<br />
Pensacola (Crist) 18,934 .00 24 .50 11,140<br />
River Junction (Scholz) 0 0 12,005<br />
Lansing Smith 0 0 10,011<br />
Tampa Electric Co .<br />
Hookers Point 0 0 12,473<br />
F .J . Gannon 0 0 10,356
~_A<br />
00<br />
Table PU 6 . Net generation, amount, and price of fuel consumed, and British thermal unit (Btu) per kilowatthour<br />
(kWh) for steam-electric plants in 1975 (U .S . Department of Energy, Energy Information<br />
Administration 1977) .<br />
Fuel consumed in 1975<br />
Generating plant Net generation Coal Oil<br />
(million kWh) 1000 tons Cost per ton 0 Cost per bbl<br />
(E) M<br />
Florida Power Corp .<br />
Avon Park 9 .90 0 0 2 .70 5 .36<br />
P .L . Bartow 41 .00 0 0 95 .80 12 .83<br />
Bayboro 89 .90 0 0 209 .80 12 .73<br />
DeBarry 0 .70 0 0 1 .20 14 .22<br />
Higgins 18 .40 0 0 1 .00 11 .61<br />
Intercession City 243 .10 0 0 553 .80 13 .58<br />
Port St . Joe 1 .10 0 0 3 .40 9 .21<br />
Rio Pinar 0 .40 0 0 1 .30 15 .11<br />
Turner 66 .80 0 0 153 .80 15 .86<br />
Florida Power and Light Co .<br />
Fort Myers 718 .00 0 0 1,620 .90 12 .31<br />
Lauderdal e 188 .50 0 0 262 .40 11 .45<br />
Port Everglades 239 .90 0 0 409 .80 12 .02<br />
Continued
I .ko<br />
Table PU 6 . Continued .<br />
Generating plant<br />
Florida Power Corp .<br />
Avon Park<br />
P .L . Bartow<br />
Bayboro<br />
DeBarry<br />
Higgins<br />
Intercession City<br />
Port St . Joe<br />
Rio Pinar<br />
Turner<br />
Florida Power and Light Co .<br />
Fort Myers<br />
Lauderdale<br />
Port Everglades<br />
Fuel consumed in 1975<br />
Gas Average<br />
Million ft3 Cost per 1000 ft3 Btu per kWh<br />
($)<br />
145 .90 159 .59 16,709<br />
0 0 13,491<br />
0 0 13,402<br />
0 0 9,767<br />
284 .40 160 .68 16,291<br />
0 0 13,105<br />
0 0 17,286<br />
0 0 18,372<br />
0 0 13,364<br />
0 0 13,112<br />
0 0 16,434<br />
0 0 15,674<br />
Continued
N<br />
O<br />
Table PU 6 . Concluded .<br />
Fuel consumed in 1975<br />
Generating plant Net generation Coal Oil<br />
(million kWh) 0 tons Cost per ton 0 Cost per bbl<br />
($) ($)<br />
Gu l f Power Co .<br />
Smith-Turbine A 13.80 0 0 384 .30 12 .37<br />
Tampa Electric Co .<br />
Big Bend 159.10 0 0 384 .30 12 .37<br />
F .J . Gannon 13.30 0 0 40 .00 12 .38<br />
Fuel consumed in 1975<br />
Generating plant Gas Average<br />
Million ft3 Cost per 1000 ft3 Btu per kWh<br />
($)<br />
Gu l f Power Co .<br />
Smith-Turbine A 0 0 14,363<br />
Tampa Electric Co .<br />
Big Bend 0 0 13,992<br />
F .J. Gannon 0 0 17,387
N<br />
~<br />
Table PU 7 . Net generation, amount, and price of fuel consumed, and British thermal unit (Btu) per kilowatthour<br />
(kWh) for steam-electric plants in 1978 (U .S . Department of Energy, Energy Information<br />
Administration 1980) .<br />
Fuel consumed in 1978<br />
Generating plant Net generation Coal Oil<br />
(million kWh) 100 tons Cost per ton 0 ost per<br />
($) ($)<br />
Florida Power Corp .<br />
Anclote<br />
Avon Park<br />
P .L . Bartow<br />
Higgins<br />
Suwanee<br />
G .E . Turner<br />
Crystal River<br />
Florida Power and Light Co .<br />
Cape Canaveral<br />
Fort Myers<br />
Lauderdale<br />
Manatee<br />
Port Everglades<br />
Putnam Comb . Cyle<br />
Riviera<br />
Sanford<br />
Turkey Point<br />
3,202 .40 0 0 4,967 .00 12 .00<br />
212 .60 0 0 48 .00 12 .00<br />
2,819 .70 0 0 3,365 .00 11 .00<br />
614 .30 0 0 1,000 .00 11 .00<br />
778 .50 0 0 1,066 .00 12 .00<br />
850 .50 0 0 499 .00 12 .00<br />
4,058 .70 1,005 .00 39 .00 2,856 .00 11 .00<br />
4,311 .50 0 0 3,358 .00 11 .00<br />
2,410 .90 0 0 3,787 .00 12 .00<br />
1,132 .90 0 0 996 .00 12 .00<br />
5,443 .50 0 0 8,770 .00 12 .00<br />
6,061 .10 0 0 6,616 .00 12 .00<br />
569 .90 0 0 1,031 .00 14 .00<br />
2,705 .50 0 0 1,579 .00 12 .00<br />
3,604 .10 0 0 5,399 .00 12 .00<br />
4,205 .60 0 0 4,341 .00 12 .00<br />
Continued
N<br />
N<br />
Table PU 7 . Continued .<br />
Fuel consumed in 1978<br />
Net generation Coal Oil<br />
(million kWh) (1000 tons cost per ton 0 s cost per b<br />
Gu l f Power Co .<br />
Pensacola (Crist) 3,716 .90 1,491 .00 31 .00 145 .00 12 .00<br />
River Junction (Scholz) 444 .60 220 .00 37 .00<br />
Lansing Smith 1,986 .70 901 .00 32.00 8 .00 16 .00<br />
Tampa Electric Co .<br />
Big Bend 5,542 .90 2,482 .00 35 .00 0 0<br />
F .J . Gannon 4,589 .70 1,091 .00 36 .00 3,515 .00 12 .00 '<br />
Hookers Point 563 .10 0 0 1,195 .00 12 .00<br />
Fuel consumed in 1978<br />
Gas Average<br />
million ft3 $ cost per 1000 ft3 Btu per kWh<br />
Gu l f Power Co .<br />
Pensacola (Crist) 9,141 .00 15 .00 11,921<br />
River Junction (Scholz) 0 0 12,116<br />
Lansaing Smith 0 0 10,518<br />
Tampa Electric Co .<br />
Big Bend 0 0 10,202<br />
F .J . Gannon 0 0 10,259<br />
Hookers Point 0 0 13,425<br />
Continued
N<br />
W<br />
Table PU 7 . Concluded .<br />
Net generation<br />
Average<br />
(million kWh) Grams used Cost per gram Btu per kWh<br />
Florida Power Corp .<br />
Crystal River (nuclear) 2,592 .10 215,291 27 .00 10,510<br />
Florida Power and Light Co .<br />
Turkey Point (nuclear) 8,273 .20 1,515,000 10 .00 11,545<br />
St . Lucie (nuclear) 5,000 .20 1,030,000 12 .00 11,171
N<br />
~<br />
Table PU 8 . Sales by generating utilities to final consumers from 1955 to 1977 (U .S . Federal Power Commission<br />
ca . 1956a, ca . 1956b, ca . 1961a, ca . 1961b, ca . 1966b, 1971a, 1971b, 1972a, 1972b, 1973a, 1973b, 1974b, ca .<br />
1974c, ca . 1975a, ca . 1975b, ca . 1976a, ca . 1976b ; U .S . Department of Energy, Energy Information Administration<br />
1978b, 1979b, 1979c) .<br />
Generating agency Sales (1,000 kWh) b class of customer<br />
Resi entia ommercia an in ustria t er ota<br />
1955<br />
Florida Power Corp .<br />
Florida Power and Light<br />
Co .<br />
Gulf Power Co .<br />
Tampa Electric Co .<br />
City of Key West<br />
1960<br />
Florida Power Corp .<br />
Florida Power and Light<br />
Co .<br />
Gu l f Power Co .<br />
Tampa Electric Co .<br />
City of Key West<br />
489,691 810,682 75,774 1,376,149<br />
1,416,204 1,487,113 173,208 3,076,930<br />
218,440 406,637 3,259 628,337<br />
346,423 781,712 60,584 1,188,731<br />
23,164 31,628 2,706 57,500<br />
1,115,400 1,389,603 127,222 2,632,227<br />
3,086,018 3,384,276 363,892 6,834,186<br />
407,562 733,146 5,504 1,146,213<br />
692,779 1,486,763 120,815 2,300,358<br />
38,524 49,652 5,519 93,697<br />
Continued
N<br />
LA<br />
Table PU 8 . Continued .<br />
Generating agency Sales (1,000 kWh) b class of customer<br />
Residentia Commercial Industria Other Tota<br />
1965<br />
Florida Power Corp . 1,803,163 1,019,706 1,190,612 206,434 4,219,916<br />
Florida Power and Light<br />
Co . 5,539,803 3,793,056 1,719,306 783,591 11,835,756<br />
Gulf Power Co . 677,088 406,765 743,756 9,355 1,836,964<br />
Tampa Electric Co . 1,079,211 247,046 2,381,060 196,155 3,903,472<br />
City of Key West 56,941 103,617 422 8,611 169,591<br />
1970<br />
Florida Power Corp . 3,696,115 1,844,192 1,912,379 324,444 7,777,130<br />
Florida Power and Light<br />
Co . 11,814,172 6,475,639 2,044,013 1,995,258 22,329,082<br />
Gulf Power Co . 1,306,042 679,105 1,067,629 12,842 3,065,618<br />
Tampa Electric Co . 2,019,513 1,040,568 2,772,105 341,916 6,174,103<br />
City of Key West 90,278 180,715 0 12,694 283,687<br />
1971<br />
Florida Power Corp . 4,133,335 2,134,106 2,029,686 353,638 8,650,764<br />
Florida Power and Light<br />
Co . 13,080,408 7,394,967 2,236,290 2,129,657 24,841,322<br />
Gulf Power Co . 1,425,040 751,482 1,163,748 13,364 3,353,634<br />
Tampa Electric Co . 2,200,274 1,165,324 2,717,704 397,612 6,480,914<br />
City of Key West 96,573 185,434 0 15,580 297,586<br />
Continued
N<br />
rn<br />
Table PU 8 . Continued .<br />
Generating agency Sales ~1,000 kWh) by class of customer<br />
Residentia Commercia ln ustria Ot er TotaT-<br />
1972<br />
Florida Power Corp .<br />
Florida Power and Light<br />
Co .<br />
Gu l f Power Co .<br />
Tampa Electric Co .<br />
City of Key West<br />
1973<br />
Florida Power Corp .<br />
Florida Power and Light<br />
Co .<br />
Gu l f Power Co .<br />
Tampa Electric Co .<br />
City of Key West<br />
1974<br />
Florida Power Corp, n<br />
Florida Power and Light<br />
Co .<br />
Gu l f Power Co .<br />
Tampa Electric Co .<br />
City of Key West<br />
4,717,235 2,403,398 2,196,766 376,302 9,693,801<br />
14,652,751 8,389,495 2,468,342 2,295,132 27,805,720<br />
1,601,686 860,022 1,308,145 12,040 3,781,893<br />
2,415,565 1,335,174 2,784,326 433,757 6,968,822<br />
105,537 192,130 0 18,130 315,796<br />
5,793,242 2,836,292 2,349,572 . 402,733 11,381,839<br />
16,822,972 10,180,485 2,754,968 1,358,641 31,117,070<br />
1,800,121 946,221 1,381,421 9,318 4,137,082<br />
2,843,497 1,524,899 3,003,586 471,159 7,843,142<br />
N .D . N .D . N .D . N .D . N .D .<br />
5,285,716 2,935,162 2,421,715 375,277 11,017,870<br />
16,802,406 11,041,205 2,645,724 746,990 31,236,325<br />
1,834,947 968,814 1,325,058 12,933 4,141,751<br />
2,827,811 1,639,687 3,101,695 462,250 8,031,443<br />
114,354 188,266 0 11,774 314,394<br />
Continued
N<br />
V<br />
Table PU 8 . Concluded .<br />
Generating agency Sales ( 1,000 kWh) by class of customer<br />
Residential Commercia lndustria Other Total<br />
1975<br />
Florida Power Corp .<br />
Florida Power and Light<br />
Co .<br />
Gulf Power Co .<br />
Tampa Electric Co .<br />
City of Key West<br />
1976<br />
Florida Power Corp .<br />
Florida Power and Light<br />
Co .<br />
Gu 1 f Power Co .<br />
Tampa Electric Co .<br />
City of Key West<br />
1977<br />
Florida Power Corp .<br />
Florida Power and Light<br />
Co .<br />
Gu 1 f Power Co .<br />
Tampa Electric Co .<br />
City of Key West<br />
5,411,991 3,187,479 2,479,378 375,754 11,454,601<br />
17,312,500 11,850,752 2,534,484 809,421 32,507,157<br />
1,888,855 1,040,678 1,339,523 12,950 4,282,007<br />
2,906,472 1,766,970 3,296,792 499,256 8,469,490<br />
102,576 189,393 0 6,905 298,873<br />
5,750,889 3,298,036 2,690,524 429,578 12,169,027<br />
17,625,343 12,117,063 2,596,480 789,870 33,128,756<br />
2,046,577 1,127,674 1,435,467 12,955 4,622,674<br />
2,910,939 1,803,882 3,563,742 521,943 8,800,505<br />
110,406 184,943 0 7,264 302,614<br />
6,373,899 3,526,562 2,813,000 467,607 13,181,069<br />
19,073,674 12,885,079 2,756,289 802,570 35,519,614<br />
2,156,383 1,206,666 1,494,138 13,958 4,871,145<br />
3,139,441 1,904,262 4,007,816 550,877 9,602,396<br />
N .D . N .D . N .D . N .D . N .D .
N<br />
00<br />
Table PU 9 . Sales by non-generating rural electric cooperatives to final consumers in 1975 and 1978<br />
(Florida Public Service Commission, Research and Management Studies Department 1979, 1980) .<br />
Rural electric<br />
cooperatives<br />
1975<br />
Central Florida<br />
Choctawhachee<br />
Escambia River<br />
Gulf Coast<br />
Lee County<br />
Peace River<br />
Sumter<br />
Talquin<br />
West Florida<br />
Withlahoochee River<br />
1978<br />
Central Florida<br />
Choctawhatchee<br />
Escambia River<br />
Gulf Coast<br />
Lee County<br />
Peace River<br />
Sumter<br />
Talquin<br />
West Florida<br />
Withlahoochee River<br />
Sales (1,000 kWh) b class of customer<br />
esi entia ommercia n ustria t er ota<br />
64,196 8,034 2,453 1,971 76,654<br />
77,509 36,224 162 2,0044 115,899<br />
48,912 5,569 4,174 4,195 62,850<br />
45,445 6,305 3,446 990 56,186<br />
370,719 183,972 14,605 7,636 576,932<br />
67,617 10,619 5,813 12,536 96,585<br />
206,910 29,567 29,151 6,053 271,681<br />
175,214 20,840 19,784 2,135 217,973<br />
118,062 8,175 825 3,195 130,260<br />
293,062 49,559 23,640 13,375 379,636<br />
0 12,209 2,501 85,556 100,266<br />
95,352 42,013 0 311 137,676<br />
0 5,847 4,661 64,037 74,545<br />
57,021 6,716, 5,187 1,075 69,999<br />
529,466 270,651 0 7,387 807,504<br />
0 14,609 6,819 96,566 117,894<br />
220,553 32,327 45,338 57,488 355,706<br />
0 25,528 32,000 225,145 282,673<br />
0 11,278 2,127 148,759 162,164<br />
388,992 63,259 53,831 45,901 551,983
Table PU 10 . Initial year of operation for steam electric plants serving<br />
northwestern and southwestern Florida in 1978 (U .S Department of Energy,<br />
Energy Information Administration 1980) .<br />
Company Plant Initial year of plant operation<br />
Florida Power and<br />
Light Co .<br />
Florida Power<br />
Corp .<br />
Gulf Power Co .<br />
Tampa Electric<br />
Co .<br />
Cape Kennedy 1965<br />
Fort Meyers 1958<br />
Lauderdale 1926<br />
Manatee 1976<br />
Port Everglades 1960<br />
Putnam Combination Cycle 1977<br />
Riviera 1946<br />
St . Lucie (nuclear) 1976<br />
Sanford 1926<br />
Turkey Point 1967<br />
Turkey Point (nuclear) 1972<br />
Anclote 1974<br />
Avon Park 1928<br />
P .L . Bartow 1958<br />
Crystal River 1969<br />
Crystal River (nuclear) 1977<br />
Higgins 1952<br />
Suwanee 1953<br />
G .E . Turner 1926<br />
Pensacola (Crist) 1945<br />
River Junction (Scholz) 1953<br />
Lansing Smith 1965<br />
Big Bend 1976<br />
F .J . Gannon 1957<br />
Hookers Point 1965<br />
29
Table PU 11 . Initial year of operation for gas turbine electric plants serving<br />
the region in 1977 (U .S Department of Energy, Energy Information<br />
Administration 1980) .<br />
Company Plant Initial year of plant operation<br />
Florida Power and<br />
Light Co .<br />
Florida Power<br />
Corp .<br />
Gu 1 f Power Co .<br />
Tampa Electric Co .<br />
Fort Myers 1974<br />
Lauderdale 1970<br />
Port Everglades 1971<br />
Avon Park 1968<br />
P .L . Bartow 1972<br />
Bayboro 1973<br />
DeBarry 1975<br />
Higgins 1969<br />
Intercession City 1974<br />
Port St . Joe 1970<br />
Rio Pinar 1970<br />
G .E . Turner 1970<br />
Smith-Turbine A 1971<br />
Big Bend 1969<br />
F .J . Gannon 1969<br />
30
Table PU 12 . MajoCa interconnections for bulk power transactions for the<br />
Florida subregion (U .S . Federal Energy Regulatory Commission 1980) .<br />
Generatin investor-owned s stems<br />
ystem Interconnections<br />
Florida Power Corp . Georgia Power Co .<br />
Tampa Electric Co .<br />
Florida Power and Light Co .<br />
Gulf Power Co .<br />
Southeast Power Administration<br />
Orlando Utility Commission<br />
Tallahassee Electric Department<br />
Gainesville, Alachua County Regional<br />
Utilities Board<br />
City of Kissimmee<br />
Lakeland Department of Electric and<br />
Water Utilities<br />
Sebring Utilities Commission<br />
Florida Power and<br />
Light Co . Florida Power Corp .<br />
Jacksonville Electric Authority<br />
Tampa Electric Co .<br />
Orlando Utility Commission<br />
Vero Beach Municipal Utilities<br />
New Smyrna Beach Utility Commission<br />
Fort Pierce Utility Authority<br />
Lake Worth Utility Authority<br />
Homestead Municipal Electric Department<br />
Tampa Electric Co . Florida Power Corp .<br />
Florida Power and Light Co .<br />
Lakeland Department of Electric and<br />
Water Utilities<br />
Continued<br />
31
Table PU 12 . Continued .<br />
Generating munici le s stems<br />
ystem n erconnections<br />
Key West Utility Board U .S . Naval Air Station<br />
Generatin rural electrical coo eratives<br />
ys em n erconnections<br />
Florida Keys Electric<br />
Cooperative Association Inc . Seminole Electric Cooperative<br />
Southeast Power Administration<br />
Florida Power Corp .<br />
Non eneratin rural electric coo eratives<br />
System Power supp ier<br />
Central Florida Electrical<br />
Cooperative, Inc .<br />
Lee County Electrical<br />
Cooperative, Inc .<br />
Peace River Electrical<br />
Cooperative, Inc .<br />
Sumter Valley Electrical<br />
Cooperative, Inc .<br />
Continued<br />
Seminole Electric Cooperative<br />
Southeast Power Administration<br />
Florida Power Corp .<br />
Seminole Electric Cooperative<br />
Florida Power Corp .<br />
Florida Power and Light Co .<br />
Florida Power Corp .<br />
Florida Power and Light Co .<br />
Tampa Electric Co .<br />
Seminole Electric Cooperative<br />
Florida Power Corp .<br />
32
Table PU 12 . Concluded .<br />
Non eneratin rural electric coo eratives<br />
System Power supp ier<br />
Talquin Electrical<br />
Cooperative, Inc .<br />
Withlacoochee River<br />
Electrical Cooperative, Inc .<br />
Southeast Power Administration<br />
Seminole Electric Cooperative<br />
Florida Power Corporation<br />
Florida Power Corporation<br />
Seminole Electric Cooperative<br />
Other eneratin s stems<br />
ys em Interconnections<br />
Southeast Power Administration Florida Power Corp .<br />
a The Florida subregion consists of all Florida counties except Escambia,<br />
Santa Rosa, Okaloosa, Holmes, Washington, Jackson, Bay, Calhoun and Gulf .<br />
33
Table PU 13 . Majorainterconnections for bulk power transactions for the<br />
southern subregion (U .S . Federal Energy Regulatory Commission 1980) .<br />
Generatin investor-owned s stems<br />
ys em n erconnec ions<br />
Gu l f Power Co . Al abama Power Co .<br />
Florida Power Corp .<br />
Georgia Power Co .<br />
Generatin rural electrical coo eratives<br />
ys em n erconnec ions<br />
Alabama Electric<br />
Cooperative, Inc . Al abama Power Co .<br />
Southeast Power Administration<br />
Non eneratin rural electrical coo eratives<br />
ys em Power supp ier<br />
Choctawatchee Electrical<br />
Cooperative, Inc .<br />
Escambia River Electrical<br />
Cooperative, Inc .<br />
Gulf Coast Electrical<br />
Cooperative, Inc .<br />
West Florida Electrical<br />
Cooperative, Association<br />
Alabama Electric Cooperative, Inc .<br />
Gu l f Power Co .<br />
Southeast Power Administration<br />
Alabama Electric Cooperative, Inc .<br />
Gu 1 f Power Co .<br />
Southeast Power Administration<br />
a The Southern Subregion consists of Georgia, Alabama, part of Mississippi and<br />
Escambia, Santa Rosa, Okaloosa, Holmes, Washington, Jackson, Bay, Calhoun and<br />
Gulf Counties in Florida .<br />
34
TRANSPORTATION (TRANS)<br />
35
Florida West<br />
Freeport<br />
Pensacola<br />
Panama City<br />
St . Joe<br />
0 MaJor ports<br />
0 Medium ports<br />
O<br />
Small ports<br />
- Intracoastal Waterway<br />
Blountstown<br />
.. St . Marks<br />
OF Carrabelle<br />
Apalachicola<br />
. . . . . . . . . Cross Florida Barge Canal<br />
Citrus Co .<br />
Tarpon Springs<br />
St . Petersburg<br />
St . Johns<br />
River ,<br />
. . . Barge . . . . .. Port<br />
Tampa<br />
Fernandina Beach<br />
Jacksonville<br />
o St . Augustine<br />
\ Ponce de Leon<br />
\` New Smyrna<br />
0<br />
Sanford<br />
49<br />
Manatee Integrated Water System<br />
G 4 (/)<br />
Boca Grande<br />
/pu e<br />
Kesy West<br />
Figure 4 . Ports and waterways in Florida (Florida Department of<br />
Transportation 1978b) .<br />
36<br />
Canaveral<br />
Fort Pierce<br />
Palm<br />
~ Beach<br />
• Everglades<br />
0 Miami<br />
. A
Table TRANS 1 . Identification and classification of ports, including<br />
beginning dates of operation under jurisdiction of local port authorities<br />
(Florida Department of Transportation 1978b) .<br />
Port and classification<br />
Date<br />
Size operatiogs<br />
(acres) 'began<br />
Major ports<br />
Port of Panama City 48 1967<br />
Port of Pensacola 82 1943<br />
Medium ports<br />
Port of St. Joe N .D. N .D .<br />
Small ports<br />
Port of Apalachicola N .D. N .D .<br />
a Under the port authority .<br />
37
w 00<br />
Table TRANS 2 . Port tonnagea (short tonsb) for 1960, 1965, 1970, 1975, 1978 (U .S . Army Corps of Engineers<br />
1962, 1967, 1972, 1977, 1980) .<br />
Year<br />
Port 1960 1965 1970 1975 1978<br />
Panama City 1,067,804 1,441,812 1,570,326 1,615,000 1,581,783<br />
Pensacola 791,801 634,445 986,169 2,260,000 3,064,044<br />
Port St . Joe 1,620,083 254,805 931,762 463,000 657,295<br />
Port of Apalachicola N .D . N .D . N .D . N .D . 7,030<br />
b Figures do not reflect local (within the port) movement .<br />
Short ton equals 2,000 lb .<br />
Table TRANS 3 . Florida port accessibility by mode of transportation in 1978 (Florida Department of<br />
Transportation 1978b) .<br />
Port Highway Rail Air Waterway Pipeline<br />
Port of Panama City X X X X<br />
Port of Pensacola X X X X<br />
Port of St . Joe X X X<br />
Port of Apalachicola X X
w<br />
to<br />
Table TRANS 4 . Sources of funding for major ports as of 1978 (Florida Department of Transportation 1978b) .<br />
Under Under Under<br />
city county independent Tariff<br />
Port control control charter fees Leases Bonds Grants<br />
Port of PanamaCity X X X X X<br />
Port of Pensacola X X X X<br />
Port of Panama City X<br />
Port of Pensacola X<br />
Annual city Race track<br />
appropriation Taxing pledge
Table TRANS 5 . Port of Panama City freight traffic (short tons) in 1960 (U .S . Army Corps of Engineers 1962) .<br />
Foreign Domestic<br />
Coastwise Internal<br />
Commodity classification Total Imports Exports eceip s ipmen s eceip s ipmen s Local<br />
Total 1,069,200 36,273 141,081 271,757 3,765 605,701 9,227 1,396<br />
040 Fish and products,<br />
fresh 1,229 0 0 0 0 0 0 1,229<br />
049 Shellfish and products 167 0 0 0 0 0 0 167<br />
060 Hides and skins, raw 15 0 15 0 0 0 0 0<br />
094 Shells, unmanufactured 15,632 0 0 0 0 15,632 0 0<br />
110 Animal feeds, nec 1,646 0 1,646 0 0 0 0 0<br />
125 Vegetables and prepared<br />
„ including canned, nec 1,021 1,021 0 0 0 0 0 0<br />
° 185 Molasses, sugar products,<br />
edible 8 0 8 0 0 0 0 0<br />
190 Liquors and wines 32 32 0 0 0 0 0 0<br />
210 Naval stores, gums,<br />
and resins 32,350 0 17,989 0 0 14,361 0 0<br />
240 Oils, fats, waxes,<br />
vegetable, crude 2,657 0 2,657 0 0 0 0 0<br />
280 Tobacco, unmanufactured 5 0 5 0 0 0 0 0<br />
413 Lumber and shingles 456 411 44 0 0 0 0 0<br />
416 Plywood, veneers,<br />
construction materials 126 0 126 0 0 0 0 0<br />
421 Wood manufactures, nec 160 0 160 0 0 0 0 0<br />
457 Paper and manufactures,<br />
nec 103,138 0 99,414 0 3,724 0 0 0<br />
r<br />
Continued
~<br />
Table TRANS 5 . Continued .<br />
Commodity classification Total<br />
Foreign<br />
Imports Exports<br />
Coastwise<br />
eceip s Shipments<br />
Domestic<br />
Internal<br />
eceip s ipments Local<br />
507 Gasoline 552,483 0 0 117,605 0 432,352 2,526 0<br />
510 Gas oil, distillate<br />
fuel oil 74,959 0 0 22,732 0 52,227 0 0<br />
512 Jet fuel, all types 2,608 0 0 0 0 2,608 0 0<br />
513 Kerosene 35,093 0 0 8,286 0 26,807 0 0<br />
514 Residual fuel oil 94,679 0 0 92,679 0 0 0 0<br />
516 Petroleum asphalt 29,095 0 0 21,725 0 4,644 2,726 0<br />
518 Aliphatic naphtha 18 0 18 0 0 0 0 0<br />
519 Lubricating oil<br />
and greases 42,827 0 0 0 0 42,818 0 0<br />
520 Petroleum products, nec 9,053 0 0 4,554 0 4,499 0 0<br />
523 Building cement 2,080 0 0 0 0 2,080 0 0<br />
526 Stone and manufactures, nec 2,000 0 0 0 0 2,000 0 0<br />
602 Iron and steel scrap 18,769 0 0 18,769 0 0 0 0<br />
609 Rolled, finished<br />
steel mill products 92 92 0 0 0 0 0 0<br />
611 Metal manufacture g , parts<br />
nec, except SCi 4 0 4 0 0 0 0 0<br />
632 Copper alloy forms<br />
and scrap 113 0 113 0 0 0 0 0<br />
783 Watercraft and parts 1 0 0 0 1 0 0 0<br />
801 Crude and refined<br />
coal tar 2,582 0 0 0 0 0 2,582 0<br />
Continued
Table TRANS 5 . Concluded .<br />
Foreign Domestic<br />
Coastwise Internal<br />
Commodity classification Total Imports Exports Receipts Shipments Receipts Sh ipments Local<br />
805 Other coal tar products 1,393 0 0 0 0 0 1,393 0<br />
829 Industrial chemicals, nec 29,323 21,474 0 -2,176 0 1,673 0 0<br />
846 Chemical specialties, nec 18 0 18 0 0 0 0 0<br />
851 Other nitrogenous<br />
fertilizers, nec 13,243 13,243 0 0 0 0 0 0<br />
900 Commodities, nec 40 0 0 0 40 0 0 0<br />
980 Low valued shipments 85 0 85 0 0 0 0 0<br />
4:b<br />
^' b Not elsewhere classified .<br />
Special category items .
Table TRANS 6 . Port of Panama City freight traffic (short tons) in 1965 (U .S . Army Corps of Engineers 1967) .<br />
Foreign Domestic<br />
Coastwise Internal<br />
Commodity classification Total Imports Exports eceip s Shipments Receipts Sh ipments Local<br />
Total 1,443,218 57,380 327,800 288,318 416 746,275 21,623 1,406<br />
0131 Fresh fruits and<br />
tree nuts 33 0 33 0 0 0 0 0<br />
0911 Fresh fish, except<br />
shellfish 1,281 0 0 0 0 0 0 1,281<br />
0912 Shellfish 125 0 0 0 0 0 0 125<br />
0931 Marine shells,<br />
unmanufactured 4,449 0 0 0 0 4,449 0 0<br />
4~. 1121 Bituminous coal<br />
" and lignite 61,128 0 0 0 0 61,128 0 0<br />
1311 Crude petroleum 13,423 0 0 0 0 3,111 10,312 0<br />
2011 Meat, fresh, chilled,<br />
frozen 6 0 6 0 0 0 0 0<br />
2034 Vegetjbles and prepared<br />
nec 340 340 0 0 0 0 0 0<br />
2081 Alcoholic beverages 18 12 6 0 0 0 0 0<br />
2091 Vegetable oil,<br />
margarine, shortening 1,860 0 1,860 0 0 0 0 0<br />
2099 Miscellaneous food<br />
products 97 5 92 0 0 0 0 0<br />
2211 Basic textile<br />
products 25 0 25 0 0 0 0 0<br />
Continued
4h,<br />
Table TRANS 6 . Continued .<br />
Foreign Domestic<br />
Coastw ise Internal<br />
Commo dity classification Total Imports Exports Receipts Shipments Receipts Sh ipments Local<br />
2311 Apparel 112 0 112 0 0 0 0 0<br />
2511 Furniture and fixtures 4 4 0 0 0 0 0 0<br />
2611 Pulp 122,028 0 122,028 0 0 0 0 0<br />
2631 Paper and paperboard 154,803 0 154,387 0 416 0 0 0<br />
2812 Dyes, pigment, tanning<br />
materials 3,748 0 0 0 0 0 3,748 0<br />
2819 Basic chemicals and<br />
products, nec 31,173 31,167 6 0 0 0 0 0<br />
2821 Plastic materials 9 0 9 0 0 0 0 0<br />
2861 Gum and wood<br />
chemicals 16,951 0 16,951 0 0 0 0 0<br />
2871 Nitrogenous fertilizer,<br />
manufactured 9,411 9,411 0 0 0 0 0 0<br />
2911 Gasoline 517,502 0 0 54,977 0 455,377 7,148 0<br />
2912 Jet fuel 7,744 0 0 0 0 7,744 0 0<br />
2913 Kerosene 8,771 0 0 1,888 0 6,883 0 0<br />
2914 Distillate fuel oil 48,852 0 0 12,188 0 36,664 0 0<br />
2915 Residual fuel oil 248,485 16,321 0 217,636 0 14,528 0 0<br />
2916 Lubricating oils and<br />
greases 148,494 0 0 0 0 148,4944 0 0<br />
2921 Liquefied gases 6 .985 0 0 0 0 6,985 0 0<br />
Continued
4~b<br />
Ln<br />
Table TRANS 6 . Continued .<br />
Commodity classification Total<br />
Foreign<br />
Imports Exports<br />
Coastwise<br />
Receipts Shipments<br />
Domestic<br />
Internal<br />
Receipts Sh ipments Local<br />
3011 Rubber and miscellaneous<br />
plastics products 8 0 8 0 0 0 0 0<br />
3251 Structural clay<br />
products 1,600 0 0 1,600 0 0 0 0<br />
3291 Miscellaneous nonmetallic<br />
mineral products 437 0 26 0 0 411 0 0<br />
3315 Iron, steel shapes,<br />
except sheet 400 0 0 0 0 0 400 0<br />
3316 Iron and steel<br />
plates, sheets 105 0 105 0 0 0 0 0<br />
3317 Iron and steel<br />
pipe and tube 120 120 0 0 0 0 0 0<br />
3319 Iron and steel<br />
products, nec 78 0 0 0 0 78 0 0<br />
3321 Nonferrous metals, nec 8 0 8 0 0 0 0 0<br />
3491 Miscellaneous fabricated<br />
metal products 8 0 8 0 0 0 0 0<br />
3511 Machinery, except<br />
electrical 207 0 7 0 0 200 0 0<br />
3611 Electrical machinery<br />
and equipment 21 0 21 0 0 0 0 0<br />
3711 Motor vehicles,<br />
parts, equipment 5 0 5 0 0 0 0 0<br />
Continued
~<br />
rn<br />
Table TRANS 6 . Concluded .<br />
Foreign Domestic<br />
Coastwise Internal<br />
Commo dity classification Total Imports Exports eceip s ipmen s eceip s Sh ipments Local<br />
3731 Ships and boats 237 0 0 29 0 208 0 0<br />
3911 Miscellaneous manufactured<br />
products 31 0 1 0 0 15 15 0<br />
4011 Iron and steel scrap 31,924 0 31,924 0 0 0 0 0<br />
4012 Nonferrous metal scrap 172 0 172 0 0 0 0 0<br />
a Not elsewhere classified .
Table TRANS 7 . Port of Panama City freight traffic (short tons) in 1970 (U .S . Army Corps of Engineers 1972) .<br />
Foreign Domestic<br />
Coastwise Internal<br />
Commodity classification Total Imports Exports Receipts ipments Receipts ipments<br />
Total 1,634,958 275,226 502,248 21,737 5,459 765,656 64,632<br />
0119 Oilseeds, neca 2,578 0 2,578 0 0 0 0<br />
0161 Animals and products,<br />
nec 214 0 214 0 0 0 0<br />
0911 Fresh fish, except<br />
shellfish 593 0 0 0 0 593 0<br />
0912 Shellfish, except<br />
prepared 101 0 0 0 0 101 0<br />
v 0931 Marine shells,<br />
unmanufactured 19,129 0 0 0 0 19,129 0<br />
1311 Crude petroleum 84,320 79,658 0 0 0 4,662 0<br />
1451 Clay 8,355 0 8,355 0 0 0 0<br />
1479 Natural fertilizer<br />
materials, nec 3,000 3,000 0 0 0 0 0<br />
1499 Nonmetallic minerals,<br />
nec 10,065 0 0 0 0 10,065 0<br />
2041 Wheat flour and<br />
semolina 5 0 5 0 0 0 0<br />
2091 Vegetable oils, margarine,<br />
shortening 6,662 0 6,662 0 0 0 0<br />
2099 Miscellaneous food<br />
products 575 0 161 0 0 0 414<br />
Continued
4:1.<br />
CO<br />
Table TRANS 7 . Continued .<br />
Foreign Domestic<br />
Coastwise Internal<br />
Commodity classification Total Imports Exports Receipts Shipments Receipts ipments<br />
2611 Pulp<br />
2621 Standard newsprint<br />
paper<br />
2631 Paper and<br />
paperboard<br />
2811 Crude tar, oil,<br />
gas products<br />
2813 Alcohols<br />
2817 Benzene and toluene<br />
2819 Basic chemicals and<br />
products, nec<br />
2821 Plastic materials<br />
2861 Gum and wood<br />
chemicals<br />
2911 Gasoline<br />
2912 Jet fuel<br />
2913 Kerosene<br />
2914 Distillate fuel oil<br />
2915 Residual fuel oil<br />
2916 Lubricating oils and<br />
greases<br />
149,583 0 149,583<br />
22,766 0 0<br />
244,258 0 206,258<br />
5,128 0 0<br />
757 0 0<br />
4,206 0 0<br />
36,043 25,616 237<br />
627 0 0<br />
22,751 0 20,397<br />
587,225 0 0<br />
2,056 0 0<br />
8,505 0 0<br />
27,951 0 0<br />
189,854 166,952 0<br />
52,929 0 0<br />
Continued<br />
0 0 0 0<br />
0 0 0 22,766<br />
0 5,459 0 32,541<br />
0 0 5,128 0<br />
0 0 757 0<br />
0 0 2,861 1,345<br />
0 0 10,190 0<br />
0 0 0 627<br />
0 0 0 2,354<br />
0 0 583,336 1,889<br />
0 0 2,056 0<br />
0 0 8,505 0<br />
0 0 27,512 439<br />
21,737 0 0 1,165<br />
0 0 52,929 0
IN.<br />
to<br />
Table TRANS 7 . Concluded .<br />
Commodity classification<br />
2917 Naphtha, petroleum<br />
solvents<br />
2920 Coke, petroleum coke<br />
2921 Liquefied gases<br />
3316 Iron and steel plates,<br />
sheets<br />
3319 Iron and steel<br />
products, nec<br />
3411 Fabricated metal<br />
products<br />
3511 Machinery, except<br />
electrical<br />
3711 Motor vehicles,<br />
parts, equipment<br />
3911 Miscellaneous manufactured<br />
products<br />
4011 Iron and steel scrap<br />
4012 Nonferrous metal scrap<br />
4024 Paper waste and scrap<br />
4029 Waste and scrap, nec<br />
a Not elsewhere classified .<br />
Foreign Domestic<br />
Coastwise Internal<br />
Total Imports Exports Receipts Shipments Receipts Shipments<br />
6,128 0 0 0 0 6,128 0<br />
12,000 0 0 0 0 12,000 0<br />
15,106 0 0 0 0 15,106 0<br />
831 0 0 0 0 831 0<br />
2,099 0 0 0 0 1,684 415<br />
677 0 0 0 0 0 677<br />
20 0 20 0 0 0 0<br />
67 0 2 0 0 65 0<br />
2 0 2 0 0 0 0<br />
107,414 0 107,414 0 0 0 0<br />
88 0 88 0 0 0 0<br />
272 0 272 0 0 0 0<br />
18 0 0 0 0 18 0
L"<br />
0<br />
Table TRANS 8 . Port of Panama City freight traffic (short tons) in 1975 (U .S . Army Corps of Engineers 1977) .<br />
Foreign Domestic<br />
Coastwise Internal<br />
Commodity classification Total Imports Exports Shipments eceip s ipmen s Local<br />
Total 1,616,293 93,777 208,709 5,874 1,050,617 256,683 633<br />
0119 Oilseeds, neca 5,873 0 331 0 0 5,542 0<br />
0911 Fresh fish, except<br />
shellfish 424 0 0 0 424 0 0<br />
0912 Shellfish, except<br />
prepared 193 0 0 0 193 0 0<br />
0931 Marine shells,<br />
unmanuf actured 13,453 0 0 0 13,453 0 0<br />
1311 Crude petroleum 4,443 0 0 0 4,443 0 0<br />
1451 Clay 8,470 0 4,505 0 0 3,965 0<br />
2091 Vegetable oils, margari ne,<br />
shortening 2,659 0 2,659 0 0 0 0<br />
2421 Lumber 6,571 6,571 0 0 0 0 0<br />
2611 Pulp 154,313 0 45,370 0 0 108,943 0<br />
2621 Stand ard newsprint<br />
paper 210 0 210 0 0 0 0<br />
2631 Paper and paperboard 129,161 0 73,272 1,902 0 53,987 0<br />
2811 Crude tar, oil, gas<br />
products 15,171 0 0 0 6,581 8,590 0<br />
2817 Benzene and toluene 12,204 0 0 0 1,873 10,331 0<br />
2819 Basic chemicals and<br />
products, nec 6,094 6,094 0 0 0 0 0<br />
2821 Plastic materials 649 0 216 0 0 433 0<br />
2861 Gum and wood chemicals 1,206 0 1,206 0 0 0 0<br />
Continued
~<br />
I.-A<br />
Table TRANS 8 . Continued .<br />
Commodity classification Total<br />
Imports<br />
Forei gn<br />
Exports<br />
Coastwise<br />
Shipments<br />
Domestic<br />
Internal<br />
Receipts Rpments Local<br />
2873 Phosphatic chemical<br />
fertilizers 4,396 0 4,496 0 0 0 0<br />
2891 Miscellaneous chemical<br />
products 1,034 0 57 0 0 977 0<br />
2911 Gasoline 781,224 0 0 3,472 734,299 43,453 0<br />
2914 Distillate fuel oil 131,685 0 0 0 131,052 0 633<br />
2915 Residual fuel oil 163,158 81,112 0 0 82,046 0 0<br />
2916 Lubricating oils<br />
and greases 55,442 0 0 0 54,935 507 0<br />
2917 Naphtha, petroleum<br />
solvents 19,542 0 0 0 8,494 11,048 0<br />
2921 Liquefied gases 12,015 0 0 0 12,015 0 0<br />
3315 Iron, steel shapes,<br />
except sheet 348 0 0 0 0 348 0<br />
3411 Fabricated metal products 154 0 0 0 0 154 0<br />
Continued
Ln<br />
N<br />
Tab l e TRANS 8 . Conc l uded .<br />
Commodity classification Total<br />
Imports<br />
Forei gn<br />
Exports<br />
Coastwise<br />
Shipments<br />
Domestic<br />
Internal<br />
Receipts S ipments Local<br />
3511 Machinery, except<br />
electrical 1,062 0 204 500 0 358 0<br />
3711 Motor vehicles, parts,<br />
equipment 364 0 364 0 0 0 0<br />
3731 Ships and boats 390 0 0 0 390 0 0<br />
3791 Miscellaneous transportation<br />
equipment 40 0 40 0 0 0 0<br />
3911 Miscellaneous manufactured<br />
product 1,394 0 0 0 419 975 0<br />
4011 Iron and steel scrap 81,911 0 74,839 0 0 7,072 0<br />
4012 Nonferrous metal scrap 207 0 207 0 0 0 0<br />
4024 Paper waste and scrap 833 0 833 0 0 0 0<br />
a Not elsewhere classified .
cn<br />
w<br />
Table TRANS 9 . Port of Panama City freight traffic ( short tons) in 1978 ( U .S . Army Corps of Engineers 1980) .<br />
Foreign Domestic<br />
Coastwise Internal<br />
Commodity classification Total Imports Exports eceip s Shipments eceip s ipmen s Local<br />
Total 1,585,372 3,640 266,702 10,531 2,075 1,030,498 268,337 3,589<br />
0119 Oilseeds, neca 117,178 0 74,988 0 0 0 42,190 0<br />
0129 Field crops, nec 1 0 1 0 0 0 0 0<br />
0161 Animals and<br />
products, nec 4 4 0 0 0 0 0 0<br />
0841 Crude rubber and<br />
allied gums 2,858 2,858 0 0 0 0 0 0<br />
0861 Forest products, nec 57 57 0 0 0 0 0 0<br />
0911 Fresh fish, except<br />
shellfish 720 0 579 0 0 141 0 0<br />
0912 Shellfish, except<br />
prepared 109 0 0 0 0 109 0 0<br />
0931 Marine shells,<br />
unmanufactured 8,151 0 0 0 0 8 .151 0 0<br />
1311 Crude petroleum 125,618 0 0 0 0 96,788 26,536 2,294<br />
1451 Clay 41,767 0 7,565 0 0 0 34,202 0<br />
1471 Phosphate rock 1,200 0 0 1,200 0 0 0 0<br />
1499 Nonmetallic<br />
minerals, nec 7,000 0 0 0 0 7,000 0 0<br />
2022 Dried milk and<br />
cereal 459 0 459 0 0 0 0 0<br />
Continued
Table TRANS 9 . Continued .<br />
Foreign Domestic<br />
Coastwise Internal<br />
Commodity classification Total Imports Exports Receipts hipments Receipts Shipment s Local<br />
2042 Prepared animal<br />
feeds 1,720 0 1,720 0 0 0 0 0<br />
2049 Grain mill<br />
products, nec 797 0 0 0 0 0 797 0<br />
2081 Alcoholic beverages 55 48 7 0 0 0 0 0<br />
2095 Ice 480 0 0 0 0 0 480 0<br />
2099 Miscellaneous food<br />
products 10,611 0 14 0 0 0 10,597 0<br />
2211 Basic textile<br />
~ products 57 9 48 0 0 0 0 0<br />
2311 Apparel 5 5 0 0 0 0 0 0<br />
2415 Pulpwood, log 60,209 0 0 0 0 52,482 7,727 0<br />
2416 Wood chips, staves,<br />
moldings 137,425 0 0 0 0 137,425 0 0<br />
2421 Lumber 558 382 0 0 0 0 176 0<br />
2491 Wood manufactures,<br />
nec 181 181 0 0 0 0 0 0<br />
2611 Pulp 98,204 0 58,059 0 0 0 40,145 0<br />
2631 Paper and<br />
paperboard 133,977 0 83,901 0 0 0 50,076 0<br />
2691 Pulp and paper<br />
products, nec 582 0 0 0 0 0 582 0<br />
Continued
Ln<br />
Ln<br />
Table TRANS 9 . Continued .<br />
Commodity classification<br />
2811 Crude tar, oil,<br />
gas products<br />
2817 Benzene and<br />
toluene<br />
2819 Basic chemicals and<br />
products, nec<br />
2821 Plastic materials<br />
2822 Synthetic rubber<br />
2861 Gum and wood<br />
chemicals<br />
2871 Nitrogenous chemical<br />
fertilizers<br />
2879 Fertilizer and<br />
materials, nec<br />
2891 Miscellaneous<br />
chemical products<br />
2911 Gasoline<br />
2914 Distillate fuel oil<br />
2915 Residual fuel oil<br />
2916 Lubricating oils<br />
and greases<br />
Foreign Domestic<br />
Coastwise Internal<br />
Total Imports Exports Receipts Shipments Receipts Shipments Local<br />
13,665<br />
12,888<br />
12,219<br />
4,469<br />
274<br />
2,803<br />
2,000<br />
8,053<br />
792<br />
435,505<br />
98,501<br />
143,183<br />
54,282<br />
0 0<br />
0 0<br />
0 4,098<br />
0 374<br />
0 18<br />
0 2,651<br />
0 0<br />
0 8,053<br />
0 792<br />
0 39<br />
0 0<br />
0 0<br />
0 0<br />
Continued<br />
0 0 8,188 5,477 0<br />
0 0 6,155 6,773 0<br />
0 0 8,121 0 0<br />
0 0 0 4,095 0<br />
0 0 0 256 0<br />
0 0 0 152 0<br />
0 0 2,000 0 0<br />
0 0 0 0 0<br />
0 0 0 0 0<br />
0 0 400,577 33,594 1,295<br />
0 0 94,501 4,000 0<br />
4,872 0 138,311 0 0<br />
4,459 0 49,823 0 0
c.n<br />
o,<br />
Table TRANS 9 . Concluded .<br />
Commodity classification<br />
2917 Naphtha, petroleum<br />
solvents 5,549<br />
2921 Liquefied gases 14,081<br />
3011 Rubber and miscellaneous<br />
plastic products 10<br />
3251 Structural clay<br />
products 40<br />
3315 Iron, steel shapes,<br />
except sheet 100<br />
3316 Iron and steel<br />
plates, sheets 1<br />
3317 Iron and steel pipe<br />
and tube 64<br />
3411 Fabricated metal<br />
products 1,986<br />
3511 Machinery, except<br />
electrical 1,402<br />
3611 Electrical machinery<br />
and equipment 625<br />
3711 Motor vehicles,<br />
parts, equipment 47<br />
4011 Iron and steel scrap 22,846<br />
a Not elsewhere classified .<br />
Foreign Domestic<br />
Coastwise Internal<br />
Total Imports Exports Receipts Shipments Receipts ipments Local<br />
0 0 0 0 5,549 0 0<br />
0 6 0 0 14,075 0 0<br />
0 10 0 0 0 0 0<br />
40 0 0 0 0 0 0<br />
0 0 0 100 0 0 0<br />
0 1 0 0 0 0 0<br />
0 65 0 0 0 0 0<br />
0 11 0 1,975 0 0 0<br />
56 346 0 0 1,000 0 0<br />
0 4 0 0 142 482 0<br />
0 47 0 0 0 0 0<br />
0 22,846 0 0 0 0 0
Ln<br />
1~j<br />
Table TRANS 10 . Port of St . Joe freight traffic (short tons) in 1960 (U .S . Army Corps of Engineers 1962) .<br />
Commodity classification<br />
Domestic<br />
Foreign oastwise nterna<br />
Total exports receipts receipts<br />
Total 1,620,083 15,518 1,594,940 9,625<br />
210 Naval stores, gums and resins 4,143 4,143 0 0<br />
413 Lumber and shingles 2,044 2,044 0 0<br />
416 Plywood, veneers 22 22 0 0<br />
445 Paper base stocks, neca 3,617 3,617 0 0<br />
457 Paper and manuf actures, nec 1,912 1,912 0 0<br />
507 Gasoline 1,142,022 0 1,142,022 0<br />
510 Gas oil distillate fuel oil 226,249 0 224,699 1,550<br />
513 Kerosene 95,051 0 95,051 0<br />
514 Residual fuel oil 136,503 0 133,168 3,335<br />
554 Sand, gravel, crushed rock 4,740 0 0 4,740<br />
710 Engines, turbines, parts, nec 1 1 0 0<br />
742 Industrial machinery, parts, nec 58 58 0 0<br />
862 Dynamite b 1,167 1,167 0 0<br />
901 Commodities, nec, except Sci 1 1 0 0<br />
980 Low-valued shipments 25 25 0 0<br />
999 Department of Defense and Sci 2,528 2,528 0 0<br />
b Not elsewhere classified .<br />
Special category items .
Ln<br />
00<br />
Table TRANS 11 . Port of St . Joe freight traffic (short tons) in 1965 (U .S . Army Corps of Engineers 1967) .<br />
Foreign<br />
Commodity classification Total Imports Exports<br />
Total<br />
0133 Coffee, green<br />
0931 Marine shells,<br />
unmanufactured<br />
1499 Nonmetallic minerals,<br />
nec<br />
1911 Ordnance and<br />
accessories<br />
2022 Dried milk and cream<br />
2031 Fish and products, nec<br />
2081 Alcoholic beverages<br />
2091 Vegetable oils, margarine,<br />
shortening<br />
2099 Miscellaneous food<br />
products<br />
2211 Basic textile<br />
products<br />
2491 Wood manuf actures, nec<br />
2511 Furniture and<br />
fixtures<br />
2611 Pulp<br />
2631 Paper and paperboard<br />
254,805 57,671 65,241<br />
110 110 0<br />
2,250 0 0<br />
22 0 22<br />
7 7 0<br />
30 30 0<br />
1 1 0<br />
70 70 0<br />
1,207 0 1,207<br />
42 42 0<br />
1 1 0<br />
129 0 129<br />
21 21 0<br />
276 0 476<br />
55,306 0 54,459<br />
Continued<br />
Domestic<br />
Coastwise Internal<br />
shipments Receipts Rpments<br />
113,859 17,187 847<br />
0 0 0<br />
0 2,250 0<br />
0 0 0<br />
0 0 0<br />
0 0 0<br />
0 0 0<br />
0 0 0<br />
0 0 0<br />
0 0 0<br />
0 0 0<br />
0 0 0<br />
0 0 0<br />
0 0 0<br />
0 0 847
Ln<br />
ko<br />
Table TRANS 11 . Concluded .<br />
Foreign Domestic<br />
Coastwise Internal<br />
Commodity classification Total Imports Exports shipments Receipts Shipments<br />
2819 Basic chemicals and product, nec<br />
2861 Gum and wood chemical s<br />
2891 Miscellaneous chemical products<br />
2914 Distillate fuel oil<br />
2915 Residual fuel oil<br />
3211 Glass and glass products<br />
3291 Miscellaneous nonmetallic<br />
mineral products<br />
3315 Iron, steel shapes, except sheet<br />
3317 Iron and steel pipe and tube<br />
3319 Iron and steel products, nec<br />
3324 Aluminum and alloys, unworked<br />
3421 Cutlery, tools and hardware<br />
3491 Miscellaneous fabricated<br />
metal products<br />
3611 Electrical machinery and equipment<br />
3711 Motor vehicles, parts, equipment<br />
3911 Miscellaneous manuf actured<br />
products<br />
4024 Paper waste and scrap<br />
a Not elsewhere classified .<br />
14,937 0 0 0 14,937 0<br />
8,400 0 8,400 0 0 0<br />
1 1 0 0 0 0<br />
41,758 0 0 41,758 0 0<br />
129,203 57,102 0 72,101 0 0<br />
56 56 0 0 0 0<br />
3 3 0 0 0 0<br />
52 52 0 0 0 0<br />
11 11 0 0 0 0<br />
121 121 0 0 0 0<br />
1 1 0 0 0 0<br />
3 3 0 0 0 0<br />
20 20 0 0 0 0<br />
15 15 0 0 0 0<br />
1 1 0 0 0 0<br />
3 3 0 0 0 0<br />
548 0 548 0 0 0
n<br />
0<br />
Table TRANS 12 . Port of St . Joe freight traffic (short tons) in 1970 (U .S . Army Corps of Engineers 1972) .<br />
Foreign<br />
Commodity classification Total Imports Exports<br />
Total<br />
0141 Fresh and frozen<br />
vegetables<br />
0861 Forest products, neca<br />
1311 Crude petroleum<br />
1451 Clay<br />
1479 Natural fertilizer<br />
mats, nec<br />
1499 Nonmetallic,minerals,<br />
nec<br />
2011 Meat, fresh, chilled,<br />
frozen<br />
2022 Dried milk and cream<br />
2042 Prepared animal feeds<br />
2091 Vegetable oils, margarine,<br />
shortening<br />
2099 Miscellaneous food<br />
products<br />
2414 Timber, posts, poles,<br />
piling<br />
2416 Wood chips, staves,<br />
moldings<br />
931,762 218,284 122,658<br />
25 25 0<br />
2,653 5 0<br />
34,225 21,725 0<br />
4,096 0 4,096<br />
22 22 0<br />
40 40 0<br />
16 16 0<br />
3 3 0<br />
634 0 634<br />
883 0 883<br />
87 2 85<br />
1,453 0 0<br />
819 0 0<br />
Continued<br />
Domestic<br />
Coastwise Internal<br />
receipts Receipts Shipments<br />
233,570 80,941 276,309<br />
0 0 0<br />
0 0 2,648<br />
0 12,500 0<br />
0 0 0<br />
0 0 0<br />
0 0 0<br />
0 0 0<br />
0 0 0<br />
0 0 0<br />
0 0 0<br />
0 0 0<br />
0 0 1,453<br />
0 0 819
Table TRANS 12 . Concluded .<br />
Commodity classification<br />
2611 Pulp<br />
2631 Paper and<br />
paperboard<br />
2691 Pulp and paper<br />
products, nec<br />
2810 Sodium hydroxide<br />
2819 Basic chemicals and<br />
products, nec<br />
°; 2861 Gum and wood chemicals<br />
2914 Distillate fuel oil<br />
2915 Residual fuel oil<br />
2991 Petroleum and coal<br />
products, nec<br />
3111 Leather and leather<br />
products<br />
3281 Cut stone and stone<br />
products<br />
3411 Fabricated metal<br />
products<br />
4024 Paper waste and scrap<br />
Foreign<br />
Total Imports Exports<br />
73,868 0 73,868<br />
35,459 7 35,452<br />
3 3 0<br />
23,272 0 0<br />
16,479 0 112<br />
7,461 0 7,461<br />
20,747 0 0<br />
705,132 196,422 0<br />
4,304 0 0<br />
2 2 0<br />
10 10 0<br />
2 2 0<br />
67 0 67<br />
Coastwise<br />
receipts<br />
0<br />
0<br />
0<br />
1,207<br />
0<br />
0<br />
20,747<br />
211,616<br />
a Not elsewhere classified. •<br />
0<br />
0<br />
0<br />
0<br />
0<br />
Domestic<br />
Internal<br />
Receipts hipments<br />
0 0<br />
0 0<br />
0 0<br />
22,065 0<br />
16,367 0<br />
0 0<br />
0 0<br />
25,705 271,389<br />
4,304 0<br />
0 0<br />
0 0<br />
0 0<br />
0 0
n<br />
N<br />
Table TRANS 13 . Port of St . Joe freight traffic (short tons) in 1975 (U .S . Army Corps of Engineers 1977) .<br />
Foreign Domestic<br />
Coastwise Inte rnal<br />
Comnlodity classification Total Imports Exports receipts Receipts Shipments<br />
Total 463,062 36 19,566 278,229 22,160 143,071<br />
0133 Coffee 1 0 1 0 0 0<br />
0931 Marine shells, unmanuf<br />
actured 1,276 0 0 0 1,276 0<br />
1451 Clay 394 0 394 0 0 0<br />
1499 Nonmetallic minerals, nec a 1,500 0 0 0 1,500 0<br />
2011 Meat, fresh, chilled, fro zen 18 18 0 0 0 0<br />
2034 Vegetables and prepared, nec 13 0 13 0 0 0<br />
2042 Prepared animal feeds 1 0 1 0 0 0<br />
2081 Alcoholic beverages 3 3 0 0 0 0<br />
2491 Wood manufactures, nec 2 2 0 0 0 0<br />
2611 Pulp 1,166 0 1,166 0 0 0<br />
2631 Paper and paperboard 15,249 0 15,249 0 0 0<br />
2810 Sodium hydroxide 3,335 0 0 0 3,335 0<br />
2819 Basic chemicals and<br />
products, nec 6 0 6 0 0 0<br />
2821 Plastic materials 6 0 6 0 0 0<br />
2861 Gum and wood chemicals 2,661 0 2,661 0 0 0<br />
2911 Gasoline 5,830 0 0 5,830 0 0<br />
2915 Residual fuel oil 431,519 0 0 272,399 16,049 143,071<br />
3321 Nonferrous metals, nec 5 0 5 0 0 0<br />
3411 Fabricated metal products 18 0 18 0 0 0<br />
3511 Machinery, except electri cal 25 8 17 0 0 0<br />
3611 Electrical machinery and<br />
equipment 1 0 1 0 0 0<br />
4012 Nonferrous metal scrap 28 0 28 0 0 0<br />
4112 Commodities, nec 5 0 0 0 0 0<br />
a Not elsewhere classified .
Table TRANS 14 . Port of St . Joe freight traffic (short tons) in 1978 (U .S . Army Corps of Engineers 1980) .<br />
Commodity classification<br />
Total<br />
0119 Oiiseeds, neca<br />
0131 Fresh fruits and<br />
tree nuts<br />
0141 Fresh and frozen<br />
vegetables<br />
1311 Crude petroleum<br />
1451 Clay<br />
W 2011 Meat, fresh,<br />
chilled, frozen<br />
2012 Meat and products,<br />
nec<br />
2034 Vegetables and<br />
prepared, nec<br />
- 2039 Prepared fruit and<br />
vegetable juice, nec<br />
2049 Grain mill products,<br />
nec<br />
2099 Miscellaneous food<br />
products<br />
2211 Basic textile<br />
products<br />
Foreign<br />
Total Imports Exports<br />
657,295 250,278 18,304<br />
66 0 66<br />
55 0 55<br />
10 10 0<br />
471,633 235,081 0<br />
51 0 51<br />
42 0 42<br />
20 0 20<br />
33 10 23<br />
78 0 78<br />
615 0 615<br />
6 0 6<br />
23 0 23<br />
Continued<br />
Domestic<br />
Coastwise Internal<br />
shipments Receipts Shipments<br />
57,616 101,266 229,831<br />
0 0 0<br />
0 0 0<br />
0 0 0<br />
54,670 0 181,882<br />
0 0 0<br />
0 0 0<br />
0 0 0<br />
0 0 0<br />
0 0 0<br />
0 0 0<br />
0 0 0<br />
0 0 0
n<br />
~<br />
Table TRANS 14 . Continued .<br />
Commodity classification<br />
2611 Pulp<br />
2631 Paper and<br />
paperboard<br />
~ 2810 Sodium hydroxide<br />
2819 Basic chemicals<br />
and products, nec<br />
2821 Plastic materials<br />
2831 Drugs<br />
2841 Soap<br />
2861 Gum and wood<br />
chemicals<br />
2871 Nitrogenous chemical<br />
fertilizers<br />
2876 Insecticides,<br />
disinfectants<br />
2891 Miscellaneous<br />
chemical products<br />
2911 Gasoline<br />
2914 Distillate fuel oil<br />
2915 Residual fuel oil<br />
2918 Asphalt, tar, and<br />
pitches<br />
Foreign Domestic<br />
Coastwise Internal<br />
Total Imports Exports shipments Receipts Shipments<br />
3,123 0 738 0 0 2,385<br />
3,653 0 2,639 0 0 1,014<br />
14,612 0 0 0 11,577 3,035<br />
14,827 0 9,288 0 5,539 0<br />
68 0 68 0 0 0<br />
3 0 3 0 0 0<br />
1 0 1 0 0 0<br />
7,455 0 4,452 0 0 3,003<br />
6,613 0 0 0 6,613 0<br />
67 0 67 0 0 0<br />
4 0 4 0 0 0<br />
10,103 0 0 0 5,188 4,915<br />
35,447 0 0 0 14,502 20,945<br />
79,573 15,177 0 2,946 48,798 12,652<br />
9,049 0 0 0 9,049 0<br />
Continued
Table TRANS 14 . Concluded .<br />
Foreign Domestic<br />
Coastwise Internal<br />
Commodity classification Total Imports Exports shipments Receipts Shipments<br />
3317 Iron and steel pipe<br />
and tube 1 0 1 0 0 0<br />
3411 Fabricated metal<br />
products 40 0 40 0 0 0<br />
3511 Machinery, except<br />
electrical 11 0 11 0 0 0<br />
3611 Electrical machinery<br />
and equipment 7 0 7 0 0 0<br />
3711 Motor vehicles,<br />
~+ parts, equipment 4 0 4 0 0 0<br />
3811 Instrument, photo,<br />
optical goods 2 0 2 0 0 0<br />
a Not elsewhere classified .
n<br />
rn<br />
Table TRANS 15 . Port of Pensacola freight traffic (short tons) in 1960 (U .S . Army Corps of Engineers 1962 .<br />
Foreign Domestic<br />
Coastwise Internal Intra<br />
Commodity classification Total Imports Exports shipments Receipts ipments port Local<br />
Total<br />
040 Fish and products,<br />
fresh<br />
049 Shellfish and products<br />
065 Leather and manufactures<br />
094 Shells, unmanufactured<br />
095 Animal products,<br />
inedible, nec<br />
101 Rice<br />
109 Flour, grain<br />
prepared, nec<br />
110 Animal feeds, nec<br />
125 Vegetable and prepared<br />
including canned, nec<br />
127 Vegetables and prepared,<br />
nec<br />
185 Molasses, sugar products,<br />
edible<br />
190 Liquors and wines<br />
195 Beverages and<br />
syrups, nec<br />
201 Synthetic rubbers<br />
792,443 75,410 64,716 14,560 572,920 34,114 30,081 642<br />
640 0 0 0 0 0 0 640<br />
2 0 0 0 0 0 0 2<br />
1 0 1 0 0 0 0 0<br />
7,452 0 0 0 7,452 0 0 0<br />
17 0 17 0 0 0 0 0<br />
10 0 10 0 0 0 0 0<br />
3,971 0 3,971 0 0 0 0 0<br />
9,134 0 9,134 0 0 0 0 0<br />
2,287 2,287 0 0 0 0 0 0<br />
77 0 77 0 0 0 0 0<br />
121 0 121 0 0 0 0 0<br />
22 22 0 0 0 0 0 0<br />
34 0 34 0 0 0 0 0<br />
6 0 6 0 0 0 0 0<br />
Continued
n<br />
~<br />
Table TRANS 15 . Continued .<br />
Fore i gn Domestic<br />
Coastwise Internal Intra<br />
Commodity classification Total Imports Exports shipments Receipts Shipments port Local<br />
203 Reclaimed rubber<br />
and scrap<br />
205 Rubber tires and<br />
inner tubes<br />
207 Rubber manuf actures, nec<br />
210 Naval stores, gums,<br />
and resins<br />
240 Oils, fats, waxes,<br />
vegetable, crude<br />
280 Tobacco, unmanufactures<br />
310 Cotton semi-manufactures<br />
320 Cotton manufactures<br />
335 Vegetable fiber<br />
manufactures, nec<br />
381 Man-made fibers and<br />
manufactures<br />
390 Textile products, nec<br />
400 Logs<br />
401 Rafted logs<br />
405 Posts, poles, and piling<br />
408 Wood, nonmanuf actured,<br />
nec<br />
413 Lumber and shingles<br />
416 Plywood, veneers,<br />
materials<br />
11 0 11<br />
2 0 2<br />
15 0 15<br />
1,116 0 1,107<br />
149 0 149<br />
4 0 4<br />
275 0 275<br />
47 0 47<br />
27 0 27<br />
625 0 625<br />
79 0 79<br />
16,480 16,109 371<br />
30,081 0 0<br />
11,844 0 5,581<br />
649 0 0<br />
13,826 5,289 6,634<br />
409 0 152<br />
Continued<br />
0 0 0 0 0<br />
0 0 0 0 0<br />
0 0 0 0 0<br />
9 0 0 0 0<br />
0 0 0 0 0<br />
0 0 0 0 0<br />
0 0 0 0 0<br />
0 0 0 0 0<br />
0 0 0 0 0<br />
0 0 0 0 0<br />
0 0 0 0 0<br />
0 0 0 0 0<br />
0 0 0 30,081 0<br />
6,263 0 0 0 0<br />
649 0 0 0 0<br />
1,903 0 0 0 0<br />
257 0 0 0 0
n<br />
00<br />
Table TRANS 15 . Continued .<br />
Commodity classification<br />
417 Railroad ties<br />
421 Wood manufactures, nec<br />
450 Standard newsprint paper<br />
457 Paper and manufactures,<br />
nec<br />
507 Gasoline<br />
510 Gas oil, distillate<br />
fuel oil<br />
511 Petroleum, crude<br />
512 Jet fuel, all types<br />
513 Kerosene<br />
514 Residual fuel oil<br />
518 Aliphatic naphtha<br />
519 Lubricating oils<br />
and greases<br />
520 Petroleum products, nec<br />
523 Building cement<br />
526 Stone and<br />
manufactures, nec<br />
530 Glass and glass<br />
products<br />
540 Clays and earths<br />
543 Brick and tile<br />
549 Sulphur, liquid<br />
550 Sulphur, dry<br />
Foreign<br />
Domestic<br />
Coastwise Internal Intra<br />
Total Imports Exports shipments Receipts Shipments port<br />
2,146 0 1,863<br />
1,006 0 165<br />
165 0 165<br />
12,404 0 8,157<br />
252,209 0 0<br />
45,683 0 0<br />
10,408 0 9<br />
45,348 0 0<br />
8,004 0 0<br />
37,662 0 0<br />
7,444 0 0<br />
17 0 17<br />
14,017 0 196<br />
44,919 1,415 0<br />
91,495 0 0<br />
171 0 171<br />
443 0 443<br />
194 0 194<br />
2,464 0 0<br />
2,464 0 0<br />
Continued<br />
283 0 0 0<br />
841 0 0 0<br />
0 0 0 0<br />
4,247 0 0 0<br />
0 252,209 0 0<br />
0 45,683 0 0<br />
0 10,399 0 0<br />
0 45,348 0 0<br />
0 8,004 0 0<br />
0 37,662 0 0<br />
0 7,444 0 0<br />
0 0 0 0<br />
0 13,821 0 0<br />
0 43,504 0 0<br />
0 91,195 300 0<br />
0 0 0 0<br />
0 0 0 0<br />
0 0 0 0<br />
0 2,464 0 0<br />
0 2,464 0 0<br />
Local<br />
0<br />
0<br />
0<br />
0<br />
0<br />
0<br />
0<br />
0<br />
0<br />
0<br />
0<br />
0<br />
0<br />
0<br />
0<br />
0<br />
0<br />
0<br />
0<br />
0
n<br />
ko<br />
Table TRANS 15 . Continued .<br />
Commodity classification Total<br />
Foreign<br />
Imports Exports<br />
Coastwise<br />
shipments<br />
Domestic<br />
Internal<br />
Receipts S ipments<br />
Intra<br />
port Local<br />
551 Limestone, crushed 600 0 0 0 600 0 0 0<br />
554 Sand, gravel, crushed<br />
rock 2,279 0 300 0 1,979 0 0 0<br />
555 Nonmetallic minerals,<br />
manufactures, nec 169 0 169 0 0 0 0 0<br />
602 Iron and steel scrap 16,914 0 16,914 0 0 0 0 0<br />
605 Ferrous castings<br />
and forgings 29 0 29 0 0 0 0 0<br />
606 Tools and basic<br />
hardware 24 0 24 0 0 0 0 0<br />
607 Kitchen and hospital<br />
utensils 45 0 45 0 0 0 0 0<br />
608 Iron and steel pipe 1,381 0 1,381 0 0 0 0 0<br />
609 Rolled, finished steel<br />
mill products 1,000 0 1,000 0 0 0 0 0<br />
611 Metal manufacturGs, parts,<br />
nec except SCi 70 0 70 0 0 0 0 0<br />
700 Electrical machinery 22 1 0 21 0 0 0 0<br />
701 Electrical machinery<br />
except SCi 84 0 84 0 0 0 0 0<br />
722 Construction, mining<br />
machinery, parts 116 0 16 0 100 0 0 0<br />
740 Textile, shoe machinery,<br />
parts 2 0 2 0 0 0 0 0<br />
Continued
V<br />
V<br />
Table TRANS 15 . Continued .<br />
Commodity classification<br />
742 Industrial machinery,<br />
parts, nec<br />
780 Motor vehicles<br />
781 Motor vehicles<br />
except SCi<br />
782 Motor vehicle parts<br />
783 Watercraft and parts<br />
787 Motor vehicles<br />
parts except SCi<br />
790 Aircraft and parts<br />
796 Vehicles and parts, nec<br />
805 Other coal tar products<br />
806 Other coal tar products<br />
except SCi<br />
810 Medicines and<br />
preparations<br />
826 Alcohols<br />
828 Other industrical<br />
chemicals except SCi<br />
829 Industrial chemicals,<br />
nec<br />
846 Chemical specialties,<br />
nec<br />
Foreign<br />
Domestic<br />
Coastwise Internal Intra<br />
Total Imports Exports shipments Receipts ipments port Local<br />
144 0 144 0 0 0 0 0<br />
4,265 4,261 0 4 0 0 0 0<br />
67 0 67 0 0 0 0 0<br />
85 85 0 0 0 0 0 0<br />
1 0 0 1 0 0 0 0<br />
157 0 157 0 0 0 0 0<br />
10 0 0 0 10 0 0 0<br />
1 0 1 0 0 0 0 0<br />
8,455 5,873 0 0 2,582 0 0 0<br />
5 0 5 0 0 0 0 0<br />
12 0 12 0 0 0 0 0<br />
33,814 0 0 0 0 33,814 0 0<br />
31 0 31 0 0 0 0 0<br />
60 0 0 60 0 0 0 0<br />
72 0 72 0 0 0 0 0<br />
Continued
Table TRANS 15 . Concluded .<br />
Foreign Domestic<br />
Coastwise Internal Intra<br />
Commodity classification Total Imports Exports shipments eceip s Shipments port Local<br />
848 Pigments, paints,<br />
varnishes 212 0 212 0 0 0 0 0<br />
851 Other nitrogenous<br />
fertilizer materials 37,955 36,766 1,189 0 0 0 0 0<br />
854 Superphosphate 2,744 0 2,744 0 0 0 0 0<br />
855 Potash fertilizer<br />
materials 3,300 3,300 0 0 0 0 0 0<br />
865 Soap and toilet<br />
preparations 3 0 3 0 0 0 0 0<br />
~ 900 Commodities, nec 23 1 0 22 0 0 0 0<br />
~ 901 Commodities, nec<br />
except SCi 58 0 58 0 0 0 0 0<br />
920 U .S . articles<br />
returned 1 1 0 0 0 0 0 0<br />
980 Low-valued shipments 134 0 134 0 0 0 0 0<br />
999 Department of<br />
Defense and SCi 23 0 23 0 0 0 0 0<br />
b Not elsewhere classified .<br />
Special category items .
v<br />
Table TRANS 16 . Port of Pensacola freight traffic (short tons) in 1965 (U .S . Army Corps of Engineers 1967) .<br />
Foreign Domestic<br />
Coastwide Inter nal<br />
Commodity classification Total Imports Exports eceip s Shipments Receipts Shipments Local<br />
Total 651,265 96,879 92,282 10,022 2,744 390,733 41,785 16,820<br />
0102 Barley and rye 408 0 408 0 0 0 0 0<br />
0131 Fresh fruits and<br />
tree nuts 32 0 32 0 0 0 0 0<br />
0161 Animals and products,<br />
nec 1 1 0 0 0 0 0 0<br />
0841 Crude rubber and<br />
allied gums 12 12 0 0 0 0 0 0<br />
0861 Forest products, nec 11 11 0 0 0 0 0 0<br />
^o 0911 Fresh fish, except<br />
shellfish 881 0 0 0 0 0 0 881<br />
0931 Marine shells,<br />
unmanufactured 43,100 0 0 0 0 43,100 0 0<br />
1121 Bituminous coal<br />
and lignite 8,457 0 0 0 0 8,457 0 0<br />
1311 Crude petroleum 1,554 0 0 0 0 1,554 0 0<br />
1442 Sand and gravel 579 0 2 0 0 577 0 0<br />
1479 Natural fertilizer<br />
materials, nec 3,337 3,337 0 0 0 0 0 0<br />
1911 Ordnance and<br />
accessories 2 2 0 0 0 0 0 0<br />
Continued
V<br />
W<br />
Table TRANS 16 . Continued .<br />
Commodity classification<br />
2491 Wood manufactures, nec<br />
2511 Furniture and<br />
fixtures<br />
2621 Standard newsprint<br />
paper<br />
2631 Paper and paperboard<br />
2691 Pulp and paper<br />
products, nec<br />
2811 Crude tar, oil, gas<br />
products<br />
2813 Alcohols<br />
2819 Basic chemicals and<br />
products, nec<br />
2821 Plastic materials<br />
2823 Synthetic fibers<br />
2841 Soap<br />
2861 Gum and wood chemicals<br />
2871 Nitrogenous fertilizer,<br />
manufactured<br />
Foreign<br />
Domestic<br />
Coastwise Internal<br />
Total Imports Exports Receipts S ipments Receipts Shipments Local<br />
267 0 146<br />
1 1 0<br />
602 601 0<br />
42,394 42,394 0<br />
1,225 0 23<br />
8,730 8,375 0<br />
31,188 0 1,744<br />
16,504 16,487 17<br />
1,172 0 1,172<br />
26 0 26<br />
17 1 16<br />
13,880 0 5,794<br />
31,457 27,959 2,073<br />
Continued<br />
0 121 0 0 0<br />
0 0 0 0 0<br />
0 0 0 0 0<br />
0 0 0 0 0<br />
0 1,202 0 0 0<br />
0 0 355 0 0<br />
0 0 1,326 28,118 0<br />
0 0 0 0 0<br />
0 0 0 0 0<br />
0 0 0 0 0<br />
0 0 0 0 0<br />
0 0 0 8,086 0<br />
0 0 0 1,425 0
~<br />
4t~-<br />
Table TRANS 16 . Continued .<br />
Foreign<br />
Domestic<br />
Coastwise Internal<br />
Commodity classification Total Imports Exports Receipts Shipments Receipts Shipments Local<br />
2011 Meat, fresh, chilled,<br />
frozen<br />
2012 Meat and products, nec<br />
2022 Dried milk and cream<br />
2034 Vegetables and<br />
prepared, nec<br />
2042 Prepared animal feeds<br />
2049 Grain mill products, nec<br />
2081 Alcoholic beverages<br />
2082 Beverages and syrups, nec<br />
2091 Vegetable oils, margarine,<br />
shortening<br />
2095 Ice<br />
2099 Miscellaneous food<br />
products<br />
2211 Basic textile products<br />
2411 Logs<br />
2412 Rafted logs<br />
2414 Timber, posts, poles,<br />
piling<br />
2421 Lumber<br />
53 0 53<br />
41 41 0<br />
2,519 0 2,519<br />
12,844 12,844 0<br />
3,960 3,960 0<br />
9,355 0 9,355<br />
41 37 4<br />
1,316 0 1,316<br />
20 0 20<br />
245 0 0<br />
1 0 1<br />
4,484 4 4,480<br />
15,778 11,597 645<br />
12,158 0 0<br />
7,973 0 7,201<br />
7,983 4,315 3,041<br />
Con tinued<br />
0 0 0 0 0<br />
0 0 0 0 0<br />
0 0 0 0 0<br />
0 0 0 0 0<br />
0 0 0 0 0<br />
0 0 0 0 0<br />
0 0 0 0 0<br />
0 0 0 0 0<br />
0 0 0 0 0<br />
0 0 0 0 245<br />
0 0 0 0 0<br />
0 0 0 0 0<br />
0 0 0 0 3,536<br />
0 0 0 0 12,158<br />
0 772 0 0 0<br />
0 627 0 0 0
~<br />
Table TRANS 16 . Continued .<br />
Commodity classification Total<br />
Foreign<br />
Imports Exports<br />
Coastwise<br />
Receipts Shipments<br />
Domestic<br />
Internal<br />
Receipts Shipments Local<br />
2879 Fertilizer and<br />
materials, nec 1,900 0 0 0 0 0 1,900 0<br />
2891 Miscellaneous<br />
chemical products 390 0 0 0 0 390 0 0<br />
2911 Gasoline 258,910 0 0 0 0 258,081 829 0<br />
2912 Jet fuel 8,868 0 0 0 0 8,868 0 0<br />
2913 Kerosene 9,586 0 0 0 0 9,586 0 0<br />
2914 Distillate fuel oil 26,578 0 0 0 0 26,578 0 0<br />
2915 Residual fuel oil 14,949 0 0 9,276 0 5,553 120 0<br />
2917 Naphtha petroleum<br />
solvents 8,219 0 0 0 0 8,219 0 0<br />
2921 Liquefied gases 6,678 0 0 0 0 5,792 886 0<br />
2991 Petroleum and coal<br />
products, nec 21 0 21 0 0 0 0 0<br />
3011 Rubber and miscellaneous<br />
plastics products 72 29 43 0 0 0 0 0<br />
3111 Leather and leather<br />
products 3 3 0 0 0 0 0 0<br />
3211 Glass and glass<br />
products 43 43 0 0 0 0 0 0<br />
3241 Building cement 6,576 0 0 0 0 6,576 0 0<br />
Continued
V<br />
01<br />
Table TRANS 16 . Continued .<br />
Commodity classification<br />
Total<br />
.<br />
Foreign<br />
Imports Exports<br />
Coastwise<br />
Receipts Shipments<br />
Domestic<br />
Internal<br />
Receipts Shipments Local<br />
3251 Structural clay<br />
products 345 21 0 0 0 324 0 0<br />
3291 Miscellaneous nonmetallic<br />
mineral products 7,489 1 2,391 0 0 5,097 0 0<br />
3315 Iron, steel shapes,<br />
except sheet 870 859 0 0 11 0 0 0<br />
3316 Iron and steel plates,<br />
sheets 6,121 6,105 16 0 0 0 0 0<br />
3319 Iron and steel<br />
products, nec 34 34 0 0 0 0 0 0<br />
3324 Aluminum and alloys,<br />
unworked 6 6 0 0 0 0 0 0<br />
3411 Metal containers 8 7 1 0 0 0 0 0<br />
3421 Cutlery, tools, and<br />
hardware 3 1 2 0 0 0 0 0<br />
3431 Plumbing fixtures,<br />
heating equipment 47 0 47 0 0 0 0 0<br />
3491 Miscellaneous fabricated<br />
metal products 156 10 135 0 11 0 0 0<br />
3511 Machinery, except<br />
electrical 1,301 90 311 725 0 0 175 0<br />
Continued
~<br />
V<br />
Table TRANS 16 . Continued .<br />
Foreign Domestic<br />
Coastwise Internal<br />
Commodity classification Total Imports Exports Receipts S ipments Receipts S ipments Local<br />
3611 Machinery, except<br />
electrical 1,301<br />
3711 Motor vehicles, parts,<br />
equipment 67<br />
3721 Aircraft and parts 22<br />
3791 Miscellaneous transportation<br />
equipment 19<br />
3911 Miscellaneous manufactured<br />
products 481<br />
4011 Iron and steel scrap 6,760<br />
4012 Nonferrous metal scrap 32<br />
4112 Commodities, nec 100<br />
a Not elsewhere classified .<br />
90 311 725 0 0 175 0<br />
59 8 0 0 0 0 0<br />
1 0 21 0 0 0 0<br />
0 19 0 0 0 0 0<br />
25 10 0 0 200 246 0<br />
0 6,760 0 0 0 0 0<br />
0 32 0 0 0 0 0<br />
0 0 0 0 100 0 0
V<br />
CO<br />
Table TRANS 17 . Port of Pensacola freight traffic (short tons) in 1970 (U .S . Army Corpb'~ of Engineers 1972) .<br />
Foreign<br />
Domestic<br />
Coastwise Internal<br />
Commodity classification Total Imports Exports Receipts Shipments Receipts Shipments Local<br />
Total<br />
0105 Rice<br />
0911 Fresh fish, except<br />
shellfish<br />
0912 Shellfish, except<br />
prepared<br />
0931 Marine shells,<br />
unmanufactured<br />
1311 Crude petroleum<br />
1442 Sand, gravel,<br />
crushed rock<br />
1451 Clay<br />
1479 Natural fertilizSr<br />
materials, nec<br />
2022 Dried milk and cream<br />
2034 Vegetables and<br />
prepared, nec<br />
2041 Wheat flour and<br />
semolina<br />
2042 Prepared animal feeds<br />
2049 Grain mill products,<br />
nec<br />
1,002,174 92,042 97,617<br />
18,781 0 18,781<br />
8 0 0<br />
3 0 0<br />
78,943 0 0<br />
14,166 0 0<br />
11,775 0 0<br />
773 0 773<br />
25,872 25,872 0<br />
2,329 0 2,329<br />
5,449 5,449 0<br />
8,676 0 8,676<br />
7,375 7,375 0<br />
2,217 0 2,217<br />
Continued<br />
4,187 5,059 755,981 31,283 16,005<br />
0 0 0 0 0<br />
0 0 8 0 0<br />
0 0 3 0 0<br />
0 0 78,943 0 0<br />
0 0 14,166 0 0<br />
0 0 11,775 0 0<br />
0 0 0 0 0<br />
0 0 0 0 0<br />
0 0 0 0 0<br />
0 0 0 0 0<br />
0 0 0 0 0<br />
0 0 0 0 0<br />
0 0 0 0 0
v<br />
ko<br />
Table TRANS 17 . Continued .<br />
Foreign<br />
Domestic<br />
Coastwise Internal<br />
Commodity classification Total Imports Exports Receipts Shipments Receipts Shipments Local<br />
2081 Alcoholic beverages<br />
2091 Vegetable oils, margarine,<br />
shortening<br />
2095 Ice<br />
2099 Miscellaneous food<br />
products<br />
2211 Basic textile products<br />
2411 Logs<br />
2412 Rafted logs<br />
2414 Timber, posts, poles,<br />
piling<br />
2416 Wood chips, staves,<br />
moldings<br />
2421 Lumber<br />
2431 Veneer, plywood,<br />
worked wood<br />
2491 Wood manuf actures, nec<br />
2511 Furniture and fixtures<br />
2611 Pulp<br />
2631 Paper and paperboard<br />
2811 Crude tar, oil, gas<br />
products<br />
2 2 0<br />
608 0 608<br />
5 0 0<br />
1,762 0 1,762<br />
264 159 105<br />
11,513 11,513 0<br />
16,005 0 0<br />
6,093 0 6,093<br />
107 107 0<br />
8,720 7,472 1,248<br />
2,131 2,131 0<br />
9 9 0<br />
3 3 0<br />
17,386 0 17,386<br />
19,031 0 14,035<br />
5,279 5,279 0<br />
Continued<br />
0 0 0 0 0<br />
0 0 0 0 0<br />
0 0 0 5 0<br />
0 0 0 0 0<br />
0 0 0 0 0<br />
0 0 0 0 0<br />
0 0 0 0 16,005<br />
0 0 0 0 0<br />
0 0 0 0 0<br />
0 0 0 0 0<br />
0 0 0 0 0<br />
0 0 0 0 0<br />
0 0 0 0 0<br />
0 0 0 0 0<br />
0 4,899 0 97 0<br />
0 0 0 0 0
CO<br />
0<br />
Table TRANS 17 . Continued .<br />
Commodity classification<br />
2813 Alcohols<br />
2817 Benzene and toluene<br />
2819 Basic chemicals and<br />
products, nec<br />
2821 Plastic materials<br />
2823 Synthetic fibers<br />
2861 Gum and wood chemicals<br />
2871 Nitrogenous chemical<br />
fertilizers<br />
2891 Miscellaneous<br />
chemical products<br />
2911 Gasoline<br />
2912 Jet fuel<br />
2913 Kerosene<br />
2914 Distillate fuel oil<br />
2915 Residual fuel oil<br />
2917 Naphtha, petroleum<br />
solvents<br />
2921 Liquefied gases<br />
3011 Rubber and miscellaneous<br />
plastics products<br />
Foreign<br />
Domest i c<br />
Coastwise Internal<br />
Total Imports Exports Receipts ipments Receipts ipments Local<br />
9,321 0 0<br />
2,661 0 0<br />
17,785 15,627 322<br />
44 0 44<br />
1,719 0 1,719<br />
27,580 0 12,117<br />
13,472 0 7,872<br />
694 0 694<br />
433,737 0 0<br />
56,680 0 0<br />
1,647 0 0<br />
25,962 0 0<br />
71,247 0 0<br />
16,875 0 0<br />
41,999 0 0<br />
36 25 11<br />
Continued<br />
0 0 0 9,321 0<br />
0 0 2,661 0 0<br />
0 0 1,836 0 0<br />
0 0 0 0 0<br />
0 0 0 0 0<br />
0 0 0 15,463 0<br />
0 0 0 5,600 0<br />
0 0 0 0 0<br />
0 0 433,737 0 0<br />
0 0 56,680 0 0<br />
0 0 1,647 0 0<br />
0 0 25,962 0 0<br />
4,010 0 67,237 0 0<br />
0 0 16,875 0 0<br />
0 0 41,202 797 0<br />
0 0 0 0 0
00<br />
~<br />
Table TRANS 17 . Continued .<br />
Commodity classification<br />
3291 Miscellaneous nonmetallic<br />
mineral products<br />
3314 Iron and steel<br />
primary forms<br />
3315 Iron, steel shapes,<br />
except sheet<br />
3316 Iron and steel plates,<br />
sheets<br />
3319 Iron and steel<br />
products, nec<br />
3321 Nonferrous metals, nec<br />
3324 Aluminum and alloys,<br />
unworked<br />
3411 Fabricated metal<br />
products<br />
3511 Machinery, except<br />
electrical<br />
3611 Electrical machinery<br />
and equipment<br />
3711 Motor vehicles, parts,<br />
equipment<br />
Foreign<br />
Domestic<br />
Coastwise Internal<br />
Total Imports Exports Receipts Shipments Receipts Shipments Local<br />
2,079 3 76<br />
198 0 198<br />
184 174 10<br />
11,596 10,620 2<br />
415 0 0<br />
3 0 3<br />
89 0 89<br />
300 218 82<br />
8 0 8<br />
1 0 1<br />
12 0 12<br />
Continued<br />
0 0 2,000 0 0<br />
0 0 0 0 0<br />
0 0 0 0 0<br />
0 140 834 0 0<br />
0 0 415 0 0<br />
0 0 0 0 0<br />
0 0 0 0 0<br />
0 0 0 0 0<br />
0 0 0 0 0<br />
0 0 0 0 0<br />
0 0 0 0 0
Table TRANS 17 . Continued .<br />
Commodity classification Total Imports Exports<br />
Foreiqn Domestic<br />
Coastwise<br />
Receipts Shipments<br />
Internal<br />
Receipts Shipments Local<br />
3721 Aircraft and parts 81 0 0 61 20 0 0 0<br />
3731 Ships and boats 116 0 0 116 0 0 0 0<br />
4012 Nonferrous metal scrap 273 0 273 0 0 0 0 0<br />
4022 Textile waste, scrap,<br />
4112<br />
sweep<br />
Commodities, nec<br />
N ° Not elsewhere classified .<br />
71 4<br />
0 4<br />
71 0 0 0 0 0<br />
0 0 0 0 0 0
00<br />
w<br />
Table TRANS 18 . Port of Pensacola freight traffic (short tons) in 1975 (U .S . Army Corps of Engineers 1977) .<br />
Commodity classification Total<br />
Foreign<br />
Imports Exports<br />
Total 2,262,084 321,964 292,796<br />
0103 Corn 332 0 332<br />
0105 Rice 146,291 0 133,837<br />
0106 Sorghum grains 3,186 0 160<br />
0107 Wheat 1,072 0 0<br />
0119 Oilseeds, neca 649 0 0<br />
0133 Coffee 77 77 0<br />
0191 Miscellaneous farm products 1 0 1<br />
0861 Forest products, nec 11 11 0<br />
0931 Marine shells, unmanufactured 69,251 0 0<br />
1311 Crude petroleum 540,209 273,097 0<br />
1442 Sand, gravel, crushed rock 10,371 0 0<br />
1451 Clay 397 0 0<br />
1479 Natural fertilizer<br />
materials, nec 22,957 22,957 0<br />
1493 Liquid sulphur 417,999 0 0<br />
2022 Dried milk and cream 128 0 128<br />
2034 Vegetables and prepared, nec 60 60 0<br />
2041 Wheat flour and semolina 38,782 0 32,742<br />
2042 Prepared animal feeds 17,667 16,802 865<br />
2049 Grain mill products, nec 95,518 0 86,138<br />
2091 Vegetable oils, margarine,<br />
shortening 307 0 307<br />
2099 Miscellaneous food products 15,957 0 15,957<br />
2211 Basic textile products 5 0 5<br />
2311 Apparel 46 46 0<br />
2414 Timber, posts, poles, piling 1,094 0 1,094<br />
2416 Wood chips, staves, moldings 40 40 0<br />
Continued
~<br />
Table TRANS 18 . Continued .<br />
Commodity classification Total<br />
Imports<br />
Fore i gn .<br />
Fxports<br />
Total 2,262,084 321,964 292,796<br />
2421 Lumber 13,117 7,186 5,931<br />
2431 Veneer, plywood, worked wood 776 776 0<br />
2491 Wood manufactures, nec 71 57 14<br />
2611 Pulp 228 0 228<br />
2631 Paper and paperboard 19,800 0 12,497<br />
2810 Sodium hydroxide • 20,345 0 0<br />
2811 Crude tar, oil, gas products 2,667 0 0<br />
2813 Alcohols 19,031 0 0<br />
2819 Basic chemicals and<br />
products, nec 13,563 0 0<br />
2821 Plastic materials 463 0 1<br />
2823 Synthethic fibers 533 0 533<br />
2841 Soap 126 0 126<br />
2861 Gum and wood chemicals 6,523 327 652<br />
2871 Nitrogenous chemical fertilizers 752 0 752<br />
2891 Miscellaneous chemical products 48 22 26<br />
2911 Gasoline 424,732 0 0<br />
2912 Jet fuel 16,984 0 0<br />
2914 Distillate fuel oil 89,757 0 0<br />
2915 Residual fuel oil 204,054 0 0<br />
2917 Naphtha, petroleum solvents 7,659 0 0<br />
2921 Liquified gases 35,385 0 0<br />
3011 Rubber and miscellaneous<br />
plastics products 55 0 55<br />
3251 Structural clay products 28 0 28<br />
3315 Iron, steel shapes, except sheet 515 0 0<br />
3317 Iron and steel pipe and tube 100 0 0<br />
Continued
CO<br />
Ln<br />
Table TRANS 18 . Continued .<br />
Commodity classification Total<br />
Foreign<br />
Imports Exports<br />
3319 Iron and steel products, nec 2 0 2<br />
3321 Nonferrous metals, nec 8 0 8<br />
3322 Copper alloys, unworked 50 50 0<br />
3411 Fabricated metal prod . 176 2 8<br />
3511 Machinery, except electrical 1,553 454 124<br />
3611 Electrical machinery and<br />
equipment 4 0 4<br />
3711 Motor vehicles, parts, equipment 41 0 41<br />
3721 Aircraft and parts 5 0 0<br />
3731 Ships and boats 11 0 11<br />
3791 Miscellaneous transportation<br />
equipment 7 0 7<br />
3811 Instruments, photo, optical<br />
goods 1 0 1<br />
4011 Iron and steel scrap 25 0 0<br />
4024 Paper waste and scrap 174 0 174<br />
4112 Commodities, nec 202 0 7<br />
Continued
Table TRANS 18 . Continued .<br />
Domestic<br />
Coastwise Internal<br />
Commo dity classification Receipts Shipments Receipts S ipments Local<br />
Total 5,549 36,680 - 876,809 726,902 1,284<br />
0103 Corn 0 0 0 0 0<br />
0105 Rice 0 0 2,220 10,234 0<br />
0106 Sorghum grains 0 0 0 3,026 0<br />
0107 Wheat 0 0 0 1,072 0<br />
0119 Oilseeds, nec 0 0 0 649 0<br />
0133 Coffee 0 0 0 0 0<br />
0191 Miscellaneous farm products 0 0 0 0 0<br />
co 0861 Forest products, nec 0 0 0 0 0<br />
0931 Marine shells, unmanufactured 0 0 69,251 0 0<br />
1311 Crude petroleum 0 0 0 267,112 0<br />
1442 Sand, gravel, crushed rock 0 0 10,371 0 0<br />
1451 Clay 0 0 0 397 0<br />
1479 Natural fertilizer<br />
materials, nec 0 0 0 0 0<br />
1493 Liquid sulphur 0 33,065 0 384,934 0<br />
2022 Dried milk and cream 0 0 0 0 0<br />
2034 Vegetables and prepared, nec 0 0 0 0 0<br />
2041 Wheat flour and semolina 0 0 0 6,040 0<br />
2042 Prepared animal feeds 0 0 0 0 0<br />
2049 Grain mill products nec 0 0 0 9,380 0<br />
2091 Vegetable oils, margarine,<br />
shortening 0 0 0 0 0<br />
2099 Miscellaneous food products 0 0 0 0 0<br />
2211 Basic textile products 0 0 0 0 0<br />
2311 Apparel 0 0 0 0 0<br />
Continued
CO<br />
v<br />
Table TRANS 18 . Continued .<br />
Domestic<br />
Coastwise Internal<br />
Commodity classification Receipts Shipments Receipts Shipments Local<br />
2414 Timber, posts, poles, piling 0 0 0 0 0<br />
2416 Wood chips, staves, moldings 0 0 0 0 0<br />
2421 Lunber 0 0 0 0 0<br />
2431 Veneer, plywood, worked wood 0 0 0 0 0<br />
2491 Wood manuf actures,-nec 0 0 0 0 0<br />
2611 Pulp 0 0 0 0 0<br />
2631 Paper and paperboard 0 0 0 7,303 0<br />
2810 Sodium hydroxide 0 0 20,345 0 0<br />
2811 Crude tar, oil, gas products 0 0 2,667 0 0<br />
2813 Alcohols 0 3,615 12,807 1,325 1,284<br />
2819 Basic chemicals and products, nec 0 0 13,563 0 0<br />
2821 Plastic materials 0 0 0 462 0<br />
2823 Synthethic fibers 0 0 0 0 0<br />
2841 So ap 0 0 0 0 0<br />
2861 Gum and wood chemicals 5,644 0 0 0 0<br />
2871 Nitrogenous chemical fertilizers 0 0 0 0 0<br />
2891 Miscellanebus chemical products 0 0 0 0 0<br />
2911 Gasoline 0 0 424,732 0 0<br />
2912 Jet fuel 0 0 16,984 0 0<br />
2914 Distillate fuel oil 0 0 88,080 1,677 0<br />
2915 Residual fuel oil 0 0 179,838 24,216 0<br />
2917 Naphtha, petroleum solvents 0 0 7,659 0 0<br />
2921 Liquified gases 0 0 27,796 7,589 0<br />
3011 Rubber and miscellaneous<br />
plastics products 0 0 0 0 0<br />
3251 Structural clay products 0 0 0 0 0<br />
3315 Iron, steel shapes, except sheet 0 0 490 25 0<br />
3317 Iron and steel pipe and tube 0 0 0 100 0<br />
Continued
Table TRANS 18 . Concluded .<br />
Commodity classification Receipts<br />
Coastwise<br />
Shipments<br />
Domestic<br />
Receipts<br />
Internal<br />
Shipments Local<br />
3319 Iron and steel products, nec 0 0 0 0 0<br />
3321 Nonferrous metals, nec 0 0 0 0 0<br />
3322 Copper alloys, unworked 0 0 0 0 0<br />
3411 Fabricated metal products 0 0 0 166 0<br />
3511 Machinery, except electrical 0 0 0 975 0<br />
3611 Electrical machinery and<br />
equipment 0 0 0 0 0<br />
3711 Motor vehicles, parts,<br />
equipment 0 0 0 0 0<br />
~ 3721 Aircraft and aprts 5 0 0 0 0<br />
3731 Ships and boats 0 0 0 0 0<br />
3791 Miscellaneous transportation<br />
equipment 0 0 0 0 0<br />
3811 Instruments, photo', optical<br />
goods 0 0 0 0 0<br />
4011 Iron and steel scrap 0 0 0 25 0<br />
4024 Paper waste and scrap<br />
4112 Commodities, nec 0 0 0 195 0<br />
a Not elsewhere classified .
Table TRANS 19 . Loading and unloading equipment availability at portsa as of<br />
December 1978 (Florida Department of Transportation 1978b) .<br />
Port of Port of Port of<br />
Equipment Panama City Pensacola St . Joe<br />
Petroleum pipeline<br />
Chiksan<br />
Oil pits<br />
Payloaders<br />
Conveyors<br />
Cranes<br />
Bulldozers<br />
Front end loaders<br />
Forkl ifts<br />
Trucks<br />
Gantry cranes<br />
Crawler cranes<br />
Hose handling booms<br />
Towboats<br />
Stevedore furnished equipment<br />
Roll on, roll off ramps<br />
Equipment owned by<br />
individual operators<br />
a No data for Port of Apalachicola .<br />
x x<br />
x x<br />
x x<br />
x<br />
x x x<br />
x<br />
89<br />
x<br />
x
Table TRANS 20 . Port of Panama City storage and capacity in 1978 (Florida<br />
Department of Transportation 1978b) .<br />
Storage Covered : 327,895 ft2 (7 .5 acres)<br />
Transit sheds : 144,895 ft2 (3 .3 ~cres)<br />
Port owned warehouses : 66,000 ft (1 .5 acres)<br />
Privately owned warehouses : 117,000 ft2 (2 .7 acres)<br />
Open : 17 acres<br />
Special storage Dry bulk silo : 400 tons<br />
Coal storage area : 200,000 tons<br />
Liquid bulk : petroleum 1,235,838 bbl<br />
liquid petroleum gas 19,286 bbl<br />
chemicals 2,700 tons<br />
Berth f acilities Public and Port Authority owned<br />
deep water wharves 1,600 ft<br />
shallow water wharves 620 ft<br />
Private<br />
deep water wharves 2,935 ft<br />
shallow water wharves 6,138 ft<br />
90
Table TRANS 21 . Port of Pensacola storage and capacity in 1978 (Florida<br />
Department of Transportation 1978b) .<br />
Storage Covered : 357,100 ft2 (8 .2 9 acres)<br />
Transit sheds : 249,000 ft (~ .72 acres)<br />
Warehouses, bulk : 108,100 ft (2 .48 acres)<br />
Open : Port Authority, 5 acres<br />
Open : private, 3 acres<br />
Special storage Liquid bulk : petroleum 547,000 bbl<br />
chemicals 44,000 bbl<br />
Liquid bulk : private : 615,547 bbl<br />
Berth facil-ities #7 : primarily used for sulphur barges, 500-ft wharf,<br />
12 ft deep<br />
#'s 6,5,3,2 : general cargo, lumber and petroleum<br />
products, 2030-ft wharf, 33 ft deep, served by<br />
rail, warehouses, tank farms<br />
#1 : primarily used for fertilizers, 600-ft timber<br />
wharf, 12 ft to 33 ft deep, conveyor to warehouses<br />
#4 : 100-ft shallow wharf for barges, primarily<br />
used for domestic commodities<br />
#'s 11,12,13,14 : docking facilities for fishing boats,<br />
barges, tugs and Naval vessels<br />
Vs 15,16 : not in use<br />
#'s 17,18,19 : fishing boats and small craft<br />
#'s 20,21,22 : small craft, 200-ft wharf<br />
Other Facility has eight private terminals and small boat<br />
docks<br />
91
Pensacola<br />
2<br />
Tallahassee<br />
4% Jacksonvllle •<br />
Panama City ! `<br />
ifM#Itl, PASSENGER SERVICE<br />
CLASS I<br />
- - - - - Oa . Southern & Fla . Railway Co.<br />
_ .-• -<br />
Louisville & Nashville Railroad Co .<br />
. . . . . . . . . . . St . Louls-San Francisco Railway Co .<br />
Seaboard Coast Line Railroad Co.<br />
Fla. East Coast Railway Co .<br />
CLASS II<br />
1 Apalachicola Northern Railroad Co.<br />
p Atlanta a St . Andrews Bay Railway Co.<br />
3-• Live Oak, Perry & Gulf Railroad Co .<br />
(Southern Railway)<br />
4 . . . . . . . . . The Marianna a Blountstown Railroad Co.<br />
5•-• •••••• The South Ga . Railway Co. ( Southern Railway)<br />
Tampa<br />
St . Petersburg<br />
~A *%e~ 'Ve<br />
IV-<br />
Figure 5 . Passenger and freight railroads in Florida (Florida Department<br />
of Transportation 1978a) .<br />
92<br />
Miami
Table TRANS 22 . Port of St . Joe storage and capacity in 1978 (Florida<br />
Department of Transportation 1978b) .<br />
Port consists of a deep water wharf approximately 0 .5 mi long with three<br />
terminals :<br />
1) Hess Oil Co . tank farm : 900,000 bbl<br />
2) Public terminal : little use, P need of repair<br />
3) St . Joe Paper Co . : 49,740 ft covered storage<br />
Table TRANS 23 . Port of Apalachicola storage and capacity in 1978 (Florida<br />
Department of Transportation 1978b) .<br />
Port consists of a city-owned marina for recreational craft, and two 80-ft<br />
timber wharves for public use .<br />
Commercial traffic is limited to seafood processing, boat repair and some<br />
petroleum distribution .<br />
Table TRANS 24 . Road miles of track by class of railroad for 1973, 1974, 1975<br />
and 1980 (Florida Department of Transportation 1978a) .<br />
Railroad class 1973 1974 1975 1980<br />
Class I railroads 3,822 .75 3,783 .10 3,878 .38 4,172 .44<br />
Class II railroads 252 .99 253 .07 253 .07 246 .97<br />
Military N .D . N .D . N .D . N .D .<br />
Private N .D . N .D . N .D . N .D .<br />
Florida N .D . N .D . N .D . 4,720 .53<br />
93
Table TRANS 25 . Road miles of track by railroad line, operating revenue and<br />
operating expense for 1973, 1974 and 1975 (Florida Department of Transportation<br />
1978a) .<br />
Railroad line 1973 1974 1975<br />
Class I<br />
Florida East Coast 656 .52 609 .44 590 .00<br />
.<br />
Georgia Southern and Florida 36 .30 36 .30 N .D .<br />
Louisville and Nashville 245 .63 235 .63 247 .00<br />
St . Louis and San Francisco 47 .48 45 .15 48 .00<br />
Seaboard Coast Line 2,836 .82 2,856 .58 2,993 .38<br />
Class II<br />
Apalachicola Northern 95 .62 96 .00 96 .00<br />
Atl anta and St . Andrews Bay 72 .46 72 .46 72 .46<br />
L i ve Oak, Perry and South Georg i a 85 .91 84 .61 84 .61<br />
Continued<br />
94
Table TRANS 25 . Concluded .<br />
Railroad<br />
Terminal companies<br />
Operating<br />
revenue<br />
Year ($1,000)<br />
Operating<br />
expense<br />
($1,000)<br />
Jacksonville terminal 1973 2,297 2,297<br />
1974 2,535 2,535<br />
1975 2,373 63,636<br />
Municipal docks 1973 61 67<br />
1974 103 48<br />
1975 N .D . N .D .<br />
St . Johns River terminal 1973 1,918 1,408<br />
1974 2,633 1,589<br />
1975 2,167 1,626<br />
Total 1973b 256,917 187,282<br />
1974<br />
268,112 198,705<br />
1975 c<br />
227,169 194,496<br />
b Excluded Jacksonville Terminal Co .<br />
Excluded Jacksonville Terminal Co ., Atlanta and St . Andrews Bay and<br />
Pve Oak, Perry and South Georgia .<br />
Excluded Jacksonville Terminal Co . and Municipal Docks Railway Co .<br />
95
Table TRANS 26 . Total road milesa of track in 1980 for selected Florida<br />
railroads (Florida Department of Transportation 1981b) .<br />
County<br />
Louisville<br />
and Nashville<br />
St . Louis and<br />
San Francisco<br />
Apalachicola<br />
Northern<br />
Atlanta and<br />
St . Andrews Bay<br />
Bay 0 . 0 0 .0 0 .0 54 .03<br />
Esc amb i a 59 .34 59 .81 0 .0 0 .0<br />
Frankl in 0 .0 0 .0 28 .62 0 .0<br />
Gulf 0 .0 0 .0 17 .48 0 .0<br />
Okaloosa 48 .46 0 .0 0 .0 0 .0<br />
Santa Rosa 29 .77 0 .0 0 .0 0 .0<br />
Wa'ton 25 .44 0 .0 0 .0 0 .0<br />
Reg i on 163 .01 59 .81 46 .10 54 .03<br />
a No single track miles for Florida East Coast, Georgia Southern and Florida,<br />
Seaboard Coastline and Live Oak, Perry and Southern Georgia .<br />
96
Table TRANS 27 . Total revenue freight ( tons) carried by Class I railroads in<br />
Florida in 1971 ( Florida Department of Transportation 1980d) .<br />
Product<br />
Seaboard<br />
Coastline<br />
Florida<br />
East Coast<br />
Georgia Southern<br />
and Florida<br />
Farm products 2,437,776 812,712 129,426<br />
Nonmetallic minerals<br />
except fuels 34,610,968 3,248,535 2,218,761<br />
Food and kindred<br />
products 5,254,366 748,541 459,090<br />
Lumber and wood<br />
products, except<br />
furniture 6,172,302 257,566 544,352<br />
Pulp and paper 2,694,463 216,243 415,357<br />
Chemicals 8,205,273 270,409 886,617<br />
Petroleum and coal<br />
products 854,887 153,227 57,325<br />
Stone, clay and glass 6,937,889 377,116 443,712<br />
Primary metal<br />
products 860,245 137,398 137,188<br />
Transportation<br />
equipment 695,909 323,267 227,758<br />
Other 3,420,185 877,990 556,052<br />
Total 72,144,263 7,423,004 6,075,638<br />
Continued<br />
97
Table TRANS 27 . Concluded .<br />
Louisville St Louis and<br />
Product and Nashville San Francisco<br />
Farm products 38,789 3,970<br />
Nonmetallic minerals<br />
except fuels 675,761 73,445<br />
Food and kindred<br />
products 260,417 39,964<br />
Lumber and wood<br />
products, except<br />
furniture 1,541,952 299,322<br />
Pulp and paper 405,008 179,132<br />
Chemicals 1,333,798 69,552<br />
Petroleum and coal<br />
products 266,681 5,344<br />
Stone, clay and glass 577,022 76,688<br />
Primary metal<br />
products 28,141 4,091<br />
Transportation<br />
equipment 43,612 177<br />
Other 351,822 32,301<br />
Total 5,523,003 783,986<br />
98
Table TRANS 28 . Total revenue freight (tons) carried by Class I railroads in<br />
Florida in 1972 (Florida Department of Transportation 1980d) .<br />
Seaboard Florida Georgia Southern<br />
Product Coastline East Coast and Florida<br />
Farm products 2,474,412 864,112 119,450<br />
Nonmetallic minerals<br />
except fuels 38,012,568 3,143,365 2,082,846<br />
Food and kindred<br />
products 5,189,887 806,313 483,418<br />
Lumber and wood<br />
products, except<br />
furniture 7,099,232 290,267 584,668<br />
Pulp and paper 2,820,584 221,537 458,143<br />
Chemicals 8,478,407 277,586 936,495<br />
Petroleum and coal<br />
products 916,610 137,640 51,125<br />
Stone, clay and glass 7,058,453 505,766 587,699<br />
Primary metal<br />
products 750,820 119,187 134,748<br />
Transportation<br />
equipment 772,814 364,463 258,360<br />
Other 4,223,219 1,156,086 642,484<br />
Total 77,797,006 7,886,322 6,339,436<br />
Continued<br />
99
Table TRANS 28 . Concluded .<br />
Louisville St Louis and<br />
Product and Nashville San Francisco<br />
Farm products 62,331 8,759<br />
Nonmetallic minerals<br />
except fuels 726,753 80,606<br />
Food and kindred<br />
products 362,484 101,346<br />
Lumber and wood<br />
products, except<br />
furniture 1,615,333 343,052<br />
Pulp and paper 504,359 231,196<br />
Chemicals 1,461,700 63,022<br />
Petroleum and coal<br />
products 297,343 3,882<br />
Stone, clay and glass 633,264 91,899<br />
Primary metal<br />
products 66,663 1,690<br />
Transportation<br />
equipment 69,459 137<br />
Other 562,219 30,002<br />
Total 6,361,908 955,591<br />
100<br />
I
Table TRANS 29 . Total revenue freight (tons) carried by Class I railroads in<br />
Florida in 1973 (Florida Department of Transportation 1980d) .<br />
Seaboard Florida Georgia Southern<br />
Product Coastline East Coast and Florida<br />
Farm products 2,939,428 1,017,747 140,129<br />
Nonmetallic minerals<br />
except fuels 39,087,889 3,490,283 2,385,820<br />
Food and kindred<br />
products 5,694,495 1,030,3a7 491,279<br />
Lumber and wood<br />
products, except<br />
furniture 7,507,033 363,352 604,836<br />
Pulp and paper 2,867,112 236,302 449,937<br />
Chemicals 9,223,175 285,892 1,137,419<br />
Petroleum and coal<br />
products 994,781 144,645 65,012<br />
Stone, clay and glass 7,509,719 632,246 678,010<br />
Primary metal<br />
products 898,833 138,365 209,221<br />
Transportation<br />
equipment 896,320 416,713 280,802<br />
Other 5,498,852 1,504,113 835,829<br />
Total 83,117,637 9,270,065 7,278,294<br />
Continued<br />
101
Table TRANS 29 . Concluded .<br />
Louisville St Louis and<br />
Product and Nashville San Francisco<br />
Farm products 66,778 2,235<br />
Nonmetallic minerals<br />
except fuels 962,413 70,392<br />
Food and kindred<br />
products 501,010 75,739<br />
Lumber and wood<br />
products, except<br />
furniture 1,600,191 333,796<br />
Pulp and paper 557,403 194,794<br />
Chemicals 1,692,333 66,103<br />
Petroleum and coal<br />
products 331,147 2,588<br />
Stone, clay and glass 760,410 115,811<br />
Primary metal<br />
products 162,339 2,273<br />
Transportation<br />
equipment 88,708 150<br />
Other 525,545 24,604<br />
Total 7,248,277 888,485<br />
102
Table TRANS 30 . Total revenue freight (tons) carried by Class I railroads in<br />
Florida in 1974 (Florida Department of Transportation 1980d) .<br />
Seaboard Florida Georgia Southern<br />
Product Coastline East Coast and Florida<br />
Farm products 2,463,305 862,867 177,362<br />
Nonmetallic minerals<br />
except fuels 40,469,885 3,400,209 1,944,734<br />
Food and kindred<br />
products 5,762,085 920,686 493,303<br />
Lumber and wood<br />
products, except<br />
furniture 7,090,011 298,771 657,552<br />
Pulp and paper 3,023,238 266,046 471,105<br />
Chemicals 9,108,853 275,967 1,018,354<br />
Petroleum and coal<br />
products 948,877 137,098 65,563<br />
Stone, clay and glass 6,584,252 481,364 637,009<br />
Primary metal<br />
products 889,566 166,108 244,518<br />
Transportation<br />
equipment 684,802 292,848 201,482<br />
Other 5,264,262 1,668,774 851,416<br />
Total 82,289,136 8,770,738 6,762,398<br />
Continued<br />
10 3
Table TRANS 30 . Concluded .<br />
Louisville St Louis and<br />
Product and Nashville San Francisco<br />
Farm products 94,037 5,121<br />
Nonmetallic minerals<br />
except fuels 1,051,743 107,099<br />
Food and kindred<br />
products 428,800 97,274<br />
Lumber and wood<br />
products, except<br />
furniture 1,336,189 341,171<br />
Pulp and paper 555,363 190,055<br />
Chemicals 1,825,336 61,777<br />
Petroleum and coal<br />
products 340,436 1,978<br />
Stone, clay and glass 669,809 90,744<br />
Primary metal<br />
products 93,887 5,157<br />
Transportation<br />
equipment 43,876 259<br />
Other 685,340 20,991<br />
Total 7,124,816 921,626<br />
104
Table TRANS 31 . Total revenue freight (tons) carried by Class I railroads in<br />
Florida in 1975 (Florida Department of Transportation 1980d) .<br />
Seaboard Florida Georgia Southern<br />
Product Coastline East Coast and Florida<br />
Farm products 2,424,261 932,433 99,579<br />
Nonmetallic minerals<br />
except fuels 37,677,254 2,976,362 1,788,623<br />
Food and kindred<br />
products 5,739,145 942,869 438,071<br />
Lumber and wood<br />
products, except<br />
furniture 5,694,154 214,553 501,521<br />
Pulp and paper 2,687,044 190,973 355,964<br />
Chemicals 9,303,433 262,422 980,650<br />
Petroleum and coal<br />
products 712,091 106,697 42,851<br />
Stone, clay and glass 5,023,249 347,449 431,441<br />
Primary metal<br />
products 607,513 108,154 184,033<br />
Transportation<br />
equipment 560,177 246,298 180,712<br />
Other 4,507,903 1,460,942 821,034<br />
Total 74,936,224 7,789,152 5,824,479<br />
Continued<br />
105
Table TRANS 31 . Concluded .<br />
Louisville St Louis and<br />
Product and Nashville San Francisco<br />
Farm products 130,857 2,031<br />
Nonmetallic minerals<br />
except fuels 692,175 69,370<br />
Food and kindred<br />
products 553,305 307,892<br />
Lumber and wood<br />
products, except<br />
furniture 953,176 292,984<br />
Pulp and paper 482,378 133,042<br />
Chemicals 1,798,288 33,507<br />
Petroleum and coal<br />
products 283,217 1,248<br />
Stone, clay and glass 468,882 47,941<br />
Primary metal<br />
products 50,057 4,152<br />
Transportation<br />
equipment 25,755 136<br />
Other 618,397 16,525<br />
Total 6,056,487 908,828<br />
106
Table TRANS 32 . Total revenue freight (tons) carried by Class I railroads in<br />
Florida in 1976 (Florida Department of Transportation 1980d) .<br />
Seaboard Florida Georgia Southern<br />
Product Coastline East Coast and Florida<br />
Farm products 1,918,738 592,242 148,693<br />
Nonmetallic minerals<br />
except fuels 36,406,858 3,188,098 1,683,402<br />
Food and kindred<br />
products 5,984,207 1,161,840 509,232<br />
Lumber and wood<br />
products, except<br />
furniture 6,229,994 223,977 ' 681,172<br />
Pulp and paper 3,010,416 226,603 524,188<br />
Chemicals 10,217,521 284,265 775,899<br />
Petroleum and coal<br />
products 799,830 124,282 45,632<br />
Stone, clay and glass 5,086,221 354,737 449,272<br />
Primary metal<br />
products 604,606 65,069 173,672<br />
Transportation<br />
equipment 688,445 317,762 224,100<br />
Other 4,666,240 1,635,876 828,880<br />
Total 75,619,076 8,174,751 6,004,142<br />
Continued<br />
107
Table TRANS 32 . Concluded .<br />
Louisville St Louis and<br />
Product and Nashville San Francisco<br />
Farm products 234,641 2,945<br />
Nonmetallic minerals<br />
except fuels 763,129 65,280<br />
Food and kindred<br />
products 747,465 427,465<br />
Lumber and wood<br />
products, except<br />
furniture 1,125,305 346,907<br />
Pulp and paper 519,993 155,133<br />
Chemicals 2,053,133 39,183<br />
Petroleum and coal<br />
products 213,434 893<br />
Stone, clay and glass 407,878 42,676<br />
Primary metal<br />
products 57,726 2,507<br />
Transportation<br />
equipment 29,098 165<br />
Other 843,663 24,463<br />
Total 6,999,465 1,108,108<br />
108
Table TRANS 33 . Location and identification of commercial and general aviation<br />
airports in 1979 (Florida Department of Transportation 1980a) .<br />
County Airport<br />
Bay Panama City-Bay County<br />
Escambia Coastal Fly Service<br />
Ferguson<br />
Pensacola Regional<br />
Franklin Carrabelle Flight Strip<br />
Apalachicola Municipal<br />
Gulf N .D .<br />
Okaloosa Bob Sikes<br />
Destin-Fort Walton Beach<br />
Eglin A .F .B .<br />
Santa Rosa Milton T . Field<br />
Fort Walton Beach<br />
Walton DeFuniak Springs<br />
Table TRANS 34 . Number of airports by type in 1980 (Florida Department of<br />
Transportation 1980a) .<br />
County Commercial General Aviation<br />
Bay 1 0<br />
Escambia 1 2<br />
Franklin 0 2<br />
Gulf 0 0<br />
Okaloosa 1 2<br />
Santa Rosa 0 2<br />
Walton 0 1<br />
Region 3 9<br />
109
Table TRANS 35 . Commercial airport passenger, cargo and mail in 1960, 1965,<br />
1970, 1975, 1978 and 1979 (Florida Department of Transportation 1980a) .<br />
Enplaned Total cargo Mail<br />
Year and county passengers (tons) (tons)<br />
1960<br />
Bay County<br />
Panama City-Bay County 13,369 25 .80 26 .00<br />
Escambia County<br />
Pensacola Regional 47,263 165 .70 147 .40<br />
Okaloosa County<br />
Eglin A .F .B . 11,798 43 .20 14 .30<br />
1965<br />
Bay County<br />
Panama City-Bay County 29,489 61 .94 84 .82<br />
Escambia County<br />
Pensacola Regional 86,671 181 .38 241 .63<br />
Okaloosa County<br />
Eglin A .F .B . 26,103 110 .39 38 .30<br />
1970<br />
Bay County<br />
Panama City-Bay County 42,793 162 .00 137 .00<br />
Escambia County<br />
Pensacola Regional' 159,682 722 .00 753 .00<br />
Okaloosa County<br />
Eglin A .F .B . 70,484 593 .00 111 .00<br />
Continued<br />
110
Table TRANS 35 . Concluded .<br />
Enplaned Total cargo Mail<br />
Year and county passengers (tons) . (tons)<br />
1975<br />
Bay County<br />
Panama City-Bay County 69,341 149 .87 46 .22<br />
Escambia County<br />
Pensacola Regional 180,341 413 .60 1,083 .51<br />
Okaloosa County<br />
Egl in A .F .B . 96,113 270 .22 79 .36<br />
1978<br />
Bay County<br />
Panama City-Bay County 82,118 140 .46 63 .66<br />
Escambia County<br />
Pensacola Regional 246,558 478 .70 855 .17<br />
Okaloosa County<br />
Eglin A .F .B . 116,738 300 .03 . 1 .10<br />
1979<br />
Bay County<br />
Panama City-Bay County 75,564 N .D . N .D .<br />
Escambia County<br />
Pensacola Regional 270,004 N .D . N .D .<br />
Okaloosa County<br />
Eglin A .F .B . 115,887 N .D . N .D .<br />
111
Table TRANS 36 . Total air carrier operationsa, first and second levelb, for<br />
Florida commercial airports for 1970, 1975 and 1980 (Federal Aviation<br />
Administration ca, 1971, ca . 1976, ca . 1981 ; Florida Department of<br />
Transportation 1981a) .<br />
Ye ar<br />
Airport 1970 1975 1980<br />
Pensacola 10,043 8,505 9,222<br />
Panama City 6,544 1,884 4,566<br />
Eglin 7,790 9,747c 6,330<br />
b Landings and take-offs .<br />
Includes international carriers (Pan Am, TWA, Eastern, National) . Data<br />
8oes not include commuter flights .<br />
1974 data .<br />
112
~<br />
w<br />
Table TRANS 37 . Commercial airport facility characteristics in 1980 (Florida Department of Transportation<br />
1981a) .<br />
Facility<br />
Panama City-<br />
Bay County<br />
Pensacola<br />
Regional<br />
Storage<br />
T-type hangars 15 20 0<br />
Storage<br />
conventional hangars 5 6 0<br />
Storage<br />
tie down positions 50 150 0<br />
Heliport base none none none<br />
Sea plane base none none none<br />
# jets based 0 0 0<br />
# total based aircraft 42 108 14<br />
# military local 1,047 16,446 45,000<br />
# military itinerant 3,393 3,492 45,000<br />
# air carrier 6,945 9,958 9,855<br />
# air taxi 3,063 1,930 2,000<br />
Eglin<br />
A .F .B .<br />
Total runways 4 4 4<br />
Runway # and lengths #04 4,800 ft #07 6,000 ft #01 10,000 ft<br />
#22 4,800 ft #25 6,000 ft #19 10,000 ft<br />
#14 6,000 ft #16 3,000 ft #12 12,000 ft<br />
#32 6,000 ft #34 3,000 ft #30 12,000 ft
~<br />
Table TRANS 38 . Commercial airport based aircraft history and projections for 1970, 1974, 1980, 1985 and 1990<br />
(Florida Department of Transportation 1976a) .<br />
Airport<br />
Panama City-Bay County<br />
Pensacola Regional<br />
Eglin A .F .B .<br />
Actual<br />
1970 197<br />
Forecast<br />
1980 1985 1990<br />
45 88 90 106 142<br />
73 98 110 171 245<br />
N .D. 4 4 4 4<br />
Table TRANS 39 . Commercial airport annual aircraft movements history and projections for 1970, 1974, 1980,<br />
1985 and 1990 (Florida Department of Transportation 1976a) .<br />
Airport<br />
Panama City-Bay County<br />
Pensacola Regional<br />
Eglin A .F .B .<br />
9<br />
Actual<br />
1980<br />
N .D . 80,800 122,100<br />
153,468 73,800 165,900<br />
N .D. N .D . 8,500<br />
Forecast<br />
176,700 247,600<br />
276,300 415,100<br />
8,400 8,400
~<br />
Table TRANS 40 . Commercial airports, air carrier enplanements, history and projections for 1960a, 1965, 1970,<br />
1974, 1980, 1985 and 1990 (Florida Department of Transportation 1976a) .<br />
Airport 1960 1965 1970 1974 1980 1985 1990<br />
Panama City-Bay County 13,369 29,489 47,760 74,046 137,1000 205,1000 288,200<br />
Pensacola Regional 47,263 86,671 165,580 187,239 400,000 650,000 1,000,000<br />
Eglin A .F .B . 11,798 26,102 69,700 96,616 172,700 261,600 372,300<br />
a No data prior to 1960 .
Table TRANS 41 . Florida road mileage as of 31 December 1971 (Florida<br />
Department of Transportation 1972) .<br />
Interstate Other state Total state<br />
County (mi) highway systems highway systems<br />
Bay 0 201,446 201,446<br />
Escambia 21,730 213,579 235,309<br />
Franklin 0 109,656 109,656<br />
Gulf 0 93,182 93,182<br />
Okaloosa 25,192 179,492 204,684<br />
Santa Rosa 25,916 222,483 248,399<br />
Walton 11,676 206,288 217,964<br />
Region 84,514 1,226,126 1,310,640<br />
Florida 850,726 11,035,696 12,157,775<br />
116
Table TRANS 42 . Florida road mileage as of 31 December 1975 (Florida<br />
Department of Transportation 1976b) .<br />
County<br />
Interstate<br />
(mi)<br />
Other state<br />
highway systems<br />
Total state<br />
highway systems<br />
Bay 0 207 .8 207 .8<br />
Escambi a 21 .7 194 .0 215 .7<br />
Frankl in 0 109 .7 109 .7<br />
Gu l f 0 93 .2 93 .2<br />
Okaloosa 25 .2 180 .2 205 .4<br />
Santa Rosa 25 .9 215 .7 241 .6<br />
Walton 27 .5 206 .3 233 .8<br />
Region 100 .3 1,206 .9 1,307 .2<br />
Florida 996 .3 10,774 .8 12,098 .6<br />
Other Total mi<br />
County (county and city maintained) in county<br />
Bay 1,100 .0 1,430 .7<br />
Escambi a 1,324 .1 1,539 .8<br />
Frankl in 278 .2 470 .2<br />
Gulf 262 .8 356 .0<br />
Okaloosa 1,216 .5 1,421 .9<br />
Santa Rosa 1,017 .2 1,412 .0<br />
Walton 963 .3 1,197 .1<br />
Region 6,162 .1 7,827 .7<br />
Florida 85,532 .4 100,351 .9<br />
117
Table TRANS 43 . Florida road mileage as of 31 December 1979 (Florida<br />
Department of Transportation 1980e) .<br />
Interstate Other state Total state<br />
County (mi) highway systems highway systems<br />
Bay 0 189 .6 189 .6<br />
Escambi a 21 .7 222 .2 243 .9<br />
Frankl in 0 87 .4 87 .4<br />
Gu l f 0 84 .4 84 .4<br />
Okaloosa 25 .2 171 .0 196 .2<br />
Santa Rosa 25 .9 177 .7 203 .6<br />
Wal ton 27 .5 196 .4 223 .9<br />
Region 100 .3 1,128 .7 1,229 .0<br />
Florida 1,125 .2 10,216 .8 11,669 .1<br />
Other Total mi<br />
County (county and city maintained) in county<br />
Bay 1,334 .8 1,524 .4<br />
Escambia 1,712 .1 1,956 .0<br />
Frankl in 372 .8 460 .2<br />
Gu 1 f 203 .9 288 .3<br />
Okaloosa 1,267 .0 1,463 .2<br />
Santa Rosa 1,340 .9 1,544 .5<br />
Walton 996 .1 1,220 .0<br />
Region 7,227 .6 8,456 .6<br />
Florida , 83,348 .7 95,017 .8<br />
118
Milton<br />
~---,•<br />
. ~. Oulnc .~ `<br />
~ T.Ilahassee • ~<br />
Pensacola Crawfordville<br />
Port St . Joe „ ,~ _ ~<br />
MAJOR NATURAL GAS PIPELINES<br />
Florida Gas Transmission Co .<br />
- --- South Georgia Natural Gas Co.<br />
--••-•• United Gas Pipe Line Co .<br />
PETROLEUM PRODUCTS LINES<br />
1 •• .•• . . . . . . .•• Tampa Pipeline Corp .<br />
2 . . . . . . . . . . . . . Central Florida Pipeline Corp .<br />
3 . . . . . . . . . . . . . . EverpladesPipeLinsCo .<br />
4 . • . .• . .• . .• National Transmission Corp .<br />
Gainesville •! -\ Platka<br />
Jacksonville<br />
~ IV<br />
t . Lauderdale<br />
Figure 6 . Pipelines in Florida (Florida Department of Transportation 1980b) .<br />
Tampa<br />
Ocala<br />
\<br />
Kissimmee<br />
Deland<br />
Clearwater Sartow<br />
119<br />
~ Sebriny<br />
• Sarasot .<br />
~ \<br />
•<br />
Sanford Titusville<br />
` West Palm<br />
Beach<br />
Miami
Table TRANS 44 . Total number of motor vehicle license tagsa sold for 1955,<br />
1960, 1965, 1970-71, 1975-76 and 1979-80 (Florida Department of Highway<br />
Safety and Motor Vehicles 1979, 1980) .<br />
1955 1960 1965 1970-71 1975-76 1979-80<br />
Bay 23,350 32,982 39,084 54,846 97,675 89,900<br />
Escambia 58,747 81,834 98,145 129,119 217,502 204,767<br />
Franklin 1,824 2,622 2,996 3,631 4,984 5,754<br />
Gulf 3,582 4,542 5,035 6,036 7,962 8,358<br />
Okaloosa 15,658 27,201 39,223 58,624 92,641 102,424<br />
Santa Rosa 8,385 13,099 17,456 23,723 41,737 45,568<br />
Walton 6,049 7,036 8,217 10,290 13,956 14,906<br />
Region 117,595 169,316 210,156 286,269 476,457 471,677<br />
Florida 1,800,969 2,703,881 3,439,211 4,875,493 8,218,658 10,180,656<br />
aIncludes passenger vehicles, buses, trucks, trailers, recreational vehicles,<br />
motor cycles and mobile homes .<br />
Table TRANS 45 . Florida pipeline volumes in tons per day and annually by<br />
Department of Transportation District for 1970, 1972, 1973 and 1974-75 (Florida<br />
Department of Transportation 1980c) .<br />
1970 1972 1973 1974 1975<br />
District I 3,443 3,440 3,439 3,225 2,829<br />
District II 2,408 2,068 1,745 1,902 1,589<br />
District III 6,301 3,396 3,130 3,101 2,625<br />
District IV 6,906 7,608 7,152 6,818 5,965<br />
District V 968 3,520 3,789 4,217 3,867<br />
Florida 20,026 20,032 19,255 19,263 24,856a<br />
Annual 7,309,490 7,311,680 7,028,075 7,031,105 9,072,440<br />
a Includes 7,981 tons per day delivered as exchange and transport and to<br />
compressor stations .<br />
120
Table TRANS 46 . Florida pipeline mileage in 1975 (Florida Department of<br />
Transportation 1980b) .<br />
Pipeline<br />
Natural gas lines :<br />
Total<br />
Florida Gas Transmission 2,482 .8<br />
Florida Gas (distribution) 2,212 .0<br />
South Georgia Natural Gas Co . 88 .1<br />
United Gas Pipe Line Co. 117 .0<br />
Petroleum products lines :<br />
mi<br />
4,899 .9<br />
Everglades Pipe Line Co. 35 .0<br />
National Transmission Corp. 23 .5<br />
Central Florida Pipeline Corp. 84 .6<br />
Tampa Pipeline 10 .6<br />
Total 153 .7<br />
Crude oil collector lines :<br />
Sunniland Pipeland Co. 200 .0<br />
Exxon Pipeline Co. (Jay) 30 .0<br />
South Florida Gathering Lines 75 .0<br />
Total 305 .0<br />
Grand Total 5,358 .6<br />
121
1•,<br />
Pen;<br />
Figure 7 . Florida highways (Florida Department of Transportation 1978b) .<br />
122<br />
West<br />
Palm<br />
Beach<br />
1-t95<br />
i-39s
~<br />
N<br />
W<br />
Table TRANS 47 . Roadway characteristics and volume range of average daily traffic in 1965 and 1977 ( Florida<br />
Department of Transportation, Division of Transportation Planning ca . 1981c, ca . 1981d) .<br />
Minimum Traffic volume ran e Capacity<br />
County Road Direction width 9 level C<br />
ft (meters)<br />
Bay SR-20 EW . 24 ( 7 .32) 1,300 to 1,300 500 to 2,700 9,400<br />
SR-77 NS . 24 ( 7 .32) 1,600 to 4,000 3,300 to 10,100 9,400<br />
SR-79 NS . 24 ( 7 .32) 700 to 1,100 1,300 to 2,000 9,400<br />
U .S . 98 EW . 22 ( 6 .71) 2,000 to 10,800 11,600 to 20,300 8,800<br />
U .S . 231 NS . 48 (14 .63) 1,500 to 4,000 3,200 to 12,100 29,200<br />
Escambia SR-97 NS . 20 ( 6 .10) 1,500 to 2,000 1,300 to 3,300 8 100<br />
U .S . 29 NS . 24 ( 7 .32) N .A . 5,600 to 37,900 9 400<br />
U .S . 90 EW . 24 ( 7 .32) 5,200 to 20,600 800 to 12,500 9,400<br />
U .S . 98 EW . 20 ( 6 .10) 2,400 to 12,700 6,200 to 28,900 8,100<br />
I-10 EW . 48 (14 .63) 900 to 3,100 10,200 to 13,200 29,200<br />
Franklin SR-65 NS . 18 ( 5 .49) 200 to 200 500 to 500 7,100<br />
SR-67 NS . 18 ( 5 .49) N .A . 500 to 500 7,100<br />
U .S . 98 EW . 20 ( 6 .10) 1,000 to 1,700 1,300 to 3,100 8,100<br />
U .S . 319 NS . 24 ( 7 .32) 400 to 400 700 to 700 9,400<br />
Gulf SR-22 EW . 20 ( 6 .10) 500 to 1,700 1,800 to 1,800 8,100<br />
SR-71 NS . 22 ( 6 .71) 1,300 to 1,300 1,600 to 3,000 8,800<br />
SR-386 EW . 18 ( 5 .49) 50 to 300 500 to 500 7,100<br />
U .S . 98 EW . 24 ( 7 .32) 900 to 6,000 2,300 to 7,100 9,400<br />
Okaloosa SR-4 EW . 20 ( 6 .10) 500 to 500 800 to 800 8,100<br />
SR-85 NS . 24 ( 7 .32) 1 500 to 4,000 2,200 to 7,000 9,400<br />
SR-285 NS . 18 ( 5 .49) 900 to 2,200 1,300 to 1,300 7,100<br />
U .S . 90 EW . 24 ( 7 .32) 4,100 to 6,500 1,300 to 7,000 9,400
~ N~<br />
Table TRANS 47 . Concluded .<br />
Minimum Traffic volume ran e Capacity<br />
County Road Direction width 9 T7 level C<br />
ft (meters)<br />
Okaloosa U .S . 98 EW . 24 ( 7 .32) 4,000 to 10,100 9,100 to 21,400 9,400<br />
I-10 EW . 48 (14 .63) N .A . 5,600 to 6,800 29,200<br />
Santa Rosa SR-4 EW . 20 ( 6 .10) 500 to 1,800 800 to 1,600 8,100<br />
SR-87 ES . 20 ( 6 .10) 900 to 5,900 1,500 to 6,700 8,100<br />
SR-89 NS . 20 ( 6 .10) 700 to 900 2,100 to 3,000 8,100<br />
U .S . 90 EW . 24 ( 7 .32) 4,000 to 11,800 3,300 to 19,000 9,400<br />
U .S . 98 EW . 48 (14 .63) 3 700 to 12,700 5,000 to 28,900 29,200<br />
I-10 EW . 48 (14 .63) N .A . 6,200 to 13,200 29,200<br />
Walton SR-2 EW . 20 ( 6 .10) 100 to 200 500 to 400 8,100<br />
SR-20 EW . 20 ( 6 .10) 3,000 to 4,400 1,300 to 1,700 8,100<br />
SR-81 NS . 24 ( 7 .32) 300 to 500 600 to 800 9,400<br />
SR-83 NS . 20 ( 6 .10) 300 to 1,900 500 to 5,100 8,100<br />
U .S . 90 EW . 24 ( 7 .32) 3,000 to 4,400 1,600 to 2,100 9,400<br />
U .S . 98 EW . 24 ( 7 .32) 2,200 to 2,700 3,700 to 5,100 9,400<br />
U .S . 331 NS . 24 ( 7 .32) 1,000 to 2,100 1,100 to 3,400 9,400<br />
I-10 EW . 48 (14 .63) N .A . 3,100 to 6,100 29,200
~<br />
N<br />
Ln<br />
Table TRANS 48 . Interstate natural gas pipeline statistics in 1972-79 (U .S . Federal Power Commission ca .<br />
1973d, ca . 1974d, ca . 1975d, ca . 1976c ; U .S . Department of Energy ca . 1978, ca . 1979, ca . 1980, ca . 1981) .<br />
Thousands ft3<br />
Total gas Total gas Total gas Mi of<br />
Year receipts sales deliveries transmission pipe<br />
Florida Gas Transmission Co .<br />
(FL, LA, TX, MS, AL)<br />
1972 270,492,577 129,051,889 270,498,878 4,258<br />
1973 278,792,091 119,597,895 278,533,177 4,267<br />
1974 260,933,617 113,741,953 260,872,810 4,266<br />
1975 221,090,454 89,701,528 220,498,943 4,266<br />
1976 222,077,746 83,870,423 222,376,033 4,267<br />
1977 304,576,292 111,838,105 304,175,948 4,274<br />
1978 325,830,621 133,648,528 325,551,497 4,279<br />
1979 330,992,810 167,483,076 333,353,372 4,286<br />
South Georgia Natural Gas Co .<br />
(AL, FL, GA)<br />
1972 26,564,543 26,264,664 26,443,883 769<br />
1973 26,870,344 26,346,142 26,546,942 769<br />
1974 27,017,390 26,688,104 26,850,936 769<br />
1975 26,416,536 26,251,415 26,358,846 769<br />
1976 23,417,633 23,358,396 23,407,068 770<br />
1977 23,086,383 22,923,689 22,970,749 769<br />
1978 26,034,367 26,011,046 26,097,197 649<br />
1979 34,527,474 34,477,576 34,691,545 767<br />
Continued
I--<br />
N<br />
rn<br />
Table TRANS 48 . Concluded .<br />
Thousands ft3<br />
Total gas ota gas Total gas M1 of<br />
Year receipts sales deliveries transmission pipe<br />
United Gas Pipeline Co .<br />
(AL, FL, LA, MS, TX)<br />
1972 1,619,737,415 1,206,494,644 1,626,340,487 7,308<br />
1973 1,578,117,222 1,075,134,897 1,588,667,615 7,308<br />
1974 1,423,021,563 958,252,704 1,421,077,322 7,339<br />
1975 1,443,210,078 873,133,887 1,436,922,889 7,309<br />
1976 1,440,613,038 824,831,820 1,430,264,088 5,784<br />
1977 1,546,132,684 837,201,098 1,536,942,255 7,247<br />
1978 1,566,555,814 823,576,366 1,559,374,027 7,267<br />
1979 1,880,152,581 934,856,538 1,869,313,722 7,287
~<br />
N<br />
v<br />
Table TRANS 49 . Miles of gas transmission pipe by diameter inches in 1979 (U .S . Department of Energy ca .<br />
1981) .<br />
Company 0-5 5 .1-10 10 .1-15 15 .1-20 20 .1-25 25 .1-30 over 30<br />
inches inches inches inches inches inches inches<br />
Florida Gas Transmission Co . 485 917 325 569 1,204 786 0<br />
South Georgia Natural<br />
Gas Co . 295 266 206 0 0 0 0<br />
United Gas Pipeline Co . 693 1,655 937 2,122 479 1,306 95
Table TRANS 50 . Average daily traffic at Department of Transportation permanent traffic recording stations<br />
(Florida Department of Transportation, Division of Transportation Planning ca . 1981c) .<br />
Station Location County 1965 1970<br />
21 U .S . 98, at<br />
Phillips Inlet Bay 2,685 3,480<br />
48 U .S . 90, at<br />
Perdido River Escambia 5,190 1,790<br />
51 SR-83, N . of<br />
DeFuniak Srings Walton 1,155 1,490<br />
53 U .S . 231, 3 mi S .<br />
of SR-20 Bay 2,645 3,745<br />
60 U .S . 98, 5 m i S .<br />
~ of U .S . 319 Frankl in 1,045 1,360<br />
0 82 U .S . 29, N . of U .S . 90 Escmbi a N .A . 14,530<br />
122 U .S . 90, 2 mi W .<br />
of SR-85 Okaloosa N .A . 6,320<br />
156 1-10, 1 .5 mi W .<br />
of U .S . 90 Escambia N .A . 5,352<br />
159 U .S . 29, N . of<br />
U .S . 90A Escambia N .A . N .A .<br />
Percent chan e<br />
1975 1980 9 5- 980<br />
4,365 3,610 -17 .3<br />
1,615 1,878 16 .3<br />
1,775 1,765 -0 .6<br />
N .A . 5,235 N .A .<br />
1,875 1,835 -2 .1<br />
13,685 9,724 -28 .9<br />
5,400 6,126 13 .4<br />
8,720 10,940 25 .5<br />
N .A . 17,745 N .A .
RECREATION AND TOURISM (R/T)<br />
129
~.LLLJJ<br />
Swamp forests, mostly hardwoods<br />
Mangrove swamp and coastal<br />
saltwater marshes<br />
Freshwater marshes<br />
~ Wet to dry Walrle marshes<br />
Figure 8 . Natural vegetation of Florida (Wood and Fernald 1974) .<br />
130
~<br />
w<br />
~<br />
Table R/T 1 . Average temperaturesa (OF) in 1955 (National Oceanic and Atmospheric Administration 1956) .<br />
County Jan . Feb . Mar . Apr . May June July Aug . Sept . Oct . Nov . Dec .<br />
Bay 53 .0 58 .0 65 .5 70 .5 76 .4 76 .7 80 .6 81 .8 79 .6 67 .2 58 .5 54 .3<br />
Esc amb i a 52 .5 57 .0 64 .3 70 .6 77 .2 78 .5 81 .6 82 .6 80 .9 68 .8 59 .0 55 .1<br />
Frank l i n 53 .3 56 .8 64 .1 70 .5 76 .6 77 .5 81 .1 82 .0 80 .2 69 .9 60 .6 54 .5<br />
Gulf N .D . N .D . N .D . N .D . N .D . N .D . N .D . N .D . N .D . N .D . N .D . N .D .<br />
Okaloosa N .D . N .D . N .D . N .D . N .D . N .D . N .D . N .D . N .D . N .D . N .D . N .D .<br />
Santa Rosa 51 .9 55 .8 64 .0 69 .3 75 .5 76 .1 80 .0 81 .5 78 .7 65 .8 58 .2 53 .9<br />
Wal ton 53 .1 57 .6 65 .6 71 .5 77 .3 78 .5 80 .4 82 .0 79 .3 68 .0 59 .2 53 .8<br />
a Figures were derived by averaging the temperatures recorded at all the reporting stations within each<br />
county .<br />
Table R/T 2 . Average temperaturesa (OF) in 1960 (National Oceanic and Atmospheric Administration 1961) .<br />
County Jan . Feb . Mar . Apr . May June July Aug . Sept . Oct . Nov . Dec .<br />
Bay 52 .3 52 .4 55 .4 68 .5 72 .3 79 .5 82 .0 80 .7 79 .1 72 .0 62 .7 55 .9<br />
E sc amb i a 50 .9 51 .2 54 .9 68 .2 71 .2 80 .9 83 .3 81 .4 78 .6 71 .5 61 .4 50 .7<br />
Frankl in 53 .3 52 .6 55 .2 68 .3 71 .7 79 .0 82 .0 81 .2 78 .8 73 .0 63 .2 50 .7<br />
Gu 1 f 53 .5 54 .0 56 .6 69 .6 72 .5 79 .6 82 .4 81 .1 79 .3 72 .4 63 .2 50 .9<br />
Okaloosa 50 .5 50 .0 53 .3 66 .9 70 .7 79 .4 82 .1 79 .7 77 .2 69 .7 60 .4 48 .5<br />
Santa Rosa 50 .1 50 .9 53 .8 67 .1 70 .8 78 .7 82 .4 79 .7 77 .2 69 .7 60 .2 49 .4<br />
Walton 51 .6 52 .2 55 .2 69 .6 73 .2 80 .5 83 .0 81 .2 79 .1 71 .6 61 .5 49 .8<br />
a Figures were derived by averaging the temperatures recorded at all the reporting stations within each<br />
county .
~<br />
w<br />
Table R/T 3 . Average temperaturesa (OF) in 1965 (National Oceanic and Atmospheric Administration 1966) .<br />
County Jan . Feb . Mar . Apr . May June July Aug . Sept . Oct . Nov . Dec .<br />
Bay 52 .7 54 .1 59 .2 71 .3 74 .6 77 .9 80 .2 80 .3 79 .4 68 .3 62 .5 53 .3<br />
Escambia 52 .6 52 .8 57 .4 70 .3 74 .7 78 .1 80 .8 80 .1 78 .5 68 .4 63 .1 53 .5<br />
Frank l i n 54 .0 54 .7 60 .1 70 .5 75 .6 77 .5 80 .8 81 .3 79 .2 70 .0 63 .6 54 .9<br />
Gu 1 f 53 .8 53 .8 60 .6 70 .1 75 .5 77 .5 81 .6 81 .5 79 .6 68 .5 62 .7 52 .8<br />
Okaloosa 49 .3 50 .8 57 .4 70 .5 73 .8 78 .2 80 .5 80 .5 77 .4 68 .5 52 .3 65 .9<br />
Santa Rosa 53 .2 53 _ .6 58 .4 70 .8 7 .3 77 .1 80 .0 79 .1 76 .9 67 .3 62 .7 52 .7<br />
Walton 51 .0 52 .1 58 .2 69 .6 72 .8 76 .1 78 .0 77 .8 76 .4 64 .8 60 .6 50 .9<br />
a Figures were derived by averaging the temperatures recorded at all the reporting stations within each<br />
county .<br />
N Table R/T 4 . Average temperaturesa (OF) in 1970 (National Oceanic and Atmospheric Administration 1971) .<br />
County Jan . Feb . Mar . Apr . May June July Aug . Sept . Oct . Nov . Dec .<br />
Bay 45 .9 50 .9 60 .2 70 .6 75 .0 79 .0 81 .8 81 .2 80 .4 71 .2 54 .2 56 .6<br />
Esc amb i a 46 .4 51 .3 59 .8 71 .1 76 .1 80 .6 83 .1 82 .2 82 .2 72 .1 57 .3 56 .7<br />
Franklin 47 .5 52 .1 60 .7 70 .8 76 .2 80 .3 82 .3 81 .6 81 .4 73 .6 57 .5 58 .0<br />
Gu l f 46 .2 51 .2 60 .0 71 .0 76 .3 78 .5 81 .1 81 .3 80 .8 71 .1 54 .9 56 .7<br />
Okaloosa 44 .8 50 .6 58 .0 69 .0 74 .3 78 .6 81 .0 81 .7 79 .8 69 .3 52 .4 55 .2<br />
Santa Rosa 45 .3 50 .0 58 .7 70 .2 73 .6 78 .2 81 .2 80 .8 79 .0 69 .1 54 .8 56 .4<br />
Wa1 ton N .D . 49 .7 58 .4 70 .0 73 .5 77 .1 80 .5 80 .4 78 .8 68 .8 53 .9 55 .1<br />
a Figures were derived by averaging the temperatures recorded at all the reporting stations within each<br />
county .
~<br />
w<br />
Table R/T 5 . Average temperaturesa (OF) in 1975 (National Oceanic and Atmospheric Administration 1976) .<br />
County Jan . Feb . Mar . Apr . May June July Aug . Sept . Oct . Nov . Dec .<br />
Bay 54 .8 58 .8 59 .8 65 .0 75 .5 79 .4 79 .2 80 .3 75 .4 69 .9 60 .5 51 .9<br />
Escambia 57 .3 60 .9 61 .6 67 .2 76 .9 81 .7 82 .1 82 .0 76 .1 70 .7 61 .4 52 .7<br />
Frankl in 57 .2 60 .2 61 .3 66 .5 76 .7 79 .9 79 .3 81 .1 76 .6 71 .8 61 .7 53 .5<br />
Gu 1 f 57 .0 60 .6 61 .1 66 .0 77 .1 80 .0 79 .8 81 .0 75 .5 70 .9 60 .8 52 .6<br />
Ok a l oo s a 53 .3 57 .4 59 .1 65 .1 76 .0 79 .2 79 .8 80 .5 74 .9 69 .1 59 .3 49 .3<br />
Santa Rosa 56 .8 61 .0 61 .9 66 .6 76 .6 79 .6 81 .0 81 .0 74 .8 69 .8 60 .5 51 .9<br />
Walton 55 .1 59 .1 59 .7 65 .3 76 .0 79 .0 79 .6 80 .2 73 .3 68 .6 59 .9 51 .5<br />
a Figures were derived by averaging the temperatures recorded at all the reporting stations within each<br />
county .<br />
Table R/T 6 . Average temperaturesa (OF) in 1980 (National Oceanic and Atmospheric Administration 1981) .<br />
County Jan . Feb . Mar . Apr . May June July Aug . Sept . Oct . Nov . Dec .<br />
Bay 53 .6 49 .7 59 .0 65 .0 73 .5 79 .0 83 .0 81 .8 80 .3 N .D . N .D . N .D<br />
Esc amb i a 55 .3 51 .1 60 .6 65 .6 75 .1 81 .2 85 .4 83 .7 81 .3 N .D . N .D . N .D<br />
Frankl i n 54 .3 51 .0 60 .8 65 .4 73 .5 78 .7 81 .9 81 .9 80 .4 N .D . N .D . N .D<br />
Gu 1 f 55 .7 51 .2 62 .6 66 .3 74 .5 79 .3 82 .3 81 .4 81 .2 N .D . N .D . N .D<br />
Okaloosa 53 .3 48 .6 59 .7 64 .0 74 .0 78 .7 83 .5 82 .2 80 .7 N .D . N .D . N .D<br />
Santa Rosa 54 .0 48 .6 59 .5 64 .4 74 .3 79 .7 83 .7 81 .9 81 .2 N .D . N .D . N .D .<br />
Wal ton 53 .3 49 .2 60 .4 64 .6 73 .9 78 .9 83 .2 81 .2 79 .7 N .D . N .D . N .D .<br />
a Figures were derived by averaging the temperatures recorded at all_the reporting stations within each<br />
county .
ALAtAMA<br />
® American Crocodile<br />
~ Florida Manatee<br />
~ Florida Everglades Kite<br />
Dusky Seaside Sparrow<br />
_ Pine Barrens Treetroq<br />
GEORGIA<br />
Figure 9 . Critical habitats in Florida (Florida Power and Light Co .-1979) .<br />
134<br />
S<br />
~ /<br />
N
~<br />
W<br />
Ln<br />
Table R/T 7 . Land area and elevation, and climate in 1980 (Florida Department of Commerce, Divi .sjqn<br />
of Economic Development, 1980b) .<br />
Land Average Average Average<br />
area annual summer winter<br />
County Elevation rainfall temperature temperature<br />
(mi2) (ft) (in) (0F) (0F)<br />
Bay 747 21 57 .86 81 .9° 53 .2°<br />
Escambia 665 20 58 .60 80 .9 53 .1<br />
Franklin 536 0-24 58 .36 81 .7 53 .7<br />
Gulf 565 15 58 .36 81 .7 53 .7<br />
Okaloosa 944 4-300 63 .70 80 .3 51 .4<br />
Santa Rosa 1,032 10 58 .85 80 .5 53 .8<br />
Walton 1,053 266-345 65 .70 80 .8 52 .8
ALARAMA GEORGIA fi<br />
k 1 F~i)Imes ' (f<br />
1 o N<br />
Ba y<br />
Madison<br />
l.r3vy<br />
{a. . ,.<br />
2 ,,<br />
23<br />
~ ,<br />
L• . . 24ii~<br />
K>, ; .<br />
. .<br />
~ll39'<br />
~ WILDLIFE MANAGEMENT AREA 1 Man;ii?p 40 O^^E^- Sz<br />
\ en.;-<br />
:<br />
. . .<br />
1 La Floreata Perdida 25 Cypress Llreek<br />
2 St . Regis<br />
3 Blackwater<br />
26 Osceola<br />
27 Lake Butler<br />
,.• :,<br />
, : .<br />
h.l .lrtfS<br />
4 Eglin<br />
5 Point Waahinyton<br />
28 Ralford Tract<br />
29 Nassau<br />
_.<br />
•<br />
_. _ . ~ ._ .<br />
qg<br />
_ _ 41<br />
6 Gaskin 30 Camp Blandlnp ~~<br />
' 42<br />
7 G.U. Parker 31 Guana River 1 4 ~<br />
8 Edward Bell 32 Hudson<br />
9 Apalachee 33 Lochlcosa %~zr ±~::-?r<br />
10 Robert Brent 34 Ocala<br />
11 Joe Budd 35 Relay Tract<br />
12 Ochlockonee River 36 Tomoka<br />
13 T.Iquln<br />
37 Farmton<br />
14 Apalachicola 38 Bull Creek ~<br />
15 Aucilla<br />
39 Three Lakes<br />
16 Tide Swamp 40 Avon Park<br />
~<br />
17 Steinhatchee<br />
18 Gulf Hammock<br />
41 J .W. Corbett<br />
42 Holey Land<br />
l<br />
o°<br />
19 Fort McCoy 43 Brown 's<br />
Farm * oar• ~~b '"'<br />
20 Citrus 44 Everglades<br />
21 Croom 45 Cecil Webb<br />
22 Richloam<br />
23 Green Swamp<br />
46<br />
47<br />
Lykes Brothers<br />
Rotenberger<br />
aes<br />
24 Hillaborouyh 48 Bly Cypress 0 1 `; 0-<br />
Figure 10 . State Wildlife Management Areas (Florida Power and Light Co . 1979) .<br />
136<br />
~<br />
n<br />
4'a
~ wV<br />
Table R/T8 . Demand, supply,and needs for selected outdoor recreation activities in Bay County in 1980,<br />
and projected for 1985 and 1q90 (fLori.da Department of fJatural Resources, Division of Recreation and<br />
Parks 1980d) .<br />
Recreational activity<br />
Saltwater beach activities<br />
Freshwater swimming (non-pool)<br />
Saltwater fishing (boat)<br />
Saltwater fishing (non-boat)<br />
Freshwater fishing (boat)<br />
Freshwater fishing (non-boat)<br />
Boat ramp use, saltwater<br />
Boat ramp uge, freshwater<br />
Camping, RV trailer<br />
Camping, tent<br />
Picnicking<br />
Horseback riding<br />
Nature study<br />
Hiking<br />
Canoeing<br />
Bicycle riding<br />
Visiting archaeological,<br />
historical sites<br />
Demand<br />
Resident and tourist user<br />
occasions (thousands)<br />
1980 198 1990<br />
Supply<br />
Resource User<br />
facilit units occasions -<br />
-1980 --- 9--~ 0<br />
4,239 .0 4,699 .6 5,172 .2 19,540 (lin ft) 7,819<br />
339 .0 377 .2 415 .2 0 (l i n ft ) 0<br />
572 .1 636 .1 700 .2 N .0 . N .D .<br />
671 .4 746 .7 822 .0 20,191 (1 i n ft ) 3 .365<br />
37 .3 43 .4 47 .9 N .D . N .D .<br />
64 .5 72 .7 80 .0 700 (1in ft) 117<br />
236 .5 264 .2 290 .9 32 ( l anes ) 5,128<br />
22 .6 26 .3 29 .0 16 ( l anes ) 2,560<br />
496 .5 548 .2 603 .1 2,274 (sites) 9,096<br />
13 .8 16 .1 17 .1 228 (sites) 912<br />
384 .1 427 .2 470 .3 212 (tables) 1,696<br />
5 .6 6 .6 7 .3 0 (mi) 0<br />
59 .2 69 .0 76 .2 3 .3 ( m i) 825<br />
204 .9 231 .1 254 .6 1 .2 (mi ) 150<br />
28 .5 33 .2 36 .7 15 .0 ( m i) 0<br />
215 .9 250 .2 276 .1 0 (mi) 0<br />
15 .4 17 .9 19 .7 3 (sites) 1,261<br />
Continued
Table R/T 8 . Continued .<br />
Demand Supply<br />
Resident and tourist user Resource User<br />
occasions (thous ands) facilit units occasions<br />
Recreational activity -Tw 1985 1990<br />
Hunting 75 .0 86 .8 95 .8 152,279 (acres) 2,740,803<br />
Golf 117 .8 132 .2 145 .6 201 (holes) 5,629<br />
Tennis 153 .9 175 .4 193 .4 43 (courts) 946<br />
Baseball, softball 43 .9 51 .1 56 .4 39 (fields) 3,628<br />
Football, soccer, rugby 14 .7 17 .2 18 .9 5 (fields) 560<br />
Outdoor racquetball, handball 2 .5 2 .9 3 .2 0 (courts) 0<br />
Outdoor basketball 38 .2 44 .5 49 .2 14 (goals) 504<br />
Outdoor swimming pool use 1,351 .8 1,494 .0 1,643 .9 10 (pools) 2,953<br />
W Outdoor shuffleboard 174 .8 192 .3 211 .5 10 (courts) 160<br />
co<br />
Continued
~<br />
w<br />
ko<br />
Table R/T 8 . Continued .<br />
Recreational activity<br />
Need s<br />
User occasions<br />
9 9<br />
Saltwater beach activities 13,188 15,470 17,812<br />
Freshwater swimming (non-pool) 1,680 1,869 2,058<br />
Saltwater fishing (boat) N .D . N .D. N .D .<br />
Saltwater fishing (non-boat) 0 335 708<br />
Freshwater fishing (boat) N .D . N .D. N .D .<br />
Freshwater fishing (non-boat) 203 243 280<br />
Boat ramp use, saltwater 0 0 0<br />
Boat ramp use, freshwater 0 0 0<br />
Camping, RV trailer 0 0 0<br />
Camping, tent 0 0 0<br />
Picnicking 207 421 634<br />
Horseback riding 28 33 36<br />
Nature study 0 0 0<br />
Hiking 865 995 1,112<br />
Canoeing N .D . N .D. N .D .<br />
Bicycle ridinq 1,070 1,240 1,368<br />
Visiting archaeological,<br />
historical sites 0 0 0<br />
Continued
~ ~<br />
0<br />
Table R/T 8 . Concluded .<br />
Recreational activity<br />
Nee s<br />
User occasions<br />
Hunting 0 0 0<br />
Golf 0 0 0<br />
Tennis 0 0 0<br />
Baseball, softball 0 0 0<br />
Football, soccer, rugby 0 0 0<br />
Outdoor racquetball, handball 12 15 16<br />
Outdoor basketball 0 0 0<br />
Outdoor swimming pool use 2,746 3,450 4,193<br />
Outdoor shuffleboard 706 793 888<br />
a Recreational vehicle .
~<br />
~<br />
Table RT/ 9 . Demand, supply and needs for selected outdoor recreation activities in Escambia County in<br />
1980, and projected for 1985 and 1990 (Florida Department of Natural Resources, Division of Recreation<br />
and Parks 1980d) .<br />
Recreational activity<br />
Saltwater beach activities<br />
Freshwater swimming (non-pool)<br />
Saltwater fishing (boat)<br />
Saltwater fishing (non-boat)<br />
Freshwater fishing (boat)<br />
Freshwater fishing (non-boat)<br />
Boat ramp use, saltwater<br />
Boat ramp uge, freshwater<br />
Camping, RV trailer<br />
Camping, tent<br />
Picnicking<br />
Horseback riding<br />
Nature study<br />
Hiking<br />
Canoeing<br />
Bicycle riding<br />
Visiting archaeological,<br />
historical sites<br />
Demand<br />
Resident and tourist user<br />
occasions (thousands)<br />
1980 1985 1990<br />
Supply<br />
Resource User<br />
facilit units occasions<br />
1980 1980<br />
1,142 .5 1,249 .3 1,376 .3 173,585 (lin ft) 69,434<br />
102 .4 111 .0 122 .5 355 (lin ft) 142<br />
165 .4 179 .2 197 .9 N .D . N .D .<br />
93 .4 101 .2 111 .8 184,704 (lin ft) 30,784<br />
65 .7 71 .2 78 .6 N .D . N .D .<br />
31 .1 33 .7 37 .3 8,326 (lin ft) 1,388<br />
142 .5 155 .7 171 .7 15 ( l anes) 2,400<br />
35 .3 38 .2 42 .2 6 (1 anes ) 960<br />
298 .0 327 .3 360 .2 479 (sites) 1,916<br />
15 .2 16 .5 18 .2 543 (sites) 2,172<br />
749 .1 822 .2 904 .9 226 (tables) 1,808<br />
11 .1 12 .0 13 .2 1,010 .0 (mi ) 80,800<br />
168 .2 184 .0 202 .7 15 .5 (mi ) 3,875<br />
208,0 228 .0 251 .1 101 .0 (mi ) 12,625<br />
16 .6 18 .0 19 .9 47 .0 (mi ) 0<br />
315 .6 341 .9 377 .5 1 .5 (mi ) 392<br />
911 .4 1,000 .8 1,101 .4 3 (sites) 1,261<br />
Continued
Table R/T 9 . Continued .<br />
Demand Supply<br />
Resident and tourist user Resource User<br />
occasions (thousands) facilit units occasions<br />
Recreational activity 1980 1985 1990 1980 80<br />
Hunting 200 .0 214 .8 237 .2 51,131 (acres) 920,284<br />
Golf 65 .7 71 .2 78 .6 227 (holes) 6,357<br />
Tennis 146 .0 158 .2 174 .7 70 (courts) 1,540<br />
Baseball, softball 130 .8 141 .7 156 .5 59 (fields) 5,488<br />
Football, soccer, rugby 78 .9 85 .5 94 .4 9 (fields) 1,008<br />
Outdoor racquetball, handball 22 .1 24 .0 26 .5 2 (courts) 64<br />
Outdoor basketball 141 .2 152 .9 168 .9 67 (goals) 2,412<br />
~ Outdoor swiming pool use 99 .7 108 .0 119 .2 7 (pools) 2,767<br />
N Outdoor shuffleboard 0 .0 0 .0 0 .0 2 (courts) 32<br />
Continued
~<br />
w<br />
Table R/T 9 . Continued .<br />
Recreational activity<br />
Needs<br />
User occasions<br />
1980 1985 1990<br />
Saltwater beach activities 0 0 0<br />
Freshwater swimming (non-pool) 366 408 465<br />
Saltwater fishing (boat) N .D . N .D. N .D .<br />
Saltwater fishing (non-boat) 0 0 0<br />
Freshwater fishing (boat) 0 0 0<br />
Freshwater fishing (non-boat) 0 0 0<br />
Boat ramp use, saltwater 0 0 0<br />
Boat ramp use, freshwater 0 0 0<br />
Camping, RV trailer 0 0 0<br />
Camping, tent 0 0 0<br />
Picnicking 1,904 2,266 2,676<br />
Horseback riding 0 0 0<br />
Nature study 0 0 0<br />
Hiking 0 0 0<br />
Canoeina N .D . N .D. N .D .<br />
Bicycle riding 1,172 1,302 1,479<br />
Visiting archaeological,<br />
historical sites 3,256 3,698 4,197<br />
Continued
~<br />
.~<br />
Table R/T 9 Concluded .<br />
Needs<br />
User occasions<br />
1980 1985 1990<br />
Hunting 0 0 0<br />
Golf 0 0 0<br />
Tennis 0 0 0<br />
Baseball, softball 0 0 0<br />
Football, soccer, rugby 0 0 0<br />
Outdoor racquetball, handball 46 55 67<br />
Outdoor basketball 0 0 0<br />
Outdoor swimning pool use 0 0 0<br />
Outdoor shuffleboard 0 0 0<br />
a Recreational vehicle .
Table R/T 10 . Demand, supply and needs for selected outdoor recreation activities in Franklin County in<br />
1980, and projected for 1985 and 1990 (Florida Department of Natural Resources, Division of Recreation<br />
and Parks 1980d) .<br />
Demand Supply<br />
Resident and tourist user Resource User<br />
occasions (thousands) facilit units occasions<br />
Recreational activity 98 1990 1980 1980<br />
Saltwater beach activities<br />
Freshwater swimming (non-pool_)<br />
Saltwater fishing (boat)<br />
Saltwater fishing (non-boat)<br />
Freshwater fishing (boat)<br />
Freshwater fishing (non-boat)<br />
4' Boat ramp use, saltwater<br />
"' Boat ramp uie, freshwater<br />
Camping, RV trailer<br />
Camping, tent<br />
Picnicking<br />
Horseback riding<br />
Nature study<br />
Hiking<br />
Canoeing<br />
Bicycle riding<br />
Visiting archaeological,<br />
historical sites<br />
61 .5 68 .6 75 .8 156,015 ( l i n f t) 62,406<br />
2 .0 2 .2 2 .4 5 (lin ft) 2<br />
25 .0 27 .9 30 .8 N .D . N .D .<br />
15 .9 17 .9 19 .8 479,471 (lin ft) 79,912<br />
7 .9 8 .7 9 .6 N .D . N .D .<br />
2 .5 2 .8 3 .1 205 ( l i n f t) 34<br />
20 .8 23 .2 26 .7 9 (l anes ) 1,440<br />
6 .2 6 .8 7 .6 11 (lanes) 1,760<br />
5 .4 6 .0 6 .6 626 (sites) 2,504<br />
1 .0 1 .1 1 .2 9 (sites) 36<br />
10 .3 11 .4 12 .6 62 (tables) 496<br />
0 .3 0 .3 0 .4 0 (mi) 0<br />
4 .3 4 .7 5 .2 85 .0 (mi ) 21,250<br />
1 .5 1 .7 1 .8 0 (mi) 0<br />
0 .1 0 .1 0 .1 10 .0 (mi) 0<br />
10 .8 12 .1 13 .4 0 (mi) 0<br />
0 .4 0 .5 0 .5 4 (sites) 1,681<br />
Continued
~<br />
Table R/T 10 . Continued .<br />
Recreational activity<br />
Saltwater beach activities<br />
Freshwater swimming (non-pool)<br />
Saltwater fishing (boat)<br />
Saltwater fishing (non-boat)<br />
Freshwater fishing (boat)<br />
Freshwater fishing (non-boat)<br />
Boat ramp use, saltwater<br />
Boat ramp use, freshwater<br />
Camping, RV trailer<br />
Camping, tent<br />
Picnicking<br />
Horseback riding<br />
Nature study<br />
Hiking<br />
Canoeinq<br />
Bicycle ridinq<br />
Visiting archaeological,<br />
historical sites<br />
Needs<br />
User occasions<br />
1980 1985<br />
Continued<br />
0 0 0<br />
8 9 10<br />
N .D . N .D. N .D .<br />
0 0 0<br />
N .D . N .D. N .D .<br />
0 0 0<br />
0 0 0<br />
0 0 0<br />
0 0 0<br />
0 0 0<br />
0 0 0<br />
1 2 2<br />
0 0 0<br />
7 8 9<br />
N .D . N .D. N .D .<br />
53 60 66<br />
0 0 0
I.-<br />
.A<br />
~<br />
Table R/T 10 . Concluded .<br />
Demand<br />
Resident and tourist user<br />
occasions ( thousands)<br />
Recreational activity 1980 1985 1990<br />
Supply<br />
Resource User<br />
facilit units occasions<br />
1980 1980<br />
Hunting 40 .6 45 .3 50 .2 42,667 (acres) 767,945<br />
Golf 11 .6 13 .0 14 .3 9 (holes) 252<br />
Tennis 1 .1 1 .3 1 .4 2 (courts) 44<br />
Baseball, softball 2 .0 2 .3 2 .5 2 (fields) 186<br />
Football, soccer, rugby 0 .1 0 .1 0 .1 4 (fields) 448<br />
Outdoor racquetball, handball 0 .0 0 .0 0 .0 0 (courts) 0<br />
Outdoor basketball 0 .6 0 .6 0 .7 0 (goals) 0<br />
Outdoor swimming pool use 0 .9 1 .0 1 .1 4 (pools) 1 , 581<br />
Outdoor shuffleboard 0 .0 0 .0 0 .0 0 (courts) 0<br />
Recreational activity<br />
Needs<br />
User occasions<br />
1980 1985<br />
Huntinq 0 0 0<br />
Golf 0 0 0<br />
Tennis 0 0 0<br />
Baseball, softball 0 0 0<br />
Football, soccer, rugby 0 0 0<br />
Outdoor racquetball, handball 0 0 0<br />
Outdoor basketball 3 3 4<br />
Outdoor swimming pool use 0 0 0<br />
Outdoor shuffleboard 0 0 0<br />
a Recreational vehicle .
~<br />
CO<br />
Table R/T 11 . Demand, supply~and needs for selected outdoor recreation activities in Gulf County in<br />
1980, and projected for 1985 and 1990 (Florida Department of Natural Resources, Division of Recreation<br />
and Parks 1980d) .<br />
Recreational activity<br />
Saltwater beach activities<br />
Freshwater swimming (non-pool)<br />
Saltwater fishing (boat)<br />
Saltwater fishing (non-boat)<br />
Freshwater fishing (boat)<br />
Freshwater fishing (non-boat)<br />
Boat ramp use, saltwater<br />
Boat ramp uae, freshwater<br />
Camping, RV trailer<br />
Camping, tent<br />
Picnicking<br />
Horseback riding<br />
Nature study<br />
Hiking<br />
Canoeing<br />
Bicycle riding<br />
Visiting archaeological,<br />
historical sites<br />
Demand<br />
Resident and tourist user<br />
occasions (thousands)<br />
1980 1985 1990<br />
Supply<br />
Resource User<br />
facilit units occasions<br />
1980 1980<br />
50 .9 54 .2 59 .7 48,580 (lin ft) 19,432<br />
2 .5 2 .6 2 .9 0 (lin ft) 0<br />
15 .1 16 .1 17 .8 N .D . N .D .<br />
28 .0 29 .8 33 .8 45,581 (lin ft) 8,097<br />
29 .6 31 .5 34 .7 N .D . N .D .<br />
16 .5 17 .6 18 .4 0 (lin ft) 0<br />
5 .2 5 .5 6 .1 6 (1 anes ) 960<br />
17 .7 18 .8 20 .8 24 (lanes) 3,840<br />
3 .2 3 .4 3 .7 68 (sites) 272<br />
8 .1 8 .6 9 .4 149 (sites) 596<br />
15 .9 16 .9 18 .6 71 (tables) 568<br />
0 .4 0 .4 0 .5 0 (mi) 0<br />
7 .3 7 .8 8 .6 2 .5 (mi ) 625<br />
6 .6 7 .0 7 .8 7 .0 (mi ) 875<br />
3 .3 3 .6 3 .9 0 (mi) 0<br />
14 .0 14 .9 16 .5 0 (mi ) 0<br />
0 .6 0 .7 0 .7 .0 (sites) 0<br />
Continued
~<br />
ko<br />
Table R/T 11 . Continued .<br />
Recreational activity<br />
Saltwater beach activities<br />
Freshwater swimming (non-pool)<br />
Saltwater fishing (boat)<br />
Saltwater fishing (non-boat)<br />
Freshwater fishing (boat)<br />
Freshwater fishing (non-boat)<br />
Boat ramp use, saltwater<br />
Boat ramp use, freshwater<br />
Camping, RV trailer<br />
Camping, tent<br />
Picnicking<br />
Horseback riding<br />
Nature study<br />
Hiking<br />
Canoeing<br />
Bicycle riding<br />
Visiting archaeological,<br />
historical sites<br />
9<br />
Continued<br />
Needs<br />
User occasions<br />
0 0 0<br />
12 13 14<br />
N .D . N .D. N .D .<br />
0 0 0<br />
N .D . N .D. N .D .<br />
82 87 96<br />
0 0 0<br />
0 0 0<br />
0 0 0<br />
0 0 0<br />
0 0 0<br />
2 2 2<br />
0 0 0<br />
0 0 0<br />
N .D . N .D. N .D .<br />
70 74 82<br />
3 3 4
~<br />
0<br />
Table R/T 11 . Concluded .<br />
Demand Supply<br />
Resident and tourist user Resource User<br />
occasions (thousands) facilit units occasions<br />
Recreational activity 1980 1990 --]?S8U<br />
Hunting 71 .0 75 .4 83 .1 93,555 (acres) 1,683,855<br />
Golf 6 .5 6 .9 7 .6 27 (holes) 756<br />
Tennis 2 .3 2 .5 2 .7 8 (courts) 176<br />
Baseball, softball 6 .7 7 .1 7 .9 11 (fields) 1,023<br />
Football, soccer, rugby 0 .3 0 .3 0 .4 0 (fields) 0<br />
Outdoor racquetball, handball 0 0 0 0 0 0 0 (courts) 0<br />
Outdoor basketball 2 .4 2 .5 2 .8 0 (goals) 0<br />
Outdoor swimming pool use 0 .4 0 .4 0 .5 1 (pools) 395<br />
Outdoor shuffleboard 0 0 0 0 0 0 0 (courts) 0<br />
Recreational activity<br />
Needs<br />
User occasions<br />
1980 1985<br />
Huntinq 0 0 0<br />
Golf 0 0 0<br />
Tennis 0 0 0<br />
Baseball, softball 0 0 0<br />
Football, soccer, rugby 2 2 2<br />
Outdoor racquetball, handball 0 0 0<br />
Outdoor basketball 12 13 14<br />
Outdoor swimming pool use 0 0 0<br />
Outdoor shuffleboard 0 0 0<br />
a Recreational vehicle .
I--<br />
~<br />
Table R/T 12 . Demand, supply and needs for selected outdoor recreation activities in Okaloosa County in<br />
1980, and projected for 1985 and 1990 (Florida Department of Natural Resources, Division of Recreation<br />
and Parks 1980d) .<br />
Demand Supply<br />
Resident and tour ist user Resource User<br />
occasions (thou sands) facilit units occasions<br />
Recreational activity 1980 19~-3~39F 1980 1980<br />
Saltwater beach activities 1,550 .8 1,719 .7 1,892 .9 9,605 (lin ft) 3,842<br />
Freshwater swimming (non-pool) 178 .5 200 .3 220 .6 0 (1in ft) 0<br />
Saltwater fishing (boat) 80 .0 89 .5 98 .5 N .D . N .D .<br />
Saltwater fishing (non-boat) 434 .3 482 .3 530 .9 340,085 (lin ft) 56,681<br />
Freshwater fishing (boat) 44 .4 51 .1 56 .3 N .D . N .D .<br />
Freshwater fishing (non-boat) 127 .4 146 .3 161 .5 6,540 (lin ft) 1,090<br />
Boat ramp use, saltwater 45 .8 52 .6 58 .0 19 (lanes) 3,040<br />
Boat ramp uie, freshwater 35 .8 41 .2 45 .4 54 (lanes) 8,640<br />
Camping, RV trailer 304 .6 335 .7 369 .3 793 (sites) 3,172<br />
Camp i ng , tent 155 .6 171 .6 188 .8 133 ( s i tes ) 532<br />
Picnicking 869 .9 960 .0 1,056 .3 598 (tables) 4,784<br />
Horseback riding 1 .3 1 .5 1 .7 0 (mi) 0<br />
Nature study 54 .9 61 .9 68 .2 4 .8 (mi ) 1,200<br />
Hiking 164 .4 182 .9 201 .4 21 .0 (mi) 2,625<br />
Canoeing 47 .8 54 .9 60 .5 192 .2 (mi ) 0<br />
Bicycle riding 408 .0 459 .3 506 .0 0 (mi ) 0<br />
Visiting archaeological,<br />
histor-ical 'site"s 19 .9 22 .9 25 .2 4 (sites) 1,681<br />
Continued
~<br />
cn<br />
N<br />
Table R/T 12 . Continued .<br />
Recreational activity<br />
Needs<br />
User occasions<br />
1980 1985 9<br />
Saltwater beach activities 3,842 4,679 5,537<br />
Freshwater swimming (non-pool) 884 992 1,093<br />
Saltwater fishing (boat) N .D . N .D. N .D .<br />
Saltwater fishing (non-boat) 0 0 0<br />
Freshwater fishing (boat) N .D . N .D. N .D .<br />
Freshwater fishing (non-boat) 0 0 0<br />
Boat ramp use, saltwater 0 0 0<br />
Boat ramp uRe, freshwater 0 0 0<br />
Camping, RV trailer 0 0 0<br />
Camping, tent 239 319 404<br />
Picnicking 0 0 450<br />
Horseback riding 7 8 8<br />
Nature study 0 0 0<br />
Hiking 0 0 0<br />
Canoeing N .D . N .D. N .D .<br />
Bicycle ridjnn, 2,022 2,276 2,507<br />
Visiting archaeological,<br />
. historical sites 0 0 0<br />
Continued
Table R/T 12 . Concluded .<br />
Recreational activity<br />
Demand<br />
Resident and tourist user<br />
occasions (thousands)<br />
-1 0 '-1985 -390<br />
Supply<br />
Resource User<br />
facilit units occasions<br />
T9W-<br />
Hunting 141 .5 162 .1 178 .9 237,668 (acres) 4,277,682<br />
Golf 143 .3 164 .6 181 .6 243 (holes) 6,805<br />
Tennis 326 .1 362 .8 399 .4 698(-courts) 1,518<br />
Baseball, softball 82 .2 94 .5 104 .3 36 (fields) 3,349<br />
Football, soccer, rugby 46 .4 53 .3 58 .9 7 (fields) 784<br />
Outdoor racquetball, handball 0 .0 0 .0 0 .0 3 (courts) 96<br />
Outdoor basketball 274 .6 304 .7 335 .4 30 (goals) 1,080<br />
Outdoor swimmina pool use 716 .2 79 .40 875 .6 10 (pools) 3,953<br />
Outdoor shuffleboard 48 .8 53 .7 59 .0 6 (courts) 96<br />
~<br />
w Needs<br />
Recreational activity<br />
User occasions<br />
1980 1985<br />
Hunting 0 0 0<br />
Golf 0 0 0<br />
Tennis 98 279 461<br />
Baseball, softball 0 0 0<br />
Football, soccer, rugby 0 0 0<br />
Outdoor racquetball, handball 0 0 0<br />
Outdoor basketball 281 430 582<br />
Outdoor swiming pool use 0 0 386<br />
Outdoor shuffleboard 146 170 197<br />
a Recreational vehicle .
I-,<br />
Ln<br />
-P.<br />
Table R/T 13 . Demand, supply and needs for selected outdoor recreation activities in Walton County in<br />
1980, and projected for 1985 and 1990 (Florida Department of Natural Resources, Division of Recreation<br />
and Parks 1980d) .<br />
Recreational activity<br />
Saltwater beach activities<br />
Freshwater swimmin (non-pool)<br />
Saltwater fishing ?boat)<br />
Saltwater fishing (non-boat)<br />
Freshwater fishing (boat)<br />
Freshwater fishing (non-boat)<br />
Boat ramp use, saltwater<br />
Boat ramp uge, freshwater<br />
Camping, RV trailer<br />
Camping, tent<br />
Picnicking<br />
Horseback riding<br />
Nature study<br />
Hiking<br />
Canoeing<br />
Bicycle riding<br />
Visiting archaeological,<br />
historical sites<br />
Demand<br />
Resident and tourist user<br />
occasions (thousands)<br />
1980 98 990<br />
Supply<br />
Resource User<br />
facilit units occasions<br />
1980 9~ 80<br />
62 .4 69 .7 76 .9 6,105 (lin ft) 2,442<br />
22 .9 25 .5 28 .2 10 ( l i n ft ) 4<br />
15 .7 17 .5 19 .3 N .D . N .D .<br />
12 .9 14 .4 15 .9 6,105 (lin ft) 1,018<br />
35 .1 39 .1 43 .1 N .D . N .D .<br />
26 .5 29 .6 32 .7 15,870 ( l in ft) 2,645<br />
8 .1 9 .0 10 .0 8 (lanes) 1,280<br />
19 .3 21 .4 23 .6 23 ( l anes ) 3,680<br />
10 .5 11 .6 12 .7 548 (sites) 2,192<br />
1 .9 2 .1 2 .3 40. (sites) 160<br />
17 .4 19 .4 21 .4 148 (tables) 1,184<br />
5 .8 6 .5 7 .1 .1 (mi ) 8<br />
4 .1 4 .6 5 .1 .8 (mi ) 200<br />
13 .9 15 .6 17 .2 .4 (mi ) 50<br />
0 .0 0 .0 0 .0 7 .0 (mi ) 0<br />
20 .7 23 .1 25 .5 0 (mi) 0<br />
1 .5 1 .7 1 .8 0 (sites) 0<br />
Continued
I.cn<br />
Ln<br />
Table R/T 13 . Continued .<br />
Recreational activity<br />
Saltwater beach activities<br />
Freshwater swimming (non-pool)<br />
Saltwater fishing (boat)<br />
Saltwater fishing (non-boat)<br />
Freshwater fishing (boat)<br />
Freshwater fishing (non-boat)<br />
Boat ramp use, saltwater<br />
Boat ramp use, freshwater<br />
Camping, RV trailer<br />
Camping, tent<br />
Picnicking<br />
Horseback riding<br />
Nature study<br />
Hiking<br />
Canoeing<br />
Bicycle riding<br />
Visiting archaeological,<br />
historical sites<br />
Continued<br />
Need s<br />
User occasions<br />
9 0<br />
0 0 0<br />
110 123 136<br />
N .D . N .D. N .D .<br />
0 0 0<br />
N .D . N .D. N .D .<br />
0 0 0<br />
0 0 0<br />
0 0 0<br />
0 0 0<br />
0 0 0<br />
0 0 0<br />
21 24 27<br />
0 0 0<br />
19 27 35<br />
N .D . N .D. N .D .<br />
103 115 127<br />
7 8 9
~<br />
Table R/T 13 . Concluded .<br />
Recre.ational activity<br />
Demand<br />
Resident and tourist user<br />
occasions (thousands)<br />
1980 1985 1990<br />
Supply<br />
Resource User<br />
facilit units occasions<br />
1980 1990<br />
Hunting 147 .1 164 .5 181 .5 161,840 (acres) 2,912,887<br />
Golf 8 .1 9 .0 10 .0 18 (holes) 504<br />
Tennis 5 .7 6 .4 7 .0 5 (courts) 110<br />
Baseball, softball 11 .3 12 .6 13 .9 2 (fields) 186<br />
Football, soccer, rugby 2 .4 2 .7 3 .0 0 (fields) 0<br />
Outdoor racquetball, handball 0 .0 0 .0 0 .0 0 (courts) 0<br />
Outdoor basketball 5 .3 5 .9 6 .5 0 (goals) 0<br />
Outdoor swimming pool use 3 .9 4 .3 4 .8 7 (pools) 2,767<br />
Outdoor shuff 1 eboard 0 .0 0 .0 0 .0 3 (courts ) 48<br />
Recreational activity<br />
Needs<br />
User occasions<br />
1980 1985 1990<br />
Hunting 0 0 0<br />
Golf 0 0 0<br />
Tennis 0 0 0<br />
Baseball, softball 0 0 0<br />
Football, soccer, rugby 12 13 15<br />
Outdoor racquetball, handball 0 0 0<br />
Outdoor basketball 26 29 32<br />
Outdoor swirrming pool use 0 0 0<br />
Outdoor shuffleboard 0 0 0<br />
a Recreational vehicle .
Table R/T 14 . Federal public recreation and park facility inventory in 1980a<br />
(Florida Department of Natural Resources 1980, Division of Recreation and<br />
Parks 1980c) .<br />
Facility Bay Escambia Franklin<br />
Number of areas 0 1 3<br />
Number of acres :<br />
total 0 .0 22,506 .1 34,196 .0<br />
land 0 .0 3,829 .1 33,951 .0<br />
water 0 .0 18,677 .0 245 .0<br />
parking 0 .0 0 .0 6 .0<br />
developed 0 .0 22,506 .1 21,838 .0<br />
undeveloped 0 .0 0 .0 0 .0<br />
Buildings :<br />
recreation centers 0 0 0<br />
other 0 0 0<br />
Playina fields :<br />
baseball 0 0 0<br />
junior baseball 0 0 0<br />
softball 0 0 0<br />
football 0 0 0<br />
Courts :<br />
tenn i s 0 0 0<br />
basketball 0 0 0<br />
shuffleboard 0 0 0<br />
handball 0 0 0<br />
Hunting acres :<br />
upland 0 .0 0 .0 3,0667 .0<br />
water 0 .0 0 .0 0 .0<br />
Boat ramps :<br />
saltwater 0 0 0<br />
freshwater 0 0 1<br />
Piers :<br />
saltwater 1 0 0<br />
freshwater 0 0 0<br />
Beach saltwater :<br />
footage ~lin ft) 0 163,680 70,000<br />
area (ft ) 0 6,547,200 0<br />
Beach freshwater :<br />
footage ~lin ft) 0 0 200<br />
area (ft ) 0 0 30,000<br />
Continued<br />
157
Table R/T 14 . Continued .<br />
Facility Bay Escambia Franklin<br />
Trails : (tenths of mi)<br />
hiking<br />
bicycle<br />
horseback<br />
motorbike<br />
nature<br />
waterway<br />
multipurpose<br />
Equipped playing areas<br />
Regulation golf holes<br />
Swimming pools<br />
Picnic sites :<br />
shelters<br />
tables<br />
Historical, archaeological<br />
sites :<br />
museums<br />
other<br />
Campsates :<br />
RV trailer acres<br />
tent acres<br />
primitive acres<br />
Marinas :<br />
saltwater<br />
freshwater<br />
Continued<br />
0 .0 0 .0 0 .0<br />
0 .0 0 .0 0 .0<br />
0 .0 0 .0 0 .0<br />
0 .0 0 .0 0 .0<br />
0 .0 1 .5 85 .0<br />
0 .0 0 .0 0 .0<br />
0 .0 0 .0 0 .0<br />
0 0 0<br />
0 0 0<br />
0 0 0<br />
0 0 0<br />
0 124 6<br />
0 3 0<br />
0 0 2<br />
0 .0 300 .0 27 .0<br />
0 .0 0 .0 0 .0<br />
0 .0 0 .0 2 .0<br />
0 0 0<br />
0 0 0<br />
158
Table R/T 14 . Continued .<br />
Facility Gulf Okaloosa Santa Rosa<br />
Number of areas 0 2 0<br />
Number of acres :<br />
total 45 .0 464,019 .0 1,520 .8<br />
land 45 .0 462,819 .0 1,377 .8<br />
water 0 .0 1,200 0 143 .0<br />
parking 0 .0 0 .0 0 .0<br />
developed 0 .0 174,000 .0 1,520 .8<br />
undeveloped 0 .0 288,800 .0 0 .0<br />
Buildings :<br />
recreation centers 0 0 0<br />
other 0 0 0<br />
Playing fields :<br />
baseball 0 0 0<br />
junior baseball 0 0 0<br />
softball 0 0 0<br />
football 0 0 0<br />
Courts :<br />
tennis 0 0 0<br />
basketball 0 0 0<br />
shuff 1 eboard 0 0 0<br />
handball 0 0 0<br />
Hunting acres :<br />
upland 0 .0 0 .0 0 .0<br />
water 0 .0 1,200 .0 0 .0<br />
Boat ramps :<br />
saltwater 2 0 0<br />
freshwater 36 0 0<br />
Piers :<br />
saltwater 0 0 0<br />
freshwater 0 0 0<br />
Beach saltwater :<br />
footage ~lin ft) 0 0 0<br />
area (ft ) 0 0 0<br />
Beach freshwater :<br />
footage ~lin ft) 0 0 0<br />
area (ft ) 0 0 0<br />
Continued<br />
159
Table R/T 14 . Concluded .<br />
Facility Gulf Okaloosa Santa Rosa<br />
, Trails : (tenths of mi)<br />
hiking 0 .0 0 .0 0 .0<br />
bicycle 0 .0 0 .0 0 .0<br />
horseback 0 .0 0 .0 0 .0<br />
motorbike 0 .0 0 .0 0 .0<br />
nature 1 .1 0 .0 0 .0<br />
waterway 55 .2 0 .0 0 .0<br />
multipurpose 0 .0 0 .0 0 .0<br />
Equipped playing areas 0 0 0<br />
Regulation golf holes 0 0 0<br />
Swimming pools 0 0 0<br />
Picnic sites :<br />
shelters 0 0 0<br />
tables 0 2 0<br />
Historical, archaeological<br />
sites :<br />
museums 1 0 0<br />
other 1 0 0<br />
Campsites :<br />
RV trailer acres 0 .0 0 .0 0 .0<br />
tent acres 150 .0 0 .0 0 .0<br />
primitive acres 0 .0 0 .0 0 .0<br />
Marinas :<br />
saltwater 0 0 0<br />
freshwater 0 0 0<br />
b No data for Walton County .<br />
Recreational vehicle .<br />
160
Table R/T 15 . State public recreation and park facility inventory in 1980<br />
(Florida Department of Natural Resources 1980, Division of Recreation and<br />
Parks 1980c) .<br />
Facility Bay Escambia Franklin Gulf<br />
Number of areas 7 6 12 8<br />
Number of acres :<br />
total 179,205 .5 75,051 .5 120,145 .4 164,010 .8<br />
1 and 153,345 .5 51,561 .5 16,355 .4 96,230 .8<br />
water 25,860 .0 23,490 .0 103,810 .0 67,780 .0<br />
parking 3 .7 0 .0 1 .0 1 .1<br />
developed 153,342 .7 50,621 .0 12,078 .3 96,228 .0<br />
undeveloped 25,862 .8 940 .5 53,867 .5 67,782 .8<br />
Buildings :<br />
recreation centers 0 0 0 0<br />
other 0 0 0 2<br />
Playing fields :<br />
baseball 0 0 0 0<br />
junior baseball 0 0 0 0<br />
softball 0 0 0 0<br />
football 0 0 0 0<br />
Courts :<br />
tennis 0 0 0 0<br />
basketball 0 0 0 0<br />
shuffleboard 0 0 0 0<br />
handball 0 0 0 0<br />
Hunting acres :<br />
upland 152,279 .0 50,621 .0 12,000 .0 93,555 .0<br />
water 0 .0 0 .0 0 .0 0 .0<br />
Boat ramps :<br />
saltwater 2 0 3 2<br />
freshwater 0 0 1 3<br />
Piers :<br />
saltwater 2 0 0 0<br />
freshwater 0 0 4 0<br />
Beach saltwater :<br />
footage ~lin ft) 15,000 0 84,615 48,570<br />
area (ft ) 1,125,000 0 1,594,125 3,577,050<br />
Beach freshwater :<br />
footage ~lin ft) 0 0 0 0<br />
area (ft ) 0 0 0 0<br />
Continued<br />
161
Table R/T 15 . Continued .<br />
Facility Bay Escambia Franklin Gulf<br />
Trails : (tenths of mi)<br />
hiking 0 .0 0 .0 0 .0 7 .0<br />
bicycle 0 .0 0 .0 0 .0 0 .0<br />
horseback 0 .0 0 .0 0 .0 0 .0<br />
motorbike 0 .0 0 .0 0 .0 0 .0<br />
nature 3 .0 0 .0 0 .0 2 .5<br />
waterway 15 .0 27 .0 10 .0 0 .0<br />
multipurpose 0 .0 0 .0 0 .0 0 .0<br />
Equipped playing areas 0 0 0 0<br />
Regulation golf holes 0 0 0 0<br />
Swimming pools 0 0 0 0<br />
Picnic sites :<br />
shelters 0 0 0 0<br />
tables 134 0 44 53<br />
Historical, archaeological<br />
sites :<br />
museums 0 0 0 1<br />
other 0 0 0 0<br />
Campsites :<br />
RV trailer acres 0 .0 0 .0 0 .0 0 .0<br />
tent acres 30 .0 0 .0 0 .0 149 .0<br />
primitive acres 0 .0 0 .0 2 .0 0 .0<br />
Marinas :<br />
saltwater 0 0 0 1<br />
freshwater 0 0 0 0<br />
Continued<br />
162
Table R/T 15 . Continued .<br />
Facility Okaloosa Santa Rosa Walton<br />
Number of areas 0 2 0<br />
Number of acres :<br />
total 237,397 .8 166,910 .0 162,535 .8<br />
land 236,667 .8 157,653 .0 162,095 .8<br />
water 730 .0 9,257 .0 440 .0<br />
parking .4 1 .5 1 .3<br />
developed 38,189 .8 147,219 .5 125,034 .8<br />
undeveloped N .D . N .D . N .D .<br />
Buildings :<br />
recreation centers 0 1 0<br />
other 0 14 0<br />
Playing fields :<br />
baseball 0 0 0<br />
junior baseball 0 0 0<br />
softball 0 0 0<br />
football 0 0 0<br />
Courts :<br />
tennis 0 0 0<br />
basketball 0 0 0<br />
shuffleboard 0 0 0<br />
handball 0 0 0<br />
Hunting acres :<br />
upland 0 .0 159,336 .0 161,840 .0<br />
water 0 .0 0 .0 0 .0<br />
Boat ramps :<br />
saltwater 1 1 3<br />
freshwater 7 6 2<br />
Piers :<br />
saltwater 0 1 0<br />
freshwater 0 0 1<br />
Beach saltwater : '<br />
footage ~lin ft) 2,950 1,500 6,000<br />
area (ft ) 147,500 10,000 422,000<br />
Beach freshwater :<br />
footage ~lin ft) 300 0 0<br />
area (ft ) 15,000 0 0<br />
Continued<br />
163
Table R/T 15 . Concluded .<br />
Facility Okaloosa Santa Rosa Walton<br />
Trails : (tenths of mi)<br />
hiking<br />
bicycle<br />
horseback<br />
motorbike<br />
nature<br />
waterway<br />
multipurpose<br />
Equipped playing areas<br />
Regulation golf holes<br />
Swimming pools<br />
Picnic sites :<br />
shelters<br />
tables<br />
Historical, archaeological<br />
sites :<br />
museums<br />
other<br />
Campsites :<br />
RV trailer acres<br />
tent acres<br />
primitive acres<br />
Marinas :<br />
saltwater<br />
freshwater<br />
a Recreational vehicle .<br />
21 .0 17 .0 0 .0<br />
0 .0 0 .0 0 .0<br />
0 .0 21 .0 0 .0<br />
0 .0 0.0 , 0 .0<br />
2 .7 4 .3 .8<br />
82 .0 54 .0 7 .0<br />
0 .0 0 .0 0 .0<br />
0 0 0<br />
0 0 0<br />
0 0 0<br />
0 0 0<br />
140 220 84<br />
1 0 2<br />
0 0 0<br />
10 .0 106 spaces 5 .0<br />
3 .0 13 .0 7 .0<br />
5 .0 40 .0 0 .0<br />
0 0 0<br />
0 0 0<br />
164
Table R/T'16 . County public recreation and park facility inventory in 1980<br />
(Florida Department of Natural Resources 1980, Division of Recreation and<br />
Parks 1980c) .<br />
Facility Bay Escambia Franklin Gulf<br />
Number of areas 29 35 8 7<br />
Number of acres :<br />
total 126 .5 198 .7 7 .5 9 .7<br />
land 117 .5 198 .7 7 .5 9 .7<br />
water 9 .0 0 .0 0 .0 0 .0<br />
parking 3 .5 5 .0 0 .0 6 .5<br />
developed 94 .1 141 .3 7 .5 9 .7<br />
undeveloped 21 .9 57 .4 0 .0 0 .0<br />
Buildings :<br />
recreation centers 5 2 0 0<br />
other 0 0 0 0<br />
Playing fields :<br />
baseball 1 5 0 0<br />
junior baseball 13 6 0 0<br />
softball 1 3 0 0<br />
football 2 3 0 0<br />
Courts :<br />
tennis 10 2 0 0<br />
basketball 1 2 0 0<br />
shuffleboard 1 0 0 0<br />
handball 0 0 0 0<br />
Hunting acres :<br />
upland 0 .0 0 .0 0 .0 0 .0<br />
water 0 .0 0 .0 0 .0 0 .0<br />
Boat ramps :<br />
saltwater 7 7 7 1<br />
freshwater 6 0 0 5<br />
Piers :<br />
saltwater 2 0 0 5<br />
freshwater 0 0 0 0<br />
Beach saltwater :<br />
foota eJlin ft)<br />
area ?ft )<br />
1,500<br />
186,000<br />
6,100<br />
610,000<br />
100<br />
5,000<br />
3,750<br />
587,500<br />
Beach freshwater :<br />
footage ~lin ft) 0 0 0 0<br />
area (ft ) .0 0 0 0<br />
Continued<br />
165
Table R/T 16 . Continued .<br />
Facility Bay Escambia Franklin Gulf<br />
Trails : (tenths of mi)<br />
hiking 0.0 0 .0 0 .0 0 .0<br />
bicycle 0.0 0 .0 0 .0 0 .0<br />
horseback 0 .0 0 .0 0 .0 0 .0<br />
motorbike 0 .0 0 .0 0 .0 0 .0<br />
nature 0 .2 0 .0 0 .0 0 .0<br />
waterway 0.0 0 .0 0 .0 0 .0<br />
multipurpose 0 .0 0 .0 0 .0 0 .0<br />
Equipped playing areas 5 7 0 0<br />
Regulation golf holes 0 0 0 0<br />
Swimming pools 0 0 0 0<br />
Picnic sites :<br />
shelters 0 0 0 0<br />
tables 21 31 2 11<br />
Historical, archaeological<br />
sites :<br />
museums 0 0 0 0<br />
other 1 0 0 0<br />
Campsites :<br />
RV trailer acres 0 .0 0 .0 0 .0 0 .0<br />
tent acres 0 .0 0 .0 0 .0 0 .0<br />
primitive acres 0 .0 0 .0 0 .0 0 .0<br />
Marinas :<br />
saltwater 0 0 0 0<br />
freshwater 0 0 0 0<br />
Continued<br />
166
Table R/T 16 . Continued .<br />
Facility Okaloosa Santa Rosa Walton<br />
Number of areas 29 5 8<br />
Number of acres :<br />
total 187 .1 39 .0 29 .1<br />
land 147 .4 39 .0 29 .1<br />
water 28 .7 0 .0 0 .0<br />
parking 3 .5 1 .0 7 .5<br />
developed 174 .9 39 .0 0 .0<br />
undeveloped 1 .2 0 .0 0 .0<br />
Buildings :<br />
recreation centers 0 2 0<br />
other 6 0 1<br />
Playing fields :<br />
baseball 1 0 0<br />
junior baseball 2 0 0<br />
softball 0 2 0<br />
football 0 0 0<br />
Courts :<br />
tennis 2 5 0<br />
basketball 0 1 0<br />
shuffleboard 0 0 0<br />
handball 0 0 0<br />
Hunting acres :<br />
upland 0 .0 0 .0 0 .0<br />
water 0 .0 0 .0 0 .0<br />
Boat ramps :<br />
saltwater 3 3 2<br />
freshwater 5 0 6<br />
Piers :<br />
saltwater 1 2 0<br />
freshwater 0 0 0<br />
Beach saltwater :<br />
footage ~lin ft) 3,750 2,575 100<br />
area (ft ) 587,500 133,000 2,500<br />
Beach freshwater :<br />
foota eilin ft)<br />
area ?ft )<br />
0<br />
0<br />
Continued<br />
167<br />
0<br />
0<br />
0 0
Table R/T 16 . Concluded .<br />
Facility Okaloosa Santa Rosa Walton<br />
Trails : (tenths of mi)<br />
hiking 0 .0 0 .0 0 .0<br />
bicycle 0 .0 0 .0 0 .0<br />
horseback 0 .0 0 .0 0 .0<br />
motorbike 0 .0 0 .0 0 .0<br />
nature 0 .0 0 .0 0 .0<br />
waterway 0 .0 0 .0 0 .0<br />
multipurpose 0 .0 0 .0 0 .0<br />
Equipped playing areas 1 0 1<br />
Regulation golf holes 0 0 0<br />
Swimming pools 0 0 0<br />
Picnic sites :<br />
shelters 0 0 0<br />
tables 130 46 16<br />
Historical, archaeological<br />
sites :<br />
museums 1 0 0<br />
other 0 0 0<br />
Campsites :<br />
RV trailer acres 0 .0 0 .0 0 .0<br />
tent acres 0 .0 0 .0 0 .0<br />
primitive acres 0 .0 0 .0 0 .0<br />
Marinas :<br />
saltwater 0 0 0<br />
freshwater 0 0 0<br />
a Recreational vehicle .<br />
168
Table R/T 17 . Municipal public recreation and park facility inventory in 1980<br />
(Florida Department of Natural Resources 1980, Division of Recreation and<br />
Parks 1980c) .<br />
Facility Bay Escambia Franklin Gulf<br />
Number of areas<br />
Number of acres :<br />
39 89 16 7<br />
total 238 .8 508 .1 37 .7 42 .5<br />
land 220 .9 508 .1 34 .7 42 .5<br />
water 17 .9 0 .0 3 .0 0 .0<br />
parking 11 .0 3 .0 0 .0 0 .0<br />
developed 188 .6 455 .9 22 .5 40 .5<br />
undeveloped<br />
Buildings :<br />
47 .2 48 .0 15 .2 2 .0<br />
recreation centers 8 14 0 3<br />
other<br />
Playing fields :<br />
3 7 0 4<br />
baseball 4 23 3 1<br />
junior baseball 10 6 0 8<br />
softball 10 15 0 2<br />
football<br />
Courts :<br />
3 1 2 0<br />
tennis 22 24 2 6<br />
basketball 11 56 0 0<br />
shuff l eboard 6 0 0 0<br />
handball<br />
Hunting acres :<br />
0 0 0 0<br />
upland 0 .0 0 .0 0 .0 0 .0<br />
water<br />
Boat ramps :<br />
0 .0 0 .0 0 .0 0 .0<br />
saltwater 3 1 0 1<br />
freshwater<br />
Piers :<br />
0 2 1 0<br />
saltwater 0 1 0 0<br />
freshwater<br />
Beach saltwater :<br />
0 0 0 0<br />
footage Jlin ft) 2,430 3,400 0 0<br />
area (ft ) 212,750 145,000 0 0<br />
Beach freshwater :<br />
foota eJlin ft)<br />
area ? ft )<br />
0<br />
0<br />
0<br />
0<br />
0<br />
0<br />
0<br />
0<br />
Continued<br />
169
Table R/T 17 . Continued .<br />
Facility Bay Escambia Franklin Gulf<br />
Trails : (tenths of mi)<br />
hiking 0 .0 1 .0 0 .0 0 .0<br />
bicycle 0 .0 1 .5 0 .0 0 .0<br />
horseback 0 .0 0 .0 0 .0 0 .0<br />
motorbike 0 .0 0 .0 0 .0 0 .0<br />
nature 0 .2 0 .0 0 .0 0 .0<br />
waterway 0 .0 0 .0 0 .0 0 .0<br />
multipurpose 0 .0 0 .0 0 .0 0 .0<br />
Equipped playing areas 15 51 1 3<br />
Regulation golf holes 0 18 0 9<br />
Swimming pools 1 0 0 0<br />
Picnic sites :<br />
shelters 38 21 2 7<br />
tables 21 31 2 11<br />
Historical, archaeological<br />
sites :<br />
museums 0 0 0 0<br />
other 2 2 2 0<br />
Campsites :<br />
RV trailer acres 0 .0 0 .0 0 .0 0 .0<br />
tent acres 0 .0 0 .0 0 .0 0 .0<br />
primitive acres 0 .0 0 .0 0 .0 0 .0<br />
Marinas :<br />
saltwater 0 0 0 0<br />
freshwater 0 0 0 0<br />
Continued<br />
170
Table R/T 17 . Continued .<br />
Facility Okaloosa Santa Rosa Walton<br />
Number of areas 46 8 8<br />
Number of acres :<br />
total 325 .7 194 .9 57 .7<br />
land 319 .3 193 .9 42 .7<br />
water 6 .4 1 .0 15 .0<br />
parking 0 .0 3 .5 15 .5<br />
developed 301 .9 186 .0 62 .7<br />
undeveloped 23 .8 10 .4 0 .0<br />
Buildings :<br />
recreation centers 9 1 1<br />
other 6 0 0<br />
Playing fields :<br />
baseball 8 7 2<br />
junior baseball 13 2 0<br />
softball 12 2 0<br />
football 6 2 0<br />
Courts :<br />
tennis 35 12 2<br />
basketball 26 6 0<br />
shuffleboard 2 0 0<br />
handball 3 0 0<br />
Hunting acres :<br />
upland 0 .0 0 .0 0 .0<br />
water 0 .0 0 .0 0 .0<br />
Boat ramps :<br />
saltwater 1 7 2<br />
freshwater 0 0 2<br />
Piers :<br />
saltwater 2 1 0<br />
freshwater 1 0 1<br />
Beach saltwater :<br />
footage Jlin ft) 2,890 4,840 0<br />
area (ft ) 148,100 136,160 0<br />
Beach freshwater :<br />
footage ~lin ft) 0 0 200<br />
area (ft ) 0 0 10,000<br />
Continued<br />
171
Table R/T 17 . Concluded .<br />
Facility Okaloosa Santa Rosa Walton<br />
Trails : (tenths of mi)<br />
hiking 0 .0 0 .0 0 .0<br />
bicycle 0 .0 0 .0 0 .0<br />
horseback 0 .0 0 .0 0 .0<br />
motorbike 0 .0 0 .0 0 .0<br />
nature 1 .0 0 .5 0 .0<br />
waterway 0 .0 0 .0 0 .0<br />
multipurpose 0 .0 0 .0 0 .0<br />
Equipped playing areas 21 2 7<br />
Regulation golf holes 27 0 0<br />
Swimming pools 0 0 0<br />
Picnic sites :<br />
shelters 0 0 0<br />
tables 141 30 16<br />
Historical, archaeological<br />
sites :<br />
museums 3 0 0<br />
other 2 0 0<br />
Campsites :<br />
RV trailer acres 0 .0 0 .0 0 .0<br />
tent acres 0 .0 0 .0 0 .0<br />
primitive acres 0 .0 0 .0 0 .0<br />
Marinas :<br />
saltwater 0 0 0<br />
freshwater 0 0 0<br />
a Recreational vehicle .<br />
172
ALABAMA<br />
~ ~- •7<br />
~2 A<br />
7~C Paynea Prairie<br />
STATE PRESERVE<br />
® STATE FORESTS<br />
A Blackwater<br />
B Pine Log<br />
C Cary<br />
D Wlthlacoochee<br />
STATE PARKS<br />
1 Fort Cooper<br />
2 Blackwater River<br />
3 Caladesi Island<br />
4 Collier-Seminole<br />
5 St . George Island'<br />
6 Faver-Dykes<br />
7 Florida Caverns<br />
8 Fort Clinch<br />
24~<br />
9 Mike Roess Gold Head Branch<br />
10 Highlands Hammock<br />
11 Hillsborough River<br />
12 Hontoon Island<br />
13 Ichetucknee Springs<br />
14 John Pennekamp Coral Reef<br />
15 Jonathan Dickinson<br />
16 Lake Kissimmee<br />
17 Lake Loulsa<br />
18 Little Talbot Island<br />
19 Manatee Springs<br />
20 Myakka River<br />
21 Ochlockonee River<br />
22 O'leno<br />
23 Prairie Lakes'<br />
24 T .H . Stone Memorial St . Joe Peninsula<br />
25 St . Lucie Inlet•<br />
26 Suwannee River<br />
27 Tomoka<br />
28 Torreya<br />
29 Wekiwa Springs<br />
30 Blue Spring<br />
'Not Open to Public<br />
GEOaGIA<br />
2<br />
LiI6ji8<br />
A9<br />
i.~a ; .<br />
2 '"9<br />
C . ~ .,<br />
,<br />
12 •30<br />
: f C<br />
.<br />
29<br />
17• . ,,. J)<br />
. ~ _ . . :~23'i<br />
~ ( 16 ~ •<br />
:` 3 YS+ ,<br />
. . . .<br />
t~<br />
~ •10 ~•<br />
.-<br />
1~ 20 "i,"<br />
' _<br />
t~ . . . . . . .<br />
3<br />
. . . •<br />
. Vz ' .<br />
~- ._...:...~_l<br />
... . . a Jr<br />
. . . . fic[_ .. . .<br />
Figure 11 . State preserves, forests, and parks (Florida Power and Light Co . 1979) .<br />
173<br />
00<br />
s<br />
~14<br />
~
Table R/T 18 . Privatea recreation and park facility inventory in 1980 (Florida<br />
Department of Natural Resources 1980, Division of Recreation and Parks 1980c) .<br />
Facility Bay Escambia Franklin Gulf<br />
Number of areas 7 60 19 25<br />
Number of acres :<br />
total 394 .6 2,832 .3 114 .4 16 .0<br />
land 242 .4 1,656 .9 88 .00 N .D .<br />
water 0 .0 256 .5 6 .0 N .D .<br />
parking 0 .4 114 .1 0 .0 N .D .<br />
developed 50 .2 1,026 .2 21 .0 N .D .<br />
undeveloped 5 .1 534 .0 0 .0 N .D .<br />
Buildings :<br />
recreation centers 8 29 1 0<br />
other 58 68 15 19<br />
Playing fields :<br />
baseball 0 0 0 0<br />
junior baseball 0 0 0 0<br />
softball 0 1 0 0<br />
football 0 1 0 0<br />
Courts :<br />
tennis 11 44 0 2<br />
basketball 2 9 0 0<br />
shuffleboard 3 2 0 0<br />
handball 0 2 0 0<br />
Hunting acres :<br />
upland 0 .0 0 .0 0 .0 0 .0<br />
water 0 .0 510 .0 0 .0 0 .0<br />
Boat ramps :<br />
saltwater 20 6 8 5<br />
freshwater 6 4 0 17<br />
Piers :<br />
saltwater 6 3 4 1<br />
freshwater 3 5 0 0<br />
Beach saltwater :<br />
footage ~lin ft) 610 405 1,300 10<br />
area (ft ) 50 25,000 9,000 50<br />
Beach freshwater :<br />
footage Jlin ft) 0 355 5 0<br />
area (ft ) 0 23,025 25 0<br />
Continued<br />
174
Table R/T 18 . Continued .<br />
Facility Bay Escambia Franklin Gulf<br />
Trails : (tenths of mi)<br />
hiking 1 .2 100 .0 0 .0 0 .0<br />
bicycle 0 .0 0 .0 0 .0 0 .0<br />
horseback 0 .0 1,010 .0 0 .0 0 .0<br />
motorbike 0 .0 10 .0 0 .0 0 .0<br />
nature 0.1 14 .0 0 .0 0 .0<br />
waterway 0.0 20 .0 0 .0 0 .0<br />
multipurpose 0 .0 0 .1 0 .0 0 .0<br />
Equipped playing areas 11 2 1 0<br />
Regulation golf holes 201 2 9 18<br />
Swimming pools 9 7 4 1<br />
Picnic sites :<br />
shelters 0 3 0 0<br />
tables 19 50 8 0<br />
Historical, archaeological<br />
sites :<br />
museums 2 4 0 0<br />
other 0 1 0 0<br />
Campsates :<br />
RV trailer acres 11 .2 15 .2 89 .0 0 .0<br />
tent acres 4 .0 9 .5 0 .0 0 .0<br />
primitive acres 6 .0 486 .0 0 .0 0 .0<br />
Marinas :<br />
saltwater 19 9 10 0<br />
freshwater 1 0 0 0<br />
Continued<br />
175
Table R/T 18 . Continued .<br />
Facility Okaloosa Santa Rosa Walton<br />
Number of areas 50 32 18<br />
Number of acres :<br />
total 2,118 .7 1,138 .2 2,131 .0<br />
land 1,873 .8 1,069 .0 1,560 .0<br />
water 54 .0 68 .5 549 .0<br />
parking 0 .0 20 .8 2 .0<br />
developed 700 .5 399 .5 80 .0<br />
undeveloped 659 .0 707 .5 0 .0<br />
Buildings :<br />
recreation centers 15 9 12<br />
other 39 25 14<br />
Playing fields :<br />
baseball 0 9 0<br />
junior baseball 0 6 0<br />
softball 0 0 0<br />
football 0 0 0<br />
Courts :<br />
tennis 32 14 3<br />
basketball 4 7 0<br />
shuffleboard 4 4 3<br />
handball 0 0 0<br />
Hunting acres :<br />
upland 640 .0 8,037 .0 0 .0<br />
water 0 .0 0 .0 0 .0<br />
Boat ramps :<br />
saltwater 4 8 1<br />
freshwater 2 3 12<br />
Piers :<br />
saltwater 1 61 0<br />
freshwater 0 1 1<br />
Beach saltwater :<br />
footage ~lin ft) 15 3,650 5<br />
area (ft ) 1,375 83,500 25<br />
Beach freshwater :<br />
footage ~lin ft) 0 0 10<br />
area (ft ) 0 0 50<br />
Continued<br />
176
Table R/T 18 . Concluded .<br />
Facility Okaloosa Santa Rosa Walton<br />
Trails : (tenths of mi)<br />
hiking 0 .0 16 .0 0 .4<br />
bicycle 0 .0 0 .0 0 . 0horseback<br />
0 .0 0 .0 0 .1<br />
motorbike 0 .0 1 .0 0 .0<br />
nature 1 .0 0 .5 0 .0<br />
waterway 55 .0 0 .0 0 .0<br />
multipurpose 0 .0 0 .0 0 .0<br />
Equipped playing areas 4 3 3<br />
Regulation golf holes 26 18 18<br />
Swimming pools 10 7 7<br />
Picnic sites :<br />
shelters 0 1 0<br />
tables 185 62 32<br />
Historical, archaeological<br />
sites :<br />
museums 4 0 0<br />
other 1 0 0<br />
Campsites :<br />
RV trailer acres 17 .5 81 .0 20 .0<br />
tent acres 1 .3 4 .0 20 .0<br />
primitive acres 0 .0 10 .0 1 .0<br />
Marinas :<br />
saltwater 11 5 0<br />
freshwater 0 0 1<br />
a Includes non-profit with private or semi-private access, profit with public<br />
gccess and profit with private or semi-private access .<br />
Recreational vehicle .<br />
177
Table R/T 19 . The number of air and auto tourists in Florida in 1976, 1979 and 1980 (Florida Department<br />
of Commerce, Division of Tourism ca . 1977b, ca . 1480b, ca . 1981b) .<br />
County Air<br />
1976a<br />
u o o a Air<br />
1979 u o ota Air<br />
1984b<br />
u o ota<br />
Bay 16,054 844,108 860,162 22,060 1,627,445 1,649,505 0 743,900 743,900<br />
Escambia 4,188 1,370,049 1,374,237 7,664 1,188,945 1,196,609 0 789,980 789,980<br />
Franklin 0 26,392 26,392 10,200 23,946 34,146 0 0 0<br />
Gulf 2,635 15,370 18,005 0 35,780 35,780 0 0 0<br />
Okaloosa 1,257 1,611,369 1,612,626 9,898 1,026,690 1,036,588 0 552,000 552,000<br />
Santa Rosa 0 127,102 127,102 0 143,785 143,785 0 0 0<br />
Walton 0 183,587 183,587 0 12,745 12,745 0 0 0<br />
Region 24,134 4,177,977 4,202,111 49,822, 4,059,336 4,409,158 0 2,085,880 2,085,880<br />
~ Florida N .D . N .D . N .D . 3,494,380•11,024,787 14,519,167 2,347,800 5,810,980 8,158,780<br />
b No data prior to 1976 .<br />
1980 data for first and second quarters only .
Table R/T 20 . Number of visitors, visitor characteristics, and visitor expenditures in 1976a (Florida<br />
Department of Commerce, Division of Tourism ca . 1977a, ca . 1980, ca . 1981) .<br />
County<br />
Number of<br />
visitors<br />
% repeat<br />
visitors<br />
Total<br />
expenditures<br />
($)<br />
Expenditures per<br />
person per day<br />
($)<br />
Nights spent<br />
in county<br />
Bay N .D . N .D . N .D . N .D . N .D .<br />
Escambia 1,349,728 82 .83 136,055,622 22 .62 4 .58<br />
Franklin N .D . N .D . N .D . N .D . N .D .<br />
Gulf b N .D . N .D . N .D . N .D . N .D .<br />
Okaloosa 1,364,868 82 .0 90,496,399 17 .10 4 .1<br />
Santa Rosa N .D . N .D . N .D . N .D . N .D .<br />
Walton N .D . N .D . N .D . N .D . N .D .<br />
~<br />
V<br />
Region 2,714,596 N .D . 226,552,021 N .D . N .D .<br />
tD Florida N .D . N .D . N .D . N .D . N .D .<br />
b By auto survey, this type survey was not conducted prior to 1976 .<br />
Figures based on three quarters only ; fourth quarter data not available .
Table R/T 21 . Number of visitors, visitor characteristics, and visitor expenditures in 1979a (Florida<br />
Department of Commerce, Division of Tourism ca . 1980b) .<br />
County<br />
Number of<br />
visitors<br />
% repeat<br />
visitors<br />
Total<br />
expenditures<br />
M<br />
Expenditures per<br />
person per day'<br />
M<br />
Nights spent<br />
in county<br />
Bay 1,463,100 93 .08 209,878,477 25 .81 6 .03<br />
Escambia 1,557,500 86 .53 211,993,050 32 .72 4 .13<br />
Franklin N .D . N .D . N .D . N .D . N,D .<br />
Gulf b N .D . N .D . N .D . N .D . N .D .<br />
Okaloosa 859,600 89 .8 150,964,869 29 .98 5 .70<br />
Santa Rosa N .D . N .D . N .D . N .D . N .D .<br />
Walton N .D . N .D . N .D . N .D . N .D .<br />
Regi on 3,880,200 N .D . 572,836,396 N .D . N .D .<br />
~<br />
CO<br />
o Florida N .D . N .D . N .D . N .D . N .D .<br />
b By auto survey .<br />
Figures based on three quarters only ; fourth quarter data not available .
Table R/T 22 . Number of visitors, visitor characteristics, and visitor expenditures in 1980a (Florida<br />
Department of Commerce, Division of Tourism ca . 1980b) .<br />
County<br />
Number of<br />
visitors<br />
% repeat<br />
visitors<br />
Total<br />
expenditures<br />
(.$)<br />
Expenditures per<br />
person per day<br />
($)<br />
Nights spent<br />
in county<br />
Bayb b 1,208,100 93 .3 164,328,740 25 .95 5 .3<br />
Escambia 1,432,100 88 .7 200,485,881 32 .78 4 .2<br />
Franklin N .D . N .D . N .D . N .D . N .D .<br />
Gulf N .D . N .D . N .D . N .D . N .D .<br />
Okaloosac 359,400 91 .5 55,042,110 30 .63 5 .0<br />
Santa Rosa N .D . N .D . N .D . N .D . N .D .<br />
Walton N .D . N .D . N .D . N .D . N .D .<br />
Region 2,999,500 N .D . 419,856,731 N .D . N .D .<br />
~<br />
CO<br />
~ Florida N .D . N .D . N .D . N .D . N .D .<br />
b By auto survey .<br />
Figures based on three quarters only ; fourth quarter data not available .<br />
c Figures based on second quarter data only .
I-tYJ<br />
N<br />
NATIONAL SEASHORES<br />
1 Gulf Islands<br />
A L A s A M A<br />
2 Canaveral a i<br />
NATIONAL MEMORIALS, MONUMENTS ` .k-<br />
AND HISTORIC SITES<br />
3 Fort Caroline 1 21<br />
4 Castillo de San Marco<br />
5 Fort Matanzas<br />
6 Desoto<br />
7 Mar-a-Largo<br />
8 Fort Jefferson NATIONAL WILDLIFE REFUGES<br />
27 St. Vincent Island<br />
NATIONAL MARINE SANCTUARIES 28 St. Marks<br />
9 Key Largo Coral Reef 29 Cedar Key<br />
10 Looe Key 30 Lake Woodruff<br />
31 Chassahowitzka<br />
NATIONAL WILDERNESS AREAS 32 Merritt Island<br />
11 Bradwell Bay 33 Pig Island<br />
12 Cedar Keys 34 Pelican Island<br />
13 Florida Keys 35 Pinellas<br />
14 Island Bay 36 Passage Key<br />
15 Passage Key 37 Hobe Sound<br />
16 Pelican Island 38 Island Bay<br />
17 St. Marks 39 Caloosahatchee<br />
18 Chassahowitzka 40 Pine Island<br />
19 J .N . "Ding" Darling 41 Matlacha Pass<br />
20 Lake Woodruff 42 Jay N . "Ding" Darling<br />
43 Loxahatchee<br />
NATIONAL FORESTS 44 National Key Deer<br />
21 Apalachicola 45 Great White Heron<br />
22 Osceola 46 Key West<br />
23 Ocala 47 St. Johns<br />
48 Egmont Key<br />
NATIONAL PARKS 49 Okefenokee<br />
24 Everglades 50 Lower Suwannee<br />
25 Biscayne<br />
NATIONAL ESTUARINF SANTUARIES<br />
GEORGIA<br />
N AT IONAL ESER PR VE 51 Apalachicola Bay<br />
.,,,,,, .,; ~ vy<br />
Bay \ ~`~.~<br />
13<br />
26 Big Cypress 52 Rookery<br />
Figure 12 . National seashores, memorials, monuments, historic sites, marine sanctuaries, estuarine<br />
sanctuaries, wilderness areas, forests, parks, wildlife refuges, and preserves (Florida Power and<br />
Light Co . 1979) .<br />
44 E6/ 8 010~~
Table R/T 23 . Number of assigned archaeological and historical sites in<br />
November 1980 (Florida Department of State, Bureau of Historic Sites and<br />
Properties 1980) .<br />
County Number of sites<br />
Bay 168<br />
Escambia 225<br />
Franklin 355<br />
Gulf 18<br />
Okaloosa 133<br />
Santa Rosa 76<br />
Walton 104<br />
Region 1,079<br />
Florida N .D .<br />
183
ALAtAMA GEORGIA ~<br />
. HG!f')a5 f<br />
t, sa Ja,kson 32 N<br />
~2 j e^Ja :ton 'a.ah i n Gacisde^ ./, . MflrT11i - Nass: :a .<br />
},<br />
' :3r<br />
~ AQUATIC PRESERVES<br />
1 Fort Pickens State Park<br />
2 Yellow River Marsh<br />
3 Rocky Bayou State Park<br />
t<br />
` Leon ~<br />
hJ:.!n<br />
t . rtv<br />
4J~kulla<br />
Tavlc)r i3-<br />
nce<br />
f3 aker a ker<br />
v `<br />
~<br />
4 : :<br />
F~ .), ~ ~<br />
:<br />
.ra .<br />
:fl (fl~a!t(i ~1 :4 i I ;i'.' ~<br />
5 .~7<br />
[<br />
><br />
ti 'i!Y!f'<br />
.<br />
(' `<br />
Le'.':<br />
~<br />
0<br />
n 29<br />
.,<br />
"'<br />
28<br />
8 C ;t!us ~ 7<br />
ti ::rnam.lo °'<br />
F<br />
:.lranac;<br />
4 St . Andrews State Park 9 !'titl~- Clc,ceoia<br />
+or:~ :~c;!<br />
Poik 5<br />
5 St . Joseph Bay =<br />
a. 33<br />
6 Apalachicola Bay 24<br />
7 Alligator Harbor<br />
; t<br />
.?anati9Et :)kge_<br />
!)<br />
o<br />
''<br />
8 St. Martin's Marsh<br />
~<br />
C;r, 3;)te<br />
t'ag!aan:j$<br />
9 Plnellas County<br />
10 Boca Cleya<br />
~<br />
;,!ctie<br />
Glacaes<br />
21<br />
11 Lake Jackson<br />
14<br />
1 ^_<br />
A'--<br />
4n,n,r)r.v<br />
t alm Beach<br />
12 Cape Haze 1<br />
13 Matlacha Pass 25 Indlan River-Malabar to Sebastian<br />
16<br />
na ; .:r<br />
14 Pine Island Sound 28 Banana Rlver<br />
17<br />
15 Estsro Bay<br />
27 Mosqu ito<br />
Lagoon<br />
16 Rookery Bay 28 Weklva River<br />
1B Coupon Bight 29 Tomoka Marsh<br />
19 Ligumvitae Bay 30 Pelllcer Creek<br />
20 Biscayne Bay 31 Nassau RlverSt. John's Marsh<br />
21 Loxahatchee River-Lake Worth Creek<br />
22 North Fork, St . Lucle<br />
32 Fort Clinch State Park<br />
33 Cockroach Bay<br />
18<br />
III<br />
t"slc::ard<br />
'~ ;:nro~ ~da<br />
~<br />
23 Jensen Beach to Jupiter Inlet 34 Gasparllla Sound-Charlotte Harbor r y~<br />
24 Indian Rlver-Vero Beach to Ft. Pierce 35 Cape Florida<br />
Figure 13 . State Aquatic Preserves (Florida Power and Light Co . 1979) .<br />
184<br />
O 111999<br />
20
Table R/T 24 . Historic sites in northwestern Florida listed on the National<br />
Register (U .S . Department of the Interior, Heritage Conservation and<br />
Recreation Service 1979) .<br />
County and name of site Date listed<br />
Escambia<br />
American National Bank Building 17 November 1978<br />
Clara Barkley Dorr House 24 July 1974<br />
Fort George Site 8 July 1974<br />
Fort San Carlos de Barrancas 15 October 1966<br />
Charles William Jones House 20 December 1977<br />
LaN Marine Terminal Building 14 August 1972<br />
Lavalle House 11 March 1971<br />
Old Christ Church 3 May 1974<br />
Pensacola Athletic Club (Rafford Hall) 16 April 1975<br />
Pensacola Historic District 29 September 1970<br />
Pensacola Lighthouse and Keeper's Cuarters 15 September 1974<br />
Pensacola Naval Air Station Historic District 8 December 1976<br />
Plaza Ferdinand VII 15 October 1966<br />
Saenger Theater 19 July 1976<br />
Buccaneer (Virginia) 2 November 1972<br />
St . Michael's Creole Benevolent Association Hall 3 May 1974<br />
Fort Pickens 31 May 1972<br />
Louisville and Nashville Passenger Station and<br />
Express Building 11 June 1979<br />
St . Joseph's Church Buildings 10 July 1979<br />
Thiesen Building 13 December 1979<br />
Perdido Key Historic District 10 March 1980<br />
Frankl i n<br />
David G . Raney House<br />
Trinity Episcopal Church<br />
Pierce Site<br />
Crooked River Lighthouse<br />
Porter's Bar Site<br />
Cape St . George Light<br />
Yent Mound<br />
Fort Gadsen Historic Memorial<br />
(Negro Fort ; British Fort)<br />
Okaloosa<br />
Fort Walton Mound<br />
Valparaiso Inn<br />
Walton<br />
DeFuniak Springs<br />
Sun Bright (Sidney Johnson Catts House)<br />
185<br />
22 September 1976<br />
30 June 1972<br />
11 January 1974<br />
1 December 1978<br />
23 January 1975<br />
10 September 1974<br />
24 May 1973<br />
23 Februa ry 1972<br />
15 October 1966<br />
1 August 1978<br />
7 August 1972<br />
7 May 1979
~<br />
co<br />
rn<br />
Table R/T 25 . Recreational properties under the jurisdiction of the Florida Deaprtment of Natural Resources<br />
1980 (Florida Department of Natural Resources, Division of Recreation and Parks 1980b) .<br />
Location and<br />
name of site<br />
Acres<br />
Up an Su merged<br />
Type of<br />
facility<br />
Operational<br />
status<br />
Bay County<br />
St . Andrews State<br />
Park 1,063 0 Recreational Optimal<br />
Escambia County<br />
Big Lagoon State Operational<br />
Recreation Area 699 0 Recreational partly developed<br />
Perdidio Key State<br />
Preserve 247 0 Preserve Under formal design<br />
Franklin County<br />
Cape St . George State<br />
Preserve 2,295 0 Preserve In reservea<br />
Dr . Julian G . Bruce<br />
St . George Island Operational<br />
State Park 1,963 0 Park - partly developed<br />
Fort Gadsden State Operational<br />
Historic Site 76 0 Historic partly developed<br />
John Gorrie State<br />
Museum 1 0 Museum Optimal<br />
Gulf County<br />
Constitution Convention<br />
State Museum 14 0 Museum Optimal<br />
Dead Lakes State<br />
Recreation Area 66 18 Recreational Optimal<br />
Okaloosa County<br />
Fred Gannon Rocky Bayouc Operational<br />
State Recreation Area 632 0 Recreational partly developed<br />
Continued
Table R/T 25 . Concluded .<br />
Location and<br />
name of site<br />
Acres<br />
Up an u merge<br />
Type of<br />
facility<br />
Operational<br />
status<br />
Santa Rosa County<br />
Blackwater River<br />
State Park 360 0 Park<br />
Operational<br />
partly developed<br />
Walton County<br />
Basin Bayou Stated<br />
Recreation Area<br />
Eden State Gardens<br />
287<br />
12<br />
0<br />
0<br />
Recreational<br />
Ornamental<br />
Garden<br />
Operational<br />
partly developed<br />
Operational<br />
partly developed<br />
Grayton Beach State<br />
Recreation Area 276 80 Recreational<br />
Operational<br />
partly developed<br />
Ponce de Leon Springs<br />
~ StatS Recreation<br />
Area 433 0 Recreational<br />
Operational<br />
partly developed<br />
b Being held for future use pending sufficient increase in need or other conducive circumstances .<br />
Owned by U .S . Department of Agriculture . The Department of Natural Resources has a special use permit<br />
Hntil 18 May 1991 .<br />
d Leased from U .S . Air Force, expires 30 June 1982 .<br />
Leased from U .S . Air Force, expires 30 June 1984 .<br />
P Includes Holmes County .
Table R/T 26 . Visitor utilization of recreational properties under the jurisdiction of the Florida<br />
Department of Natural Resources for fiscal years 1965-66, 1970-71, 1974-75 and 1979-80 (Florida<br />
Department of Natural Resources, Division of Recreation and Parks 1980a) .<br />
Location and Number of visitors<br />
name of site 1965-66 1970- 1974-75 1979-80<br />
Bay County<br />
St . Andrews State<br />
Recreation Area<br />
Escambia County<br />
Big Lagoon State<br />
Recreation Area<br />
Perdidio Key State<br />
Preserve<br />
~ Franklin County<br />
o Cape St . George State<br />
Preserve<br />
Dr . Julian G . Bruce<br />
St . George Island<br />
State Park<br />
Ft . Gadsden State<br />
Historic Site<br />
John Gorrie State<br />
Museum<br />
Gulf County<br />
Constitution Convention<br />
State Museum<br />
Dead Lakes State<br />
Recreation Area<br />
Okaloosa County<br />
Fred Gannon Rocky Bayou<br />
State Recreation Area<br />
617,587 526,669 503,430 559,459a<br />
N .A . N .A . N .A . 21,411b<br />
N .A . N .A . N .A . N .A .<br />
N .A . N .A . N .A . N .A .<br />
N .A . N .A . N .A . 65,746 b<br />
3,336 5,055 5,369 5,915<br />
8,769 6,927 12,800 12,457a<br />
5,511 4,330 8,044 6,147a<br />
N .A . N .A . 17,852 22,659b<br />
N .A . 50,851 48,799 29,908b<br />
Continued
,~<br />
CO<br />
t o<br />
Table R/T 26 . Concluded .<br />
Location and<br />
Number of visitors<br />
name of site 1965-66 0- 4- 1979-80<br />
Santa Rosa County<br />
Blackwater River<br />
State Park<br />
Walton County<br />
N .A . 32,041 51,010 32, 413b<br />
Basin Bayou State<br />
Recreation Area<br />
Eden State Gardens<br />
N .A .<br />
N .A .<br />
43,493<br />
13,891<br />
33,792<br />
30,474<br />
1 7,099b<br />
32<br />
, 341a<br />
Grayton Beach State<br />
Recreation Area N .A . 80,410 35,137 43,015 b<br />
Ponce de Leon Springs<br />
State Recreation Area N .A . N .A . 14,765 33,906 a<br />
b Actual year-round full time entrance station figures .<br />
Seasonal sample counts .
Table R/T 27 . Florida boat registrations by type of vessel for FY 1965-66a<br />
(Florida Department of Natural Resources, Division of Administration 1980) .<br />
County Commercial Pleasure Total<br />
Bay 857 2,496 3,353<br />
Escambia 622 4,364 4,986<br />
Franklin 975 90 1,065<br />
Gulf 483 385 868<br />
Okaloosa 320 2,194 2,514<br />
Santa Rosa 323 873 1,196<br />
Walton 288 259 547<br />
Region 3,868 10,661 14,529<br />
Florida 32,927 136,706 169,633<br />
a Registration of boats in Florida began in 1959 . No data prior to 1965 .<br />
Table R/T 28 . Florida boat reaistrations by type of vessel for FY 1970-71<br />
( Florida Department of Natural Resources, Division of Administration 1980) .<br />
County Commercial Pleasure Total<br />
Bay 986 3,832 4,818<br />
Escambia 488 6,774 7,262<br />
Franklin 878 204 1,082<br />
Gulf 340 555 895<br />
Okaloosa 297 3,506 3,803<br />
Santa Rosa 209 1,414 1,623<br />
Walton 226 438 664<br />
Region 3,424 16,723 20,147<br />
Florida 27,197 206,896 234,093a<br />
a Includes 1,200 documented pleasure yachts .<br />
190<br />
1
Table R/T 29 . Florida boat registrations by type of vessel for FY 1975-76<br />
(Florida Department of Natural Resources, Division of Administration 1980) .<br />
County Commercial Pleasure Total<br />
Bay 969 8,342 9,311<br />
Escambia 642 11,619 12,261<br />
Franklin 920 523 1,443<br />
Gulf 307 1,055 1,362<br />
Okaloosa 361 6,760 7,121<br />
Santa Rosa 286 4,018 4,304<br />
Walton 141 1,432 1,573<br />
Region 3,626 33,749 37,375<br />
Florida 26,784 390,681 436,348a<br />
a Includes 18,883 registered boats which did not appear on county listings due<br />
to Department of Natural Resources computer problems .<br />
Table R/T 30 . Florida boat registrations by type of vessel for FY 1978-79<br />
(Florida Department of Natural Resources, Division of Administration 1980) .<br />
County Commercial Pleasure Total<br />
Bay 786 9,188 9,974<br />
Escambia 463 13,205 13,668<br />
Franklin 874 702 1,576<br />
Gulf 197 1,240 1,437<br />
Okaloosa 273 8,128 8,401<br />
Santa Rosa 328 4,958 5,286<br />
Walton 90 1,704 1,794<br />
Region 3,011 39,125 42,136<br />
Florida 20,477 453,500 480,953a<br />
a Includes 2,535 state, county and city-owned boats and 4,441 miscellaneous<br />
boats .<br />
191
Table R/T 31 . Leading metropolitan markets for outboard motors in 1978 and 1979<br />
(Boating Industry, The Boating Business 1979) .<br />
Estimated Estimated<br />
unit sales motors owned<br />
C i ty 9 8 ec . 9<br />
Minneapolis-St . Paul, MN 14,300 10,300 224,000<br />
Chicago, IL 8,500 6,700 171,000<br />
Detroit, MI 7,700 6,400 139,000<br />
Nassau, Suffolk, NY 8,800 6,200 173,000<br />
Dallas, Fort Worth, TX 6,000 5,800 127,000<br />
Houston, TX 6,100 5,800 131,000<br />
Seattle, Everett, WA 5,400 5,300 92,000<br />
Tampa, St . Petersburg, FL 5,500 5,200 108,000<br />
Milwaukee, WI 6,400 4,900 131,000<br />
Los Angeles, Long Beach, CA 3,800 4,100 89,000<br />
Philadelphia, PA 4,000 3,900 72,000<br />
New Orleans, LA 4,500 3,900 88,000<br />
Miami, FL 4,500 3,300 84,000<br />
Baltimore, MD 4,000 3,100 76,000<br />
New York, NY 3,200 3,100 75,000<br />
St . Louis, MO 2,400 2,900 69,000<br />
Atlanta, GA 3,600 2,800 53,000<br />
Pittsburg, PA 1,900 2,800 37,000<br />
San Francisco, Oakland, CA 3,300 2,600 64,000<br />
Boston, MA 3,100 2,600 80,000<br />
Kansas, City, MO 2,600 2,600 52,000<br />
District of Co lumbia 3,300 2,500 55,000<br />
Oklahoma City, OK 2,700 2,500 38,000<br />
Phoenix, AZ 2,400 2,500 42,000<br />
Portland, OR 2,300 2,500 47,000<br />
Jacksonville, FL 3,300 2,400 53,000<br />
Orlando, FL 2,500 2,400 45,000<br />
Fort Myers, FL 2,200 2,200 33,000<br />
Tulsa, OK 2,500 2,100 44,000<br />
W . Palm Beach, Boca Raton, FL 1,600 2,000 29,000<br />
Duluth, Superi or, MN 2,800 1,900 48,000<br />
Indianapolis, IN 1,900 1,900 41,000<br />
Charleston, SC 2,300 1,800 37,000<br />
Continued<br />
192
Table R/T 31 . Concluded .<br />
City<br />
Ft . Lauderdale-Hollywood, FL<br />
Memphis, TN<br />
Knoxville, TN<br />
San Antonio, TX<br />
Cleveland, OH<br />
Mobile, AL<br />
Birmingham, AL<br />
Baton Rouge, LA<br />
Shreveport, LA<br />
Buffalo, NY<br />
Flint, MI<br />
Norfolk, Virginia Beach, VA<br />
Portsmouth, VA<br />
Little Rock, AR<br />
Louisville, KY<br />
Grand Rapids,MI<br />
Lake Charles, LA<br />
Pensacola, FL<br />
Estimated<br />
unit sales<br />
1978 9<br />
Estimated<br />
motors owned<br />
ec . 9<br />
2,100 1,800 45,000<br />
2,300 1,700 49,000<br />
1,900 1,700 29,000<br />
1,800 1,700 29,000<br />
2,300 1,600 42,000<br />
2,300 1,600 33,000<br />
1,800 1,500 41,000<br />
2,700 1,400 44,000<br />
2,100 1,400 41,000<br />
2,000 1,400 39,000<br />
1,600 1,400 32,000<br />
2,000 1,300 31,000<br />
1,800 1,300 34,000<br />
1,800 1,300 31,000<br />
1,700 1,200 28,000<br />
1,700 1,000 19,000<br />
2,400 1,000 31,000<br />
193
~<br />
Table R/T 32 . Hunting and fishing licenses issued in gy 1954-55 (Florida Game and Fresh Water Fish<br />
Commission 1980a, 1980b) .<br />
Resident Non-resident Non-resident Resident<br />
County statewide fishing statewide fishing 14-day statewide fishing county hunting<br />
Bay 5,369 47 507 408<br />
Escambia 7,198 30 169 3,054<br />
Franklin 878 133 1,398 477<br />
Gulf 5,878 568 3,926 755<br />
Okaloosa 2,632 75 219 2,557<br />
Santa Rosa 1,292 21 106 1,679<br />
Walton 1,685 331 699 1,562<br />
Region 24,932 6,205 7,024 10,492<br />
Florida N .D . N .D . N .D . N .D .<br />
Continued
~ ~~<br />
Tab l e R/T 32 . Conc l uded .<br />
Resident Non-resident Non-resident<br />
County statewide hunting statewide hunting 10-day hunting<br />
Bay 2,127 3 21<br />
Escambia 3,111 4 10<br />
Franklin 195 0 34<br />
Gulf 478 9 40<br />
Okaloosa 1,219 20 75<br />
Santa Rosa 539 1 11<br />
Walton 397 27 22<br />
Region 8,066 64 213<br />
Florida N .D . N .D . N .D .
Table R/T 33 . Hunting and fishing licenses issued in FY 1959-60 (Florida and Game and Fresh Water<br />
Fish Comnission 1980a, 1980b) .<br />
Resident Non-resident Non-resident Resident<br />
County statewide fishing statewide fishing 14-day statewide fishing county hunting<br />
Bay 7,297 26 49 519<br />
Escambia 8,663 9 32 3,629<br />
Franklin 778 25 25 448<br />
Gulf 5,347 127 136 638<br />
Okaloosa 3,783 13 45 2,438<br />
Santa Rosa 2,658 3 36 2,100<br />
Walton 2,375 369 26 1,680<br />
Region 30,901 572 349 11,452<br />
~<br />
~ Florida N .D . N .D . N .D . N .D .<br />
Continued
1-4<br />
to<br />
14<br />
Table R/T 33 . Concluded .<br />
Resident Non-resident Non-resident<br />
County statewide hunting statewide hunting 10-day hunting<br />
Bay 2,661 5 17<br />
Escambia 3,993 3 17<br />
Franklin 222 1 31<br />
Gulf 719 3 29<br />
Okaloosa 1,572 6 36<br />
Santa Rosa 861 4 10<br />
Walton 845 25 30<br />
Region 10,873 47 170<br />
Florida N .D . N .D . N .D .
~<br />
Table R/T 34 . Hunting and fishing licenses issued in FY 1964-65 (Florida Game and Fresh Water<br />
Fish Conmission 1980a, 1980b) .<br />
Resident Non-resident Non-resident Non-resident<br />
County statewide fishing statewide fishing 14-day statewide fishing 5-day statewide fishing<br />
Bay 7,414 73 98 951<br />
Escambia 9,107 70 38 222<br />
Franklin 659 59 12 1,388<br />
Gulf 4,540 237 127 2,265<br />
Okaloosa 5,200 27 46 208<br />
Santa Rosa 4,086 45 28 286<br />
Walton 3,246 1,933 133 2,806<br />
Region 34,252 2,444 482 8,126<br />
00 Florida N .D. N .D. N .D. N .D .<br />
Continued
~<br />
~<br />
Table R/T 34 . Concluded .<br />
Resident Resident Non-resident Non-resident<br />
County county hunting statewide hunting statewide hunting 10-day hunting<br />
Bay 650 3,398 7 20<br />
Escambia 4,118 5,706 16 23<br />
Franklin 461 377 1 29<br />
Gulf 563 911 1 11<br />
Okaloosa 2,969 2,370 12 34<br />
Santa Rosa 2,790 1,326 22 23<br />
Walton 1,969 1,259 13 36<br />
Region 13,520 15,347 72 176<br />
Florida N .D . N .D . N .D . N .D .
Table R/T 35 . Hunting and fishing licenses issued in FY 1969-70 (Florida Game and Fresh Water Fish<br />
Comission 1980a, 1980b) .<br />
, County<br />
Resident<br />
statewide fishing<br />
Non-resident<br />
statewide fishing<br />
Non-resident<br />
14-day statewide fishing<br />
Non-resident<br />
5-day statewide fishing<br />
Bay 7,414 73 98 951<br />
Escambia 9,107 70 38 222<br />
Franklin 659 59 12 1,388<br />
Gulf 4,540 237 127 2,265<br />
Okaloosa 5,200 27 46 208<br />
Santa Rosa 4,086 45 28 286<br />
Walton 3,246 1,933 133 2,806<br />
Region 34,252 2,444 482 8,126<br />
o Florida N .D . N .D . N .D . N .D .<br />
Continued
N<br />
O ~<br />
Table R/T 35 . Concluded .<br />
Private Resident Resident Non-resident Non-resident<br />
County hunting preserve county hunting statewide hunting statewide hunting 10-day hunting<br />
Bay 5 588 4,769 11 74<br />
Escambia 0 4,345 6,218 29 38<br />
Franklin 0 359 405 3 18<br />
Gulf 0 497 962 3 31<br />
Okaloosa 0 2,510 3,656 19 43<br />
Santa Rosa 0 2,346 1,605 10 17<br />
Walton 0 1,657 935 10 15<br />
Region 5- 12,302 18,550 85 236<br />
Florida N .D . N .D . N .D . N .D . N .D .
Table R/T 36 . Hunting and fishing licenses issued in FY 1974-75 (Florida Game and Fresh Water Fish<br />
Commission 1980a, 1980b) .<br />
Resident Non-resident<br />
County statewide,fishing statewide fishing<br />
Non-resident Non-resident<br />
14-day statewide fishing 5-day statewide fishing<br />
Bay 13,260 195 154 1,381<br />
Escambia 12,928 376 93 442<br />
Franklin 1,291 123 44 1,016<br />
Gulf 4,918 583 152 2,470<br />
Okaloosa 8,515 102 84 382<br />
Santa Rosa 6,999 193 108 338<br />
Walton 3,952 1,257 165 1,682<br />
Region 51,863 2,829 800 7,711<br />
N Florida N .D . N .D . N .D . N .D .<br />
Continued
N<br />
O<br />
W<br />
Tab l e R/T 36 . Conc l uded .<br />
Private Resident Resident Non-resident Non-resident<br />
County hunting preserve county hunting statewide hunting statewide hunting 10-day hunting<br />
Bay 1 241 5,532 15 76<br />
Escambia 0 3,819 6,751 55 61<br />
Franklin 0 274 404 4 65<br />
Gulf 0 320 958 5 39<br />
Okaloosa 1 1,851 4,363 17 50<br />
Santa Rosa 5 1,935 2,036 13 16<br />
Walton 0 1,270 1,010 35 30<br />
Region 7 9,710 21,054 144 337<br />
Florida N .D . N .D . N .D . N .D . N .D .
Table R/T 37 . Hunting and fishing licenses issued in FY 1979-80 ( Florida Game and Fresh Water Fish<br />
Commission 1980a, 1980b)<br />
Resident Non-resident Resident Non-resident<br />
County statewide fishing statewide fishing 12-month statewide fishing 14-day statewide fishing<br />
Bay 8,912 232 990 82<br />
Escambia 5,742 457 4,792 77<br />
Franklin 484 85 180 8<br />
Gulf 2,398 791 701 65<br />
Okaloosa 4,298 140 3,212 43<br />
Santa Rosa 2,539 122 1,699 37<br />
Walton 2,113 1,506 937 103<br />
Region 26,486 3,333 12,511 415<br />
° Florida N .D. N .D. N .D. N .D .<br />
~<br />
Continued
Table R/T 37 Continued .<br />
County<br />
Non-resident<br />
5-day statewide fishing<br />
Resident Private Resident<br />
hunting and fishin.9 hunting preserve county hunting<br />
Bay 1,030 2,066 0 358<br />
Escambia 398 1,811 0 2,981<br />
Franklin 633 252 0 276<br />
Gulf 1,325 476 0 178<br />
Okaloosa 388 1,844 1 1,578<br />
Santa Rosa 187 997 7 1,533<br />
Walton 1,492 640 0 1,045<br />
Region 5,453 8,086 8 7,949<br />
Florida N .D . N .D . N .D . N .D .<br />
N<br />
C:> Continued<br />
Ln
pN<br />
d1<br />
Table R/T 37 . Concluded .<br />
County<br />
Resident Non-resident Non-resident Resident<br />
statewide hunting statewide hunting 10-day hunting county trapping<br />
Bay 4,321 5 529 19<br />
Escambia 5,926 45 340 25<br />
Franklin 476 3 92 13<br />
Gulf 852 1 61 43<br />
Okaloosa 3,991 7 258 26<br />
Santa Rosa 2,348 10 118 29<br />
Walton 1,054 11 112 43<br />
Region 18,968 82 1,510 198<br />
Florida N .D . N .D . N .D . N .D .
MINERAL AND OIL PRODUCTION (MP)<br />
207
∎<br />
ON<br />
F1<br />
N<br />
~<br />
®<br />
~<br />
MINERAL RESOURCES<br />
Peat<br />
Limestone<br />
Sand shell "coqufna",<br />
sometimes mixed with<br />
marl or clay<br />
Sand<br />
Phosphatic sands and<br />
clays, limestones, and<br />
fullers earth<br />
Dolomite<br />
Phosphate<br />
Sand clay<br />
and limestone<br />
® Sand with clay<br />
and kaolin<br />
®<br />
.~ W<br />
N<br />
, .<br />
; . .: :<br />
, ..<br />
Figure 14 . Florida mineral resources (Wood and Fernald 1974) .<br />
208<br />
1
Table MP 1 . Value ($) of all mineralsa produced, in order of value, for 1955,<br />
1960, 1965, 1970, 1975 and 1979 (U .S . Department of the Interior, Bureau of<br />
Mines 1958, 1961, 1967, 1972, 1978b, 1981) .<br />
County Ye ar Mineral ($)<br />
Bay 1955 Sand 26,139b<br />
1960 Sand and gravel D<br />
1965 Sand and gravel D<br />
1970 Sand and gravel D<br />
1975 Sand and gravel 474,000<br />
1979 Sand and gravel 663,000<br />
Escambia 1955 Sand, gravel and clay N .D .<br />
1960 Sand and gravel 356,812<br />
1965 Sand, gravel and clay 450,000<br />
1970 Sand, gravel and clay D<br />
1975 San~, gravel and clay 680,000<br />
Franklin 1955 NRP N .A .<br />
1960 NRP N .A .<br />
1965 Sand and gravel D<br />
1970 Sand and gravel D<br />
1975 NRP N .A .<br />
1979 NRP N .A .<br />
Gu l f 1955 NRP N .A .<br />
1960 Magnesium compounds, lime D<br />
1965 Magnesium compounds, lime D<br />
1970 Magnesium compounds, lime D<br />
1975 Magnesium compounds, lime D<br />
1979 Magnesium compounds, lime D<br />
Okaloosa 1955 NRP N .A .<br />
1960 NRP N .A .<br />
1965 NRP N .A .<br />
1970 Sand and gravel D<br />
1975 Sand and gravel D<br />
1979 Sand and gravel 33,000<br />
S'anta Rosa 1955 NRP N .A .<br />
1960 NRP N .A .<br />
1965 NRP N .A .<br />
1970 Petroleum D<br />
1975 Natural gas, sand and gravel D<br />
1979 Sand and gravel D<br />
Walton 1955 NRP N .A .<br />
1960 Oystershell D<br />
1965 Oystershell, sand and gravel D<br />
1970 Oystershell, sand and gravel D<br />
1975 Sand and gravel 269<br />
1979 Sand and gravel D<br />
Continued<br />
209
Table MP 1 . Concluded .<br />
County Year Mineral ($)<br />
Florida 1955 All minerals 108,957,000<br />
1960 All minerals 176,920,000<br />
1965 All minerals 249,320,000<br />
1970 All minerals 300,042,000<br />
1975 All minerals 1,775,500,000<br />
1979 All minerals 1,098,772,000<br />
b Excludes peat, petroleum and natural gas .<br />
Figures withheld to avoid disclosure of individual establishments .<br />
c No production report .<br />
210
A A H<br />
A H<br />
E H<br />
lA l`.<br />
. . ~. 6w ~ . . . . . . .,; Am<br />
C G G G<br />
E E<br />
G G O<br />
A<br />
A Sand and Gravel Pit<br />
8 Peat Producer<br />
C Limestone Quarry<br />
D Dolomite Quarry<br />
E Clay Mine<br />
F Kaolin Mine<br />
G Fullers Earth Mine<br />
H Petroleum Field<br />
V<br />
I Phoephate, Land Pebble Mine<br />
J Phoaphate, Soft Rock Mine<br />
K Heavy Mineral Send Mine<br />
L Portland Cement Plant<br />
M Lime Kiln<br />
~<br />
~ K<br />
A C K<br />
C<br />
A<br />
C<br />
K A<br />
K C<br />
A ~<br />
C<br />
~<br />
C A A C CC<br />
D ~ A CA<br />
A C<br />
~ 9 A<br />
C C I<br />
CC<br />
A<br />
t<br />
A C<br />
I A<br />
A ~ K ~IA A<br />
C l A I t A A A<br />
1 Itll C<br />
AA I 1 1 A<br />
iD<br />
10 HH<br />
Figure 15 . Florida mineral industries (Wood and Fernald 1974) .<br />
211<br />
#<br />
td<br />
C<br />
CA<br />
CA<br />
C~<br />
HH CC<br />
CH CCI<br />
.•<br />
C<br />
CC<br />
CC<br />
CC<br />
CCA a ~<br />
llM<br />
CC ~<br />
/
Table MP 2 . Non-fuel mineral production and value ( $) in Florida for 1955,<br />
1960, 1965, 1970, 1975 and 1979 (U .S . Department of the Interior, Bureau of<br />
Mines 1958, 1961, 1967, 1972, 1978b, 1981) .<br />
Mineral Year Quanity produceda ($)<br />
Sand and gravel 1955 5,065,503 4,349,148<br />
1960 6,757,000 5,559,000<br />
1365 7,298,000 6,377,000<br />
1970 12,482,000 12,254,000<br />
1975 13,237,000 20,199,000<br />
Phosphate rock<br />
1979<br />
1955<br />
21,708,000b<br />
8,747,282<br />
39,520,000<br />
53,640,301<br />
1960 12,321,000 82,530,000<br />
1965 19,253,000 141,258,000<br />
1970 N .D . N .D .<br />
1975 N .D . N .D .<br />
Stone<br />
1979 N .D . N .D .<br />
(including limestone) 1955 17,027,967 22,966,008<br />
1960 27,629,000 37,419,000<br />
1965 35,730,000 41,148,000<br />
1970 43,089,OOOd 61,302,000<br />
1975 39,071,000 73,372,000<br />
1979 De D<br />
Clays 1955 412,766 4,815,855<br />
1960 252,000 6,357,000<br />
1965 651,000 9,752,000<br />
1970 872,000 12,661,000<br />
1975 712,000 17,063,000f<br />
1979 681,000 31,308,000<br />
Peat 1955 61,098 231,829<br />
1960 39,275 162,000<br />
1965 19,253 109,000<br />
1970 46,000<br />
304,000<br />
1975 82,000g 1,037,000<br />
1979 153,000 2,190,000<br />
b Short tons except where otherwise specified .<br />
Long tons .<br />
d Excludes dimension limestone .<br />
Excludes dimension stone and shell .<br />
f Figures withheld to avoid disclosure of individual establishments .<br />
Excludes value of kaolin .<br />
g Source document gave two figures : page 191 (82,000) page 204 (100,895) .<br />
The value from both pages is shown above .<br />
212
Table MP 3 . Mjrketable production of phosphate rock ($) in Florida for 1955,<br />
1960 and 1965 (U .S . Department of the Interior, Bureau of Mines 1958, 1961,<br />
1967, 1972, 1978b, 1981) .<br />
Hard rock Soft rock<br />
Year Long tons Long tons<br />
1955 91,200 733,800 69,788 452,301<br />
1960 77,000 670,000 47,000 384,000<br />
1965 69,900 693,000 29,216 226,844<br />
Land pebble Total<br />
Year Long tons ~- Long tons<br />
1955 8,586,294 52,454,200 8,747,282 53,640,301<br />
1960 12,197,000 81,476,000 12,321,000 82,530,000<br />
1965 19,153,835 140,337,900 19,252,931 141,257,744<br />
a No data after 1965 .<br />
213
Table MP 4 . Phosphate reserves and resources for the world, the United States<br />
and central Florida (million metric tons) (U .S . Department of the Interior,<br />
Bureau of Mines 1978b) .<br />
Measured Identified Total<br />
Location reserves sub-economic resources resources<br />
Worlda 15,207 49,188 74,395<br />
United Statesa 2,902 1,506 4,408<br />
Central Floridaa 907 635 1,542<br />
Polk Countyb 403 95 498<br />
Hillsborough Countyb 181 14 195<br />
Hardee Countyb 176 299 475<br />
Manatee Countyb 164 150 314<br />
DeSoto Countyb 16 64 80<br />
b 1976 figures .<br />
1973 figures .<br />
214
Table MP 5 . Active sand producers in Northwest Florida (Florida Department<br />
of Environmental Regulation, Bureau of Water Management 1980a) .<br />
County and producer<br />
Bay County<br />
Calloway Pit<br />
Calloway Sand Co .<br />
Hutchinson Pit<br />
Florida Asphalt Paving Co .<br />
Register Pit<br />
Florida Asphalt Paving Co .<br />
Gulf Asphalt Pit<br />
Gulf Asphalt Corp .<br />
Lynn Haven Mine<br />
Pitts Sand Co .<br />
Escambia County ,<br />
Campbell Sand and Gravel<br />
Pensacola Mine<br />
Clark Sand Co . (2 mines)<br />
Escambia Pit<br />
Ed Chadbourne, Inc .<br />
Okaloosa County<br />
Dorcas Pit<br />
Morrell Sand Co .<br />
Walton County<br />
Adams Mine<br />
Adams Sand Co .<br />
215
Table MP 6 . Florida's Non-fuel mineral supply ($) in 1978 (U .S . Department of<br />
the Interior, Bureau of Mines 1978c)<br />
% of U .S .<br />
Commodity output<br />
Rank in<br />
nation Reserves<br />
Fuller's earth 37 1 moderate<br />
Phosphate rocka 86 1 moderate<br />
Rare-earth concentrates Db 2 small<br />
Staurolite 100 1 small<br />
Stone, crushed 5 4 large<br />
Titanium minerals D 1 moderate<br />
Zircon 100 1 small<br />
b Includes North Carolina .<br />
Data withheld to avoid disclosure of individual establishments .<br />
Table MP 7 . Crude petroleum and natural gas production and value in dollars ($)<br />
for Florida for 1955, 1960, 1965, 1970, 1975 and 1979 (U .S . Department of the<br />
Interior, Bureau of Mines 1958, 1961, 1967, 1972, 1978b, 1981) .<br />
Crude petroleum Natural gas<br />
Year Quantitya ($) Quantityb ($)<br />
1955 495 Dc 36 4,000<br />
1960 368 D 30 5,000<br />
1965 1,464 D 107 14,000<br />
1970 2,999 D N .D . N .D .<br />
1975 41,877 490,258,000 44,383 43,185,000<br />
1979 N .D . N .D . .N .D . N .D .<br />
b Thousand birrels .<br />
Million ft .<br />
c Figures withheld to avoid disclosure of individual establishments .<br />
216
Table MP 8 . Natural gas production (1000 ft3)by field for 1970a, 1975 and<br />
1979 (Florida Department of Administration, State Energy Office 1978 ; Curry ca .<br />
1980) .<br />
Field and county 1970 Cumulative 1975 Cumulative<br />
Blackjack Creekb 0 0 4,113,862 4,121,865<br />
S8nta Rosa<br />
Jay 9,828 9,828 39,343,578 87,003,857<br />
Santa Rosa<br />
Escambiad<br />
Mt . Carmel 0 0 550,238 571,439<br />
Santa Rosa<br />
Sweetwater Creeke 0 0 0 0<br />
Region 9,828 9,828 44,007,678 91,697,161<br />
Florida 435,869 2,105,511 44,387,541 135,515,010<br />
Field and county 1979 Cumulative<br />
Blackjack Creek 4,999,540 24,333,621<br />
Santa Rosa<br />
Jay 48,169,488 304,659,074<br />
Santa Rosa<br />
Escambia<br />
Mt . Carmel 611,180 3,375,619<br />
Santa Rosa<br />
Sweetwater Creek 5,384 11,920<br />
Region 53,785,592 332,380,234<br />
Florida 54,162,641 337,881,773<br />
b Production in these fields did not begin prior to 1970 .<br />
Production began in 1972 .<br />
a Production began in 1970 .<br />
Production began in 1971 .<br />
e Production began in 1977 .<br />
217
760<br />
600<br />
500<br />
.<br />
~ 400<br />
8<br />
~ 3°°<br />
200<br />
100<br />
.<br />
.,<br />
Ollproductlon<br />
curve<br />
.<br />
Oas productlon<br />
• ., curve<br />
., • .<br />
•• .<br />
• •• .• .•••• . .•••<br />
1975 1960 1985 /990 1995 2000<br />
7<br />
6<br />
5<br />
8<br />
4 U.<br />
a<br />
r3<br />
3 ~<br />
z<br />
~<br />
Figure 16 . 0i1 and gas roduction curves for the Gulf of Mexico to the year<br />
2000 (Rogers et al . 1979~ .<br />
218<br />
2<br />
1
AIAtAMA<br />
A<br />
:C M'IOIfnP..$<br />
na ~<br />
~ JACk3Cn<br />
Y tkaitun iasnin<br />
~ iOn<br />
Cai -<br />
noun<br />
,/ay lit<br />
Bay<br />
Blackjack Cnek G -!! F<br />
Mt. Carmel * ill<br />
8ereetwata Creac (p & a 19e0q<br />
GEORGIA<br />
/ ; Hami :-<br />
Leon<br />
`" Mad se^ ton<br />
~L<br />
~ S: ;wan [~aMer.<br />
-T'21inr<br />
Cu vai<br />
, }ayb'ty C:BF .,<br />
"[tfUS<br />
HFrnan(10<br />
Pa i0C<br />
Maricm<br />
~ L.ake<br />
-<br />
aliiild<br />
Table MP 9 . Crude oil production (bbl) by field for 1970a, 1975 and 1979<br />
(Florida Department of Administration, State Energy Office 1978 ; Curry ca .<br />
1980) .<br />
Field and county 1970 Cumulative 1975 Cumulative<br />
Blackjack Creekb 0 0 4,596,936 4,632,590<br />
S 2 nta Rosa<br />
Jay 6,819 6,819 31,693,227 103,509,989<br />
Santa Rosa<br />
Escambiad<br />
Mt . Carmel 0 0 565,160 1,146,882<br />
Santa Rosa<br />
Sweetwater Creeke 0 0 0 0<br />
Region 6,819 6,819 36,855,323 109,289,461<br />
Florida 2,992,335 19,400,672 41,680,509 151,972,650<br />
Field and county 1979 Cumulative<br />
Blackjack Creek 5,761,034 27,378,548<br />
Santa Rosa<br />
Jay 38,738,779 247,123,062<br />
Santa Rosa<br />
Escambia<br />
Mt . Carmel 609,261 3,422,879<br />
Santa Rosa<br />
Sweetwater Creek 3,283 5,329<br />
Region 45,112,357 277,929,818<br />
Florida 49,811,599 340,423,804<br />
h Production in these fields did not begin prior to 1970 .<br />
Production began in 1972 .<br />
c Production began in 1970 .<br />
d Production began in 1971 .<br />
e Production began in 1977 .<br />
220
l, Jacksonville<br />
-- ---- - Panama City A<br />
ltFl' ~<br />
0 0 ~4 ^<br />
Gulf of Mexico<br />
%<br />
OG ',<br />
~ Florida ~<br />
0<br />
a A<br />
Tampa<br />
~~ Lake Okeechobee<br />
∎ Actlve Ieases Ft . Myers<br />
~ Expired Isases<br />
El<br />
Proposed tracts for sa/es Afl8 and 88<br />
Proposed tracts fw sale 67<br />
.d~ Proposed tracts for sale 89<br />
- o _-_<br />
. e<br />
=- - _ ==<br />
Area of Industry Interest ~ge<br />
0 50 ~~<br />
Statute miles<br />
Figure 18 . Status of OCS lease areas off the Florida Gulf Coast (U .S .<br />
Department of the Interior, Bureau of Land Management 1980 ; Southwest Florida<br />
Regional Planning Counci1 .1481) .<br />
221<br />
~
N<br />
N<br />
N<br />
Table MP 10 . Oil and gas drilling permits since 1973 (Florida Department of Natural Resources, Division of<br />
Resource Management 1980) .<br />
Permit APIa number<br />
County number approved Date approved Operator<br />
Bay<br />
Escambia<br />
1006<br />
1010<br />
694<br />
707<br />
573A<br />
573B<br />
09-005-20003<br />
09-055-20004<br />
09-033-20024<br />
09-033-20025<br />
09-033-20016-01<br />
09-033-20016-02<br />
03-04-80 Houston Oil and Mineral Corp .<br />
Southwest Forest Industries<br />
Unit 13-3 Well #1<br />
04-15-80 Houston Oil and Mineral Corp .<br />
Southwest Forest Industries<br />
Unit 13-3 Well #1<br />
09-04-73<br />
11-06-73<br />
08-29-72<br />
02-17-75<br />
883 09-033-20028 03-22-77<br />
884 09-033-20029 03-22-77<br />
918 09-033-20030 10-18-77<br />
943 09-033-20031 05-02-78<br />
945 09-033-20032 05-16-78<br />
946 09-033-20033 05-16-78<br />
948 09-033-20034 07-05-78<br />
708 09-033-20026 11-06-73<br />
790 09-033-20035 05-20-75<br />
977 09-033-20036 04-17-79<br />
Continued<br />
Petrol Co . #1<br />
Stacey Unit 14-3<br />
LL&E McDavid Lands 3-2 #1<br />
Exxon McDavid Lands 35-2A<br />
(Sidetracked hole)<br />
Exxon McDavid Lands 35-2A<br />
(Sidetracked hole)<br />
Exxon McDavid Lands #7-5<br />
Exxon McDavid Lands #31-2<br />
Exxon McDavid Lands #1-2<br />
Exxon Scott Paper Co . #1-2<br />
Exxon Epstein McMillan #35-4<br />
Exxon W .H . Crapps #36-3<br />
Exxon McDavid Lands #30-2B<br />
L .L .E . James Nichol son #10-1<br />
Unit #1<br />
L .L E . Vulcan Materials et al . Unit<br />
22-2, Well #1<br />
Exxon McDavid Lands et al . Well<br />
# 31-3
Table MP 10 . Continued .<br />
Permit API number<br />
County number approved Date approved Operator<br />
1027 09-033-20037 10-21-80<br />
Okaloosa 731 09-091-20003 03-19-74<br />
807 09-091-20004 10-21-75<br />
970 09-091-20005 09-18-79<br />
n~ Santa Rosa 729 09-113-20135 03-19-74<br />
w 728 09-113-20136 03-19-74<br />
739 09-113-20137 05-21-74<br />
750 09-113-20138 09-04-74<br />
763 09-113-20139 11-26-74<br />
771 09-113-20140 02-04-75<br />
773 09-113-20141 05-20-75<br />
791 09-113-20142 05-20-75<br />
796 09-113-20143 09-09-75<br />
805 09-113-20144 09-23-75<br />
Continued<br />
Chevron, U .S .A . La Floresta<br />
Unit 2-1, Well #1<br />
Cabot Corp . U .S .A . State<br />
Forest 1-9<br />
Cleary Petroleum, Coleman<br />
Kelly Trust #1<br />
Peninsula Resources Corp .<br />
Mattie Kelly Sims et al .<br />
Trustees #1<br />
Exxon D .M . Kirkl and et al .#11<br />
Exxon W .W . Foskett # 25-N<br />
Amerada Hess MS-FL, J .E . Golden<br />
# 4-1 # 1<br />
Callon Hendricks-Helms # 36-3 # 1<br />
Belco Petroleum Corp . Obie E .<br />
Willis #1<br />
Watson Oil Corp . Gordon Wells<br />
et al . Well #1<br />
Amax Petroleum Corp . #1,<br />
E .H . Estes Unit 26-1<br />
Exxon Jay, Lec Unit Salt<br />
Water Disposal System 5 Well #1<br />
Texas Gas Exploration Co .<br />
R .J . Pitts 6-4 #1<br />
Pruet and Hughes Co . #1<br />
Floyd Unit 6-2
N<br />
N<br />
4-1%<br />
Table MP 10 . Continued .<br />
County<br />
Santa Rosa<br />
Permit<br />
number<br />
API number<br />
approved Date approved Operator<br />
808 09-113-20145 12-02-75 Exxon Jay, LEC Unit, Saltwater<br />
Disposal System #1, Well #2<br />
811 09-113-20146 12-16-75 Marion Corp ., W .H . Hendrick et al .,<br />
Unit 3-1, Well #1<br />
815 09-113-20147 03-23-76 Exxon, St . Regis Paper Co .<br />
15-W (water injection)<br />
855 09-113-20148 09-22-76 Tesoro, L .L .& E, Dalco, St . Regis<br />
Paper Co . #1, 9-3<br />
860 09-113-20149 11-04-76 Tesoro, L .L .& E . & Dalco #1, #16-2<br />
861 09-113-20150 11-04-76 Tesoro, L .L .& E . & Dalco #1, #8-4<br />
863 09-113-20151 11-16-76 Dallas Exploration, McRae et al ., #36-2<br />
881 09-113-20152 01-06-77 Houston Oil, W .M . Stokes #15-2<br />
882 09-113-20154 03-22-77 Exxon Douglas Polk #41-1<br />
886 09-113-20153 04-07-77 Exxon St . Regis Paper #13-W<br />
889 09-113-20155 05-17-77 Houston H . Hanna #9-3<br />
890 09-113-20156 05-17-77 Houston #1 U .S .A . State Forest #15-3<br />
891 09-113-20157 06-07-77 Houston U .S .A . State Forest #14-3<br />
910 09-113-20158 07-19-77 Exxon C . Higdon #19-5<br />
911 09-113-20159 08-16-77 Pennzoil U .S .A . State Forest #5-2<br />
912 09-113-20160 09-06-77 Pennzoil Cooley Unit #25-1<br />
991 09-113-20184 11-06-79 Exxon McDavid Lands et al .,<br />
Well #38-2<br />
992 09-113-20185 11-06-79 Exxon St . Regis Paper Co .<br />
Well #14-3<br />
995 09-113-20186 01-08-80 Exxon W . R . Polk, Well #18-4<br />
1002 09-113-20187 02-05-80 Exxon R .D . Scott, Well #41-5<br />
1004 09-113-20188 03-04-80 Exxon Martha Murphy Well #10-6<br />
Continued
N<br />
N<br />
C7l<br />
Table MP 10 . Concluded .<br />
Permit API number<br />
County number approved Date approved Operator<br />
Santa Rosa 1005 09-113-20189<br />
1013 09-113-20190<br />
1021 09-113-20191<br />
Walton County 793 09-131-20006<br />
a American Petroleum Institute .<br />
793A 09-131-20007<br />
874 09-131-20008<br />
932 09-131-20009<br />
03-04-80 Exxon A .E . Kelly, Well #7-7<br />
06-03-80 Exxon D .R . Simmons #19-6<br />
09-26-80 Exxon St . Regis Paper Co .<br />
Well #9-5<br />
07-15-75 Texas-Gas Exploration Corp .<br />
D .E . Wi l kerson Wel l#1<br />
Texas Gas Exploration Corp .<br />
D .E . Wi l kerson Wel l#1-A<br />
12-07-76 Milton J . Bernos, Olen L . Miller #1<br />
01-17-78 Marion Corp . Sealy Heirs #1
N<br />
N<br />
Table MP 11 . OCS oil and gas lease sales in dollars ($) in Florida for selected dates (Exxon Company U .S .A .<br />
1980) .<br />
Offered Leased<br />
Date of<br />
sale<br />
Sale<br />
number<br />
Number of<br />
tracts Acres<br />
Number of<br />
tracts Acres<br />
Total<br />
bonus<br />
($)<br />
02-26-59 5 80 458,000 23 132,480 1,711,872<br />
12-20-73 32 85 489,600 62 357,120 1,100,399,131<br />
02-08-76 41 60 350,292 4 23,040 4,040,000<br />
10-31-78 65 71 408,334 28 161,280 43,823,730<br />
Total first year Average bid Highest bid<br />
Date rental per acre per acre<br />
($) ($) ($)<br />
05-26-59 397,440 13.00 16 .00<br />
12-20-73 1,071,360 3,081 .00 36,805 .00<br />
02-08-76 69,120 175 .00 280 .00<br />
10-31-78 483,840 272 .00 1,422 .00
Table MP 12 . Crude oil and natural gas reserves and production in Florida for 1955, 1960, 1965, 1970, 1975,<br />
1977 and 1979 (Florida Department of Administration, State Energy Office 1978) .<br />
Oil Gas<br />
stimate recovera e Cumulative stimate recovera e Cumulative<br />
Year reserves (bbl) production (bbl) reserves (Mcf) production (Mcf)<br />
1955 14,525,219 4,350,228 1,452,656 443,256<br />
1960 12,384,111 6,491,336 1,238,556 647,356<br />
1965 21,347,433 9,828,014 1,902,936 966,976<br />
1970 382,468,433 19,400,672 405,407,461 2,105,511<br />
N<br />
N<br />
1975 302,461,451 151,972,650 312,796,384 135,515,010<br />
" 1977 211,687,025 243,075,980 216,208,122 232,124,782<br />
1979 N .D . 340,423,804 N .D . 337,881,773
Table MP 13 . Estimated crude oil and natural gas reserves in 1972-77 (Florida<br />
Department of Administration, State Energy Office 1978) .<br />
Crude oil reserves<br />
Year Recovery Origina in p ace Origina<br />
Field and county discovered (%) (bbl) recoverable (bbl)<br />
Blackjack Creek 1972 40 100,500,000 40,200,000<br />
Santa Rosa<br />
Jay 1970 42 763,129,638 320,514,448<br />
Santa Rosa<br />
Escambia<br />
Mt . Carmel 1971 20 17,500,000 3,500,000<br />
Santa Rosa<br />
Sweetwater Creek 1977 10 624,116 62,412<br />
Santa Rosa<br />
Region N .D . 881,753,754 364,276,860<br />
Florida 41 1,120,525,179 454,763,005<br />
Natural gas reserves<br />
rigina in p ace rigina recovera e<br />
Field and county (Mcf) (Mcf)<br />
Blackjack Creek 91,455,000 36,582,000<br />
Santa Rosa<br />
Jay 953,912,048 400,643,060<br />
Santa Rosa<br />
Escambia<br />
Mt . Carmel 17,500,000 3,500,000<br />
Santa Rosa<br />
Sweetwater Creek 124,823 12,482<br />
Santa Rosa<br />
Region 1,062,991,871 440,737,542<br />
Florida 1,082,608,605 448,332,904<br />
228
Table MP 14 . Gulf of Mexico OCS oil and gas resource and reserve estimates in<br />
1979 ( U .S . Department of the Interi or, U .S . Geolog ical Survey ca . 1981) .<br />
Undiscovered recoverable Oil Gas<br />
estimates (mean) (billion bbl) (trillion ft3)<br />
Western Gulf of Mexico<br />
(Main pass area and W .)<br />
0-2,500 m water depth 5.2 69 .0<br />
Eastern Gulf of Mexico<br />
(East of main pass area)<br />
0-2,500 m water depth 1.3 2 .9<br />
Reserves 2.8 37 .2<br />
Table MP 15 . Dollar value of mineral production as a percent of the State total<br />
for 1965, 1975 and 1976 (U .S . Department of the Interior, Bureau of Mines 1965,<br />
1979) .<br />
1965 1975 1976<br />
Florida 249,320,000 1,095,042,000 1,652,232,000<br />
Northwest Florida region 357,000 1,802,000 537,332,000<br />
Region value as<br />
% of State .14 .16 .32<br />
229
Table MP 16 . Value ($) of mineral production for 1960 and 1975 (U .S . Department<br />
of the Interior, Bureau of Mines 1960, 1965, 1970, 1975) .<br />
County 1960 1975<br />
Bay Da 474,000<br />
Escambia 356,812 759,000<br />
Franklin D D<br />
Gulf D D<br />
Okaloosa D D<br />
Santa Rosa D D<br />
Walton N .D . 269,000<br />
Region 356,812<br />
1,502,000<br />
Table MP 17 . Mineral production establishments and employment by county in<br />
1972 ( U .S . Department of Commerce 1973) .<br />
Number of establishments Number of<br />
i an Gas on-meta ic employees<br />
County extraction minerals Total (range)<br />
Bay 4 1 5 0-19<br />
Escambia 14 2 16 0-99<br />
Gulf 2 0 2 0-19<br />
Okaloosa 2 2 4 0-19<br />
Santa Rosa 26 0 26 0-99<br />
Walton 4 0 4 0-19<br />
Region 50 5 57 N .D .<br />
Florida N .D. N .D. 277 N .D .<br />
230
Table MP 18 . Mississippi, Alabama and Florida (MAFLA) lease sales for 1959,<br />
1973, 1976 and 1978 (U .S . Department of the Interior, U .S . Geological Survey<br />
ca .1981) .<br />
MAFLA<br />
um er o P um e.r of Percentage<br />
Lease sale Date tracts offered tracts leased leased<br />
05a 02/26/59 80b 23 29<br />
32 12/20/73 85 (147)c 62 (87) 67 (59)<br />
41 02/18/76 60 (132) 4 (34) 7 (26)<br />
65 10/28/78 71 (89) 28 (35) 39 (39)<br />
Summary 296 (448) 117 (179) 40 (40)<br />
MAFLA<br />
Acres Acres ercen age<br />
Lease sale Date offered leased leased<br />
05 02/26/59 458,000 (817,297) 32,480 (485,396) 29<br />
32 12/20/73 489,600 (687,603) 357,120 (161,285) 73 (59)<br />
41 02/18/76 350,292 (511,709) 23,040 (201,294) 7 (23)<br />
65 10/28/78 408,334 161,280 39 (39)<br />
Summary 1,706,226 (2,474,609) 673,920 (980,455) 39 (40)<br />
a L .S . number 5 is not considered part of MAFCA, however, all leasing activity<br />
was adjacent to Florida .<br />
b Figures shown without parenthesis represent data for Florida only .<br />
c Figures shown in parenthesis represent data for all MAFLA .<br />
231
Table MP 19 . Factors affecting the number and locations of onshore support<br />
f acilities ( New Eng'land River Basins Commission 1976) .<br />
Location of oil and gas field<br />
Size of oil and gas field<br />
Topography of oil and gas field<br />
Depth of water<br />
Whether both oil and gas are found<br />
Availability of coastal frontage (land)<br />
Availability of additional (back-up) land<br />
Proximity to existing refineries and processing plants<br />
Proximity to diverse urban areas and markets<br />
Public services and facilities (schools, hospitals)<br />
Labor markets (areas without strong labor unions are preferred)<br />
Public opinion<br />
Availability of entertainment<br />
Proximity to airport or landing strip<br />
Table MP 20 . Types and quantities of materials transported offshore for one-year<br />
periods (New England River Basins Commission 1976) .<br />
Materials<br />
Type Quantity<br />
Fuel 10,000-15,000 bbl<br />
Drilling mud 2,000-5,000 tons<br />
Cement 1,000-3,000 tons<br />
Fresh water 5,000,000-7,500,000 gal<br />
Tubular goods 2,000-3,000 tons<br />
232
Table MP 21 . General requirements for locating service bases, and potential<br />
environmental and economic impacts (New England River Basins Commission 1976) .<br />
Item Requirements/Pollutants/Economics<br />
Site Considerations<br />
Land : Temporary base 2-6 ha (5-15 acres)<br />
Permanent base 10-40 ha (25-100 acres)<br />
Berthage 60-186 m (200-600 ft) water frontage<br />
5-6 m (15-20 ft) depth (draft)<br />
Transportation Airport, heliport nearby<br />
Water, excellent vessel accessibility<br />
Rail, desirable<br />
Road, adequate accessibility<br />
Economic Cost of land<br />
Proximity to related industries<br />
Environmental Impacts<br />
Air emission<br />
Wastewater contaminants<br />
Solid wastes<br />
Noise<br />
Economic Impacts<br />
Labor<br />
Wages<br />
Capital investment<br />
Hydrocarbons<br />
Carbon monoxide<br />
Nitrogen oxides<br />
Hydrocarbons<br />
Heavy metals<br />
Up to 6 tons per day during<br />
drilling hazardous, oil<br />
contaminated, etc .<br />
Up to 85 dB on a 24 hour basis<br />
50-50 jobs/platform during drilling<br />
20-30 jobs/platform during production<br />
$750,000-$1,000,000/year<br />
Temporary base-$200,000-$300,000<br />
Permanent base-$2 million-$5 million<br />
233
Table MP 22 . General requirements for locating shore facilities associated with<br />
pipelines, and potential environmental and economic impacts (New England<br />
River Basins Commission 1976) .<br />
Item Requirements/Pollutants/Economics<br />
Site Considerations<br />
Land : Pipeline easement (on shore)<br />
Pipecoating yard<br />
Pumping station (if required)<br />
Waterfront<br />
Wa ter<br />
Environmental Impacts<br />
15- 30 m( 50-100 f t)<br />
20-68 ha (50-150 acres)<br />
16 ha (40 acres)<br />
Air emission Hydrocarbons<br />
Sulfur oxides<br />
Nitrogen oxides<br />
Particulates<br />
Carbon monoxide<br />
Wastewater contaminants<br />
Solid wastes<br />
Noise<br />
Economic Impacts<br />
Labor<br />
Wages<br />
Capital investment<br />
234<br />
15-30 m(50-100 ft) for landfall<br />
232 m (750 ft) for pipe coating<br />
yard, depth at least 3 m (10 ft)<br />
11,350-56,775 liters (3,000-15,000)<br />
Alkaline substances<br />
Hydrocarbons<br />
Particulates<br />
Metal fragments<br />
Concrete<br />
Contaminated debris<br />
Packaging materials<br />
Metal scraps<br />
Up to 100 dB on a 24 hour basis<br />
250-300 jobs/pipeline during<br />
construction<br />
100-200 jobs at pipecoating yard<br />
during pipeline construction<br />
$5 million-$6 million/year for<br />
pipeline construction<br />
$1 .5 million-$3 million for<br />
pipecoating yard during<br />
construction<br />
$8 million-$10 million for<br />
pipecoating yard
Table MP 23 . General requirements for locating berthing facilities, and<br />
potential environmental and economic impacts (New England River Basins<br />
Commission 1976) .<br />
Item<br />
Site Considerations<br />
Land : Terminal<br />
Tank farm<br />
Berthage<br />
Water<br />
Environmental Impacts<br />
Air emission<br />
Wastewater contaminants<br />
Economic Impacts<br />
Labor<br />
Wages<br />
Capital investment<br />
Requirements/Pollutants/Economics<br />
20-30 ha (50-75 acres)<br />
8-30 ha (20-75 acres)<br />
Approximately 304 m (1000 ft) for pier<br />
Potable water<br />
Purging<br />
Hydrocarbons<br />
Carbon monoxide<br />
Oil and grease<br />
High BOD<br />
High COD<br />
25-75 jobs<br />
$500,000-$1,000,000/year<br />
$15 million-$50 million<br />
235
Table MP 24 . General requirements for onshore processing and treatment<br />
facilities, and potential environmental and economic impacts (New England<br />
River Basins Commission 1976) .<br />
Item<br />
Site Considerations<br />
Land<br />
Wa ter<br />
Environmental Impacts<br />
Air emission<br />
Wastewater contaminants<br />
Solid wastes<br />
Noise<br />
Economic Impacts<br />
Labor<br />
Wages<br />
Capital investment<br />
Requirements/Pollutants/Economics<br />
20-30 ha (50-75 acres)<br />
200,000-750,000 gal/d<br />
Carbon monoxide<br />
Hydrocarbons<br />
Hydrogen sulfides<br />
Nitrogen oxides<br />
Particulates<br />
Sulfur oxides<br />
Oil and grease<br />
Heavy metals<br />
Phenols<br />
Halogens<br />
Chromium<br />
Sulfuric acid<br />
Phosphates<br />
Chlorine<br />
Zinc<br />
Scale and sludge<br />
Oil absorbents<br />
Spent desiccants<br />
Up to 100 db on a 24 hour basis<br />
50-60 jobs<br />
$750,000-$1,000,000/year<br />
$50 million-$200 million<br />
236
Table MP 25 . General requirements for locating oil refineries, and potential<br />
environmental and economic impacts (New England River Basins Commission 1976) .<br />
Item<br />
Site Considerations<br />
Land<br />
Water<br />
Environmental Impacts<br />
Air emission<br />
Requirements/Pollutants/Economics<br />
200-800 ha (500-2,000 acres)<br />
5-10 million gal/d<br />
Ammonia<br />
Aldehydes<br />
Carbon monoxide<br />
Hydrocarbons<br />
Particulates<br />
Sulfur oxides<br />
Wastewater contaminants Acids and caustics<br />
Floating and dissolved oil<br />
Dissolved solids<br />
Dissolved organics<br />
Cyanide<br />
Chromate<br />
Economic Impacts<br />
Labor<br />
Wages<br />
200-600 jobs<br />
$6 million-$10 million/year<br />
Capital investment $5 million-$250 million<br />
237
Table MP 26 . General requirements for locating platform fabrication yards,<br />
and potential environmental pollutants ( New England River Basins Commission<br />
1976) .<br />
Item Requirements/Pollutants<br />
Site Considerations<br />
Land<br />
Berthage<br />
Water<br />
Environmental Impacts<br />
Air emission<br />
Wastewater contaminants<br />
Noise<br />
10-325 ha (25-800 acres)<br />
60-120 m (200-400 ft)<br />
5-15'm (15-50 ft) depth<br />
40,000-100,000 gal/d<br />
Sand and metal dust<br />
Concrete and cement dust<br />
Nitrogen oxide<br />
Sulfur oxide<br />
Hydrocarbons<br />
Organic compounds<br />
Heavy metals<br />
Chemicals<br />
Particulates<br />
Up to 100 dB on a 24 hour basis<br />
238
ENVIRONMENTAL ISSUES AND REGULATIONS (EIR)<br />
239
ALA llAMA GEORGIA<br />
Hoimes<br />
Jackson<br />
Walton ashin Geds:o ~ Hemil - Nassau<br />
-ton ?<br />
Cal - i Madison ton w<br />
houn -0 Du val<br />
Suwan 6 Baker<br />
- n!e<br />
Bav Libertv Taylor La .~pc` yr<br />
.. . . Fran6lin _ !ava+t~ oD~,p Ciay c<br />
Dixie<br />
•<br />
N<br />
W<br />
G<br />
a<br />
rS IfAlachua Q~~°°<br />
LPYv<br />
Marion<br />
. . Lske<br />
~~ Planning Area Boundaries ~ ~x :~ j;j . ~<br />
Okee<br />
r.ho- St .<br />
~~ Designated Agencies ~<br />
1 West Florida Regional Planning Council<br />
~ CLsFs.x - 1~<br />
2 Florida Dspartment of Environmental Regulation 9<br />
3 Tallahassee•Uon County Planning Department n{ ~ 4<br />
4 VOlusla Council of (iovemmnets ~<br />
5 Brevard County Planning & Zoning Department Q<br />
8 East Central Florida Regional Planning Council<br />
0<br />
41onr-, ao<br />
7 Central Florida Regional Planning Council `~<br />
8 Tampa Bay Regional Planning Council<br />
9 Southwest Florida Regional Planning Council<br />
10 Area Planning Board of Palm Beach County<br />
11 Broward County Planning Council<br />
12 Metropolitan Dade County Enviromental Resources Management<br />
~<br />
lp<br />
e e~<br />
Miles<br />
Martin<br />
? 50 100<br />
Figure 19 . Areawide wastewater management planning areas (Florida Power and<br />
Light Co . 1979) .<br />
240<br />
N
:<br />
.<br />
a<br />
. •; Sa~ns<br />
.<br />
~<br />
P,<br />
)~~.+<br />
. .<br />
ALAtAMA<br />
, ~~ .:,N<<br />
..<br />
~ i1'3Rq(' YvAS^ .~ ~i :id9 :;B<br />
GEORGIA<br />
'+uSEiau<br />
~<br />
€<br />
I<br />
y ~ 'J t.iialS'I : •<br />
.<br />
Pensacola<br />
° h)u^ 2<br />
PanamaCity U .ert ;<br />
~ Planning District Boundaries<br />
• Regional Planning Council Location<br />
1 West Florida Regional Planning Council<br />
2 Apalachee Regional Planning Council<br />
F"<br />
ra>ior<br />
"„' 3<br />
'd4EPtn ~'`<br />
/ ? (3ainesvllle .,<br />
i?fxfv<br />
:e•:•: SllverSprings<br />
y ~'<br />
4 ~<br />
Jacksonville<br />
5 ""<br />
Winter Park<br />
St. Petersbu . 8 •` 9artow<br />
\<br />
7<br />
t~<br />
Ft. Myers<br />
~ 9<br />
3 North Central Florida Regional Planning Council e<br />
4 Northeast Florida Regional Planning Council<br />
„<br />
6<br />
t'~ . .. - .<br />
5 Wlthlacoochee Regional Planning Council f'<br />
10<br />
3r :,x ,-<br />
.<br />
6 East Central Florida Regional Planning Council<br />
. . .<br />
~ Y<br />
d<br />
~O<br />
7 Central Florida Regional Planning Council<br />
e.<br />
,o<br />
8 Tampa Bay Regional Planning Council<br />
9 Southwest Florida Regional Planning Council<br />
10 Treasure Coast Regional Planning Council "'<br />
11 South Florida Regional Planning Council<br />
Figure 20 . Re ional Planning Council area boundaries (Florida Power and<br />
Light Co . 1979~ .<br />
241<br />
a•<br />
o<br />
Stuart<br />
11 Miami<br />
/fy<br />
rr.
~<br />
N<br />
Table EIR 1 . Location and description of solid waste problem areas (Florida Resources and Environmental<br />
Analysis Center 1978) .<br />
Sitea<br />
Loc at i on Description<br />
Allentown 1 .5 mi N . of Allentown,<br />
5 mi N . of SR-87,<br />
Santa Rosa County<br />
Argyle 1 .0 'mi NE . of Jct . I-10,<br />
SR-183, Walton County<br />
Baker 2 .1 mi SE . of Baker, NE .<br />
side of SR-4,<br />
Okaloosa County<br />
Baker 2 .0 mi SE . of Baker, at<br />
Jct . SR-4B, SR-4<br />
Okaloosa County<br />
Bayou Woods Corner Bayou Woods, Sotir<br />
Drive, Fort Walton Beach,<br />
Okaloosa County<br />
Berrydale 2 .5 mi N . of Jct . SR-4 &<br />
SR-87, Santa Rosa County<br />
Blue Mountain 1 .0 mi S . of U .S . 98, W . side<br />
of SR-835, Walton County<br />
Buckhorn 0 .2 mi W . of SR-71, 0 .5 mi<br />
Sanitary Landfill S . of county line, Gulf County<br />
Bue l ah Jamesv i l l e Rd . 0 .5 mi N . of U .S .<br />
Sanitary Landfill 90 W . of Pensacola,<br />
Escambia County<br />
Continued<br />
2 .5-acre dump operated by Santa<br />
Rosa county commission, owned by<br />
St . Reg i s P aper Co .<br />
20 .0-acre dump owned, operated<br />
by the county commission<br />
80 .0-acre dump, owned, operated<br />
by the county commission<br />
Unknown<br />
Closed 9/75<br />
2 .0-acre dump, owned, operated<br />
by the county commission, closed<br />
7/75<br />
42 .5-acre dump, operated by S .<br />
Walton County Mosquito Control<br />
district, owned by St . Joe Paper Co .<br />
40 .0-acre dump, owned and operated<br />
by the county commission<br />
23 .0-acre dump, owned and operated<br />
by Escambia County Solid Waste<br />
Department
N<br />
~<br />
w<br />
Table EIR 1 . Continued .<br />
Site Loc at i on Description<br />
Carrabelle City Dump<br />
Chumuckla<br />
City Dump, Apalachicola<br />
City of Pensacola,<br />
Transfer Station<br />
Crestview<br />
DeFuniak Springs<br />
East Milton,<br />
Airport Landfill<br />
Eastpoint Landfill<br />
Ebro<br />
5 Mile Camp<br />
End of SR-376, Carrabelle<br />
Airport, Franklin County<br />
0 .5 mi S . of Jct . SR-182,<br />
SR-197, Santa Rosa County<br />
2 .0 mi NW . of Apalachicola<br />
SR-384, Franklin County<br />
100 W . Leonard St .,<br />
Escambia County<br />
2 .0 mi SE . of Jct . I-10,<br />
SR-85 on John King Rd .,<br />
Okaloosa County<br />
0 .8 mi SSW . of Airport,<br />
Walton County<br />
N . end of Airport,<br />
Santa Rosa County<br />
1 .5 mi NE . of Eastpoint,<br />
Franklin County<br />
1 .0 mi NNW . of Ebro,<br />
Franklin County<br />
6 mi SW . of Century,<br />
Escambia County<br />
Continued<br />
8 .3-acre dump, owned and operated<br />
by city of Carrabelle<br />
1 .0-acre dump, operated by the<br />
county commission, owned by<br />
St . Reg i s Paper Co .<br />
22 .0-acre dump, owned and operated<br />
by city of Apalachicola<br />
Volume reduction site, owned and<br />
operated by city of Pensacola<br />
40 .0-acre dump, owned and operated<br />
by the city of Crestview<br />
20 .0-acre dump, owned and operated<br />
by city of DeFuniak Springs<br />
120 .0-acre dump, owned and operated<br />
by the county commission<br />
23 .0-acre dump, owned by Vrooman<br />
Trust, operated by the<br />
county commission<br />
40 .0-acre dump owned by power<br />
company, operated by the county<br />
commission<br />
4 .6-acre sanitary landfill owned<br />
and operated by the county<br />
commission
Table EIR 1 . Continued .<br />
Site Location Description<br />
Freeport 1 .5 mi S . of Jct . SR-20,<br />
SR-83A, Walton County<br />
Holley 1 .0 mi N . of East Bay Bridge,<br />
SR-87, Santa Rosa County<br />
Holley #2 2 .0 mi E . of Holley,<br />
Santa Rosa County<br />
Holt 1 .5 mi SW . of Holt, N . of RR .,<br />
Okaloosa County<br />
Honeyville<br />
rIj<br />
~ Howard's Creek<br />
Jay<br />
Klondike Rd .,<br />
Sanitary Landfill<br />
Lanark Village<br />
Laurel Hill<br />
1 .0 mi SSE . of Honeyvi l le,<br />
Gulf County<br />
0 .5 mi S . of SR-387, at Howard<br />
Creek Subdivision,<br />
Gulf County<br />
S of SR-4, 4 .0 mi W . of Jay,<br />
Santa Rosa County<br />
U .S . 90, Klondike Rd .,<br />
Escambia County<br />
2 .0 mi ENE . of Lanark Vi 1 l age,<br />
Franklin County<br />
1 .1 mi NW . of Laurel Hi 11 ,<br />
Okaloosa County<br />
Continued<br />
20 .0-acre dump, owned and operated<br />
by the county commission<br />
1 .5-acre dump, operated by the<br />
county commission, owned by<br />
Egl in A .F .B ., closed 2/76<br />
Owned and operated by the county<br />
commission<br />
Dump, owned by St . Regis Paper<br />
Co ., operated by city of Fort<br />
Walton Beach, closed 11/75<br />
12 .0-acre dump, owned and operated<br />
by the county commission<br />
4 .0-acre dump, owned and operated<br />
by the county commission<br />
8 .5-acre dump, owned and operated<br />
by the county commission<br />
95 acres, owned and operated by<br />
Escambia County Solid Waste<br />
Department<br />
29 .0-acre dump, owned by St . Joe<br />
Paper Co ., operated by the county<br />
commission<br />
20 .0-acre dump, owned and operated<br />
by the county commission
N<br />
-Ah<br />
u,<br />
Table EIR 1 . Continued .<br />
Site Locat i on Descr i pt i on<br />
Laurel Hill #2 2 .0 mi W . of Laurel Hill, N . of<br />
SR-85, Okaloosa County<br />
Lynn Haven 1 .3 mi E . of Lynn Haven, S . of<br />
SR-390, Bay County<br />
Majette Bayou George 1710 Alabama Ave . Lynn Haven,<br />
Bay County<br />
Mex i co Beach N . of U .S . 98, 11 .6 mi SE . of<br />
Tyndal l A .F .B ., Bay County<br />
Mossy Head 1 .0 mi N of Jct . U .S . 90,<br />
SR-285, Walton County<br />
Munson 0 .8 mi E . of Jct . SR-194,<br />
SR-4, Santa Rosa County<br />
New Harmony 1 .0 mi W . of Jct . SR-187,<br />
SR-2A, Walton County<br />
Newport Sanitary, 0 .3 mi W . of Jct . of Jackson<br />
Landfill St . & Keys Ct . Pensacola,<br />
Escambia County<br />
Niceville-Valpariso 1 .5 mi NNW . of Jct . SR-20,<br />
SR-85, Okaloosa County<br />
Oak Grove Landf i l 1 1 .5 mi E . of Oak Grove,<br />
Gulf County<br />
Continued<br />
Owned and operated by the county<br />
commission<br />
10 .0-acre dump, owned and operated<br />
by the city of Lynn Haven, closed<br />
5/77<br />
320 .0-acre sanitary landfill, owned<br />
and operated by the county<br />
commission<br />
5 .0-acre dump, owned by St . Joe<br />
Paper Co ., operated by the county<br />
commission<br />
1 .0-acre dump, owned and operated<br />
by the county commission<br />
1 .5-acre dump, owned by Blackwater<br />
River State Forest, operated by<br />
the county commission<br />
1 .0-acre dump, owned and operated<br />
by the county commission<br />
4 .0-acre s an i t ary l andf i 11, owned<br />
by Omni-Vest, Inc ., operated by _<br />
Reichold Chemicals Inc ., Newport<br />
Division<br />
40 .0-acre dump, owned and operated<br />
by the county commission<br />
15 .0-acre dump, owned and operated<br />
by the county commission
N<br />
~<br />
rn<br />
Table EIR 1 . Continued .<br />
Site Location Description<br />
Pace SR-197, U .S . 90,<br />
Santa Rosa County<br />
Panama City Beach N . Gulf Blvd ., Panama City<br />
Beach, Gulf County<br />
Panama City, Bay Ave ., 15th St .<br />
Transfer Station Panama City, Bay County<br />
Paxton 0 .2 mi W . of Jct . SR-180,<br />
SR-187, Walton County<br />
Pioneer Sand Pit S . end of Soufley Field,<br />
Escambia County<br />
Port St . Joe 1 .5 mi NE . of Jct . U .S . 98,<br />
SR-382, Gulf County<br />
Qu i nette L andf i 11 2 .1 mi NE . of Jct . SR-95A ;<br />
SR-184, on Quinette Rd .,<br />
Escambia County<br />
Southport 1 .1 mi NNW . of Southport, E .<br />
of SR-77, Bay County<br />
St . George Isl and Bayshore Dr . and 2nd . St ., W .<br />
on Island, Franklin County<br />
St . Teresa Dump 0 .3 mi NW . of Camp Weed, N . side<br />
U .S . 98, Frankl in County<br />
Continued<br />
40 .0-acre dump, owned and operated<br />
by the county commission<br />
40 .0-acre dump, owned and operated<br />
by Gulf Mosquito Control District<br />
Volume reduction site, owned and<br />
operated by Panama City<br />
2 .0-acre dump, owned and operated<br />
by the county commission<br />
15 .3-acre sanitary landfill, owned<br />
and operated by the Pioneer Sand<br />
Co .<br />
18 .0-acre dump, owned and operated<br />
by the county commission<br />
9 .2-acre dump, owned and operated<br />
by the county commission<br />
10 .0-acre dump, owned by Hunt Oil<br />
Co ., operated by the county<br />
commission<br />
1 .0-acre dump, owned by Leisure<br />
Properties, Ltd ., operated by the<br />
county commission, closed 2/76<br />
7 .0-acre dump, owned by St . Joe<br />
Paper Co ., operated by the<br />
county commission
N<br />
A<br />
V<br />
Table EIR 1 . Concluded .<br />
Site<br />
Walton Bridge<br />
West Red Bay<br />
White City<br />
Wright<br />
Location<br />
Old Walton Bridge Rd . at Big<br />
Branch Creek, Walton County<br />
2 .6 mi W . of Red Bay,<br />
Walton County<br />
SR-71 at Intracoastal Waterway,<br />
Gulf County<br />
1 .6 mi N . of Beal St . extension,<br />
Eglin A .F .B ., Okaloosa County<br />
Description<br />
2 .0-acre dump, owned and operated<br />
by the county commission<br />
1 .0-acre dump, owned and operated<br />
by the county commission<br />
5 .0-acre dump, owned and operated<br />
by the county commission<br />
160 .0-acre dump, owned by Eglin<br />
A .F .B ., operated by the county<br />
commission<br />
a Two categories of sites are listed : "sanitary landfills" and "dumps" . A sanitary landfill meets all of<br />
the requirements of the Department of Environmental Regulation permitting program, a dump does not .
~<br />
CO<br />
Table EIR 2 . Location and description of sol id waste faci 1 ities by county (Florida Department of Environmental<br />
Regulation, Solid Waste Management Program 1981a) .<br />
County Site name Address<br />
Population served<br />
ton/day a<br />
site area<br />
# Monitoring wells (MW)<br />
special waste & spilled<br />
materials accepted<br />
Bay Panama City N . Gulf Blvd . 14,000<br />
100 ~d3, hopper<br />
Beach transfer<br />
station<br />
100 yd 3/d<br />
7 yd , compactor<br />
Southport dump SR-77 2,500,<br />
10 acres<br />
Panama City Bay Ave . and 15th St . 40,000 household/commercial<br />
transfer station 160 ton/day<br />
1-acre site<br />
Ma jette Tower b S . of SR-390 on 90,000 3 MW<br />
John Pitts Rd . 255 tons/day 9 monitoring points<br />
200-acre site accept emergency spill<br />
Bay County solid Hwy . 20 and Hwy . 77 100,00~<br />
waste lf site 978 yd /d 5 MW<br />
Bay Countyc SR-20 and SR-77 N .D . 6 MW<br />
Escambia Beulah slf Jamesville Rd . 185,000 1 active sludge bed<br />
23-acre site<br />
Quinette dump Quinette Rd . 15,000 N .D .<br />
9 .2-acre site<br />
Pioneer sand pit N .D . Industrial site 1 MW<br />
15 .3-acre site<br />
Continued
N<br />
~<br />
Table EIR 2 . Continued .<br />
Population served # Monitoring wells (MW)<br />
County Site name Address ton/day special waste & spilled<br />
site area materials accepted<br />
Escambia Perdidoc Beulah-Muskogee Rd .<br />
5 Mile Camp dump O1d .Bratt Rd .<br />
City of Pensacola 100 W . Leonard St .<br />
transfer station<br />
Klondike Rd .c Klondike Rd .<br />
Franklin Franklin Countyc SR-65<br />
Gulf Port St . Joec Niles Rd .<br />
Buckhornc SR-71<br />
Honeyville dump N .D .<br />
Continued<br />
255,000 7 MW<br />
700 ton/day<br />
424-acre site<br />
3,500 N .D .<br />
4 .6-acre site<br />
65,000<br />
110 yd 3/d<br />
185,000<br />
3700 yd 3/d<br />
95 .0-acre site<br />
10,70<br />
70 yd<br />
9<br />
/d<br />
7-acre site<br />
N .D .<br />
3 MW<br />
4 MW<br />
6,600 3 MW<br />
18-acre site not in operation<br />
4,500 1 MW<br />
40-acre site<br />
500 N .D .<br />
12-acre site
N<br />
tTl<br />
C)<br />
Table EIR 2 . Continued .<br />
Population served # Monitoring wells (MW)<br />
County Site name Address ton/day special waste & spilled<br />
site area materials accepted<br />
Gulf Howard's Creek<br />
Dump<br />
Okaloosa<br />
Oak Grove dump<br />
Port St . Joe<br />
dump<br />
White City dump<br />
Baker # 1 dump<br />
Niceville c<br />
Wright #2c<br />
SR-387<br />
N .D .<br />
U .S . 98 and SR-382<br />
SR-71<br />
N .D .<br />
SR-26 and SR-85<br />
N . Beal St .<br />
Laurel Hill #2 N . of SR-85A<br />
Baker C SR-4 and SR-4B<br />
Continued<br />
500<br />
4-acre site<br />
1,000<br />
15-acre site<br />
4,000<br />
18-acre site<br />
N .D .<br />
6,000<br />
26,000<br />
310 yd3/d<br />
20-acre site<br />
60,000<br />
1315 yd3/d<br />
160-acre site<br />
5,000<br />
20-acre site<br />
20,000<br />
36-acre site<br />
N .D .<br />
N .D .<br />
N .D .<br />
N .D .<br />
2 MW<br />
3 MW<br />
4 MW<br />
2 MW<br />
3 MW
Table EIR 2 . Continued .<br />
Population served # monitoring wells (MW)<br />
County Site name Address ton/day special waste & spilled<br />
site area materials accepted<br />
Okaloosa Baker #2c 1/4 mi W . 6,000<br />
of Baker #1<br />
185 yd 3/day<br />
36-acre site<br />
Santa Rosa Galt City Rd . 9,300 3 3 MW<br />
Centralc 1140 yd /d sludge dry i ng be<br />
d s<br />
114-acre site<br />
~,<br />
Hol ley #3 N .D . 10,0003<br />
730 yd/d<br />
3 MW<br />
~<br />
80-acre site<br />
2 MW<br />
Santa Rosa N . SR-4 10,0003 3 MW<br />
190 yd/d<br />
35-acre site<br />
Northwestc 1/2 mi W . of Hwy . 89 6,000<br />
7 mi S . of Jay 60 yd 3/d<br />
Walton Blue Mountain SR-83S 6,250 N .D .<br />
dump<br />
42-acre site<br />
New Harmony dump SR-187 and SR-2A 150 N .D .<br />
1 .0-acre site<br />
Paxton dump SR-180 and SR-187 150 N .D .<br />
2-acre site<br />
Continued<br />
1 MW
N<br />
~.T7<br />
N<br />
Table EIR 2 . Concluded .<br />
County Site name Address<br />
Walton Walton Countyc County Rd . 183-A 12,000<br />
40-acre site<br />
b Data were presented as found .<br />
Landfi l l .<br />
c Sanitary landfill .<br />
Population served # Monitoring wells (MW)<br />
ton/day special waste & spilled<br />
site area materials accepted<br />
1 MW
ALA BAMA GEORGIA<br />
Figure 21 . U .S, ArmY Corps of Engineers regulation districts (Florida Power<br />
and Light Co, 19 .79 ) ,<br />
253<br />
,4A<br />
i i<br />
r~ ;€Js
ALABAMA GEORGIA<br />
LOCAL ENVIRONMENTAL UNIT<br />
~ APproved* Counties<br />
® Other County Pcllution Control Programs<br />
~C Approved• Munlclpalltiesllmprovement<br />
Districts<br />
e Other Munlclpality Pollution Control Programs<br />
•Approved pursuant to Chapter 403.182. Florida Statutes<br />
M' L±5<br />
n r0 1;r3 'SU<br />
Figure 22 . Local pollution control programs (Florida Power and Light Co . 1979) .<br />
254<br />
e<br />
I
Table EIR 3 . Hazardous waste incident, Youngstown train derailment (Herndon<br />
and Teaf 1978) .<br />
Personal dama e : Eight deaths and more than 100 injuries . Also, more than<br />
, 0 persons had to be evacuated from within a 10-mile radius of the<br />
spill .<br />
Environmental dama e : Minor . On 24 March and 26 June 1978, representatives<br />
from t e U . . Environmental Protection Agency (EPA), Region IV visited the<br />
derailment site and determined that the clean-up operations were satisfactory,<br />
the chlorine neutralization pits were successfully covered and<br />
that the area was "environmentally secure ."<br />
Economic damage : Uncalculated, but would include extensive costs to local,<br />
state and groups involved in the rescue, evacuation and treatment<br />
of injured persons, as well as costs for teams necessary to safely<br />
treat and clean up potentially hazardous wastes from the wreck .<br />
Cause of problem :<br />
.<br />
The derailment of a train, including a tank car which<br />
carri ed c or i ne .<br />
Type and g~uantit of hazardous waste : A ruptured railroad tank car carrying<br />
severaT-t ousan gaT ons o iqui chlorine .<br />
Date of incident : 26 February 1978 .<br />
Location : Youngstown, Bay County .<br />
Remedial action : Evacuation was carried out within a 10 to 12 mi radius of<br />
t e wrec site, and the chlorine-containing tanker car was transported<br />
on foam to a nearby pit dug specifically for the purpose . The chlorine was<br />
carefully bled into the pit along with a large volume of caustic soda<br />
and water . The tank car was then filled with water to stabilize the residual<br />
chlorine . Existing drinking water wells were more than 0 .5 mi away,<br />
but monitoring of well water and surf ace water continued in order to detect<br />
possible future contamination . EPA representatives set January 1979<br />
as the time after which wells safely could be drilled in the area .<br />
255
Table EIR 4 . Hazardous waste incident, Fanning Bayou fish kill (Herndon and<br />
Teaf 1978) .<br />
Personal damage : None .<br />
Envi ronmental dama e : Extensive local fish kill and undetermined damage to<br />
ot er aquatic life in Fanning Bayou, Bay County by spilled chemicals and<br />
tank truck washings .<br />
Economic damage : Repairs to the dike system by McKenzie Tank Lines were<br />
made at a cost of $7,300 .83 . Possible fines and subsequent damages due to<br />
the fish kill could total over $46,000 .<br />
Cause of problem : A ruptured dike at the Southport site of McKenzie Tank<br />
ines cause a large quantity of chemical contaminants and tank washing<br />
solutions to spill into Charlie Williams Creek and Fanning Bayou .<br />
T e and quantity of hazardous waste : 35,000 gal of wastewater containing<br />
Oakite 2 steam c eaning compound, neutralized spent acids, phenols, oils<br />
and greases and various grades of resin .<br />
Date of incident : 13 October 1976 .<br />
Location : McKenzie Tank Lines property adjoining Charlie Williams Creek<br />
an anning Bayou, Southport, Bay County, S . of SR-391 .<br />
Remedial action : Repairs to the dike took place on the day following the<br />
spi , 14 October and action was taken against McKenzie Tank Lines by<br />
the Florida Department of Environmental Regulation beginning with a warning<br />
notice on 20 October 1976 and recommendation for penalties for violation of<br />
pollution laws on 1 December 1976 .<br />
256
Table EIR 5 . Hazardous waste incident, Crestview train derailment, Okaloosa<br />
County (Teaf 1980) .<br />
Personal dama e : Fourteen persons injured by inhalation of toxic fumes<br />
rom a damaged chlorine tank car . Two of these were hospitalized after<br />
being overcome by chlorine fumes at ground level which were disturbed by<br />
helicopter rotor downwash during a helicopter surveillance overflight by<br />
investigators from the National Transportation Safety Board (NTSB) and<br />
the U .S . Senate .<br />
Environmental dama e : Trees and groundcover were defoliated by the ammonia<br />
c ou for approximately 650 ft NW . of the derailment site . There was<br />
extensive fire damage within a 150-ft radius of the burning cars . Dead fish<br />
were observed in the immediate area of the leaking phenol car . Subsequent<br />
biological assessment of the area indicated significant damage to aquatic<br />
life in the Yellow River extending for 900 yd downstream from the derailment<br />
site .<br />
Economic dama e : Damaged or destroyed equipment was valued at $813,000,<br />
amage tr.ac or structures were estimated at $258,000, lost or contaminated<br />
product was valued at $187,000 . Total damages were approximately<br />
$1,258,000 . Total costs to various agencies in response and sampling<br />
efforts were not available . Costs were not assigned to damaged wildlife .<br />
Cause of roblem : Derailment of 29 cars of a 119-car freight train owned<br />
y ouisvi e and Nashville (L&N) Railroad . Of the derailed cars, 26 were<br />
placarded hazardous materials tank cars .<br />
T e and uantit of hazardous waste : Twenty-six derailed cars containing<br />
azar ous materia s inc u e containing anhydrous ammonia, 3 containing<br />
acetone, 4 containing methyl alcohol, 1 containing chloride and 1 containing<br />
carbolic acid .<br />
Date of incident : 8 April 1979 .<br />
Location : L&N Railroad bridge at Yellow River, 5 mi W . of Crestview, FL .<br />
Remedial action• By 6 April all cars had been derailed, destroyed, or had<br />
cargo trans~erred to other holding facilities . With the exception of<br />
materials destroyed by fire, only the chloride car was disposed of on-site .<br />
Its contents were drained into a lined pit where the material was mixed<br />
with caustic soda to neutralize the chlorine .<br />
L&N Railroad was ordered to pay the Florida Department of Environmental<br />
Regulation (DER) costs ($4,403 .44) and a fine ($20,000) in connection with<br />
the derailment . A check for the total amount was received by DER on 28<br />
November 1979 .<br />
257
Table EIR 6 . Hazardous waste incident, demolition of out-of-date laboratory<br />
reagents from Escambia County schools (Teaf 1980) .<br />
Personal damage : None .<br />
Environmental damage : None .<br />
Economic dama e : Not calculated, but includes cost of Navy team of exp<br />
osives experts from Panama City to package and remove 22 oz of crystallized<br />
picric acid . In addition, following this incident as extensive<br />
inventory was undertaken to identify, repackage and dispose of other potentially<br />
dangerous, outdated reagents at the schools .<br />
Cause of problem : Discovery of 22 oz of outdated, crystallized picric<br />
aci, a c ose structural relative of trinitrotoluene (TNT), at three<br />
schools in Escambia County . This incident led to the discovery of many<br />
other stored chemicals, the shelf life of which had expired and which<br />
posed a potential threat because of their flammability, toxicity or explosive<br />
nature .<br />
T e and quantity of hazardous waste : Small quantities (1-5 lb) of a wide<br />
variety-of po-enfia y angerous, outdated laboratory reagents found<br />
stored at several ( 12) Escambia County schools . Particularly dangerous<br />
was a total of 1 .5 lb of picric acid found at three schools .<br />
Date of incident : May - June 1979 .<br />
Location : Twelve Escambia County public schools .<br />
258
Table EIR 7 . Hazardous waste incident, phenolic sludges discharged into Bayou<br />
Chico, Escambia County (Teaf 1980) .<br />
Personal damage : None .<br />
Environmental dama~e : The soil surrounding the Reichold Chemical Co . plant<br />
contains extensive hydrocarbon residues from chemical processing dating back<br />
50 years or more .<br />
Economic damage : Improvements in treatment f acilities to reduce discharge<br />
were estimated to cost approximately $83,000 . Costs of monitoring and<br />
enforcement were not available .<br />
Cause of problem : Presence of hydrocarbons in soils of Reichold Chemical<br />
Co . T is problem is aggravated by inadequate treatment and retention<br />
of industrial wastes by Reichold's current operation . Soils produce a<br />
chronic discharge of hydrocarbons into Bayou Chico .<br />
T e and uantit of hazardous waste : Soil contains rosins and various<br />
hydrocarbons inc u ing oi s, grease and phenols . Phenol concentration<br />
has been measured at 400 micrograms/liter in Bayou Chico near discharge<br />
point . Volume of the discharge has not been estimated .<br />
Date of incident : This is a chronic problem dating back many years . Occasiona<br />
equipment malfunctions aggravate the problem .<br />
Location : Reichold Chemical Co . plant on the NE . arm of Bayou Chico, Escambia<br />
County .<br />
Remedial action : Reichold Chemical Co . is currently improving their treatment<br />
f aci ities to reduce sludge discharge in accordance with agreements worked<br />
out with the Florida Department of Environmental Regulation (DER) .<br />
Narrative : Reichold Chemical Co . has been in operation for 50 or more years .<br />
Their original business was removing old pine stumps and processing them to<br />
obtain turpentine and other hydrocarbon products . This activity was carried<br />
on for many years without regard for pollution of the surrounding area .<br />
Consequently, hydrocarbon wastes have built up in the soil to the extent<br />
that a chronic discharge of these wastes into Bayou Chico occurs .<br />
This chronic problem led to investigation of Reichold's current waste<br />
treatment f acilities . These were found to be inadequate . On 26 March<br />
1979 Reichold Chemical Co . signed a Florida DER consent order thereby<br />
agreeing to improve their treatment facilities . These improvements are<br />
designed to reduce the amount of discharge, particularly phenols .<br />
259
Table EIR 8 . Hazardous waste incident, industrial waste discharge into Airplane<br />
Bayou, Escambia County (Teaf 1980) .<br />
Personal damage : None .<br />
Environmental damage : An estimated 20,000 poeciliid fish were killed .<br />
Economic dama e : Cost to the State of Florida for tracing, controlling<br />
an a ating the pollution was estimated at $455 .22 . Penalty damages for<br />
fish kill were settled for $600 .00 .<br />
Cause of problem : Malfunction of an industrial waste treatment lift (pump)<br />
s ation a t e U .S . Navy Aircraft Rework Facility, Pensacola .<br />
T e and uantit of hazardous waste : Approximately 80,000 gal of untreated<br />
in us ria , was es, primari y paint sludges containing oils, grease and<br />
pheno 1 s .<br />
Date of incident : 12 January 1979 .<br />
Location : U .S . Navy Aircraft Rework Facility in Pensacola . Discharge was<br />
- into Airplane Bayou near this f acility .<br />
Narrative : On 12 January 1979 a lift (pump) station malfunction at the<br />
U . . Navy Aircraft Rework Facility in Escambia County caused approximately<br />
80,000 gal of untreated industrial sludge to be discharged into Airplane<br />
Bayou . This sludge contained primarily grease, oils and phenols . As a<br />
result of this spill, about 20,000 fish were killed .<br />
The Navy signed a Department of Environmental Regulation (DER) consent<br />
order in August 1979 thereby agreeing to reimburse the State of Florida<br />
for pollution control efforts and for damages resulting from the fish kill .<br />
Reimbursement for pollution control amounted to $455 .72 . Damages were<br />
settled for a total of $600 .00 . The Navy also agreed to submit operation<br />
and emergency procedures designed to prevent a recurrence of the problem .<br />
The waste sludges produced by the Navy at the rework facility had been<br />
of concern since at least 1976 . Several laboratory analyses were conducted<br />
to determine the types and relative amounts of hazardous materials present<br />
in the sludge . The results of these analyses showed the presence of<br />
phenols, some heavy metals, and other substances classified as hazardous .<br />
This knowledge required changing disposal procedures which had previously<br />
consisted of dumping the sludge in a nearby landfill . A decision was made<br />
to ship the sludge to the Chemical Waste Management of Alabama waste disposal<br />
facility in Livingston, AL .<br />
260
Table EIR 9 . Hazardous waste incident, stored pesticide at Escambia County<br />
Rodent Control (Teaf 1980) .<br />
Personal damage : None .<br />
Environmental damage : None .<br />
Economic dama e : Not calculated, but probably low due to minimal leaching<br />
rom eteriorated containers and rapid response by a disposal team from<br />
the pesticide manuf acturer . Costs were limited to time required for repackaging<br />
and removal by pesticide manuf acturer .<br />
Cause of problem : A substantial quantity of outdated pesticide powder was<br />
store in containers which were deteriorating and leaking .<br />
T e and uantit of hazardous waste : Approximately 70 lb of pesticide<br />
pow er name - ust , of whic the active ingredient is calcium cyanide .<br />
This compound generates toxic cyanide gas on contact with water .<br />
Date of incident : Transportation and disposal problem was brought to the<br />
attention o Florida Department of Environmental Regulation (DER) on 10<br />
January 1980 .<br />
Location : Pesticide was stored at the warehouse of Escambia County Rodent<br />
Control, Pensacola, Escambia County .<br />
Remedial action : Florida DER officials contacted the pesticide manuf acturer,<br />
erican yanamid, who agreed to coordinate the disposal of the material .<br />
This was accomplished in January 1980 .<br />
261
Table EIR 10 . Hazardous waste incident, Molino train derailment, Escambia<br />
County (Teaf 1980) .<br />
Personal dama e : None . Evacuation was carried out to a distance of two<br />
mi rom t e incident site, and increased to five mi during detonation<br />
operations . Approximately 200 persons were included in the evacuation .<br />
Environmental dama e : Extensive . 100% biological destruction was estimated<br />
for 25 ., acres, 99% was estimated for 3 .5 acres and 76% destruction was<br />
estimated for an additional 3 .5 acres . A total of 32 .5 acres were determined<br />
to be severely affected (greater than 75% biological destruction) .<br />
Economic dama e : Value of the biological damage described above was calcu<br />
ate at a minimum of $1,961,000 and a maximum of $7,465,000 . A "moderate"<br />
value of $5,129,000 was recommended as a figure for out-of-court settlement<br />
of damages . Cost of the biological evaluation was calculated to<br />
be $1,976 . Costs of $48,455 from demolition of the tank cars were billed<br />
to the U .S . Environmental Protection Agency (EPA) .<br />
Cause of roblem : Derailment of 22 cars of a 105-car Louisville and Nashvi<br />
e &N train, 19 of which contained hazardous materials .<br />
T e and uaritit of hazardous waste : Six railroad cars containing liquid<br />
pe ro eum gas (LPG), 1 containing acetone, 1 containing styrene, 1 containing<br />
methylethyl ketone, and 10 cars containing liquid sulfur .<br />
Date of incident : 11-14 November 1979 .<br />
Location : L&N Railroad Line approximately 2 mi W . of Molino, Escambia<br />
ounty . The site was adjacent to Pretty Branch Creek .<br />
Remedial action : After consideration of several alternatives, it was decided<br />
by t e Regional Response Team that controlled detonation of the liquid<br />
petroleum gas was the safest way to proceed . This was accomplished on<br />
14 November . Although an on-site inspection by federal and state authorities<br />
found the area safe, and stated that threat of further pollution was<br />
insignificant, subsequent surveys by the Florida Department of Environmental<br />
Regulation in late December 1979 showed the area to be still heavily<br />
affected by the spilled chemicals .<br />
262
N<br />
C1<br />
W<br />
Table EIR 11 . Inventory of potential<br />
Regulation 1981b) .<br />
hazardous waste sites by countya (Florida Department of Environmental<br />
County Site Type Permit Status Degree Other<br />
Bay Internationl Private N .D . N .D . Medium No pond<br />
Paper Co .<br />
Majette Tower Site Municipal Operational Active Medium No pond<br />
Southwest Forest<br />
Industries N .D . N .D . N .D . N .D . N .D .<br />
Escambia Air Products<br />
and Chemicals N .D . N .D . N .D . N .D . N .D .<br />
Klondike Landfill Municipal Operational Active High No pond<br />
Monsanto N .D . N .D . N .D . N .D . N .D .<br />
Pioneer Sand Co . Private None Active High No pond<br />
Reichhold Chemical<br />
(Bell's Pit) Municipal N .D . N .D . High Pond<br />
Reichhold Chemical N .D . N .D . N .D . N .D . N .D .<br />
St . Regis Paper Co . Private N .D . N .D . Low No pond<br />
Beulah Landfill Municipal No Active High No pond<br />
Green's Pit N .D . N .D . N .D . N .D . N .D .<br />
Continued
Table EIR 11 . Concluded .<br />
County Site Type Permit Status Degree Other<br />
Escambia Pensacola Plant N .D . N .D . N .D . N .D . N .D .<br />
Escambia Jim Walter Doors<br />
Century, FL N .D . N .D . N .D . Low N .D .<br />
Gulf Allied Chemical<br />
Corporation Private N .D . N .D . Medium No pond<br />
Gulf City of Port St . Joe<br />
Port St . Joe, FL Municipal No Active Medium No pond<br />
~, Santa Rosa Santa Rosa County<br />
~ Site (Also<br />
PPG Industries) Private N .D . N .D . Medium No pond<br />
Santa Rosa Santa Rosa Landfill<br />
( Also<br />
American Cyanamid)<br />
Milton, FL County Yes Active Low No pond<br />
a This data reflects information provided by the Eckhardt Sub-Committee of the U .S . House of Representatives,<br />
the U .S . Environmental Protection Agency and the Florida Department of Environmental Regulation .
Table EIR 12 . Total number of industrial surf ace impoundments in Florida by<br />
size in acres ( Florida Department of Environmental Regulation 1980b) .<br />
Total number of Size<br />
Industrial impoundments (acres)<br />
508 1<br />
172 1-5<br />
81 6-15<br />
57 16-40<br />
87 40<br />
431 N .D .<br />
Reg i on 1336 N .A .<br />
Table EIR 13 . Total number of industrial impoundments and total number with<br />
monitoring wells and liners (Florida Department of Environmental Regulation<br />
1980b) .<br />
County Total number of Number with Number with<br />
impoundments monitoring wells liners<br />
Bay 5 1 1<br />
Escambia 30 9 14<br />
Franklin 0 0 0<br />
Gulf 2 0 0<br />
Okaloosa 5 2 3<br />
Santa Rosa 12 8 2<br />
Walton 0 0 0<br />
Region 54 20 20<br />
265
N<br />
rn<br />
rn<br />
Table EIR 14 . Identified air quality problems (U .S . Army Corps of Engineers 1978) .<br />
Site Location Description<br />
Agrico Chemical Division Pensacola, Chemical phosphate ; emission<br />
Escambia County of particulates<br />
Alger-Sulliva Co . Century, Wood industry, emission of<br />
Escambia County particulates<br />
American Creosote Pensacola, Wood industry, emission of<br />
Works, Inc . Escambia County particulates<br />
American Cyanamid Milton, Santa Rosa County Acrylic fiber, emission of S0 2<br />
Armstrong Cork Co . Pensacola,<br />
Escambia County<br />
Emission of particulates<br />
Basic Magnesia Port St . Joe, MgO recovery from sea water, S02<br />
Gulf County<br />
and particulates<br />
Cantonment Escambia County, Industrial emissions<br />
Fleming Lumber Co . Crestview, Lumber mill, emission of<br />
Okaloosa County particulates<br />
Glidden-Durkee Organic Port St . Joe, Chemical processes, emission<br />
Chemical Corp . Gulf County of particulates<br />
Gulf Power Corp . Pensacola, Electric utility, emission of<br />
Escambia County SO and particulates<br />
Humble Oil & Refinery Co . Jay,<br />
Santa Rosa County<br />
Oil ~ efining emission of S02<br />
International Paper Co . Panama City, Pulp & paper, emission of<br />
Bay County SO and particulates<br />
Monsanto Co . Gonzales, Text i les, emission of particulates,<br />
Escambia County nitric acids, hydrocarbons<br />
Pensacola Escambia County Automotive exhausts<br />
(NOx, C02, etc .)<br />
Continued
N<br />
C1<br />
V<br />
Table EIR 14 . Concluded .<br />
Site<br />
Reichold Chemicals<br />
Newport Division<br />
St . Joe Paper Co .<br />
St . Regi s Paper Co .<br />
Tenneco Chemical, Inc .<br />
Location<br />
Escambia County<br />
Port St . Joe,<br />
Gulf County<br />
Pensacola<br />
Pensacola,<br />
Escambia County<br />
Description<br />
Emission of hydrocarbons<br />
Pulp, paper mill, emission of<br />
S02 and particulates<br />
Pulp, paper mill, emission of<br />
particulates<br />
Naval stores, emission of particulates
Table EIR 15 . Florida class II waters presently closed to shellfishing (U .S . Army Corps of Engineers 1978) .<br />
Site Location Description<br />
Blackwater Bay<br />
Choctawhatchee Bay<br />
East Bay<br />
East Bay River<br />
Escambia Bay<br />
~ North Bay<br />
Ochlockonee Bay<br />
Pensacola Bay<br />
Rocky Bayou<br />
St . Joseph Bay<br />
West Bay<br />
Santa Rosa County Lower portion, Robinson Point S . to<br />
Escribano Point, closed to shellfishing<br />
Walton County Closed to shellfishing<br />
Bay County W . portion of Bay closed to shellfishing,<br />
also small portion of E . .<br />
side is closed<br />
Santa Rosa County W . portion of river to E . Bay<br />
entrance, closed to shellfishing<br />
Santa Rosa County Area from Louisville and Nashville<br />
Railroad Bridge S . to Emanuel Point,<br />
closed to shellfishing<br />
Bay County Closed to shellfishing<br />
Franklin County Closed to shellfishing<br />
Santa Rosa County N . portion of Pensacola Bay, closed<br />
to shellfishing<br />
Okaloosa County Closed to shellfishing<br />
Gulf County Closed to shellfishing<br />
Bay County S . portion closed as it is a<br />
mariculture area
N<br />
rn<br />
~<br />
Table EIR 16 . Identified water quality problems (U .S . Army Corps of Engineers 1978) .<br />
Site Location Description<br />
Alaqua Bayou Choctawhatchee Bay,<br />
Walton County<br />
Apalachicola Bay Franklin County<br />
Bayou Chico Pensacola Bay,<br />
Escambia County<br />
Bayou Grande Pensacola Bay,<br />
Escambia County<br />
Bayou Marcus Creek Perdido Bay,<br />
Escambia County<br />
Bayou Texar and Pensacola Bay,<br />
Carpenters Creek 'Escambia County<br />
Blackwater River Blackwater Bay,<br />
Santa Rosa County<br />
Boggy Bayou Choctawhatchee Bay,<br />
Okaloosa County<br />
Chipola River Calhoun and Gulf counties<br />
Cinco Bayou Choctawhatchee Bay,<br />
Okaloosa County<br />
East Bay Panama City,<br />
Bay County<br />
East Bay Navarre,<br />
Santa Rosa County<br />
Eleven Mile Creek Perdido Bay,<br />
Escambia County<br />
Escambia River Western border,<br />
Santa Rosa County<br />
Continued<br />
Agricultural runoff, low D .O .a high<br />
nutrient and coliform levels<br />
Low D .O ., high nitrate and coliform levels<br />
Urban and industrial wastes<br />
Urban runoff<br />
Urban runoff<br />
Urban runoff<br />
City of Milton to Blackwater Bay,<br />
municipal sewage<br />
Low D .O ., agricultural runoff,<br />
high nitrate & coliform levels<br />
Chipola River to Dead Lake, high nitrate<br />
levels, sewage waste discharges<br />
Low D .O ., agricultural runoff, high<br />
nutrient and coliform levels<br />
Urban runoff, low D .O ., high nitrogen,<br />
nitrate, and coliform levels<br />
Sewerage effluent, urban runoff<br />
Cantonment to Perdido Bay, discharges of<br />
treated bleached/unbleached Kraft mill<br />
wastes<br />
Urban and industrial runoff
N<br />
V<br />
O<br />
Table EIR 16 . Concluded .<br />
Site Location Description<br />
Escambia Bay Escambia County Urban, industrial effluent, carbonaceous,<br />
nitrogenous and phosphorus wastes<br />
Fort Walton Beach Okaloosa County Saltwater intrusion due to aquifer<br />
drawdowns<br />
Jose Bayou<br />
LaGrange Bayou<br />
Choctawhatchee Bay,<br />
Okaloosa County<br />
Choctawhatchee Bay,<br />
Low D .O ., agricultural runoff, high<br />
nutrient and coliform levels<br />
Low D .O ., high nitrogen, ammonia,<br />
Okaloosa County<br />
coliform levels, agricultural runoff<br />
Mullatto Bayou Escambia Bay, Urban, industrial effluent, forest<br />
Santa Rosa County drainage<br />
North Bay Panama City, Low D .O ., high nitrate, nitrogen and<br />
Bay County coliform levels, urban runoff<br />
Pensacola Bay Pensacola, Urban runoff, high nitrate, ammonia<br />
Escambia County and coliform levels<br />
Perdido River and Bay Western border, High coliform levels, agricultural<br />
Escambia County runoff<br />
St . Andrew Bay Panama City, High nitrogen, nitrate, coliform levels,<br />
Bay County low D .0 ., urban runoff<br />
St . Joseph Bay City of Port St . Joe, High coliform levels, indirect urban<br />
Gulf County discharges<br />
Toms Bayou Choctawhatchee Bay, Low D .O ., high nutrient, coliform<br />
Okaloosa County levels, agricultural runoff<br />
Trout Bayou Escambia Bay, Urban, industrial effluent,<br />
Santa Rosa County forest drainage<br />
West Bay Panama City, High nitrogen, nitrate, coliform<br />
Bay County levels, low D .O ., urban runoff<br />
a Dissolved Oxygen .
Table EIR 17 . Known case of groundwater contamination (Florida Department of<br />
Environmental Regulation 1980b) .<br />
Case name : Fertilizer plant contamination of the sand-and-gravel aquifer,<br />
Escambia County .<br />
Case descri tion : In Pensacola, FL, concentrated acid wastes from a fertilizer<br />
p ant were disposed of in unlined pits from about 1889 to 1957 . The area is<br />
underlain by a sand and gravel aquifer, with an approximate hydraulic<br />
conductivity of 17 .4 m/day (57 ft/day), to a depth of about three hundred<br />
meters (a thousand it) . In the area, the sand and gravel aquifer is extensively<br />
developed for industrial, municipal and domestic water supply . Ground<br />
water development for public supply was formally centered to the SE .<br />
of the plant site . Generally, the water table slopes to the east . The<br />
contaminant plume migrated to the E . and S . General chemical characteristics<br />
of the waste were low pH and high dissolved solids, hardness, sulfate,<br />
flouride, calcium and magnesium . A municipal well located 1 .8 km (1 .1 mi)<br />
E . of the disposal pits was abandoned in about 1958 . The industry has since<br />
abandoned use of the pits and now uses deep disposal wells . However,<br />
field determinations of water samples collected in 1975 indicate that the<br />
ground water is still contaminated .<br />
271
Table EIR 18 . Summary of oil spill investigations from 1 January 1975 to 31<br />
August 1980 by the Florida Department of Natural Resources (Florida Department<br />
of Natural Resources 1980) .<br />
Year<br />
Classification<br />
of spill 1980 1979 1978 1977 1976 1975<br />
Majora 1 4 6 2 9 8<br />
Moderateb 15 17 5 4 4 9<br />
Minorc 81 86 79 125 147 189<br />
a Discharge of pollutant of more than 10,000 gal into inland waters, or more<br />
than 100,000 gal into coastal waters, or a discharge of any quantity that<br />
substantially threatens the public health or welfare or generates wide public<br />
interest .<br />
b Discharge of pollutant of 1,000 gal to 10,000 gal into inland waters, or<br />
10,000 gal to 100,000 in coastal waters, or a discharge of any volume that<br />
poses a threat to the public health or welfare .<br />
c Discharge of pollutant of less than 1,000 gal into inland waters, or less<br />
than 10,000 in coastal waters .<br />
272
ALA BAMA GEORGIA<br />
Sa n ta<br />
Hoimes<br />
~ ;:qn " i Jt+c,MSOn ~^<br />
z ~ OJ-'/tGn sJ :+.S'S :n:1<br />
-t`,.n<br />
GuU75;;n^ ~<br />
:~dmi ;/-<br />
~A ~r, lariac; ~*:<br />
*t<br />
Approximate District Boundaries<br />
A Northwest Florida WMD<br />
8 Suwannee River WMD<br />
C St . Johns River WMD<br />
D Southwest Florida WMD<br />
E South Florida WMD<br />
k :; ;l .l<br />
.n
Table EIR 19 . Geographic areas considered by the Florida Department of Environmental<br />
Regulation as hgving the greatest potential for agricultural non-point<br />
water quality problems (Florida Department of Environmental Regulation 1979a) .<br />
County Agricultural activities<br />
Bay Row crops<br />
Escambia Row crops<br />
Franklin Row crops<br />
Gulf Row crops<br />
Okaloosa Row crops<br />
Santa Rosa Row crops<br />
Walton Row crops<br />
a Potential problem determination is based upon these variables : 1) fertilizer<br />
loading density, 2) pesticide loading density, 3) animal unit density,<br />
4) amount of sediment delivered to streams .<br />
274
Table EIR 20 . Florida surface water dischargers with current wasteload<br />
allocations (WLA's) (Florida Department of Environmental Regulation 1979b)<br />
County Discharger Receiving water<br />
Bay Captain Andersons Restaurant Grand Lagoon<br />
GYMZ Corp . Callaway Bayou<br />
Highland Park School Goose Bayou<br />
KOA Panama pty Alligator Bayou<br />
Molemors TP b Martins Bayou<br />
Morris Manor SD Martins Bayou<br />
Noah Legears MHPc<br />
Ditch to canal<br />
Parker Elementary School Parker Bayou<br />
Parkway Apartments Pitts Bayou<br />
Pines Mobile Homes Parker Creek<br />
Prows TP Watson Bayou<br />
St . Andrews Estates Robi Bayou N . Bay<br />
Venture Out In America Grand Lagoon<br />
Woodlawn SD d North Bay<br />
Escambia Avondale STP Bayou Marcus<br />
Avondale STP Bayou Marcus Creek<br />
City of Cantonment Eleven Mile Creek<br />
City of Cantonment Jacks Branch<br />
Ernest Ward High School Pine Barren Creek<br />
Escambia County Road Camp Eleven Mile Creek<br />
Lakeview MHP Eight Mile Creek<br />
Lincoln Park SD Eleven Mile Creek<br />
Montclair STP Bayou Marcus<br />
Prison Camp SR-297A Eleven Mile Creek<br />
St . Regis Paper Co . Eleven Mile Creek<br />
Timberlake MHP Bayou Marcus Creek<br />
Bayou Grande Villa STP Bayou Grande<br />
City of Warrington Bayou Chico<br />
City of Pensacola Main St . STP Pensacola Bay<br />
Fountain Blue MHP Bayou Chico<br />
Moreno Courts Bayou Chico<br />
Moreno Courts Jones Creek Swamp<br />
Pen Haven STP Bayou Chico<br />
Santa Rosa Beach Administration Santa Rosa Sound<br />
Santa Rosa Island Authority Santa Rosa Sound<br />
Warrington Jones Creek Swamp<br />
Pensacola NE . STP Escambia Bay<br />
Reynolds Shopping Center Eight Mile Creek<br />
Bluff Springs Campground Canoe Creek<br />
Boise Cascade Salters Creek<br />
City of Sentury Escambia River<br />
Monsanto Corp . Escambia River<br />
University of West Florida Thompson Bayou<br />
Continued<br />
275
Table EIR 20 . Concluded .<br />
County Discharger<br />
Escambia University of West Florida<br />
Gulf City of Wewahitchka STP<br />
Okaloosa Okaloosa County Airport<br />
Santa Rosa Santa Rosa County Beach Administration<br />
Air Products and Chemical Corp .<br />
American Cyanamide<br />
Santa Villa SD<br />
Town of Jay<br />
City of Milton<br />
City of Gulf Breeze STP<br />
NAS Whiting Field<br />
Walton Freeport High School<br />
Showell Farms Inc .<br />
b Trailer park .<br />
Subdivision .<br />
d Mobile home park .<br />
Sewage treatment plant .<br />
276<br />
Receiving water<br />
Escambia River<br />
Chipola River<br />
Moccasin Branch<br />
Santa Rosa Sound<br />
Pond Creek<br />
Pond Creek<br />
Pond Creek<br />
Pray Mill Creek<br />
Blackwater River<br />
Santa Rosa Sound<br />
Clear Creek<br />
Unnamed creek<br />
Carpenters
AlA &AMA<br />
Santa ~<br />
Rosa R<br />
~ Walt A ayh,<br />
- lon<br />
J ar_•hson Ga<br />
Ca1 - Tallah<br />
ulf Breeze<br />
~. noun '<br />
PanamaCl ~<br />
Bay<br />
Llpertyl<br />
~ District Boundaries<br />
7k District Offices<br />
O Subdistrict Offices<br />
• Branch Offices<br />
A Northwest District<br />
S St. Johns River District<br />
- GuIF FranN<br />
_ !<br />
® St . Johns River Subdistrict<br />
C Southwest District<br />
0 South Florida District<br />
GEORGIA i<br />
1<br />
Jacksonville<br />
-y Lakd<br />
C!trus m .<br />
!noie<br />
Hernando ~ ando~~<br />
. ~ .<br />
Pasco<br />
i '.f~s . .,~p (UJ<br />
~ Hrll F .<br />
y' orouphC PlI<br />
~t Tampa~ -<br />
a<br />
1 Manatee Hardee<br />
~ ~<br />
ara -<br />
De Sotrt anla^ ~,<br />
Punta fiorda :;<br />
.hut!v :<br />
1 ~<br />
Ft . Myers<br />
Oollier<br />
D<br />
s<br />
MO :v - ~O<br />
+<br />
p .ar' 1° ~ Marathon<br />
Ft . Pierce<br />
:~~~ r Wsst Palm<br />
Beach<br />
South Florida SuDdistrlot<br />
tt : ;es<br />
~ :+~::w 0 p 100 1f+f<br />
Figure 24 . Districts and subdistricts of the Florida Department of Environmental<br />
Regulation (Florida Power and Light Co . 19.79) .<br />
277<br />
i
Table EIR 21 . PNSa water quality violations from 1974 to 1978 (Florida<br />
Department of Environmental Regulation 1979c) .<br />
DO b PH TCOLIC FCOLI d<br />
County Name Ne NVfN NV N NV N NV<br />
Bay St . Andrews Bay 31 2 50 3 32 2 9 0<br />
Escambia Perdido Bay 45 0 55 31 49 4 22 1<br />
Perdido River 41 1 59 1 37 0 13 1<br />
Escambia Bay 55 0 66 3 55 5 20 9<br />
Escambia River 42 2 61 3 43 0 18 0<br />
Gulf Apalachicola River 31 0 48 1 30 1 12 0<br />
St . Josephs Bay 3 0 8 1 4 0 0 0<br />
Okaloosa Choctawhatchee Bay 35 1 51 1 35 1 12 0<br />
Blackwater River 48 0 65 1 43 0 19 1<br />
Santa Rosa Escambia River 28 0 35 4 25 0 2 0<br />
East Bay 46 0 56 39 44 5 19 2<br />
Walton Choctawhatchee River 30 0 46 0 31 3 11 1<br />
a Permanent Network Stations, established in 1973, for the purpose of<br />
~onitoring water quality in Florida's lakes, streams and estuaries .<br />
Dissolved oxygen .<br />
d Total coliform .<br />
Fecal coliform .<br />
f Number of samples .<br />
Number of violations .<br />
278
Table EIR 22 . Water used for public supplies in Water Resources Council (WRC)<br />
subregions in 1970 (Pride 1973) .<br />
Water withdrawn Mgal/d a<br />
WRC Subregion GWb SWc All water Per capita<br />
WRC Subregion 0312<br />
Frankl in 0 .50 0 .00 0 .50 125 .00<br />
Subregion 15 .30 1 .20 16 .50 142 .00<br />
WRC Subregion 0313<br />
Gul f 0 .10 0 .40 0 .50 83 .00<br />
Subregion 1 .90 0 .40 2 .30 95 .00<br />
WRC Subregion 0314<br />
Bay 0 .70 37 .40 38 .10 982 .00<br />
Escambi a 20 .30 0 .00 20 .30 128 .00<br />
Okaloosa 7 .90 0 .00 7 .90 130 .00<br />
Santa Rosa 2 .40 0 .00 2 .40 162 .00<br />
Walton 0 .70 0 .00 0 .70 76 .00<br />
Subreg i on 32 .70 37 .40 70 .10 243 .00<br />
Florida 758 .80 124 .70 883 .50 163 .00<br />
Continued<br />
279
Table EIR 22 . Concluded .<br />
Water delivered (Mgal/d)<br />
Industrial and commercial Domestic<br />
Except use and<br />
WRC Subregion A/Cd A/C All uses • losses Consumed<br />
WRC Subregion 0312<br />
Frankl in 0 .00 0 .10 0 .10 0 .40 0 .10<br />
Subreg i on 1 .20 5 .20 6 .40 10 .10 5 .40<br />
WRC Subregion 0313<br />
Gu 1 f 0 .02 0 .03 0 .05 0 .40 0 .20<br />
Subreg i on 0 .02 0 .23 0 .30 2 .00 0 .70<br />
WRC Subregion 0314<br />
Bay 0 .60 32 .30 32 .90 5 .20 4 .80<br />
Escambia 0 .90 4 .70 5 .60 14 .70 8 .10<br />
Okaloosa 0 .10 2 .30 2 .40 5 .50 2 .00<br />
Santa Rosa 0 .00 0 .60 0 .60 1 .80 0 .60<br />
Walton 0 .00 0 .10 0 .10 0 .60 0 .30<br />
Subreg i on 1 .60 40 .00 41 .60 28 .50 16 .00<br />
F 1 or i d a 46 .20 120 .00 166 .20 717 .30 234 .80<br />
b Million gal per day .<br />
Ground water .<br />
d Surface water .<br />
Air conditioning .<br />
280
Table EIR 23 . Water used for irrigation in Water Resources Council (WRC)<br />
subregions in 1970 (Pride 1973) .<br />
Water withdrawn (Mgal/d) a<br />
onveyance Consumptive<br />
WRC Subreg ion S W b GWc Oth er A11<br />
l oss use<br />
WRC Subregion 0312<br />
Fr an k l i n 0 .00 0 .00 0 .00 0 .00 0 .00 0 .00<br />
Subreg i on 2 .15 1 .04 0 .00 3 .20 0 .00 2 .50<br />
WRC Subregion 0313<br />
Gu 1 f 0 .00 0 .00 0 .00 0 .00 0 .00 0 .00<br />
Subregion 0 .05 0 .83 0 .00 0 .90 0 .00 0 .60<br />
WRC Subregion 0314<br />
Bay 0 .00 0 .30 0 .00 0 .30 0 .00 0 .20<br />
Escambia 0 .00 0 .10 0 .00 0 .10 0 .00 0 .10<br />
Okaloosa 0 .00 0 .00 0 .00 0 .00 0 .00 0 .00<br />
Santa Rosa 0 .00 0 .20 0 .00 0 .20 0 .00 0 .10<br />
Walton 0 .00 10 .10 0 .00 10 .10 0 .00 7 .60<br />
Subreg i on 0 .00 10 .76 0 .00 10 .76 0 .00 8 .00<br />
Florida 898 .43 1,172 .24 28 .11 2,070 .66 127 .10 1,270 .40<br />
b Million gal per day .<br />
Surf ace water .<br />
c Ground water .<br />
281
Table EIR 24 . Self-supplied water for industrial use in Water Resources Council<br />
(WRC) subregions in 1970 (Pride 1973) .<br />
Water withdrawn (Mgal/d)a<br />
Ground water Surface water All water<br />
Water<br />
consumed<br />
WRC Subregion Fres a ine Fres a ine Fres a ine fresh<br />
WRC Subregion 0312<br />
Frankl in 0 .00 0 .00 0 .00 0 .00 0 .00 0 .00 0 .00<br />
Subreg i on 83 .40 0 .00 3 .00 0 .00 86 .40 0 .00 7 .60<br />
WRC Subregion 0313<br />
Gu 1 f 19 .00 0 .00 36 .00 15 .80 55 .00 15 .80 9 .10<br />
Subreg i on 20 .20 0 .00 36 .00 15 .80 56 .20 15 .80 9 .30<br />
WRC Subregion 0314<br />
Bay 2 .00 0 .00 0 .05 0 .00 2 .05 0 .00 0 .50<br />
Escambia 47 .80 0 .10 42 .90 0 .00 90 .70 0 .10 27 .10<br />
Okaloosa 4 .70 0 .00 0 .00 0 .00 4 .70 0 .00 1 .60<br />
Santa Rosa 10 .30 0 .00 0 .00 0 .00 10 .30 0 .00 5 .20<br />
Walton 1 .20 0 .00 0 .00 0 .00 1 .20 0 .00 0 .20<br />
Subreg i on 66 .00 0 .10 42 .95 0 .00 108 .95 0 .10 34 .60<br />
F l or i d a 736 .20 86 .90 190 .60 45 .60 926 .80 132 .50 163 .10<br />
Continued<br />
282
N<br />
~ W<br />
Table EIR 24 . Concluded .<br />
Fresh water use b major classification (M al/d)<br />
Phosp ate Pu p paper Citrus Limeroc emica pro ucts Other<br />
WRC Subregion mining processing processing mining processing<br />
WRC Subregion 0312<br />
Franklin 0 .00 0 .00 0 .00 0 .00 0 .00 0 .00<br />
Subregion 0 .00 53 .70 0 .00 0 .00 0 .00 32 .70<br />
WRC Subregion 0313<br />
Gu l f 0 .00 55 .00 0 .00 0 .00 0 .00 0 .00<br />
Subregion 0 .00 55 .00 0 .00 0 .00 0 .00 1 .20<br />
WRC Subregion 0314<br />
Bay 0 .00 2 .00 0 .00 0 .00 0 .00 0 .05<br />
Escambi a 0 .00 26 .20 0 .00 0 .00 54 .30 10 .20<br />
Okaloosa 0 .00 0 .00 0 .00 0 .00 0 .00 4 .70<br />
Santa Rosa 0 .00 0 .00 0 .00 0 .00 9 .50 0 .80<br />
Walton 0 .00 0 .00 0 .00 0 .00 0 .00 1 .20<br />
Subreg i on 0 .00 28 .20 0 .00 0 .00 63 .80 16 .15<br />
Florida 318 .30 237 .40 86 .50 28 .90 97 .10 158 .60<br />
a Million gal per day .
Table EIR 25 . Water used for thermoelectric power in Water Resources Council<br />
(WRC) subregions in 1970 (Pride 1973) .<br />
Cooling water (Mgal/d) a<br />
Self-sup plied Ground water Public<br />
WRC Subregion Fresh Saline Fres Sa ine supply<br />
WRC Subregion 0312<br />
Frankl in 0 .00 0 .00 0 .00 0 .00 0 .00<br />
Subregion 160 .00 0 .00 0 .00 0 .00 0 .00<br />
WRC Subregion 0313<br />
Gu 1 f 0 .00 0 .00 0 .00 0 .00 0 .00<br />
Subreg i on 144 .00 0 .00 1 .40 0 .00 0 .00<br />
WRC Subregion 0314<br />
Bay<br />
Escambia<br />
Okaloosa<br />
Santa Rosa<br />
Walton<br />
Subregion<br />
Florida<br />
0 .00 274 .00 0 .10 0 .00 0 .00<br />
205 .00 15 .00 0 .80 0 .00 0 .00<br />
0 .00 0 .00 0 .00 0 .00 0 .00<br />
0 .00 0 .00 0 .00 0 .00 0 .00<br />
0 .00 0 .00 0 .00 0 .00 0 .00<br />
205 .00 289 .00 0 .90 0 .00 0 .00<br />
1675 .00 9340 .00<br />
Continued<br />
284<br />
10 .90 50.10 2 .30
Table EIR 25 . Concluded .<br />
Other water (Mgal/d)<br />
Self-su lied<br />
Sur ace Ground Water consumed<br />
WRC Subregion fresh fresh Public supply res a ine<br />
WRC Subregion 0312<br />
Frankl in 0 .00 0 .00 0 .00 0 .00 0 .00<br />
Subreg i on 0 .00 0.30 0 .00 1 .40 0 .00<br />
WRC Subregion 0313<br />
Gu 1 f 0 .00 0 .00 0 .00 0 .00 0 .00<br />
Subreg i on 0 .00 0 .00 0 .00 0 .90 0 .00<br />
WRC Subregion 0314<br />
Bay 0 .00 0 .00 0 .00 0 .30 3 .50<br />
Escamb i a 0 .00 0 .00 0 .00 6 .40 0 .00<br />
Okaloosa 0 .00 0 .00 0 .00 0 .00 0 .00<br />
Santa Rosa 0 .00 0 .00 0 .00 0 .00 0 .00<br />
Wal ton 0 .00 0 .00 0 .00 0 .00 0 .00<br />
Subreg i on 0 .00 0 .00 0 .00 6 .70 3 .50<br />
Florida 0 .00 1 .00 2 .50 19 .70 86 .00<br />
a Million gal per day .<br />
285
Table EIR 26 . Water used for public supplies in 1975 (Leach 1978) .<br />
Water withdrawn (Mgal/d) a<br />
County GWb SWc Total Per capita<br />
Bay 1 .95 32 .59 34 .54 418 .00<br />
Escambia 27 .46 0 .34 27 .80 145 .00<br />
Frankl i n 0 .99 0 .00 0 .99 148 .00<br />
Gulf 0 .11 0 .64 0 .75 114 .00<br />
Okaloosa 9 .31 0 .00 9 .31 117 .00<br />
Santa Rosa 3 .40 0 .00 3 .40 90 .00<br />
Walton 1 .08 0 .00 1 .08 102 .00<br />
Region 44 .30 33 .57 77 .87 N .D .<br />
Florida 982 .83 162 .98 1145 .81 168 .00<br />
Water delivered by uses (Mgal/d)<br />
PuGTi c<br />
County supply Agriculture Industry Commercial A/Cd Consumed<br />
Bay 7 .84 0 .00 25 .56 1 .14 0 .00 12 .49<br />
Escambia 19 .43 0 .06 0 .00 8 .31 0 .00 5 .51<br />
Franklin 0 .72 0 .00 0 .06 0 .22 0 .00 0 .69<br />
Gulf 0 .47 0 .00 0 .26 0 .01 0 .00 0 .15<br />
Okaloosa 8 .53 0 .12 0 .00 0 .66 0 .00 4 .16<br />
Santa Rosa 2 .99 0 .06 0 .00 0 .35 0 .00 1 .04<br />
Walton 0 .86 0 .00 0 .02 0 .18 0 .02 0 .52<br />
Reg i on 40 .84 0 .24 25 .90 10 .87 0 .02 24 .56<br />
Florida 923 .58 24 .71 80 .90 83 .62 33 .00 559 .97<br />
b Million gal per day .<br />
Ground water .<br />
d Surface water .<br />
Air conditioning .<br />
286
Table EIR 27 . Rural water use in 1975 (Leach 1978) .<br />
County<br />
Domestic use (Mgal/d)a<br />
Withdrawn<br />
SW GWc A Consumed<br />
Livestock use (Mg al/d)<br />
Withdrawn<br />
SW GW A<br />
Consumed<br />
Bay 0 .00 0 .89 0 .89 0 .18 0 .16 0 .07 0 .23 0 .23<br />
Escambia 0 .00 3 .28 3 .28 0 .60 0 .17 3 .02 3 .19 3 .19<br />
Fr an k l i n 0 .00 0 .12 0 .12 0 .03 0 .01 0 .00 0 .01 0 .01<br />
Gu 1 f 0 .00 0 .43 0 .43 0 .08 0 .08 0 .04 0 .12 0 .12<br />
Okaloosa 0 .00 2 .21 2 21 0 .44 0 .11 0 .07 0 .18 0 .18<br />
Santa Rosa 0 .00 1 .05 1 .05 0 .21 0 .17 0 .07 0 .24 0 .24<br />
Wal ton 0 .74 0 .00 0 .74 0 .59 0 .14 0 .08 0 .22 0 .22<br />
Reg i on 0 .74 7 .98 8 .72 2 .13 0 .84 3 .35 4 .19 4 .19<br />
Florida 2 .05 200 .93 202 .98 50 .33 12 .15 50 .87 63 .02 62 .57<br />
All uses (Mgal/d)<br />
Withdrawn<br />
County SW GW A Consumed<br />
Bay 0 .16 0 .96 1 .12 0 .41<br />
Escambia 0 .17 6 .30 6 .47 3 .79<br />
Frankl in 0 .01 0 .12 0 .13 0 .04<br />
Gu 1 f 0 .08 0 .47 0 .55 0 .20<br />
Okaloosa 0 .11 2 .28 2 .39 0 .62<br />
Santa Rosa 0 .17 1 .12 1 .29 0 .45<br />
Wal ton 0 .88 0 .08 0 .96 0 .81<br />
Reg i on 0 .81 13 .53 14 .34 6 .13<br />
Florida 14 .20 251 .80 266 .00 112 .90<br />
b Million gal per day .<br />
Surface water .<br />
c Ground water .<br />
287
Table EIR 28 . Water used for irrigation in 1975 (Leach 1978) .<br />
Total water withdrawn ( M al/d) a<br />
Conveyance Consumptive<br />
County SWb GWc All loss use<br />
B ay 0 .00 0 .00 0 .00 0 .00 0 .00<br />
Escambia 0 .27 0 .63 0 .90 0 .00 0 .18<br />
Franklin 0 .00 0 .00 0 .00 0 .00 0 .00<br />
Gulf 0 .00 0 .22 0 .22 0 .00 0 .09<br />
Okaloosa 0 .34 0 .38 0 .72 0 .00 0 .14<br />
Santa Rosa 0 .00 0 .33 0 .33 0 .00 0 .07<br />
Walton 0 .19 0 .59 0 .78 0 .00 0 .13<br />
Reg i on 0 .46 2 .29 2 .75 0 .00 0 .83<br />
Florida 1,628 .52 1,238 .96 1,867 .48 218 .11 1,331 .86<br />
b Million gal per day .<br />
Surf ace water .<br />
c Ground water .<br />
288
Table EIR 29 . Self-supplied water for industrial use in 1975 (Leach 1978) .<br />
Water withdrawn (Mgal/d) a<br />
Ground water Surface water All water Water<br />
County Fresh Sa ine Fresh Sa ine Fresh Sa ine consumed<br />
Bay<br />
Escambia<br />
Franklin<br />
Gulf<br />
Okaloosa<br />
Santa Rosa<br />
Walton<br />
Region<br />
Florida<br />
1 .35 0 .00<br />
44 .75 2 .80<br />
0 .01 0 .00<br />
0 .52 0 .00<br />
6 .05 0 .00<br />
17 .67 0 .00<br />
0 .41 0 .00<br />
70 .76 2 .80<br />
778 .92 47 .80<br />
0 .00 0 .00<br />
31 .70 0 .24<br />
0 .00 0 .00<br />
33 .20 13 .00<br />
0 .00 0 .05<br />
0 .00 0 .00<br />
0 .00 0 .00<br />
63 .90 13 .29<br />
160 .70 15 .24<br />
1 .35 0 .00 0 .33<br />
76 .45 3 .04 18 .02<br />
0 .01 0 .00 0 .01<br />
33 .72 13 .00 18 .35<br />
6 .05 0 .00 1 .23<br />
17 .67 0 .00 4 .83<br />
0 .41 0 .00 0 .27<br />
118 .40 16 .04 38 .48<br />
939 .62 63 .04 262 .91<br />
Water use b major classification (M al/d)<br />
Li oc Pu p emica P osphate<br />
County mining and paper products mining<br />
Bay<br />
Escambia<br />
Franklin<br />
Gu1f<br />
Okaloosa<br />
Santa Rosa<br />
Walton<br />
Region<br />
Florida<br />
0 .00 0 .33 0 .50 0 .00<br />
0 .00 24 .00 45 .78 0 .00<br />
0 .00 0 .00 0 .00 0 .00<br />
0 .00 32 .20 14 .50 0 .00<br />
0 .00 0 .00 0 .00 0 .00<br />
0 .00 0 .00 8 .20 0 .00<br />
0 .00 0 .00 0 .00 0 .00<br />
0 .00 56 .53 68 .98 0 .00<br />
87 .97 225 .31 100 .05 270 .33<br />
Continued<br />
289
Table EIR 29 . Concluded .<br />
Water use by major classification (Mgal/d)<br />
i rus Food<br />
County processing processing A/Cb Other<br />
B ay 0 .00 0 .21 0 .00 0 .31<br />
Escambia .0 .00 0 .00 0 .24 9 .47<br />
Frankl in 0 .00 0 .01 0 .00 0 .00<br />
Gu l f 0 .00 0 .00 0 .00 0 .02<br />
Okaloosa 0 .00 0 .00 0 .00 6 .05<br />
Santa Rosa 0 .00 0 .00 0 .64 8 .83<br />
Wal ton 0 .00 0 .41 0 .00 0 .00<br />
Reg i on 0 .00 0 .63 0 .88 24 .68<br />
Florida 69 .94 65 .77 52 .69 130 .75<br />
b Million g al per day .<br />
Air conditioning .<br />
290
Table EIR 30 . Water used for thermoelectric power in 1975 (Leach 1978) .<br />
Cooling water ( Mgal/d) a<br />
Self-su lied<br />
Groun water Surface water<br />
County Fresh Sa ine Fresh Sa ine Public supply<br />
Bay 0 .00 0 .00 0 .00 228 .70 0 .00<br />
E sc amb i a 0 .00 0 .00 265 .40 0 .00 0 .00<br />
Frankl in 0 .00 0 .00 0 .00 0 .00 0 .00<br />
Gu 1 f 0 .00 0 .00 0 .00 0 .00 0 .00<br />
Okaloosa 0 .00 0 .00 0 .00 0 .00 0 .00<br />
Santa Rosa 0 .00 0 .00 0 .00 0 .00 0 .00<br />
Walton 0 .00 0 .00 0 .00 0 .00 0 .00<br />
Reg i on 0 .00 0 .00 265 .40 228 .70 0 .00<br />
Florida 51 .70 47 .50 1,633 .00 11,391 .50 1 .44<br />
Other water (Mgal/d)<br />
Self-supplied<br />
Ground Surface Water consumed<br />
County fresh fresh Public supply Fres a ine<br />
Bay 0 .68 0 .00 0 .00 0 .50 2 .10<br />
Escambi a 2 .52 0 .00 0 .00 7 .70 0 .00<br />
Frankl i n 0 .00 0 .00 0 .00 0 .00 0 .00<br />
Gulf 0 .00 0 .00 0 .00 0 .00 0 .00<br />
Okaloosa 0 .00 0 .00 0 .00 0 .00 0 .00<br />
Santa Rosa 0 .00 0 .00 0 .00 0 .00 0 .00<br />
Walton 0 .00 0 .00 0 .00 0 .00 0 .00<br />
Reg i on 3 .20 0 .00 0 .00 8 .20 2 .10<br />
Florida 8 .45 2 .39 1 .64 36 .10 91 .10<br />
a Million gal per day .<br />
291
Table EIR 31 . Water used for public supplies by hydrologic unit in 1975 (Leach<br />
1978) .<br />
Water withdrawn (Mgal/d) a<br />
County GWb SWc Total Per capita<br />
Hydrologic unit 0312<br />
Frankl in 0 .00 0 .00 0 .00 0 .00<br />
Un i t 16 .93 1 .18 18 .11 146 .00<br />
Hydrologic unit 0313<br />
Bay 0 .00 0 .00 0 .00 0 .00<br />
Frankl in 0 .99 0 .00 0 .99 148 .00<br />
Gu l f 0 .03 0 .00 0 .03 43 .00<br />
Un i t 3 .06 0 .01 3 .07 108 .00<br />
Hydrologic unit 0314<br />
Bay 1 .95 32 .59 34 .54 418 .00<br />
Escambia 27 .46 0 .34 27 .80 145 .00<br />
Gu l f 0 .08 0 .64 0 .72 122 .00<br />
Okaloosa 9 .31 0 .00 9 .31 117 .00<br />
Santa Rosa 3 .40 0 .00 3 .40 90 .00<br />
Walton 1 .08 0 .00 1 .08 102 .00<br />
Un i t 44 .51 33 .57 78 .08 185 .00<br />
Florida 982 .84 162 .98 1145 .82 168 .00<br />
Continued<br />
292
Table EIR 31 . Concluded .<br />
County<br />
Pub-i c<br />
supply<br />
Hydrologic unit 0312<br />
Water<br />
Agriculture<br />
delivered by<br />
Industry<br />
uses (Mgal/d)<br />
Commercial<br />
d<br />
A/C<br />
Water<br />
consumed<br />
Frankl in 0 .00 0 .00 0 .00 0 .00 0 .00 0 .00<br />
Un i t 15 .11 0 .01 0 .00 2 .99 0 .00 5 .04<br />
Hydrologic unit 0313<br />
B ay 0 .00 0 .00 0 .00 0 .00 0 .00 0 .00<br />
Frankl in 0 .72 0 .00 0 .06 0 .22 0 .00 0 .69<br />
Gu 1 f 0 .03 0 .00 0 .00 0 .00 0 .00 0 .01<br />
Unit 2 .21 0 .01 0 .18 0 .66 0 .01 1 .27<br />
Hydrologic unit 0314<br />
Bay 7 .84 0 .00 25 .56 1 .14 0 .00 12 .49<br />
Escambia 19 .43 0 .06 0 .00 8 .31 0 .00 5 .51<br />
Gu 1 f 0 .44 0 .00 0 .26 0 .01 0 .00 0 .14<br />
Okaloosa 8 .53 0 .12 0 .00 0 .66 0 .00 4 .16<br />
Santa Rosa 2 .99 0 .06 0 .00 0 .35 0 .00 1 .04<br />
Walton 0 .86 0 .00 0 .02 0 .18 0 .02 0 .52<br />
Un i t 41 .21 0 .24 25 .91 10 .71 0 .02 24 .39<br />
Florida 923 .59 24 .71 80 .90 83 .63 33 .00 559 .98<br />
b Million gal per day .<br />
Ground water .<br />
d Surface water .<br />
Air conditioning .<br />
293
Table EIR 32 . Rural water used by hydrologic unit in 1975 (Leach 1978) .<br />
Domestic use (Mgal/d) a Livestock use (Mgal/d)<br />
Withdrawn Withdrawn<br />
County SWb GWc All Consumed SW GW All Consumed<br />
Hydrologic unit 0312<br />
Frankl in 0 .00 0 .01 0 .01 0 .01<br />
Un i t 0 .10 5 .48 5 .58 2 .07<br />
Hydrologic unit 0313<br />
B ay 0 .00 0 .01 0 .01 0 .00<br />
Frankl in 0 .00 0 .11 0 .11 0 .02<br />
Gulf 0 .00 0 .27 0 .27 0 .05<br />
Un i t 0 .01 3 .51 3 .52 1 .19<br />
Hydrologic unit 0314<br />
B ay 0 .00 0 .88 0 .88 0 .18<br />
Escambia 0 .00 3 .28 3 .28 0 .60<br />
Gu l f 0 .00 0 .16 0 .16 0 .03<br />
Okaloosa 0 .00 2 .21 2 .21 0 .44<br />
Santa Rosa 0 .00 1 .05 1 .05 0 .21<br />
Walton 0 .74 0 .00 0 .74 0 .59<br />
Un i t 0 .74 9 .61 10 .35 2 .93<br />
Florida 2 .05 200 .93 202 .98 50 .33<br />
Continued<br />
294<br />
0 .00 0 .00 0 .00 0 .00<br />
0 .22 0 .41 0 .63 0 .63<br />
0 .00 0 .00 0 .00 0 .00<br />
0 .01 0 .00 0 .01 0 .01<br />
0 .05 0 .03 0 .08 0 .08<br />
0 .52 0 .33 0 .85 0 .85<br />
0 .16 0 .07 0 .23 0 .23<br />
0 .17 3 .02 3 .19 3 .19<br />
0 .03 0 .01 0 .04 0 .04<br />
0 .11 0 .07 0 .18 0 .18<br />
0 .17 0 .07 0 .24 0 .24<br />
0 .14 0 .08 0 .22 0 .22<br />
1 .13 3 .61 4 .74 4 .74<br />
12 .15 50 .87 63 .02 62 .57
Table EIR 32 . Concluded .<br />
All uses (Mgal/d)<br />
Withdrawn<br />
County Consumed<br />
Hydrologic unit 0312<br />
Frankl in 0 .00 0 .01 0 .01 0 .01<br />
Un i t 0 .32 5 .89 6 .21 2 .70<br />
Hydrologic unit 0313<br />
B ay 0 .00 0 .01 0 .01 0 .00<br />
Frankl in 0 .01 0 .11 0 .12 0 .03<br />
Gu l f 0 .05 0 .30 0 .35 0 .13<br />
Un i t 0 .53 3 .84 4 .37 2 .04<br />
Hydrologic unit 0314<br />
Bay 0 .16 0 .95 1 .11 0 .41<br />
Escambi a 0 .17 6 .30 6 .47 3 .79<br />
Gu l f 0 .03 0 .17 0 .20 0 .07<br />
Okaloosa 0 .11 2 .28 2 .39 0 .62<br />
Santa Rosa 0 .17 1 .12 1 .29 0 .45<br />
Wal ton 0 .88 0 .08 0 .96 0 .81<br />
Un i t 1 .87 13 .22 15 .09 7 .67<br />
F l or i d a 14 .20 251 .80 266 .00 112 .90<br />
b Million gal per day .<br />
Surf ace water .<br />
c Ground water .<br />
295
Table EIR 33 . Water used for irrigation by hydrologic unit in 1975 (Leach 1978) .<br />
Total water withdrawn (Mgal/d) a<br />
Conveyance Consumptive<br />
County SWb GWc All loss use<br />
Hydrologic unit 0312<br />
Fr an k 1 i n 0 .00 0 .00 0 .00 0 .00 0 .00<br />
Unit 2 .19 0 .67 2 .86 0 .00 0 .47<br />
Hydrologic unit 0313<br />
B ay 0 .00 0 .00 0 .00 0 .00 0 .00<br />
Fr an k l i n 0 .00 0 .00 0 .00 0 .00 0 .00<br />
Gul f 0 .00 0 .00 0 .00 0 .00 0 .00<br />
Un i t 2 .35 5 .77 8 .12 0 .00 1 .88<br />
Hydrologic unit 0314<br />
Bay 0 .00 0 .00 0 .00 0 .00 0 .00<br />
Escambia 0 .27 0 .63 0 .90 0 .00 0 .18<br />
Gu l f 0 .0 0 .22 0 .22 0 .00 0 .09<br />
Okaloosa 0 .34 0 .38 0 .72 0 .00 0 .14<br />
Santa Rosa 0 .00 0 .33 0,33 0 .00 0 .07<br />
Wal ton 0 .19 0 .59 0 .78 0 .00 0 .13<br />
Un i t 0 .96 2 .96 3 .93 0 .00 0 .83<br />
Florida 1,628 .52 1,238 .96 2,867 .48 218 .11 1,331 .87<br />
b Million gal per day .<br />
Surf ace water .<br />
c Ground water .<br />
296
Table EIR 34 . Self supplied water for industrial use by hydrologic unit in 1975<br />
(Leach 1978) .<br />
Water withdrawn (Mgal/d)a<br />
Ground water Surf ace water All water Water<br />
County Fresh Saline Fresh Sa ine Fresh h Saline consumed<br />
Hydrologic unit 0312<br />
Franklin 0 .00 0 .00 0 .00 0 .00 0 .00 0 .00 0 .00<br />
Un i t 34 .85 0 .00 0 .54 0 .00 35 .39 0 .00 1 .75<br />
Hydrologic unit 0313<br />
Bay 0 .00 0 .00 0 .00 0 .00 0 .00 0 .00 0 .00<br />
Frankl in 0 .01 0 .00 0 .00 0 .00 0 .01 0 .00 0 .01<br />
Gu 1 f 0 .00 0 .00 0 .00 0 .00 0 .00 0 .00 0 .00<br />
Un i t 1 .17 0 .00 1 .83 0 .00 3 .00 0 .00 1 .23<br />
Hydrologic unit 0314<br />
Bay 1 .35 0 .00 0 .00 0 .00 1 .35 0 .00 0 .33<br />
Esc amb i a 44 .75 2 .80 31 .70 0 .24 76 .45 3 .04 18 .02<br />
Gulf 0 .52 0 .00 33 .20 13 .00 33 .72 13 .00 18 .35<br />
Okaloosa 6 .05 0 .00 0 .00 0 .00 6 .05 0 .00 1 .23<br />
Santa Rosa 17 .67 0 .00 0 .00 0 .00 17 .67 0 .00 4 .83<br />
Wal ton 0 .41 0 .00 0 .00 0 .00 0 .41 0 .00 0 .27<br />
Un i t 70 .77 2 .80 64 .90 13 .24 135 .67 16 .04 43 .03<br />
F l or i d a 778 .92 47 .80 160 .70 15 .24 939 .62 63 .04 262 .91<br />
Continued<br />
297
Table EIR 34 . Continued .<br />
Fresh water use b major classification (Mgal/d)<br />
Limerock Pu p Chemica Phosphate<br />
County mining and paper products mining<br />
Hydrologic unit 0312<br />
Franklin 0 .00 0 .00 0 .00 0 .00<br />
U n i t 0 .00 0 .00 0 .15 0 .00<br />
Hydrologic unit 0313<br />
B ay 0 .00 0 .00 0 .00 0 .00<br />
Franklin 0 .00 0 .00 0 .00 0 .00<br />
Gu l f 0 .00 0 .00 0 .00 0 .00<br />
Un i t 0 .00 0 .00 0 .00 0 .00<br />
Hydrologic unit 0314<br />
B ay 0 .00 0 .33 0 .50 0 .00<br />
E sc amb i a 0 .00 24 .00 45 .78 0 .00<br />
Gu 1 f 0 .00 32 .20 14 .50 0 .0<br />
Okaloosa 0 .00 0 .00 0 .00 0 .00<br />
Santa Rosa 0 .00 0 .00 8 .20 0 .00<br />
Wal ton 0 .00 0 .00 0 .00 0 .00<br />
Un i t 0 .00 56 .53 68 .98 0 .00<br />
Florida 87 .97 225 .31 100 .05 270 .33<br />
Continued<br />
298
Table EIR 34 . Concluded .<br />
Water use b major classification (M al/d)<br />
Citrus Foo<br />
County processing processing A/C b<br />
Other<br />
Hydrologic unit 0312<br />
Fr an k l i n 0 .00 0.00 0 .00 0 .00<br />
Uni t 0 .00 0 .00 33 .61 1 .63<br />
Hydrologic unit 0313<br />
Bay 0 .00 0 .00 0 .00 0 .00<br />
Frankl in 0 .00 0 .01 0 .00 0 .00<br />
Gu 1 f 0 .00 0 .00 0 .00 0 .00<br />
Un i t 0 .00 0 .01 0 .00 2 .99<br />
Hydrologic unit 0314<br />
B ay 0 .00 0 .21 0 .00 0 .31<br />
Escambia 0 .00 0 .00 0 .24 9 .47<br />
Gu 1 f 0 .00 0 .00 0 .00 0 .02<br />
Okaloosa 0 .00 0 .00 0 .00 6 .05<br />
Santa Rosa 0 .00 0 .00 0 .64 8 .83<br />
Wal ton 0 .00 0 .41 0 .00 0 .00<br />
Un i t 0 .00 0 .62 0 .88 24 .70<br />
Florida 69 .94 65 .77 52 .69 130 .75<br />
b Million gal per day .<br />
Air conditioning .<br />
299
Table EIR 35 . Water used for theromelectric power by hydrologic unit in 1975<br />
(Leach 1978) .<br />
Cooling water (Mgal/d) a<br />
Self-su lied<br />
Groun water urf ace water<br />
County res Saline Fres a ine Public supply<br />
Hydrologic unit 0312<br />
Frankl in 0 .00 0 .00 0 .00 0 .00 0 .00<br />
Un i t 1 .00 0 .00 104 .60 0 .00 0 .00<br />
Hydrologic unit 0313<br />
B ay 0 .00 0 .00 0 .00 0 .00 0 .00<br />
Frankl in 0 .00 0 .00 0 .00 0 .00 0 .00<br />
Gulf 0 .00 0 .00 0 .00 0 .00 0 .00<br />
Un i t 0 .00 0 .00 120 .10 0 .00 0 .00<br />
Hydrologic unit 0314<br />
Bay 0 .00 0 .00 0 .00 228 .70 0 .00<br />
Escambi a 0 .00 0 .00 265 .40 0 .00 0 .00<br />
Gu 1 f 0 .00 0 .00 0 .00 0 .00 0 .00<br />
Okaloosa 0 .00 0 .00 0 .00 0 .00 0 .00<br />
Santa Rosa 0 .00 0 .00 0 .00 0 .00 0 .00<br />
Wal ton 0 .00 0 .00 0 .00 0 .00 0 .00<br />
Un i t 0 .00 0 .00 265 .40 228 .70 0 .00<br />
Florida 51 .70 47 .50 1,633 .00 11,391 .50 1 .44<br />
Continued<br />
300
Table EIR 35 . Concluded .<br />
Other water (Mqal/d<br />
Self-su lied<br />
roun ur ace Water consumed<br />
County fresh fresh Public supply Fres Sa ine<br />
Hydrologic unit 0312<br />
Fr an k l i n 0 .00 0 .00 0 .00 0 .00 0 .00<br />
Un i t 0 .46 0 .00 0 .70 0 .60 0 .00<br />
Hydrologic unit 0313<br />
Bay 0 .00 0 .00 0 .00 0 .00 0 .00<br />
Fr an k l i n 0 .00 0 .00 0 .00 0 .00 0 .00<br />
Gu 1 f 0 .00 0 .00 0 .00 0 .00 0 .00<br />
Un i t 0 .00 0 .32 0 .00 0 .80 0 .00<br />
Hydrologic unit 0314<br />
Bay 0 .68 0 .00 0 .00 0 .50 2 .10<br />
Escambi a 2 .52 0 .00 0 .00 7 .20 0 .00<br />
Gu 1 f 0 .00 0 .00 0 .00 0 .00 0 .00<br />
Okaloosa 0 .00 0 .00 0 .00 0 .00 0 .00<br />
Santa Rosa 0 .00 0 .00 0 .00 0 .00 0 .00<br />
Wal ton 0 .00 0 .00 0 .00 0 .00 0 .00<br />
Un i t 3 .20 0 .00 0 .00 8 .20 2 .10<br />
Florida 8 .45 2 .39 1 .64 36 .10 91 .10<br />
a Million gal per day .<br />
301
Table EIR 36 . Water used for public supplies in 1977 ( Leach and Healy 1980) .<br />
Water withdrawn ( Mgal/d) a<br />
County GWb SWc Total Per capita<br />
Bay 2 .91 36 .05 38 .96 493<br />
Escambia 30 .48 0 .00 30 .48 162<br />
Frankl in 1 .11 0 .00 1 .11 176<br />
Gulf 0 .16 0 .72 0 .88 160<br />
Okaloosa 12 .79 0 .00 12 .79 165<br />
Santa Rosa 4 .39 0 .00 4 .39 108<br />
Walton 0 .99 0 .00 0 .99 101<br />
Reg i on 52 .83 36 .77 89 .60 N .D .<br />
Florida 1,059 .06 172 .82 1,231 .88 171<br />
County<br />
Water delivered by uses (Mgal/d)<br />
TUic<br />
supply Agriculture Industry Commercial A/Cd Water consumed<br />
Bay 9 .30 0 .00 26 .76 2 .90 0 .00 13 .91<br />
Escambia 23 .81 0 .07 1 .25 5 .35 0 .00 15 .44<br />
Frankl in 0 .81 0 .00 0 .06 0 .24 0 .00 0 .22<br />
Gu 1 f 0 .54 0 .00 0 .31 0 .03 0 .00 0 .18<br />
Okaloosa 11 .44 0 .13 0 .00 1 .22 0 .00 4 .53<br />
Santa Rosa 3 .79 0 .11 0 .00 0 .49 0 .00 1 .27<br />
Walton 0 .78 0 .00 0 .02 0 .17 0 .01 0 .38<br />
Region 50 .47 A .31 28 .40 9 .67 0 .01 32 .67<br />
Florida 960 .82 23 .84 92 .88 124 .67 29 .67 508 .45<br />
b Million gal per day .<br />
Ground water .<br />
d Surf ace water .<br />
Air conditioning .<br />
302
Table EIR 37 . Rural water use in 1977 (Leach and Healy 1980) .<br />
Domestic use (Mgal/d)a<br />
Livestock use (Mgal/d)<br />
Withdrawn<br />
Withdrawn<br />
County GWc A Consumed Consumed<br />
Bay 0 .00 1 .76 1 .76 0 .44 0 .01 0 .02 0 .03 0 .03<br />
Escambi a 0 .00 4 .18 4 .18 0 .92 0 .04 0 .15 0 .19 0 .19<br />
Franklin 0 .00 0 .20 0 .20 0 .05 0 .01 0 .01 0 .02 0 .02<br />
Gu 1 f 0 .00 0 .56 0 .56 0 .14 0 .04 0 .02 0 .06 0 .06<br />
Okaloosa 0 .00 3 .15 3 .15 0 .79 0 .12 0 .03 0 .15 0 .15<br />
Santa Rosa 0 .00 1 .18 1 .18 0 .30 0 .08 0 .06 0 .14 0 .14<br />
Wal ton 0 .00 0 .95 0 .95 0 .24 0 .10 0 .07 0 .17 0 .17<br />
Reg i on 0 .00 11 .98 11 .98 2 .88 0 .40 0 .36 0 .76 0 .76<br />
F l or i d a 1 .01 191 .81 192 .82 50 .26 20 .07 44 .00 64 .07 64 .07<br />
All uses (Mgal/d)<br />
Withdrawn<br />
County SW A Consumed<br />
Bay 0 .01 1 .78 1 .79 0 .47<br />
Escambia 0 .04 4 .33 4 .37 1 .11<br />
Frankl in 0 .01 0 .21 0 .22 0 .07<br />
Gu 1 f 0 .04 0 .58 0 .62 0 .20<br />
Okaloosa 0 .12 3 .18 3 .30 0 .94<br />
Santa Rosa 0 .08 1 .24 1 .32 0 .44<br />
Wal ton 0 .10 1 .02 1 .12 0 .41<br />
Reg i on 0 .40 12 .34 12 .74 3 .64<br />
Florida 21 .08 235 .81 256 .89 114 .33<br />
b Million gal per day .<br />
Surface water .<br />
c Ground water .<br />
303
Table EIR 38 . Water used for irrigation in 1977 (Leach and Healy 1980) .<br />
Total water withdrawn (Mgal/day) a_<br />
Conveyance<br />
County SWb GWc All<br />
loss<br />
onsumptive<br />
use<br />
B ay 0 .00 0 .38 0 .38 0 .00 0 .08<br />
Escambia 0 .35 0 .62 0 .97 0 .00 0 .19<br />
Franklin 0 .00 0 .00 0 .00 0 .00 0 .00<br />
Gulf 0 .00 0 .22 0 .22 0 .00 0 .09<br />
Okaloosa 0 .45 0 .31 0 .76 0 .00 0 .15<br />
Santa Rosa 0 .13 1 .50 1 .63 0 .00 0 .33<br />
Wal ton 0 .93 3 .68 4 .62 0 .00 0 .92<br />
Region 1 .86 6 .71 8 .58 0 .00 1 .76<br />
Florida 1,449 .29 1,423 .25 2,872 .55 191 .74 1,255 .23<br />
b Million gal per day .<br />
Surf ace water .<br />
C Ground water .<br />
304
Table EIR 39 . Self-supplied water for industrial use for 1977 (Leach and<br />
Healy 1978) .<br />
Water withdrawn (Mgal/d)a<br />
Ground water Surface water All water Water<br />
County Fres a ine Fres a ine Fres a ine consumed<br />
Bay 1 .32 0 .00 0 .00 0 .00 1 .32 0 .00 0 .97<br />
Escambia 47 .36 1 .60 25 .60 0 .24 72 .96 1 .84 21 .96<br />
Frankl in 0 .01 0 .00 0 .00 0 .00 0 .01 0 .00 0 .01<br />
Gu l f 0 .52 0 .00 33 .20 13 .00 33 .72 13 .00 7 .11<br />
Okaloosa 5 .45 0 .00 0 .00 0 .00 5 .45 0 .00 1 .16<br />
Santa Rosa 18 .99 0 .00 0 .00 0 .00 18 .99 0 .00 15 .92<br />
Wal ton 0 .80 0 .00 0 .00 0 .00 0 .80 0 .00 0 .27<br />
Reg i on 74 .45 1 .60 58 .80 13 .24 133 .34 14 .84 47 .49<br />
F 1 or i d a 733 .06 58 .25 189 .23 15 .24 922 .28 73 .49 294 .65<br />
Fresh water use by major classification ( Mgal/d)<br />
imeroc Pulp - emicaT-Pos~p Te<br />
County mining and paper products mining<br />
Bay 0 .00 0 .12 0 .72 0 .00<br />
E sc amb i a 0 .00 24 .86 39 .66 0 .00<br />
Franklin 0 .00 0 .00 0 .00 0 .00<br />
Gu l f 0 .00 31 .70 15 .00 0 .00<br />
Okaloosa 0 .00 0 .00 0 .00 0 .00<br />
Santa Rosa 0 .00 0 .00 8 .36 0 .00<br />
Wal ton 0 .00 0 .00 0 .00 0 .00<br />
Reg i on 0 .00 56 .68 63 .74 0 .00<br />
Florida 49 .49 225 .41 175 .85 181 .22<br />
Continued<br />
305
Table EIR 39 . Concluded .<br />
Fresh water use by major classification ( Mgal/d) a<br />
County processing processing A/Cb Other<br />
Bay 0 .00 0 .21 0 .00 0 .27<br />
Escamb i a 0 .00 0 .00 0 .24 10 .04<br />
Frankl in 0 .00 0 .10 0 .00 0 .00<br />
Gu l f 0 .00 0 .00 0 .00 0 .20<br />
Okaloosa 0 .00 0 .00 0 .00 5 .45<br />
Santa Rosa 0 .00 0 .00 0 .64 9 .99<br />
Walton 0 .00 0 .80 0 .00 0 .00<br />
Reg i on 0 .00 1 .11 0 .88 25 .95<br />
Florida 59 .91 90 .60 55 .27 158 .01<br />
b Million gat per day .<br />
Air conditioning .<br />
306
Table EIR 40 . Water used for thermoelectric power in 1977 (Leach and Healy<br />
1980) .<br />
Cooling water (Mgal/d) a<br />
Self-su plied<br />
roun water ur ace water<br />
County res a ine Fres a ine Public supply<br />
Bay 0 .00 0 .00 0 .00 227 .80 0 .00<br />
E sc amb i a 0 .00 0 .00 249 .70 0 .00 0 .00<br />
Fr an k l i n 0 .00 0 .00 0 .00 0 .00 0 .00<br />
Gu 1 f 0 .00 0 .00 0 .00 0 .00 0 .00<br />
Okaloosa 0 .00 0 .00 0 .00 0 .00 0 .00<br />
Santa Rosa 0 .00 0 .00 0 .00 0 .00 0 .00<br />
Wal ton 0 .00 0 .00 0 .00 0 .00 0 .00<br />
Reg i on 0 .00 0 .00 249 .70 227 .80 0 .00<br />
Florida 46 .40 49 .30 1,309 .90 14,688 .90 1 .54<br />
Other water (Mgal/d)<br />
Self-suppl ied<br />
Ground -Su a e Water consumed<br />
County fresh fresh Public supply res a ine<br />
Bay 0 .70 0 .00 0 .00 0 .50 2 .10<br />
Escambia 2 .50 0 .00 0 .00 2 .10 0 .00<br />
Frankl in 0 .00 0 .00 0 .00 0 .00 0 .00<br />
G u l f 0 .00 0 .00 0 .00 0 .00 0 .00<br />
Okaloosa 0 .00 0 .00 0 .00 0 .00 0 .00<br />
Santa Rosa 0 .00 0 .00 0 .00 0 .00 0 .00<br />
Wal ton 0 .00 0 .00 0 .00 0 .00 0 .00<br />
Reg i on 3 .20 0 .00 0 .00 2 .70 2 .10<br />
Florida 8 .82 2 .15 1 .12 32 .00 137 .60<br />
a Million gal per day .<br />
307
Table EIR 41 . Water used for public supplies by hydrologic unit in 1977 (Leach<br />
and Healy 1980) .<br />
Water withdrawn ( Mgal/d) a<br />
County GWb SWc Total Per capita<br />
Hydrologic unit 0312<br />
Frankl in 0 .00 0 .00 0 .00 0 .00<br />
Un i t 18 .37 1 .48 19 .85 174 .00<br />
Hydrologic unit 0313<br />
B ay 0 .00 0 .00 0 .00 0 .00<br />
Frankl in 1 .11 0 .00 1 .11 176 .00<br />
Gul f 0 .05 0 .00 0 .05 71 .00<br />
Unit 3 .51 0 .00 3 .51 128 .00<br />
Hydrologic unit 0314<br />
Bay 2 .91 36 .05 38 .96 493 .00<br />
Escambi a 30 .48 0 .00 30 .48 162 .00<br />
Gulf 0 .11 0 .72 0 .83 173 .00<br />
Okaloosa 12 .79 0 .00 12 .79 165 .00<br />
Santa Rosa 4 .39 0 .00 4 .39 108 .00<br />
Walton 0 .99 0 .00 0 .99 101 .00<br />
Un i t 53 .49 36 .77 90 .26 218 .00<br />
F l or i d a 1,058 .99 170 .85 1,229 .84 172 .00<br />
Continued<br />
308
Table EIR 41 . Concluded .<br />
County<br />
Hydrologic unit 0312<br />
f~u ic<br />
supply<br />
Water delivered b uses (Mgal/d)<br />
Agriculture Industry Commercial A/Cd<br />
Water<br />
consumed<br />
Frankl in 0 .00 0 .00 0 .00 0 .00 0 .00 0 .00<br />
Un i t 16 .46 0 .01 0 .08 3 .31 0 .00 5 .96<br />
Hydrologic unit 0313<br />
B ay 0 .00 0 .00 0 .00 0 .00 0 .00 0 .00<br />
Frankl in 0 .81 0 .00 0 .06 0 .24 0 .00 0 .22<br />
Gu 1 f 0 .05 0 .00 0 .00 0 .00 0 .00 0 .01<br />
Unit 2 .78 0 .03 0 .07 0 .61 0 .01 0 .97<br />
Hydrologic unit 0314<br />
Bay 9 .30 0 .00 26 .76 2 .90 0 A0 13 .91<br />
Escambia 23 .81 0 .07 1 .25 5 .35 0 .00 15 .44<br />
Gu l f 0 .49 0 .00 0 .31 0 .03 0 .00 0 .17<br />
Okaloosa 11 .44 013 0 .00 1 .22 0 .00 4 .53<br />
Santa Rosa 3 .79 0 .11 0 .00 0 .49 0_00 1 .27<br />
Wal ton 0 .78 0 .00 0 .02 0 .17 0 .01 0 .38<br />
Un i t 51 .20 0 .35 28 .38 10 .31 0 .01 36 .20<br />
F 1 or i d a 959 .19 23 .84 92 .88 124 .26 29 .67 507 .49<br />
b Million gal per day .<br />
Ground water .<br />
d Surf ace water .<br />
Air conditioning .<br />
309
Table EIR 42 . Rural water used by hydrologic unit in 1977 ( Leach and Healy<br />
1980) .<br />
Domestic use (Mg al/d) a Livestock use (Mgal/d)<br />
Withdrawn Withdrawn<br />
County SWb GWc All Consumed SW GW All Consumed<br />
Hydrologic unit 0312<br />
Franklin 0 .00 0 .02 0 .02 0 .01 0 .00 0 .00 0 .00 0 .00<br />
Un i t 0 .10 6 .84 6 .94 1 .70 0 .23 0 .18 0 .41 0 .41<br />
Hydrologic unit 0313<br />
Bay 0 .00 0 .02 0 .02 0 .01 0 .00 0 .00 0 .00 0 .00<br />
Franklin 0 .00 0 .18 0 .18 0 .04 0 .01 0 .01 0 .02 0 .02<br />
Gu 1 f 0 .00 0 .35 0 .35 0 .09 0 .03 0 .01 0 .04 0 .04<br />
Un i t 0 .01 3 .86 3 .87 0 .97 0 .54 0 .24 0 .78 0 .78<br />
Hydrologic unit .0314<br />
Bay 0 .00 1 .74 1 .74 0 .43 0 .01 0 .02 0 .03 0 .03<br />
Escambia 0 .00 4 .18 4 .18 0 .92 0 .04 0 .15 0 .19 0 .19<br />
Gulf 0 .00 0 .21 0 .21 0 .05 0 .01 0 .01 0 .02 0 .02<br />
Okaloosa 0 .00 3 .15 3 .15 0 .79 0 .12 0 .03 0 .15 0 .15<br />
Santa Rosa 0 .00 1 .18 1 .18 0 .30 0 .08 0 .06 0 .14 0 .14<br />
Walton 0 .00 0 .95 0 .95 0 .24 0 .10 0 .07 0 .17 0 .17<br />
Un i t 0 .00 13 .90 13 .90 3 .36 0 .70 0 .72 1 .42 1 .42<br />
Florida 1 .01 191 .81 192 .82 50 .26 20 .07 44 .00 64 .07 64 .07<br />
Continued<br />
310
Table EIR 42 . Concluded .<br />
All uses (Mgal/d)<br />
Withdrawn<br />
County A Consumed<br />
Hydrologic unit 0312<br />
Franklin 0 .00 0 .02 0 .02 0 .01<br />
Un i t 0 .33 7 .02 7 .35 2 .11<br />
Hydrologic unit 0313<br />
B ay 0 .00 0 .02 0 .02 0 .01<br />
Franklin 0 .01 0 .19 0 .20 0 .06<br />
Gu l f 0 .03 0 .36 0 .39 0 .13<br />
Unit 0 55 4 .10 4 .65 1 .75<br />
Hydrologic unit 0314<br />
Bay 0 .01 1 .76 1 .77 0 .46<br />
Escambia 0 .04 4 .33 4 .37 1 .11<br />
Gulf 0 .01 0 .22 0 .23 0 .07<br />
Okaloosa 0 .12 3 .18 3 .30 0 .94<br />
Santa Rosa 0 .08 1 .24 1 .32 0 .44<br />
Wal ton 0 .10 1 .02 1 .12 0 .41<br />
Unit 0 .70 14 .62 15 .32 4 .78<br />
Florida 21 .08 235 .81 256 .89 114 .33<br />
b Million gal per day .<br />
Surf ace water .<br />
c Ground water .<br />
311
Table EIR 43 . Water used for irrigation by hydrologic unit in 1977 (Leach<br />
and Healy 1980) .<br />
Total water withdrawn (Mgal/d) a<br />
Conveyance Zconsump ivet<br />
County SWb GWc All loss use<br />
Hydrologic unit 0312<br />
Franklin<br />
Unit<br />
Hydrologic unit 0313<br />
Bay<br />
Franklin<br />
Gulf<br />
Unit<br />
Hydrologic unit 0314<br />
Bay 0 .00<br />
Esc&nbi a 0 .35<br />
Gu l f 0 .00<br />
Okaloosa 0 .45<br />
Santa Rosa 0 .13<br />
Wal ton 0 .93<br />
Uni t 2 .15<br />
Florida 1,449 .30<br />
b Million gal per day .<br />
Surface water .<br />
c Ground water .<br />
0 .00 0 .00 0 .00 0 .00 0 .00<br />
3 .80 0 .90 4 .70 0 .00 0 .95<br />
0 .00 0 .00 0 .00 0 .00 0 .00<br />
0 .00 0 .00 0 .00 0 .00 0 .00<br />
0 .00 0 .00 0 .00 0 .00 0 .00<br />
3 .25 4 .96 8 .20 0 .00 1 .60<br />
0 .38 0 .38 0 .00 0 .08<br />
0 .62 0 .97 0 .00 0 .19<br />
0 .22 0 .22 0 .00 0 .09<br />
0 .31 0 .76 0 .00 0 .15<br />
1 .50 1 .63 0 .00 0 .33<br />
3 .68 4 .62 0 .00 0 .92<br />
7 .36 9 .51 0 .01 1 .93<br />
1,423 .25 2,872 .55 191 .74 1,255 .23<br />
312
Table EIR 44 . Self-supplied water for industrial use by hydrologic unit in 1977<br />
(Leach and Healy 1980) .<br />
Water withdrawn (Mgal/d)a<br />
Ground water Surface water All water Water<br />
County Fresh SaT ne Fresh Sa ine res a ine consumed<br />
Hydrologic unit 0312<br />
Frankl in 0 .00 0 .00 0 .00 0 .00 0 .00 0 .00 0 .00<br />
Un i t 31 .82 0 .00 0 .10 0 .00 31 .92 0 .00 1 .74<br />
Hydrologic unit 0313<br />
B ay 0 .00 0 .00 0 .00 0 .00 0 .00 0 .00 0 .00<br />
Fr an k l i n 0 .01 0 .00 0 .00 0 .00 0 .01 0 .00 0 .01<br />
Gu 1 f 0 .00 0 .00 0 .00 0 .00 0 .00 0 .00 0 .00<br />
Un i t 1 .17 0 .00 1 .85 0 .00 3 .02 0 .00 1 .41<br />
Hydrologic unit 0314<br />
Bay 1 .32 0 .00 0 .00 0 .00 1 .32 0 .00 0 .97<br />
Esc amb i a 47 .36 1 .60 25 .60 0 .24 72 .96 1 .84 21 .96<br />
Gu 1 f 0 .52 0 .00 33 .20 13 .00 33 .72 13 .00 7 .11<br />
Okaloosa 5 .45 0 .00 0 .00 0 .00 5 .45 0 .00 1 .16<br />
Santa Rosa 18 .99 0 .00 0 .00 0 .00 18 .99 0 .00 15 .92<br />
Wal ton 0 .80 0 .00 0 .00 0 .00 0 .80 0 .00 0 .27<br />
Un i t 74 .46 1 .60 58 .80 13 .24 133 .26 14 .84 47 .39<br />
F l or i d a 733 .06 58 .25 189 .23 15 .24 922 .29 73 .49 294 .65<br />
Continued<br />
313
Table EIR 44 . Continued .<br />
Water use b ma'or classification M al/d)<br />
Limerock Pulp -~iemica osp ate<br />
County mining and paper products mining<br />
Hydrologic unit 0312<br />
Frankl in 0 .00 0 .00 0 .00 0 .00<br />
Un i t 0 .00 0 .00 0 .15 0 .00<br />
Hydrologic unit 0313<br />
B ay 0 .00 0 .00 0 .00 0 .00<br />
Frankl in 0 .00 0 .00 0 .00 0 .00<br />
Gu 1 f 0 .00 0 .00 0 .00 0 .00<br />
Un i t 0 .00 0 .00 0 .00 0 .00<br />
Hydrologic unit 0314<br />
Bay 0 .00 0 .12 0 .72 0 .00<br />
E s c amb i a 0 .00 24 .86 39 .66 0 .00<br />
Gu l f 0 .00 31 .70 15 .00 0 .00<br />
Okaloosa 0 .00 0 .00 0 .00 0 .00<br />
Santa Rosa 0 .00 0 .00 8 .36 0 .00<br />
Wal ton 0 .00 0 .00 0 .00 0 .00<br />
Un i t 0 .00 56 .68 63 .74 0 .00<br />
Florida 49 .49 225 .41 175 .85 181 .22<br />
Continued<br />
314
Table EIR 44 . Concluded .<br />
Water use b major classification (Mgal/d)<br />
C'i rus o0<br />
County processing processing A/C b<br />
Other<br />
Hydrologic unit 0312<br />
Frankl in 0 .00 0 .00 0 .00 0 .00<br />
Un i t 0 .00 0 .00 29 .44 2 .33<br />
Hydrologic unit 0313<br />
B ay 0 .00 0 .00 0 .00 0 .00<br />
Franklin 0 .00 0 .01 0 .00 0 .00<br />
G u l f 0 .00 0 .00 0 .00 0 .00<br />
Un i t 0 .00 0 .01 0 .00 3 .01<br />
Hydrologic unit 0314<br />
Bay 0 .00 0 .21 0 .00 0 .27<br />
Escambi a 0 .00 0 .00 0 .24 10 .04<br />
Gul f 0 .00 0 .00 0 .00 0 .02<br />
Okaloosa 0 .00 0 .00 0 .00 5 .45<br />
Santa Rosa 0 .00 0 .00 0 .64 9 .99<br />
Wal ton 0 .00 0 .80 0 .00 0 .00<br />
Un i t 0 .00 1 .01 0 .88 25 .79<br />
Florida 59 .91 90 .60 55 .27 158 .01<br />
b Million gal per day .<br />
Air conditioning .<br />
315
Table EIR 45 . Water used for thermoelectric power by hydrologic unit in 1977<br />
( Leach and Healy 1980) .<br />
Cooling water ( Mgal/d)a<br />
Self-su 1 ied<br />
roun wateri ur ace water<br />
County res a ine Fres a ine Public supply<br />
Hydrologic unit 0312<br />
Frankl in 0 .00 0 .00 0 .00 0 .00 0 .00<br />
Un i t 1 .90 0 .00 93 .30 0 .00 0 .00<br />
Hydrologic unit 0313<br />
B ay 0 .00 0 .00 0 .00 0 .00 0 .00<br />
Frankl in 0 .00 0 .00 0 .00 0 .00 0 .00<br />
Gulf 0 .00 0 .00 0 .00 0 .00 0 .00<br />
Un i t 0 .30 0 .00 109 .20 0 .00 0 .00<br />
Hydrologic unit 0314<br />
Bay 0 .00 0 .00 0 .00 227 .80 0 .00<br />
E sc amb i a 0 .00 0 .00 249 .70 0 .00 0 .00<br />
Gu 1 f 0 .00 0 .00 0 .00 0 .00 0 .00<br />
Okaloosa 0 .00 0 .00 0 .00 0 .00 0 .00<br />
Santa Rosa 0 .00 0 .00 0 .00 0 .00 0 .00<br />
Wal ton 0 .00 0 .00~ 0 .00 0 .00 0 .00<br />
Unit 0 .00 0 .00 249 .70 227 .80 0 .00<br />
Florida 46 .40 49 .30 1,309 .90 14,688 .90 1 .54<br />
Continued<br />
316
Table EIR 45 . Concluded .<br />
Other water (Mgal/d)<br />
Self-su lied<br />
roun ur ace Water consumed<br />
County fresh fresh Public supply res a ine<br />
Hydrologic unit 0312<br />
Franklin 0 .00 0 .00 0 .00 0 .00 0 .00<br />
Un i t 0 .42 0 .00 0 .00 1 .30 0 .00<br />
Hydrologic unit 0313<br />
B ay 0 .00 0 .00 0 .00 0 .00 0 .00<br />
Franklin 0 .00 0 .00 0 .00 0 .00 0 .00<br />
Gu 1 f 0 .00 0 .00 0 .00 0 .00 0 .00<br />
Un i t 0 .02 0 .00 0 .00 0 .60 0 .00<br />
Hydrologic unit 0314<br />
Bay 0 .70 0 .00 0 .00 0 .50 2 .10<br />
Escambia 2 .50 0 .00 0 .00 2 .10 0 .00<br />
Gu 1 f 0 .00 0 .00 0 .00 0 .00 0 .00<br />
Okaloosa 0 .00 0 .00 0 .00 0 .00 0 .00<br />
Santa Rosa 0 .00 0 .00 0 .00 0 .00 0 .00<br />
Walton 0 .00 0 .00 0 .00 0 .00 0 .00<br />
Unit 3 .20 0 .00 0 .00 2 .60 2 .10<br />
Florida 8 .82 2 .15 1 .12 32 .00 137 .60<br />
a Million gal per day .<br />
317
Table EIR 46 . Endangered and threatened species in Bay County (Miller 1980) .<br />
Common Name Scientific Name<br />
Threatened Mammals<br />
Florida black bear Ursus americanus floridanus<br />
Endan4ered Birds<br />
Red-cockaded woodpecker Picoides borealis<br />
Threatened Reptiles<br />
Gopher tortoise Gopherus polyphemus<br />
Threatened Amphibians<br />
Florida gopher f rog Rana areolata aesopus<br />
Smooth-barked St . John's-wort<br />
White birds-in-a-nest<br />
Giant water-dropwort<br />
Large-leaved jointweed<br />
Wiregrass gentian<br />
Mock pennyroyal<br />
Ashe's magnolia<br />
Orange azalea<br />
White-top pitcherplant<br />
Jackson-vine<br />
Endangered Plants<br />
Threatened Plants<br />
318<br />
Hypericum lissophloeus<br />
Macbridea alba<br />
Oxypolis greenmanii<br />
Polygonella macrophylla<br />
Gentiana pennelliana<br />
Hedeoma graveolens<br />
Magnolia ashei<br />
Rhododendron austrinum<br />
Sarracenia leucophylla<br />
Smilax smallii
Table EIR 47 . Endangered and threatened species in Escambia County (Miller<br />
1980) .<br />
('nmmnn Namn Scientific Name<br />
Threatened Mammals<br />
Florida black bear Ursus americanus floridanus<br />
Threatened Reptiles<br />
Gopher tortoise Gopherus polyphemus<br />
Panhandle lily<br />
Large-leaved jointweed<br />
Orange azalea<br />
White-top pitcherplant<br />
Jackson-vine<br />
Silky camellia<br />
Endangered Plants<br />
Threatened Plants<br />
Lilium iridollae<br />
Polygonella macrophylla<br />
Rhododendron austrinum<br />
Sarracenia leucophylla<br />
Smilax smallii<br />
Stewartia malacodendron<br />
319
Table EIR 48 . Listing of endangered and threatened species in Franklin County<br />
(Miller 1980) .<br />
Common Name Scientific Name<br />
Threatened Mammals<br />
Florida black bear Ursus americanus floridanus<br />
Endangered Birds<br />
Red-cockaded woodpecker Picoides borealis<br />
Threatened Reptiles<br />
Gopher tortoise Gopherus polyphemus<br />
Threatened Amphibians<br />
Florida gopher frog Rana areolata aesopus<br />
Harper's beauty<br />
White birds-in-a-nest<br />
Florida beargrass<br />
Grass-of-parnassus<br />
Large-leaved jointweed<br />
Apalachicola rosemary<br />
Wiregrass gentian<br />
Godf rey's blazing-star<br />
White-top pitcherplant<br />
Jackson-vine<br />
Endangered Plants<br />
Threatened Plants<br />
320<br />
Harperocallis flava<br />
Macbridea alba<br />
Nolina atopocarpa<br />
Parnassia grandiflora<br />
Polygonella macrophylla<br />
Conradina 1g abra<br />
Gentiana pennelliana<br />
Liatris Qrovincialis<br />
Sarracenia leucophylla<br />
Smilax smallii
Table EIR 49 . Listing of endangered and threatened species in Gulf County<br />
(Miller 1980) .<br />
Common Name Scientific Name<br />
Threatened Mammals<br />
Florida black bear Ursus americanus floridanus<br />
Florida sandhill crane<br />
Least tern<br />
Threatened Birds<br />
Threatened Reptiles<br />
Grus canadensis pratensis<br />
Sterna albifrons<br />
Gopher tortoise Gopherus polyphemus<br />
White birds-in-a-nest<br />
Giant water-dropwort<br />
Chapman's rhododendron<br />
Wiregrass gentian<br />
Godfrey's blazing-star<br />
Orange azalea<br />
White-top pitcherplant<br />
Jackson-vine<br />
Chapman's crownbeard<br />
Endangered Plants<br />
Threatened Plants<br />
Macbridea alba<br />
Oxypolis greenmanii<br />
Rhododendron chapmanii<br />
Gentiana pennelliana<br />
Liatris provincialis<br />
Rhododendron austrinum<br />
Sarracenia leucophylla<br />
Smilax smallii<br />
Verbesina chapmanii<br />
321
Table EIR 50 . Listing of endangered and threatened species in Okaloosa County<br />
(Miller 1980) .<br />
Common Name Scientific Name<br />
Florida black bear<br />
Threatened Mammals<br />
Endangered Bi rds<br />
Ursus americanus floridanus<br />
Red-cockaded woodpecker Picoides borealis<br />
Threatened Reptiles<br />
Gopher tortoise Gopherus polyphemus<br />
Endangered Amphibians<br />
Pine barrens treefrog Hyla andersonii<br />
Endangered Plants<br />
Panhandle lily Lilium iridollae<br />
Hairy wild-indigo<br />
Ashe's magnolia<br />
Orange azalea<br />
White-top pitcherplant<br />
Jackson-vine<br />
Silky camellia<br />
Threatened Plants<br />
Baptisia hirsuta<br />
Magnolia ashei<br />
Rhododendron austrinum<br />
Sarracenia leucoa<br />
Smilax smallii<br />
Stewartia malacodendron<br />
322
Table EIR 51 . Listing of endangered and threatened species in Santa Rosa County<br />
(Miller 1980) .<br />
Common Name<br />
Threatened Mammals<br />
Scientific Name<br />
Florida black bear Ursus americanus floridanus<br />
Red-cockaded woodpecker<br />
Endangered Birds<br />
Threatened Birds<br />
Picoides borealis<br />
Least tern Sterna albifrons<br />
Threatened Reptiles<br />
Gopher tortoise Gopherus polyphemus<br />
Endangered Plants<br />
'Panhandle lily Lilium iridollae<br />
Hairy wild-indigo<br />
Ashe's magnolia<br />
Orange azalea<br />
White-top pitcherplant<br />
Jackson-vine<br />
Silky camellia<br />
Threatened Plants<br />
Baptisia hirsuta<br />
Magnolia ashei<br />
Rhododendron austrinum<br />
Sarracenia leucophylla<br />
Smilax smallii<br />
Stewartia malacodendron<br />
323
ALABAMA GEORGIA ~<br />
.<br />
~ Sant:<br />
m E?os .~<br />
e<br />
=<br />
•;!trqn<br />
Jacks ;n N<br />
'~ '.iirlii/iil qty .<br />
•<br />
A Big Cypress<br />
8 Green Swamp<br />
C Florida Keye<br />
Bay<br />
% Designated Areas of Critical State Concern<br />
. .<br />
(_i .<br />
:iU11<br />
' .~nrt<br />
11Uku' ;2<br />
. . . ~n<br />
'<br />
• '<br />
.{_d; -<br />
83kcr<br />
i~ •<br />
:n'<br />
`" La- "fe , r<br />
•<br />
I<br />
;~ +<br />
yS<br />
_Btiy<br />
PiiS : ii<br />
E) :~r^ug!`<br />
i_ake<br />
?o'~<br />
: .t .A'.^.'.'.<br />
p .<br />
i<br />
YQ!Utiia<br />
Serr . -<br />
' .<br />
\`\<br />
ftrvol .<br />
.µ~Rcip _<br />
\ h :d. . d c :f;r .. .<br />
~ ~ . _ . L!~! S^Ec,<br />
l.??~!l'.iii?<br />
u'sGcs<br />
F ; .3r!7!'v<br />
1~ ce P~ :m 3earn<br />
\ A<br />
_ C<br />
• Ci[3U-; Q<br />
Figure 25 . Areas of Critlcal State Concern ( Florlda Power and L i ght Co ._1979 )_ .<br />
324<br />
?50
Table EIR 52 . Listing of endangered and threatened species in Walton County<br />
(Miller 1980) .<br />
('nmmnn Nmmc Scientific Name<br />
Panhandle lily<br />
Large-leaved jointweed<br />
Hairy wild-indigo<br />
Wiregrass gentian<br />
Ashe's magnolia<br />
Needle palm<br />
Orange azalea<br />
White-top pitcherplant<br />
Jackson-vine<br />
Silky camellia<br />
Chapman's crownbeard<br />
Endangered Plants<br />
Threatened Plants<br />
Lilium iridollae<br />
Polygonella macrophylla<br />
Baptisia hirsuta<br />
Gentiana pennelliana<br />
Magnolia ashei<br />
Rhapidophyllum h sy trix<br />
Rhododendron austrinum<br />
Sarracenia leucophylla<br />
Smilax smallii<br />
Stewartia malacodendron<br />
Verbesina chapmanii<br />
325
w<br />
N<br />
Table EIR 53 . Identification of beach and river erosion problems (Florida Resources and Environmental<br />
Analysis Center 1978) .<br />
Site Location Description<br />
Beacon Hill<br />
Carrabelle Beach<br />
Choctawhatchee Bay<br />
Crooked Island<br />
Dog Island<br />
East Point<br />
Fort Pickens National Park<br />
Gulf Breeze Peninsula<br />
Inerarity Point<br />
Lighthouse Point<br />
Panama City Beach<br />
Shell Island<br />
Shell Point<br />
St . George Island<br />
St . Joseph Spit<br />
St . Theresa Beach<br />
Gulf County<br />
Franklin County<br />
Walton County<br />
Bay County<br />
Center of Island, Franklin County<br />
Franklin County<br />
Western Santa Rosa Island,<br />
Escambia County<br />
Santa Rosa County<br />
Escambia County<br />
Southern tip of SR-370,<br />
Franklin County<br />
Panama City, Bay County<br />
Bay County<br />
Wakulla County<br />
Franklin County<br />
Gulf County<br />
Franklin County<br />
Continued<br />
2 .5 mi serious erosion<br />
16 .0 mi serious erosion<br />
Estuarine beach erosion<br />
6 .0 mi severe beach erosion<br />
2 .2 mi severe erosion<br />
6 .0 mi of erosion<br />
3 .0 mi severe erosion<br />
Beach erosion between Fair Point<br />
and the mouth of Little East Bay<br />
Beach erosion along S .<br />
shore of peninsula<br />
Severe beach erosion<br />
18 .3 mi serious erosion<br />
6 .0 mi of severe erosion<br />
0 .5 mi erosion<br />
6 .1 mi severe erosion,<br />
center of island<br />
Serious erosion N . of<br />
Cape San Blas<br />
1 .0 mi severe erosion
w<br />
N 4<br />
Table EIR 53 . Concluded .<br />
Site Locat i on Description<br />
Carpenters Creek<br />
Ochlockonee River<br />
Pensacola, Escambia County<br />
Ochlockonee State Park,<br />
Franklin and Wakulla Counties<br />
Erosion of stream bank<br />
Boat wakes, wind and tides<br />
causing severe erosion
W<br />
N<br />
00<br />
Table EIR 54 . Destruction of natural vegetation and habitat (Florida Resources and Environmental Analysis<br />
Center 1978) .<br />
Site Location Description<br />
Avalon Beach, Coastal Marsh<br />
Burnt Mill Creek<br />
Carpenters Creek<br />
Crooked Creek<br />
East River Island<br />
I-10<br />
Inerarity Island<br />
Indian Swamp<br />
Panther Swamp<br />
Santa Rosa Island<br />
Tates Hell Swamp<br />
Unnamed<br />
Garcon Point,<br />
Santa Rosa County<br />
Bay County<br />
Pensacola,<br />
Escambia County<br />
Bay County<br />
Walton County<br />
Okaloosa-Walton,<br />
County line<br />
Escambia County<br />
Gulf County<br />
Gulf County<br />
Navarre to Fort Pickens,<br />
Santa Rosa County<br />
Franklin and S .<br />
Liberty Counties<br />
Walton County<br />
Marsh ecosystem undergoing development<br />
Systematic clearcutting of natural vegetatopm<br />
Filling of swamp, loss of cypress<br />
and silverbell trees<br />
Systematic clearcutting of natural vegetation<br />
Clearcutting of natural vegetation,<br />
replacement by pine<br />
Clearcutting of natural vegetation,<br />
severe erosion<br />
Development, dune destruction, loss of habitat<br />
Upper reaches of swamp being ditched, drained,<br />
and clearcut, reduction of tupelo trees,<br />
having adverse impacts upon bee/honey<br />
industry<br />
Drainage and clearing of wetlands,<br />
loss of habitat<br />
Development, dune destruction, loss of habitat<br />
300-mi2 swamp undergoing extensive<br />
drainage, channelization and conversion<br />
to pines and/or pastureland<br />
Clearcutting of swamp forest and hardwoodpine<br />
mix, replaced with slash pine
w<br />
N<br />
~<br />
Table EIR 55 . Aquatic plant problems and/or eutrophication (Florida Resources and Environmental Analysis<br />
Center 1978) .<br />
Site Location Description<br />
Deer Point Lake, Near Panama City, High nitrate concentrations, low D .O .a<br />
coastal marsh Bay County due to aquatic plants and algae growth<br />
Karick Lake 9 mi N . of Baker on 58-acre lake with aquatic weed<br />
SR-189, Okaloosa County problems<br />
Lake Locklin Santa Rosa County Over nutrification<br />
a Dissolved oxygen .
w<br />
0<br />
Table EIR 56 Summary of U .S . Army Corps of Engineers projects in Northwest Florida (Northwest Florida Water<br />
Management District 1980 ; U .S . Army Corps of Engineers 1981) .<br />
Location Description Date completed Cost/remarks<br />
Grand Lagoon, Channels from Grand Lagoon to 1972 $128,000<br />
Panama City St . Andrews Bay<br />
Gulf Intracoastal Water- 12-ft x 125-ft channel from Carrabelle, 1969 $6,434,694<br />
way, Carrableel to FL . to Mobile Bay, AL .<br />
Mobile Bay<br />
Gulf Intracoastal Water- 12-ft x 125-ft channel from Carrabelle N .D . No construction<br />
way, Carrabelle to via Carrabelle, Crooked and Ochlock- has been under-<br />
St . Marks onee Rivers, and Ochlockonee and taken, deferred<br />
Apalachee bays<br />
for restudy<br />
LaGrange Bayou 12-ft x 100-ft channel 6 mi long 1963 $289,496<br />
connecting Choctawhatchee Bay and<br />
highway bridge across Four Mile<br />
Creek (Freeport)<br />
Panacea Harbor 8-ft x 100-ft channel 3 .7 mi long 1963 $129,383<br />
connecting City of Panacea to<br />
Apalachee Bay<br />
Panama City Harbor Several channels with turning basins, 1949 $485,189<br />
anchorage basin, cut through Shell (overall project)<br />
Island and Jetties 1961 (jetties<br />
rebuilt)<br />
Pensacola Harbor Several channels connecting Intra- 1965 $875,005<br />
coastal Waterway, Gulf of Mexico,<br />
Lower Pensacola Bay, Muscogee<br />
Wharf and Bayou Chico<br />
Continued
w<br />
~<br />
Table EIR 56 . Continued .<br />
Location Description Date completed Cost/remarks<br />
Port St . Joe Harbor Several channels with turning basin<br />
connecting City of Port St . Joe and<br />
Gulf of Mexico<br />
St . Marks River Several channels with turning basin<br />
connecting Newport, St . Marks and<br />
the Gulf of Mexico, total length 12<br />
mi<br />
Apalachicola Bay Channels connecting Intracoastal<br />
Waterway, Apalachicola and Gulf of<br />
Mexico via cut through St . George<br />
Island . Also, breakwaters near<br />
mouth of Apalachicola River<br />
Jim Woodruff Lock and Dam Lock and dam and reservoir with<br />
power generating facility<br />
Blackwater River 9-ft x 100-ft channel 12 mi long<br />
connecting City of Milton and East Bay<br />
Carrabelle Bay and Harbor Several different sizes of channels<br />
totaling 13 .6 mi connecting Crooked<br />
River, City of Carrabelle and Gulf of<br />
Mex i co<br />
Choctawhatchee River Maintenance of navigable channel from<br />
Geneva, AL to mouth of Chactawhatchee<br />
River, 96 mi<br />
Continued<br />
1962 $1,980,862<br />
1964 $1,710,809<br />
1959 $964,400<br />
(overall project)<br />
1975<br />
(breakwaters)<br />
1957 $49,306,758<br />
1916 $36,650<br />
1965 $481,627<br />
Authorized $171,885<br />
June 1874<br />
Completed
w<br />
N<br />
Table EIR 56 . Concluded .<br />
Location Description Date completed Cost/remarks<br />
East Pass Channel 12-ft x 180-ft channel from<br />
Okaloosa County Choctawhatchee Bay to the<br />
Gulf of Mexico with jetties<br />
Escambia and Conecuh Channels from Andulusia, AL<br />
Rivers to mouth of Escambia River<br />
Holmes Creek Navigable channel 25 mi long<br />
from the mouth to Vernon, FL<br />
Upper Chipola River Navigable channel 55 mi long<br />
from the foot of Dead Lake .<br />
to Marianna, FL<br />
Apalachicola River A continuous 9-ft x 100-ft channel<br />
from the intersection of the<br />
Gulf Intracoastal Waterway<br />
to the confluence of the<br />
Chattahoochee and Flint Rivers,<br />
104 mi<br />
1951 (channel)<br />
1969 (jetties)<br />
1882 (from state<br />
line to mile 7)<br />
1960 (below mile 7)<br />
no date<br />
(inactive)<br />
75% complete<br />
N .D .<br />
$916, 715<br />
$137,324<br />
$8,562<br />
$36,781<br />
N .D .
w<br />
Table EIR 57 . Status of developments of Regional Impact ( .DRI) for 1973, 1974, 1975, 1976, 1977, 1978, 1979,<br />
and 1980a (Florida Department of Comnunity Affairs 1980b) .<br />
County Name Type of development Determination<br />
1973<br />
1974<br />
Okaloosa Gulf-Tex Properties, Inc .<br />
Shopping center for Destin, FL<br />
Bay Guy Rogers Marine<br />
Gulf Coast Community Hospital<br />
Escambia Pensacola Greyhound Racing<br />
Diamondhead Perdido Key<br />
Okaloosa Laguna Beach to Destin<br />
transmission line<br />
Walton Juniper Lake Estates<br />
1975<br />
Residential<br />
Shopping center<br />
Port facility<br />
Hospital<br />
Attractions<br />
Residential<br />
Transmission line<br />
Residential<br />
Escambia Regional Office Center Office<br />
Innerarity Island Residential<br />
Pensacola-Escambia Governmental Center Office<br />
Belevedere Park, Unit 7 Residential<br />
Pensacola Jr College West Campus School<br />
Santa Rosa Navarre Pass Canal<br />
Continued<br />
DRI 8-2-73<br />
DRI 10-11-73<br />
Not a DRI<br />
DR I<br />
Not a DRI<br />
Not a DR I<br />
DRI<br />
DRI<br />
Not a DRI<br />
Not a DRI<br />
Not a DRI<br />
Not a DRI<br />
DRI<br />
Not a DRI
w<br />
a<br />
Table EIR 57 . Concluded .<br />
County Name Type of development Determination<br />
1976<br />
Escambia<br />
Gulf<br />
Walton<br />
1977<br />
Escambia<br />
Okaloosa<br />
1978<br />
Bay<br />
1979<br />
Bay<br />
1980<br />
Pensacola Regional Airport<br />
Unnamed residential<br />
Lake Juniper Estates<br />
Industrial Park<br />
Belcher Oil Co .<br />
Century III Civic Convention Center<br />
Pretty Bayou Tract<br />
Hi Octane Terminal<br />
Bay University of West Florida,<br />
Panama City Branch Campus<br />
Escambia Pitts Slip Marina<br />
Ellyson Progress Park and Job<br />
Opportunity Center<br />
a As of 10 October 1980 .<br />
Bayou Chico Marina<br />
Airport<br />
Residential<br />
Residential<br />
Airport, industry<br />
Petroleum storage<br />
Attractions<br />
Residential<br />
Petroleum storage<br />
It<br />
DRI<br />
DRI<br />
No determination<br />
DRI<br />
DRI<br />
Not a DRI<br />
Not a DRI<br />
School Not a DRI<br />
Port facility Not a DRI<br />
Attractions, industry and DRI<br />
office<br />
Port facility DRI<br />
Not a DRI
w<br />
cr+<br />
Table EIR 58 . Developments of Regional Impact (DRI), type, size, and status for fiscal years 1973-74,<br />
1974-75, 1975-76, 1976-77, 1977-78 and 1978-79 as of 10 October 1980 (Florida Department of Community Affairs<br />
1980b) .<br />
County Name Type Size Status<br />
FY 1973-74<br />
Gulf Cape San Blas Residential 10,000 d .u .a 90-day notice expired<br />
Marina<br />
Port<br />
N .D. 2 90-day notice expired<br />
O k a l oosa unname d<br />
S hopp i ng<br />
400,000<br />
ft 2<br />
90- d ay not i ce exp i re d<br />
Santa Rosa Mall Shopping 494,409 ft Approved with conditions<br />
Walton Oakwood Estates Unit 5 Residential 302 d .u . To be submitted<br />
Oakwood Estates Unit 7 Residential 7,290 d .u . Pending<br />
Sandestin Residential 8,000 d .u . Approved with conditions<br />
FY 1974-75<br />
Bay Venture Bay Resort Residential 1,000 D .U .2 Withdrawn<br />
Panama City Mall Shopping 690,000 ft Approved with conditions<br />
Franklin Villages of St . George Residential 3,000 d .u . Withdrawn<br />
Gulf Christie's Beach Residential 316 d .u . 90-day notice expired<br />
St . Joseph Bay Estates Residential 2,000 d .u . To be submitted<br />
Walton Grayton Dunes Residential 3,343 d .u . Approved<br />
FY 1975-76<br />
Escambia Pensacola Junior College<br />
West Campus School Approved<br />
Okaloosa Raintree Inter City Bank Residential 806 d .u . Approved with conditions<br />
Continued
Table EIR 58 . Concluded .<br />
County Name Type Size Status<br />
FY 1976-77<br />
Franklin St . Georges Plantation<br />
Okaloosa Blue Water<br />
FY 1978-79<br />
Bay Whitaker Oil Terminal<br />
expansion<br />
Escambia Relocate tankage port<br />
Pensacola Terminal<br />
~ b Dwelling units .<br />
Thousand barrels .<br />
Residential 831 d .u . Approved with conditions<br />
Residential 5,579 d .u . Approved with conditions<br />
Oil 490 tbblb Approved with conditions<br />
Oil 155 tbbl Approved with conditions
Table EIR 59 . Location of permanent network stationsa in northwest Florida<br />
(Florida Department of Environmental Regulation, Bureau of Water Management<br />
1979c) .<br />
Streams<br />
Northwest area ta ion Northcentra area Station<br />
Number Number<br />
Apalachicola River 31010022 Dunns Creek 20030212<br />
Aucilla River . 22040002 Oklawaha River mid 20020001<br />
Balckwater River 33030001 Oklawaha River 20020012<br />
Chipola River 31020012 Oklawaha River low 20020071<br />
Choctawhatchee River up 32020001 Ortega River 20020079<br />
Choctawhatchee River mid 32020007 Santa Fe River 21030004<br />
Escambia River up 33020001 St . Johns River mid 20030213<br />
Escambia River low 33020009 St . Johns River low 20010002<br />
Ochlocknee River 22020006 St . Marys River up 19010002<br />
Perdido River 33010003 St . Marys River low 19010001<br />
Yellow River 33040004 Suwanee River up 21020006<br />
Suwanee River mid 21020035<br />
Suwanee River low 21020031<br />
Tomoka River 27010023<br />
Withlacoochee River up 23010455<br />
Withlacoochee River mid 23010038<br />
Withlacoochee River low 23010030<br />
Estuaries<br />
Northwest area Station Northcentra area tation<br />
Number Number<br />
Apalachicola Bay 31010C33 Amelia River up 19020005<br />
Choctawhatchee Bay 32010114 Amerlia River 19020013<br />
East Bay 33030C30 Halif ax River 27010037<br />
Escambia Bay 33020C11 Matanzas River 27010097<br />
Perdido Bay 330100C6 St . Johns River 20030002<br />
St . Andrew Bay 32020J14<br />
St . Joseph Bay 32030W41<br />
Lakes<br />
Northwest Station Northcentra Station<br />
Number Number<br />
Lake Seminole 31010007 Lake George 20030373<br />
a Established in 1973 for the purpose of monitoring water quality in<br />
Florida's lakes, streams, and estuaries .<br />
337
Table EIR 60 . Sewage treatment capacity needs and costs through the year 2000 (Department of Environmental<br />
Regulation, Office of Economic Analysis 1981d) .<br />
County<br />
Populationa<br />
growth rate<br />
(percent)<br />
Growth in<br />
design capital<br />
( Mgal/d)<br />
Number of<br />
facilitiesb<br />
expected<br />
Singleb plants<br />
capital costs<br />
($ millions)<br />
Estimated totalc<br />
capital costs<br />
($ millions)<br />
Bay 2 .50 3 .99 28 6 .21 17 .14<br />
Escambi a 2 .10 9 .41 20 11 .29 27 .89<br />
Frankl in 2 .50 0 .55 6 1 .57 2 .66<br />
Gulf 2 .50 0 .13 1 0 .57 0 .49<br />
Okaloosa 2 .10 5 .55 11 7 .82 16 .13<br />
Santa Rosa 2 .10 1 .49 8 3 .13 5 .83<br />
Wal ton 2 .50 0 .61 5 1 .68 2 .76<br />
Reg i on N .D . 21 .73 79 32 .27 72 .90<br />
w<br />
co Florida N .D . 1,366 .82 4,243 936 .04 4,007 .72<br />
b University of Florida Bureau of Economic and Business Research, Population Divisions forecast .<br />
Assumes histo rical mean for each county .<br />
c Assumes that total capacity as one plant using EPA construction costs curve (cost = 1 .77 (design) .696)<br />
in 1981 dollars .
ALABAMA GEORGIA ~<br />
h : . .^.1:,<br />
{{{<br />
Santa N<br />
a ;rs<br />
acs~ ~ j J ~cr<br />
t V2' : vYr);~i'1 :"/ .<br />
Gao^.den Na>saum<br />
,<br />
:9av ~<br />
;<br />
'~'j . ~<br />
t3aker . . .<br />
Fea^xi :n -'a'i -<br />
t3u . _<br />
. ~<br />
e : .< .<br />
L:,<br />
t<br />
. . .<br />
PWSGn<br />
!~1r,naEG°<br />
h4c, , . .<br />
-<br />
cPf<br />
Ordn ,t, 0<br />
C ea+a<br />
Di
Table EIR 61 . National and Florida ambient air quality standardsa<br />
(Florida Department of Environmental Regulation, Bureau of Air Quality<br />
Management 1980e) .<br />
Primary Secondaryb F orida<br />
Pollutant Time frame standards standards standards<br />
Particulate annual c 75 ug/m3c 60 ug/m3 60 ug/m3<br />
matter (geometric mean ) 260 ug/m 150 ug/m 150 ug/m<br />
24-hour<br />
Sulfur oxides annual<br />
(arithmetic meand)<br />
24-hour<br />
3-hourb<br />
Carbon monoxide 8-hourb<br />
Ni trogen f<br />
dixoide<br />
Photochemical<br />
oxidantsg<br />
1-hourb<br />
annual<br />
(arithmetic mean)<br />
1-hourb<br />
80 ug/m3 e<br />
(0 .03 ppm)3<br />
365 ug/m<br />
(0 .14 ppm)<br />
10 ug/m3<br />
(9 PPm)3<br />
100 ug/m<br />
(35 ppm)<br />
100 ug/m3<br />
(0 .05 ppm)<br />
235 ug/m3<br />
150 ug/m3<br />
( .02 ppm)3<br />
260 ug/m<br />
(0 .1 ppm)3<br />
1300 ug/m<br />
(same as<br />
primary)<br />
(same as<br />
primary<br />
(same as<br />
primary)<br />
(same as<br />
primary<br />
150 ug/m3<br />
(0 .02 ppm)<br />
260 ug/m3<br />
(0 .1 ppm)3<br />
1300 ug/m<br />
(0 .5 ppm)<br />
(same as<br />
primary)<br />
(same as<br />
primary)<br />
(same as<br />
primary)<br />
160 ug/m3<br />
(0 .08 ppm)<br />
Hydrocarbonsh 3-hour 160 ug/m3 (same as ( same as<br />
--b onmethane) (6 to 9 a .m .) (0 .24 ppm) primarv) primarv)<br />
aThe air quality standards and a description of the Federal Reference Methods<br />
(FRM) were published on April 30, 1971, in 42 CFR 410, recodified to 40 CFR<br />
50 on November 25, 1972. The new FRM for nitrogen dioxide was published on<br />
December 1, 1976, as 40 CFR 50 .<br />
bNot to be exceeded more than once a year .<br />
cGeometric mean is a measure of central tendency . It is the nth root of the<br />
product of n individual data values recorded during the given period .<br />
dArithmetic mean is the most common measure of the central tendency . It is<br />
the sum of the data collected during the given period divided by the number<br />
eof observations in the same period .<br />
eParts per million .<br />
fChemiluminescence has been established as the FRM and the sodium arsenite and<br />
trienthanolamine guiacol sulfite (TGS) methods have been identified as equivalent<br />
methods .<br />
gThe FRM measures 03 (ozone) .<br />
hThe hydrocarbon HC standard is a guide to devising State implementation plans<br />
to achieve the oxidant standard . The HC standard does not have to he met if<br />
the oxidant standard is met .<br />
340
W<br />
.A<br />
1--+<br />
.<br />
t2wweeantquousz.ne(Mderaq<br />
31 ~I W ~~1 I<br />
~t
~------- rrA EIS cEV A-95 OMB<br />
400<br />
DOD DOC HUD DOT DOA DOI<br />
1 1 I<br />
1 1 I I ~<br />
I 1 I I O 1 CO IPG<br />
303<br />
I 1 1 ~<br />
1 I `~' ) 701 ~ FAA FHWA UMTA FRA CG<br />
1 1 Y 1<br />
I \<br />
/ , © o 0 0 0 0 0<br />
O© O O CO©CO<br />
CABINET OG<br />
Q ~ ~ I EIS A-95 AP<br />
N<br />
. \<br />
/ DER GFWFC ~ DCA DOA (<br />
DOT \<br />
(<br />
1 \<br />
/ pEPg pEPt \ pNR pRN \ pLE pPR BTIITF '/ pSP pB p~ pTPP pq0 pMTO<br />
~'r-------<br />
\<br />
~ EIS '---- --------~ j .I I ~ ~~<br />
~ -----' WMD RPC ~ --- A-95 ~ ---<br />
i \ -= = = _-~ ------------------------------ ~<br />
1 A-95- DRI / 1<br />
`-------------- LG ' ' C<br />
PD ' I ADMINISTRATIVE LINK<br />
Figure 26. Interrelationships of agencies in the environmental review process in transportation planning<br />
(South Florida Regional Planning Council 1977) Continued .<br />
.
W<br />
~<br />
W<br />
Precipitation L Evapotranspiration<br />
Disposal<br />
~ or y Landfill, dump , \<br />
I well injection or ~ptic refuse Pumping ile<br />
Land spreading tank p<br />
Pumping well<br />
well<br />
or irrigation<br />
or cesspool Sewer<br />
Lagoon, pit or basin<br />
---_ ~--• El e Water table _ T<br />
~ --' ~ - _ -<br />
V (\/) Potentiometric Stream<br />
Surface ~<br />
Percolation Percolation Leakage<br />
- __<br />
Discharge Leakage<br />
T<br />
(''<br />
IrJ'(_<br />
r \ Aquifer(fresh) ~~<br />
W ate r table _<br />
Confining zone<br />
Leakage ~<br />
JJ<br />
Artesian aquifer (fresh)<br />
_-Co-_ nfining zone - - -<br />
I Artesian aauifer (saline) ~~<br />
Discha'r~ge"~olr i/njection<br />
G'~ Unintentional input<br />
~~ . Direction of groundwater movement<br />
Figure 29 . Contamination of the groundwater system by waste disposal practices (Environmental Protection<br />
Agency 147~)<br />
*-J\,r\
W<br />
A<br />
A<br />
O FEDERAL ENVIRONMENTAL LAWS<br />
NEPA National Environmental Policy Act of 1969<br />
EQIA Environmental Quality Improvement Act of 1970<br />
FWPA The Federal Water Pollution Act Amendments of 1972<br />
CAA The Clean Air Act<br />
NCA Noise Control Act of 1972<br />
CZMA Coastal Zone Management Act of 1972<br />
MPRSA The Marine Protection, Research and Sanctuaries<br />
Act of 1972<br />
SWDA Solid Waste Disposal Act, 1965<br />
RRA Resource Recovery Act of 1970<br />
~ FEDERAL AGENCIES<br />
EPA Environmental Protection Agency<br />
CEO Council on Environmental Quality<br />
OMB Office of Management and Budget<br />
HUD Department of Housing and Urban Development<br />
DOC Department of Commerce<br />
DOD Department of Defense (U .S. Army Corps of Engineers)<br />
DOT Department of Transportation<br />
IPG Intermodal Planning Group<br />
DOA Department of Agriculture<br />
DOI Department of Interior<br />
HEW Department of Health, Education and Welfare<br />
FAA Federal Aviation Administration<br />
FRA Federal Railroad Administration<br />
FHWA Federal Highway Administration<br />
UMTA Urban Mass Transit Administration<br />
CG Coast Guard<br />
Figure 29 . Concluded .<br />
O <strong>FLORIDA</strong> ENVIRONMENTAL LAWS<br />
a Florida Air and Water Pollution Control Act<br />
b The Environmental Protection Act of 1971<br />
c Oil Spill Prevention and Pollution Control<br />
d Florida Electrical Power Plant Siting Act<br />
e The Florida Litter Law of 1971<br />
f State Bond Program and Sewage Treatment<br />
Revolving Loan Program<br />
g Trustees of the Internal Improvement Trust Fund<br />
h Land Conservation Act of 1975<br />
i Environmental Reorganization Act of 1975<br />
) Resource Recovery and Management Act<br />
k Florida Water Resources Act of 1972<br />
m Florida Water Pollution Control and Sewage<br />
Treatment Plant Grant Act of 1970<br />
n The Florida Environmental Land and Water<br />
Management Act of 1972<br />
p Florida State Comprehensive Planning Act of 1972<br />
q Local Goverment Comprehensive Planning Act<br />
of 1975<br />
(D<br />
REVIEW PROCESSES<br />
EIS Environmental Impact Statement<br />
A-95 Clearinghouse Review<br />
DRI Development of Regional Impact<br />
UWP Unified Work Program<br />
AP Action Plan<br />
= <strong>FLORIDA</strong> AGENCIES<br />
DER Department of Environmental Regulation<br />
DvEPg Division of Enironmental Programs<br />
DvEPt Division of Environmental Permitting<br />
WMD Water Management District<br />
DCA Department of Community Affairs<br />
GFWFC Game and Freshwater Fish Commission<br />
DNR Department of Natural Resources<br />
BTIITF Board of Trustees of the Internal<br />
Improvement Trust Fund<br />
(Division of State Lands)<br />
DvMR Division of Marine Resources<br />
DvRN Division of Resource Management<br />
DvLe Division of Law Enforcement<br />
DvPR Division of Parks and Receration<br />
DOA Department of Administration<br />
DvSP Division of State Planning<br />
DvB Division of Budget<br />
DOT Department of Transportation<br />
DvA Division of Administration<br />
DvTPP Division of Transportation Planning<br />
and Programing<br />
DvRO Division of Road Operations<br />
DvMTO Division of Mass Transit Operations<br />
OG Office of the Governor<br />
CABINET<br />
Secretary of State<br />
Attorney Gsneral<br />
Comptroller<br />
Treasurer<br />
Commissioner of Agriculture<br />
Commissioner of Education<br />
Q LOCAL AND REGIONAL AGENCIES<br />
RPC Ragfonal Planning Council<br />
LG Local Gevernmant AGenei .s<br />
MPO Metropolitan Plannhng OparNtation<br />
f D Prieate Davebpar
unconsolidated sands<br />
water table<br />
aquiclude clay<br />
limestone<br />
fresh waler ~<br />
under ground source<br />
w of drinking water<br />
A<br />
Ull<br />
aquiclude<br />
fresh water<br />
under ground source<br />
,.. w.: . .~ : .... ..... .. 1 I I' 1 I 1<br />
shale and oil sand<br />
CLASS I CLASS 11 CLASS III CLASS IV CLASS V<br />
Industrial Municipal Oil & Gas Mining (banned) cooling drainage<br />
Figure 30 . Underground injection control program classification of wells (Florida Department of<br />
Environmental Regulation 1981d) .<br />
Other
W<br />
Cn<br />
PERMITTING AND PROJECT REVIEW PROGRAMS<br />
m<br />
a<br />
er<br />
LAND AND WATER ~<br />
v1<br />
L;ii<br />
E<br />
p N<br />
c°o :<br />
y<br />
E<br />
y<br />
rd<br />
E<br />
u a ~<br />
W<br />
O<br />
~<br />
9<br />
3W<br />
o<br />
p<br />
a<br />
o<br />
a<br />
H=<br />
~ vi<br />
o<br />
~<br />
m°<br />
-<br />
O a<br />
c<br />
io<br />
E<br />
10<br />
m<br />
o<br />
o<br />
a<br />
n<br />
~<br />
m<br />
~ n<br />
~ g<br />
~ C7<br />
m<br />
"3<br />
`o<br />
°'<br />
~<br />
~<br />
a 3<br />
"<br />
~ o<br />
° a<br />
in t<br />
o<br />
L°<br />
0<br />
¢<br />
q<br />
o<br />
~<br />
a_<br />
.°r<br />
~<br />
~<br />
a<br />
m<br />
E<br />
_∎<br />
°<br />
c<br />
°a<br />
n<br />
_ E<br />
DEVELOPMENT<br />
TIVITIES<br />
AC• LL<br />
°<br />
o<br />
p<br />
$<br />
0<br />
o_<br />
ao<br />
0/<br />
3<br />
?<br />
2<br />
a°E<br />
m .w<br />
~<br />
i<br />
c° °<br />
c3<br />
o<br />
c<br />
a' ~ N<br />
vq<br />
` 3<br />
a<br />
><br />
a` a<br />
c<br />
=<br />
3<br />
`0<br />
x<br />
°c<br />
ui °<br />
3<br />
vi<br />
5<br />
><br />
<<br />
Y<br />
~<br />
0 ~<br />
<<br />
cc<br />
a ~ o<br />
o3 Ea S<br />
o<br />
V<br />
ya tg<br />
°<br />
C a<br />
~<br />
m<br />
_L N<br />
0<br />
°c<br />
p<br />
c<br />
v<br />
`m<br />
m<br />
`<br />
m<br />
0<br />
~m<br />
o ~<br />
O O<br />
a =<br />
~$<br />
v~ ~<br />
° Q<br />
~a<br />
rt<br />
-><br />
°<br />
E<br />
p<br />
e<br />
$<br />
's rj<br />
m`o<br />
Eo<br />
C<br />
f<br />
~<br />
a~<br />
3m< a~<br />
3<br />
~<br />
5<br />
o<br />
Y<br />
3<br />
L<br />
c<br />
_o<br />
V<br />
~ c<br />
~y r°<br />
~ c E<br />
~<br />
><br />
w<br />
a<br />
rn<br />
O<br />
><br />
~<br />
h<br />
<<br />
V<br />
_<br />
U<br />
° q<br />
00<br />
E o<br />
p<br />
O Q<br />
~<br />
Air pollution sources DER<br />
Amusement<br />
& recreation facilities<br />
Airports DER DER DOS WMD WMD DOA DVCA<br />
Animal & poultry con• EPA<br />
finement feeding facilities<br />
DER<br />
DER<br />
DER OER DOS WMD WMD DVCA<br />
Artificial recharge DER WMD<br />
Barricades & fences COE<br />
In wetlands DER<br />
DNR WMD<br />
Beach restoration pER DNR DNR DOS DOA<br />
Boat basins pER DNR DOS WMO DVCA<br />
Boat ramps pER DNR DOS WMD<br />
Boat slips pR DNR DOS WMD DVCA<br />
E<br />
Breakwaters DNR DNR WMD<br />
Bridges ~ R<br />
DNR DOS WMD WMD<br />
Bulkheads, shoreline<br />
Burning, open<br />
Cables, overhead<br />
Cables subaqueous<br />
COE<br />
DER<br />
COE<br />
COE<br />
DER<br />
DNR DNR DOS WMD<br />
DACS<br />
DER<br />
WMO<br />
ONR DOS WMO<br />
Figure 31. Matrix of State Agencies involved in land development control (Florida Department of Environmental<br />
Regulation 1981c). Continued .
( .J<br />
~<br />
v<br />
0<br />
PERMITTING AND PROJECT REVIEW PROGRAMS<br />
LAND AND WATER ~<br />
w E<br />
a<br />
W a +°! ~ C O<br />
0 i r<br />
~<br />
w<br />
E<br />
E o 3<br />
a<br />
a°<br />
C p c p N a o a O ~~<br />
'<br />
rn°<br />
-<br />
: °<br />
° +<br />
~ Y : g ;<br />
~<br />
+<br />
DEVELOPMENT<br />
TIVITIES<br />
AC• -_<br />
LL<br />
~<br />
°<br />
°<br />
p<br />
o<br />
'-<br />
~<br />
9<br />
~<br />
~ ~<br />
- c<br />
O<br />
a E<br />
q w<br />
c<br />
~<br />
g o<br />
>w<br />
C i<br />
o<br />
~<br />
~ y<br />
v w<br />
c 3<br />
+<br />
Q<br />
+ e ;<br />
HC 1<br />
Z f//<br />
:<br />
O<br />
<<br />
vc 0<br />
+<br />
1~ J<br />
. 'c ~ ~<br />
a<br />
C y<br />
~ o<br />
o<br />
n°<br />
o<br />
3<br />
w<br />
j+ Q<br />
V<br />
c<br />
w<br />
v<br />
oC<br />
-<br />
E<br />
`s<br />
a<br />
~ ~ _<br />
i<br />
c<br />
d =<br />
b<br />
B a<br />
~ o<br />
v<br />
c<br />
g<br />
¢ aI<br />
><br />
c it<br />
M<br />
C<br />
° 0<br />
E<br />
e<br />
:<br />
~ •m<br />
~<br />
or<br />
Nf °<br />
~<br />
~ ~ a<br />
~! y C C U ~ •<br />
C<br />
.<br />
o<br />
~ t<br />
o<br />
+ g<br />
E<br />
° m t<br />
~ s w c<br />
Y U<br />
aH~<br />
w o ~' > Y =<br />
3 3 i w d 0 ¢1<br />
o E<br />
i<br />
C C<br />
0 0<br />
E<br />
n ~ +<br />
><br />
8<br />
Canals, construction<br />
and connection<br />
COE<br />
DER<br />
DOS WMD WMD<br />
H I 1 o8<br />
Canals, maintenance COE<br />
DER ONR WMD<br />
Canals, navigation pER DNR DOA<br />
Channels pER DNR DNR DOA<br />
Cleariny of land<br />
Compactor<br />
Consumptive<br />
use of water<br />
Construction, wetlands<br />
Construction, coastline<br />
CO E<br />
DER<br />
DER<br />
DER DOS<br />
DACS<br />
CO E ONR DNR DOS<br />
DER<br />
WMD<br />
DNR DOS WMD WMO<br />
Dams and weirs CO E DOS WMD WMD<br />
DER<br />
Deep well Injection DER DER DOS WMD<br />
Dikes CO E<br />
DER DOS WMD WMD<br />
Discharge of wastes into EPA<br />
surface and ground waters<br />
DER DER DER WMD WMD<br />
COE<br />
Ditches DOS WMD WMD<br />
COE<br />
Doc<br />
k DER<br />
DNR DNR DOS WMD<br />
Drainage wells DER DER WMD<br />
Figure 31 . Matrix of State Agencies involved in land development control (Florida Department of Environmental<br />
Regulation 1981c). Continued .<br />
o1
W<br />
-P<br />
CD<br />
LAND AND WATER<br />
u<br />
O<br />
tA<br />
PERMITTING AND PROJECT REVIEW PROGRAMS<br />
w E ° W ° c o ° o o $<br />
vi a E a ~<br />
~<br />
3 e a<br />
n<br />
> ° E o o<br />
c a c N +<br />
$<br />
O V1<br />
O c<br />
-<br />
E<br />
°c _<br />
+ o+ + c<br />
+ e 3 q<br />
° o<br />
J p<br />
E<br />
c pc<br />
>' °<br />
rn u„ ° _<br />
O<br />
4 O<br />
p n `<br />
~ o Oo oa H` O<br />
! q ° o O Q • O<br />
rA v<br />
" u<br />
DEVELOPMENT AC- u 9 _ . 3 m /0 +7 ; ~ c v1 2 p T<br />
°c - o°E ~3 o.<br />
~<br />
c<br />
°<br />
c o<br />
~3 _c° _ ~ ec g `o~ : g v ~<br />
~ °<br />
c ~ o -> oo °y .. ~ ca oe<br />
o +<br />
o<br />
c<br />
:o<br />
+ o<br />
TIVITIES<br />
W O<br />
+ _ v : o<br />
t<br />
? t~ c ~<br />
.<br />
o y 2 a<br />
c<br />
o E n in t E<br />
p ~<br />
;<br />
_<br />
o ,a `O ~ E<br />
$ ¢<br />
0<br />
2<br />
~<br />
v Q a O • m •~ 0 .<br />
C +<br />
C~ O ~ O Y ~ ~ • 2 i<br />
° _ c e $ o w<br />
8 3 = ~ a` 3 9 v g E T<br />
& s a £ . e o d.' > d - ><br />
r i s < t ~ 0 2 0 ¢ c~ ~ 3 3 i W<br />
v 8<br />
Dredging, wetlands pER DNR DOS WMD WMD<br />
COE<br />
Dredging lor borrow DNR DOS WMD<br />
Dredging COE<br />
channels and berths DER<br />
CO E<br />
Dredging, rigs DER<br />
0<br />
DNR DNR DOS WMD WMD<br />
Dredging maintenance pER DNR DNR DOS WMD<br />
Dredging, spoil disposal pER DNR DOS WMD<br />
Electrical power plant<br />
Electrical<br />
transmission lines<br />
Excavation, prehistoric<br />
or historic sites<br />
Federally funded<br />
and assisted projects<br />
Filling, site development<br />
Filling, wetlands<br />
Flood control works<br />
Drilling DER DNR DNR WMD WMD<br />
Gages<br />
Groins and jetties<br />
COE<br />
DER<br />
DER pER DER DER DER WMD WMD DOA; DVCA<br />
DER DER DOS WMD DVCA DVCA<br />
DER DO S<br />
CO E ONR WMD<br />
DER<br />
COE<br />
DER<br />
COE<br />
DER<br />
COE<br />
DER<br />
COE<br />
DER<br />
DO S DOA DOA<br />
DNR WMD WMD<br />
WMD WMD DOA<br />
DNR DNR WMD DOA<br />
Figure 31 , Matrix of State Agencies involved in land development control (Florida Department of Environmnetal<br />
Regulation 1981c). Continued .<br />
+<br />
n
W<br />
A<br />
9.0<br />
PERMITTING AND PROJECT REVIEW PROGRAMS<br />
m E ° W `.oi °° =' c o a ° o °o `<br />
LAND AND WATER ~ ~ T o ~ ~ 3 n ~ a c N °<br />
E<br />
'<br />
p<br />
4 a<br />
~ n<br />
3<br />
o<br />
~ ;<br />
° o<br />
L<br />
o u<br />
C<br />
E e<br />
DEVELOPMENT AC-<br />
TIVITIES<br />
_<br />
LL<br />
°<br />
:<br />
p<br />
~<br />
S<br />
~<br />
°<br />
-<br />
o<br />
a<br />
y°<br />
3<br />
2 -o<br />
~ c<br />
a° E<br />
ow<br />
~<br />
.2<br />
~<br />
Z<br />
N<br />
~ w<br />
c 3<br />
$<br />
u<br />
c<br />
~<br />
u'<br />
0°<br />
e 3<br />
°<br />
e> a`<br />
a<br />
ac<br />
_<br />
O<br />
_o 3<br />
°<br />
x<br />
0<br />
c<br />
'0<br />
vo<br />
m<br />
a<br />
3<br />
r~ i<br />
4<br />
~<br />
g<br />
~ ><br />
5<br />
s<br />
q<br />
7<br />
0<br />
i<br />
o y<br />
'c° c<br />
a° ° o<br />
o °<br />
o E<br />
a<br />
0<br />
a<br />
c~<br />
~<br />
°<br />
t~<br />
s<br />
°<br />
C<br />
`0<br />
_3<br />
~<br />
~<br />
°<br />
a<br />
~<br />
~<br />
3<br />
a<br />
t7<br />
c<br />
0<br />
o<br />
¢<br />
°<br />
~<br />
:<br />
c<br />
c<br />
J°<br />
°<br />
o<br />
C<br />
3<br />
m<br />
n<br />
0<br />
a o~<br />
n ' .e<br />
O ~°<br />
o N<br />
u<br />
v o<br />
V 0 Qc c m<br />
a= ¢<br />
m<br />
~<br />
°<br />
~<br />
n<br />
E<br />
c<br />
tj<br />
~~<br />
~v~<br />
o o<br />
E<br />
oa<br />
a<br />
2<br />
w<br />
U<br />
° r<br />
° <<br />
3<br />
'0<br />
3<br />
a<br />
p °<br />
`o<br />
°<br />
3<br />
~<br />
a<br />
~<br />
~ o<br />
U<br />
<<br />
_ey<br />
c e<br />
E°<br />
E<br />
o<br />
><br />
w<br />
d<br />
°<br />
in<br />
w<br />
}<br />
°<br />
a<br />
.e<br />
/0<br />
o<br />
t<br />
w<br />
U<br />
ti<br />
E<br />
° ~<br />
C<br />
0 0<br />
E a<br />
no<br />
O¢<br />
o<br />
'<br />
r~<br />
Highway conlruclion DER DOS WMD WMD DOA<br />
Hospitals DER WMD DVCA<br />
Houses DHRS DHRS DOS WMD<br />
Household garbage site DER<br />
Impoundments CO E DOS WMD WMD<br />
DER<br />
Incinerator DER DER DER<br />
Industrial, air emissions DER<br />
Industrial, discharge EPA<br />
to surface water<br />
DER<br />
DER<br />
WMD WMD<br />
Industrial, discharge<br />
to groundwater DER DER WMD WMD<br />
Industrial,<br />
hazardous waste disposal<br />
Industrial,<br />
EPA<br />
plants and parks<br />
DER<br />
DER<br />
Jettles<br />
COE<br />
DER<br />
DER<br />
DER DER DER WMD WMD DVCA<br />
DNR DNR DOS<br />
Landfill DER DER DER WMD<br />
Land sales DBR DVCA<br />
Land spreading DER<br />
Land clearing and burning<br />
DER<br />
Figure 31 . Matrix of State Agencies involved in land development control (Florida Department of Environmental<br />
Regulation 1981c). Continued .<br />
DER<br />
DACS
W<br />
tr<br />
O<br />
u<br />
? O<br />
PERMITTING AND PROJECT REVIEW PROGRAMS<br />
a L O a W ~ O<br />
w<br />
O<br />
~ • ~ ~ O<br />
_<br />
LAND AND WATER<br />
DEVELOPMENT AC- LL<br />
o<br />
rn<br />
p<br />
o<br />
G uf<br />
` o<br />
2 ~<br />
a E<br />
!<br />
a o<br />
ul<br />
Y6 a o<br />
c 3 3<br />
° .e<br />
g<br />
c<br />
~<br />
ov<br />
~<br />
S<br />
p<br />
G<br />
•<br />
O<br />
;<br />
~<br />
°c a<br />
• c<br />
~ N<br />
e c°<br />
+<br />
o<br />
0<br />
a<br />
y<br />
-<br />
0<br />
~<br />
o~<br />
e<br />
3<br />
~<br />
E<br />
±<br />
9<br />
¢<br />
g c g<br />
o w<br />
°0<br />
~ n<br />
~<br />
~ ><br />
;<br />
e<br />
o<br />
p rr 3<br />
N ±<br />
's y<br />
c<br />
Y<br />
¢<br />
-<br />
~<br />
:<br />
2<br />
O<br />
~<br />
g<br />
c<br />
€<br />
~<br />
Y/<br />
° c<br />
o<br />
o<br />
n<br />
o~<br />
_ TIVITIES<br />
:<br />
e o<br />
uw<br />
c<br />
±<br />
S o<br />
~<br />
i? ~<br />
~<br />
`<br />
~<br />
Q<br />
O<br />
a<br />
o b<br />
~<br />
M o d<br />
c<br />
tl<br />
c ~ y<br />
m<br />
c<br />
s<br />
° ° r B w<br />
$° y gO<br />
~ a °v<br />
Q<br />
E<br />
ar~ e o<br />
o<br />
-<br />
~ r<br />
3~<br />
`~<br />
~<br />
o<br />
Y<br />
g<br />
e<br />
U _<br />
~<br />
c~<br />
E E<br />
O<br />
=<br />
y<br />
o<br />
~<br />
o<br />
<<br />
V<br />
c rd<br />
p S<br />
O S<br />
aY 3 i a d ~ ~ _ < 8 E cT b ~ w Oa d =<br />
Levees pER DNR DOS WMD WMD<br />
Maintenance dredging CO E DNR DNR ~<br />
DER<br />
Mariculture<br />
Marinas COE<br />
DER<br />
CO<br />
E<br />
DER DNR DOS<br />
Const. of any new DER<br />
transmission line P SC<br />
Marine platforms CO E DNR<br />
OER<br />
Marine railroads<br />
Mining operations<br />
CO<br />
E<br />
DER<br />
CO E<br />
DER<br />
DER<br />
EPA<br />
DER<br />
Mining EPA<br />
phosphate ponds, dams<br />
DER<br />
DER<br />
Mining, reclamatlon DNR<br />
Mining in CO E<br />
water and wetlands DER<br />
DER<br />
C<br />
~ 3 3 ~< ~ci d tS a<br />
DNR DNfl DOS WMD DVCA<br />
DER DER DNFY DOS WMD WMD WMD DVCA<br />
DER ONR DOS WMD WMD DVCA<br />
EPA<br />
OER DNR DNR DOS WMO WMD<br />
Mooring COE<br />
buoys and pilings DER ONR WMD<br />
Navigation aids<br />
CO E<br />
DER<br />
COE<br />
Navigation channels DER DNR DNR DOA<br />
Office parks DER WMD WMO DVCA<br />
Oil & gas wells DNR ONR WMD WMO WMD<br />
Figure 31 . Matrix of State Agencies involved in land development control (Florida Department of Environmental<br />
Regulation 1981c). Continued .<br />
WMO<br />
WMD
W<br />
(Tl<br />
/--~<br />
0<br />
PERMITTING AND PROJECT REVIEW PROGRAMS<br />
LAND AND WATER<br />
w<br />
~<br />
L m<br />
q T<br />
„<br />
m<br />
W w O<br />
a<br />
w<br />
r°<br />
0<br />
is<br />
o<br />
m<br />
D<br />
q<br />
O<br />
3<br />
+<br />
0 ;<br />
O<br />
cw m<br />
9 o v~ ~ o a c ~~ o - E ° o - ' n o ~ o o u E :<br />
DEVELOPMENT AC• -_<br />
r°n<br />
c<br />
O<br />
c o<br />
~° -<br />
5 i<br />
tn u ~<br />
-<br />
~<br />
°<br />
a p ~ y u O<br />
'6<br />
a u a ~ Qp o n ~ ¢<br />
q<br />
a ~ `w c E<br />
a_<br />
LL ~ ~~<br />
c<br />
n ~<br />
3<br />
c<br />
w<br />
w<br />
r<br />
w<br />
3<br />
~ o<br />
c<br />
~z a<br />
0<br />
;<br />
o<br />
¢<br />
b<br />
><br />
,a ~<br />
~ O<br />
0<br />
c<br />
y<br />
m<br />
o<br />
a<br />
p<br />
:<br />
Y >w i a~<br />
TIVITIES w<br />
va<br />
$<br />
a<br />
~<br />
3<br />
aE<br />
m w<br />
°<br />
z<br />
~<br />
V<br />
~<br />
7<br />
q3<br />
°<br />
a<br />
a<br />
C<br />
_<br />
~<br />
o<br />
~<br />
~<br />
+<br />
9 C<br />
v<br />
-<br />
rn °<br />
y<br />
+<br />
~<br />
><br />
5<br />
-<br />
w<br />
O i<br />
w<br />
J<br />
wo<br />
a o<br />
o o<br />
E<br />
~<br />
C<br />
Q<br />
v<br />
°<br />
10<br />
tg<br />
C<br />
°3<br />
m_<br />
c a<br />
w<br />
~<br />
w<br />
t7<br />
e<br />
-<br />
o<br />
0<br />
c<br />
'~<br />
o<br />
c<br />
f<br />
w<br />
~ w<br />
o<br />
a<br />
in<br />
a<br />
C<br />
~<br />
mc<br />
o<br />
w<br />
O o<br />
C<br />
oy<br />
u<br />
o o`<br />
o a<br />
a=<br />
.a<br />
B<br />
7 O<br />
u~v<br />
c<br />
° U<br />
o<br />
¢ °<br />
j<br />
a<br />
E<br />
a<br />
c<br />
c> °<br />
C<br />
~°<br />
E<br />
w<br />
aw<br />
q<br />
f<br />
w-<br />
~<br />
0/<<br />
3<br />
~ -0<br />
w<br />
3<br />
w<br />
~<br />
0<br />
Y<br />
o<br />
~<br />
C<br />
~<br />
o<br />
O<br />
~<br />
<<br />
U<br />
o w<br />
E°<br />
E<br />
o<br />
i<br />
w<br />
~<br />
in<br />
O<br />
><br />
a<br />
w<br />
w<br />
O<br />
<<br />
~<br />
s<br />
ci<br />
C C<br />
w O<br />
Ea<br />
no<br />
o¢<br />
i<br />
8<br />
Oil & gas, leases<br />
Oil & gas storage DNR<br />
Open burning<br />
Out fall pipes<br />
COE<br />
DER EPA<br />
DER D ER<br />
DNR<br />
DER<br />
DACS<br />
DNR DNR WMD WMD<br />
Parking lots DER DER WMD<br />
Petroleum storage DER DNR WMD DVCA<br />
Phosphate ponds, EPA<br />
DER DER DNR DOS WMD<br />
dams D ER<br />
WMD<br />
Piers, commercial DNR DNRi DOS WMD<br />
DER<br />
Piers, private<br />
COE<br />
DER<br />
DNR WMD<br />
Pipelines, subaqueous p~R DNR DNR DNR DNR DOS WMD<br />
Pollutant transfer facility<br />
Port facilities COE DER, DER DNR DNR. DNR DOS WMD DOA DVCA<br />
D ER<br />
COE<br />
DER<br />
Potable water reservoirs COE<br />
DER<br />
Power plant const . COE EPA<br />
DER<br />
and expansion DER DER<br />
DNR DNR DNR<br />
DER DHRS DNR DOS WMD WMD<br />
DER DER DER DER DNR DNR DNR DOS WMD WMD WMD WMD DOA<br />
Power plant, planning DVCA<br />
Public water supplies DER DHRS DER WMD WMD<br />
Figure 31 . Matrix of State Agencies involved in land development control (Florida Department of Environmental<br />
Regulation 1981c). Continued .
W<br />
(l1<br />
IV<br />
0<br />
PERMITTING AND PROJECT REVIEW PROGRAMS<br />
m E a<br />
W o .an = c m a o 0 0<br />
LAND AND WATER °u 0 0 , o E a 3 o c p N 10 ° + 3 ° ; c<br />
~ O tn<br />
o<br />
:e o a ~ 0<br />
c<br />
_<br />
e c o - E o ~ n o 0 0 0 =<br />
E u<br />
CC ~<br />
p<br />
(d<br />
u w' ~ O<br />
. ><br />
a H O<br />
°<br />
° ° ON<br />
41 `<br />
a<br />
i<br />
a<br />
a $ R a p V Q w o a G<br />
O o f7 2<br />
DEVELOPMENT AC- = c a m ° U)<br />
°<br />
~<br />
_a c<br />
c a °<br />
c o<br />
e ° .e ° V a ± o<br />
a E<br />
IL 0 5 C ~ a a r + N d a 0-<br />
° j O'- Y e O ~i J C C a a a c 0° ° ~ ° Ol<br />
c ~ c<br />
_ + c p= a c v ` c_ ~o - oo<br />
c o ; o o c<br />
TIVITIES<br />
° a A w<br />
~ - a ° ~ -' ~<br />
N o ~ t + ° u E o<br />
°<br />
c o o a ~<br />
o o<br />
s<br />
~<br />
: = o a v E<br />
E<br />
l<br />
~a<br />
u<br />
°<br />
m ~ u o E p 0 ° c E : _°¢ ° °<br />
° O 3 E : ~ a<br />
„<br />
: $<br />
a ~ o O<br />
c ~<br />
I o ; i ~ a` ° p g p _ C_ : 0<br />
OI Cp c° a O ~ Y ~<br />
~<br />
O ~ m O ` _ ¢ ° U ~ 3 ; < W ~ U B<br />
Pulverizer DER ,<br />
railroads DER DOS DOA<br />
Resource recovery DER<br />
Reefs, offshore artificial<br />
CO E DNR DOS<br />
DER<br />
Residential development DER DER DHRS DHRS DNR DOS DBR WMD WMD WMO DVCA<br />
Reservoirs CO E<br />
DER ~S WMD WMD<br />
Revetment COE<br />
DER<br />
Retaining wall<br />
COE<br />
DER<br />
ONR DNR WMD<br />
Ripreps DNR DNR WMD<br />
Road construction DER DOS WMD WMD DOA<br />
Sanitary landfill DER<br />
Sewage collection<br />
& transmission<br />
EPA<br />
DER<br />
DER DER WMD<br />
Schools DER DHRS WMD WMO DVCA<br />
Septic tank DHRS<br />
Sewage disposal DER<br />
DER DOS<br />
EPA<br />
DER<br />
Sewage, percolation EPA<br />
& evaporation ponds<br />
DER<br />
DER<br />
Figure 31 . Matrix of State Agencies involved in land development control (Florida Department of Environmental<br />
Regulation 1981c). Continued .<br />
DOS<br />
WMD
t,J.)<br />
rs<br />
(w)<br />
0<br />
w<br />
~N O<br />
W<br />
o<br />
w<br />
1°II<br />
PERMITTING AND PROJECT REVIEW PROGRAMS<br />
LAND AND WATER<br />
DEVELOPMENT AC- LL<br />
u<br />
o<br />
E<br />
'V' >w<br />
c N<br />
42<br />
3 ~ c° °<br />
E<br />
~3 i.<br />
V1<br />
a o<br />
~<br />
D<br />
i<br />
3<br />
0<br />
°<br />
~<br />
$<br />
° w<br />
~ U' 1<br />
c<br />
`<br />
u°f<br />
0<br />
+<br />
±<br />
v<br />
o<br />
a<br />
: w<br />
J nQ<br />
o O<br />
;<br />
a<br />
i 3<br />
o°u<br />
u t<br />
L<br />
+ a o<br />
o<br />
o<br />
°_<br />
„<br />
±<br />
n<br />
n<br />
_ E<br />
N 3 : c° p " 3 a TIVITIES<br />
~<br />
o<br />
8<br />
?<br />
d°<br />
+<br />
3<br />
_<br />
j[ +<br />
~E c 3<br />
ew ~<br />
c ~<br />
e ~<br />
Z ~ '<br />
v°<br />
~3<br />
~<br />
~<br />
a<br />
p<br />
c<br />
=_<br />
a<br />
3<br />
+<br />
x<br />
vc<br />
∎<br />
r9i<br />
r~i<br />
~<br />
y<br />
5<br />
`<br />
~<br />
<<br />
J<br />
c c<br />
d a<br />
w<br />
O<br />
; E<br />
P<br />
c<br />
~<br />
~<br />
w<br />
°<br />
cg<br />
c<br />
~<br />
o_~<br />
o<br />
C d<br />
e<br />
~<br />
n<br />
+<br />
C7<br />
~<br />
+<br />
-_<br />
O<br />
vc<br />
,<br />
a<br />
y<br />
C<br />
~<br />
w<br />
v<br />
c<br />
~<br />
o<br />
+<br />
u~<br />
w<br />
S<br />
`<br />
~<br />
m<br />
c<br />
p<br />
O<br />
w<br />
O .°.<br />
c<br />
o y<br />
~<br />
Y O<br />
O_w<br />
a ` x<br />
U<br />
-' .e<br />
3 o<br />
tnv<br />
o cQ<br />
(J<br />
g<br />
¢<br />
d<br />
E<br />
3<br />
w<br />
~<br />
cg<br />
r'n<br />
°O<br />
E<br />
o<br />
C<br />
+<br />
~<br />
°~<br />
;<br />
^<br />
+<br />
3<br />
o<br />
w<br />
Y<br />
O<br />
3<br />
p<br />
e<br />
U<br />
~n<br />
O,~<br />
<<br />
_<br />
c±<br />
E a<br />
c E<br />
o-<br />
C<br />
W<br />
°<br />
.°.<br />
y<br />
Yo<br />
d<br />
w<br />
°<br />
<<br />
~ u<br />
C<br />
o<br />
c<br />
O O<br />
ng 0<br />
O ¢<br />
><br />
~<br />
Sewage<br />
plant construction<br />
DER<br />
EPA<br />
DER<br />
~S<br />
EPA<br />
Sewage polishing ponds DER DER<br />
Shopping eenters DER<br />
Shoreline protection ~E<br />
DER<br />
Shredding, baling plant<br />
Signs COE<br />
in water and wetlands DER<br />
Ski ramps<br />
DER<br />
=r<br />
C<br />
DNR DNA DOS<br />
DNR<br />
O<br />
w<br />
°.<br />
;<br />
0<br />
O<br />
WMD WMD WMD<br />
COE WMD<br />
OER<br />
Spray irrigation DER DER<br />
Stilt houses pR E<br />
DNR<br />
Stormwaler control<br />
Stormwater disposal<br />
DER<br />
-DER<br />
EPA<br />
DER<br />
EPA<br />
DER<br />
Storage of pollutants DER DNR<br />
Subdivision of lands DHRS DBR . WMD<br />
Transfer of pollutants DNR DNR DOS<br />
Transfer station<br />
for solid waste<br />
Tunnels, underwater<br />
DER<br />
COE ~S<br />
DER<br />
DNR<br />
WMD<br />
WMD WMD<br />
WMD WMD<br />
Figure 31 . Matrix of State Agencies involved in land development control (Florida Department of Environmental<br />
Regulation 1981c). Continued .<br />
WMD<br />
DVCA
W cs+<br />
-P<br />
PERMITTING AND PROJECT REVIEW PROGRAMS<br />
m<br />
°<br />
q E p W m<br />
m<br />
p ~ G<br />
p<br />
LAND AND WATER<br />
DEVELOPMENT AC• LL<br />
rn °<br />
o<br />
~ o<br />
5 w<br />
rn '<br />
° -> E<br />
m<br />
' N<br />
a v<br />
o<br />
~ c<br />
q<br />
n<br />
o<br />
ov<br />
~<br />
o<br />
m~<br />
o<br />
~<br />
_<br />
~<br />
~-<br />
o in<br />
a c<br />
c<br />
o<br />
`<br />
„<br />
0<br />
O<br />
.6<br />
p<br />
°<br />
3<br />
E<br />
°<br />
o<br />
~<br />
°<br />
n<br />
a<br />
-j np<br />
$ o<br />
_a g<br />
Cj<br />
~'<br />
o<br />
m<br />
m<br />
°3<br />
°<br />
o<br />
m<br />
u<br />
in=<br />
~ in<br />
=<br />
¢<br />
m<br />
°<br />
`<br />
'p _<br />
O<br />
m<br />
p<br />
o<br />
o<br />
E<br />
m<br />
g<br />
o N<br />
c<br />
a<br />
o<br />
a<br />
_ E<br />
° o<br />
7c M 0 n CE<br />
C> D q C = {n<br />
= C J<br />
.e<br />
_<br />
p<br />
TIVITIES q<br />
a<br />
a°<br />
`m<br />
m w<br />
c<br />
O<br />
o<br />
"<br />
q<br />
°<br />
q<br />
=<br />
G<br />
_<br />
o<br />
c<br />
D<br />
~<br />
°<br />
0<br />
O'<br />
q c<br />
a o<br />
p°'<br />
m<br />
O<br />
U<br />
=<br />
p<br />
Y<br />
o o<br />
a a°<br />
pq<br />
tg<br />
c<br />
O<br />
c<br />
~<br />
o<br />
~<br />
~<br />
m<br />
E<br />
°<br />
m<br />
C<br />
c N<br />
o<br />
~ o<br />
~ o<br />
rn o<br />
° U<br />
n<br />
p'<br />
O 0<br />
E<br />
m<br />
o<br />
<<br />
r<br />
o Y<br />
q<br />
m<br />
V<br />
E<br />
E<br />
n<br />
c<br />
rn<br />
~<br />
<<br />
~<br />
0<br />
E g<br />
$ ¢<br />
Use of state lands DNR<br />
Volume reduction plant DER<br />
° E q = _° c m mn 'o o, m c m<br />
rn 5 a a c g ~ O O a= ¢ t g ~ 3 3 < w<br />
Water, consumptive use WMD<br />
Water supply system DER DHRS DOS WMD WMD<br />
Wells,<br />
potable water supply<br />
Water, wells DER DOS WMD WMD<br />
DER WMD WMD<br />
Wells, disposal DER DER DER WMD<br />
Wells, oil and gas DER DNR DOS WMD<br />
Yard trash site DER DER<br />
Sale, creation &<br />
operation of DBR<br />
residential condos<br />
Sale, creation &<br />
operation of DBR<br />
residential co-ops<br />
DOS Department of State DACS Department of Agriculture and Consumer Services EPA Environmental Protection Agency<br />
DNR Department of Natural Resources DVCA Department of Vetrans and Community Affairs DER Department of Environmental Regulation<br />
PSC Public Service Commission DHRS Department Health and Rehabilitative Services WMD Water Management District<br />
DBR Department of Business Regulation COE U .S. Army Corps of Engineers DOA Department of Administration<br />
Figure 31 . Matrix of State Agencies involved in land development control (Florida Department of Environmental<br />
Regulation 1981c). Concluded .<br />
s _ >
REFERENCES<br />
Bellamy, T .R . ; Knight, H .A. Forest statistics for South Florida 1970 . Asheville,<br />
NC : U .S . Department of Agriculture, Forest Service ; July 1970 ;<br />
Forest Service Resource Bulletin SE 16 . 35 p . Available from : Florida<br />
Department of Agriculture, Division of Forestry, Tallahassee, FL .<br />
Bowles, G .K . (Economic Research Division, U .S . Department of Agriculture,<br />
Washington, DC) ; Beale, C .L . (Economic Research Division, U .S . Department<br />
of Agriculture, Washington, DC) ; Lee, E .F . (Department of Sociology and<br />
the Institute of Behavioral Research, University of Georgia, Athens, GA) .<br />
Net migration of the population, 1960-1970, by age, sex, and color .<br />
Athens, GA : University of Georgia Printing Department ; 1975 ; 147 p .<br />
Bowles, G .K. (Economic Research Division, U .S . Department of Agriculture,<br />
Washington, DC) ; Tarver, J .D . (Department of Sociology, Oklahoma State<br />
University, Tulsa, OK) . Net migration of the population, 1950-1960, by<br />
age, sex, and color . Washington, DC : U .S . Government Printing Office ;<br />
1965 ; 164 p .<br />
Curry, D . ; Tootle, C .H . Petroleum activities in Florida 1980 . Tallahassee,<br />
FL : Florida Department of Natural Resources, Bureau of Geology ; 1980 ;<br />
Information circular 95 .<br />
Curry, L .D . (Oil and Gas Coordinator, Bureau of Geology, Florida Department of<br />
Natural Resources) . Oil and gas information packet . Unpublished document,<br />
ca . 1980 . Available from : Florida Department of Natural Resources,<br />
Bureau of Geology Library, Tallahassee, FL .<br />
Exxon Company, U .S .A . 1980 petroleum information packet . Houston, TX : Exxon<br />
Company ; July 1980 . Available from : Florida Department of Natural Resources,<br />
Tallahassee, FL .<br />
Federal Aviation Administration . Airport operations summary SO form 7230-19-1 .<br />
Unpublished document, ca . 1971 . Available from : Florida Department of<br />
Transportation, Bureau of Planning, Tallahassee, FL .<br />
Federal Aviation Administration . Airport operations summary SO form 7230-19-1 .<br />
Unpublished document, ca . 1976 . Available from : Florida Department of<br />
Transportation, Bureau of Planning, Tallahassee, FL .<br />
Federal Aviation Administration . Airport operations summary SO form 7230-19-1 .<br />
Unpublished document, ca . 1981 . Available from : Florida Department of<br />
Transportation, Bureau of Planning, Tallahassee, FL .<br />
Florida Chamber of Commerce . Directory of Florida Industries, 1980 . Tallahassee,<br />
FL : Florida Chamber of Commerce ; 1981 . '<br />
355
Florida Coastal Coordinating Council . Florida coastal zone land use and ownership<br />
. Tallahassee, FL : Florida Coastal Coordinating Council ; November<br />
1970 .<br />
Florida Department of Administration, Division of State Planning, Bureau of<br />
Comprehensive Planning . State of Florida, coastal plains area public<br />
investment plan . Tallahassee, FL : Florida Department of Administration ;<br />
June 1976 .<br />
Florida Department of Administration, State Energy Office . Florida energy<br />
resources . Tallahassee, FL : Florida Department of Administration ; September<br />
1978 ; 65 p .<br />
Florida Department of Agriculture, Division of Forestry . Florida forest statistics<br />
. Unpublished data, 1977 . Available from : Florida Department of<br />
Agriculture, Division of Forestry, Tallahassee, FL .<br />
Florida Department of Agriculture, Division of Forestry . Florida forest statistics<br />
. Unpublished data, 1980 . Available from : Florida Department of<br />
Agriculture, Division of Forestry, Tallahassee, FL .<br />
Florida Department of Agriculture, Division of Marketing, Bureau of Crop and<br />
Livestock Reporting . Field crops summary 1919-1967 . Tallahassee, FL :<br />
Florida Department of Agriculture ; ca . 1967 ; 22 p . Available from :<br />
Florida Crop and Livestock Reporting Service, Orlando, FL .<br />
Florida Department of Agriculture, Division of Marketing, Bureau of Crop and<br />
Livestock Reporting . Field crops summary 1977 . Tallahassee, FL : Florida<br />
Department of Agriculture ; ca . 1977 ; 34 p . Available from : Florida<br />
Crop and Livestock Reporting Service, Orlando, FL .<br />
Florida Department of Agriculture, Division of Marketing, Bureau of Crop and<br />
Livestock Reporting . Citrus summary 1979 . Tallahassee, FL : Florida<br />
Department of Agriculture ; ca . 1979a ; 49 p . Available from : Florida<br />
Crop and Livestock Reporting Service, Orlando, FL .<br />
Florida Department of Agriculture, Division of Marketing, Bureau of Crop and<br />
Livestock Reporting . Dairy summary 1979 . Tallahassee, FL : Florida<br />
Department of Agriculture ; ca . 1979b ; 26 p . Available from : Florida<br />
Crop and Livestock Reporting Service, Orlando, FL .<br />
Florida Department of Agriculture, Division of Marketing, Bureau of Crop and<br />
Livestock Reporting . Field crops summary 1979 . Tallahassee, FL : Florida<br />
Department of Agriculture ; ca . 1979c ; 14 p . Available from : Florida<br />
Crop and Livestock Reporting Service, Orlando, FL .<br />
Florida Department of Agriculture, Division of Marketing, Bureau of Crop and<br />
Livestock Reporting . Livestock summary 1979 . Tallahassee, FL : Florida<br />
Department of Agriculture ; ca . 1979d ; 50 p . Available from : Florida<br />
Crop and Livestock Reporting Service, Orlando, FL .<br />
Florida Department of Agriculture, Division of Marketing, Bureau of Crop and<br />
Livestock Reporting . Vegetable summary 1979 . Tallahassee, FL : Florida<br />
Department of Agriculture ; ca . 1979e ; 70 p . Available from : Florida<br />
Crop and Livestock Reporting Service, Orlando, FL .<br />
356
Florida Department of Commerce, Division of Economic Development, Bureau of<br />
Economic Analysis . Bay County economic data . Tallahassee, FL : Florida<br />
Department of Commerce ; January 1979a .<br />
Florida Department of Commerce, Division of Economic Development, Bureau of<br />
Economic Analysis . Collier County economic data . Tallahassee, FL :<br />
Florida Department of Commerce ; January 1979b .<br />
Florida Department of Commerce, Division of Economic Development, Bureau of<br />
Economic Analysis . DeSoto County economic data . Tallahassee, FL : Florida<br />
Department of Commerce ; January 1979c .<br />
Florida Department of Commerce, Division of Economic Development, Bureau of<br />
Economic Analysis . Escambia County economic data . Tallahassee, FL :<br />
Florida Department of Commerce ; January 1979d .<br />
Florida Department of Commerce, Division of Economic Development, Bureau of<br />
Economic Analysis . Franklin County economic data . Tallahassee, FL :<br />
Florida Department of Commerce ; January 1979e .<br />
Florida Department of Commerce, Division of Economic Development, Bureau of<br />
Economic Analysis . Gulf County economic data . Tallahassee, FL : Florida<br />
Department of Commerce ; January 1979f .<br />
Florida Department of Commerce, Division of Economic Development, Bureau of<br />
Economic Analysis . Lee County economic data . Tallahassee, FL : Florida<br />
Department of Commerce ; January 1979g .<br />
Florida Department of Commerce, Division of Economic Development, Bureau of<br />
Economic Analysis . Manatee County economic data . Tallahassee, FL :<br />
Florida Department of Commerce ; January 1979h .<br />
Florida Department of Commerce, Division of Economic Development, Bureau of<br />
Economic Analysis . Okaloosa County economic data . Tallahassee, FL :<br />
Florida Department of Commerce ; January 1979i .<br />
Florida Department of Commerce, Division of Economic Development, Bureau of<br />
Economic Analysis . Pasco County economic data . Tallahassee, FL : Florida<br />
Department of Commerce ; January 1979j .<br />
Florida Department of Commerce, Division of Economic Development, Bureau of<br />
Economic Analysis . Santa Rosa County economic data . Tallahassee, FL :<br />
Florida Department of Commerce ; January 1979k .<br />
Florida Department of Commerce, Division of Economic Development, Bureau of<br />
Economic Analysis . Walton County economic data . Tallahassee, FL :<br />
Florida Department of Commerce ; January 19791 .<br />
Florida Department of Commerce, Division of Economic Development, Bureau of<br />
Economic Analysis . Charlotte County economic data . Tallahassee, FL :<br />
Florida Department of Commerce ; January 1980a .<br />
Florida Department of Commerce, Division of Economic Development, Bureau of<br />
Economic Analysis . Florida county comparisons : 1980 . Tallahassee, FL :<br />
Florida Department of Commerce ; October 1980b .<br />
357
Florida Department of Commerce, Division of Economic Development, Bureau of<br />
Economic Analysis . Hillsborough County economic data . Tallahassee, FL :<br />
Florida Department of Commerce ; January 1980c .<br />
Florida Department of Commerce, Division of Economic Development, Bureau of<br />
Economic Analysis . Monroe County economic data . Tallahassee, FL : Florida<br />
Department of Commerce ; January 1980d .<br />
Florida Department of Commerce, Division of Economic Development, Bureau of<br />
Economic Analysis . Pinellas County economic data . Tallahassee, FL :<br />
Florida Department of Commerce ; January 1980e .<br />
Florida Department of Commerce, Division of Economic Development, Bureau of<br />
Economic Analysis . Sarasota County economic data . Tallahassee, FL :<br />
Florida Department of Commerce ; January 1980f .<br />
Florida Department of Commerce, Division of Employment Security . Basic labor<br />
market information . Unpublished charts, ca . 1980 . Available from :<br />
Florida Department of Commerce, Tallahassee, FL .<br />
Florida Department of Commerce, Division of Tourism . Florida's visitors :<br />
1976 . Tallahassee, FL : Florida Department of Commerce ; ca . 1977a ; 10 p .<br />
Florida Department of Commerce, Division of Tourism . Quarterly reports of the<br />
Division of Tourism : 1976 . Unpublished statistics, ca . 1977b . Available<br />
from : Florida Department of Commerce, Tallahassee, FL .<br />
Florida Department of Commerce, Division of Tourism . Florida's visitors :<br />
1979 . Tallahassee, FL : Florida Department of Commerce ; ca . 1980a ; 10 p .<br />
Florida Department of Commerce, Division of Tourism . Quarterly reports of the<br />
Division of Tourism : 1979 . Unpublished statistics, ca . 1980b . Available<br />
from : Florida Department of Commerce, Tallahassee, FL .<br />
Florida Department of Commerce, Division of Tourism . Florida's visitors :<br />
1980 . Tallahassee, FL : Florida Department of Commerce ; ca . 1981a ; 10 p .<br />
Florida Department of Commerce, Division of Tourism . Quarterly reports of the<br />
Division of Tourism : 1980 . Unpublished statistics, ca . 1981b . Available<br />
from : Florida Department of Commerce, Tallahassee, FL .<br />
Florida Department of Community Affairs, Bureau of Land and Water Management .<br />
Binding letters of interpretation, requests for determination as of<br />
10 October 1980 . Unpublished records, ca . 1980a . Available from : Florida<br />
Department of Community Affairs, Tallahassee, FL .<br />
Florida Department of Community Affairs, Bureau of Land and Water Management .<br />
DRI status as of 10 October 1980 . Unpublished records, ca . 1980b .<br />
Available from : Florida Department of Community Affairs, Tallahassee, FL .<br />
Florida Department of Education . Florida educational directory : 1949 . Tallahassee,<br />
FL : Florida Department of Education ; 1949 ; 87 p .<br />
Florida Department of Education . Florida educational directory : 1959 . Tallahassee,<br />
FL : Florida Department of Education ; 1959 ; 126 p .<br />
358
Florida Department of Education . Florida educational directory : 1970-71 .<br />
Tallahassee, FL : Florida Department of Education ; 1970 ; 262 p .<br />
Florida Department of Education . Florida educational directory : 1974-75 .<br />
Tallahassee, FL : Florida Department of Education ; 1974a ; 284 p .<br />
Florida Department of Education . Profiles of Florida school districts : profile<br />
3 . Tallahassee, FL : Florida Department of Education ; 1974b ; 167 p .<br />
Florida Department of Education . Florida educational directory : 1975-76 .<br />
Tallahassee, FL : Florida Department of Education ; 1975 ; 266 p .<br />
Florida Department of Education . Profiles of Florida school districts : profile<br />
5 . Tallahassee, FL : Florida Department of Education ; 1976 ; 185 p .<br />
Florida Department of Education . Profiles of Florida school districts : profi,le<br />
6 . Tallahassee, FL : Florida Department of Education ; 1977 ; 227 p .<br />
Florida Department of Education . Florida educational directory : 1978-79 .<br />
Tallahassee, FL : Florida Department of Education ; 1978a ; 324 p .<br />
Florida Department of Education . Profiles of Florida school districts : profile<br />
7 . Tallahassee, FL : Florida Department of Education ; 1978b ; 226 p .<br />
Florida Department of Education . Profiles of Florida school districts : profile<br />
8 . Tallahassee, FL : Florida Department of Education ; 1979 ; 200 p .<br />
Florida Department of Education . Profiles of Florida school districts : profile<br />
9 . Tallahassee, FL : Florida Department of Education ; 1980 ; 200 p .<br />
Florida Department of Education, Division of Community Colleges, Bureau of<br />
Research and Information Systems . Unpublished enrollment data, ca . 1980 .<br />
Available f rom : Department of Education, Tallahassee, FL .<br />
Florida Department of Environmental Regulation, Division of Environmental Programs,<br />
Bureau of Coastal Zone Planning . Statistical inventory of key<br />
biophysical elements in Florida's coastal zone . Tallahassee, FL : Florida<br />
Department of Environmental Regulation ; March 1978 .<br />
Florida Department of Environmental Regulation, Bureau of Water Management .<br />
State water quality management plan, executive summary, agriculture nonpoint<br />
source element . Tallahassee, FL : Florida Department of Environmental<br />
Regulation ; September 1979a ; 24 p .<br />
Florida Department of Environmental Regulation, Bureau of Water Management .<br />
State water quality management plan, point source load allocations . Tallahassee,<br />
FL : Florida Department of Environmental Regulation ; May 1979b .<br />
Florida Department of Environmental Regulation, Bureau of Water Management .<br />
State water quality management plan, water quality assessment . Tallahassee,<br />
FL : Florida Department of Environmental Regulation ; May 1979c .<br />
Florida Department of Environmental Regulation, Bureau of Water Management .<br />
State water quality management plan, water quality and mining . Tallahassee,<br />
FL : Florida Department of Environmental Regulation ; September 1980a .<br />
359
Florida Department of Environmental Regulation, Bureau of Drinking Water and<br />
Special Programs . Florida surface impoundment assessment, final report,<br />
executive summary . Tallahassee, FL : Florida Department of Environmental<br />
Regulation ; January 1980b .<br />
Florida Department of Environmental Regulation . Geographic information system<br />
data base ; user manual~[computer printout of data from aerial photographs]<br />
. Tallahassee, FL : Florida Department of Environmental Regulation<br />
; 1980c .<br />
Florida .Department of Environmental Regulation . The Florida coastal management<br />
program, State hearing draft . Tallahassee, FL : Florida Department<br />
of Environmental Regulation ; August 1980d ; 445 p .<br />
Florida Department of Environmental Regulation, Bureau of Air Quality Management<br />
Florida 1979 air quality statistical report . Tallahassee, FL : Florida<br />
Department of Environmental Regulation ; April 1980e ; No . DER BAQM<br />
80-006 . 200 p .<br />
Florida Department of Environmental Regulation, Solid Waste Management Program .<br />
Directory of solid waste facilities . Tallahassee, FL : Florida Department<br />
of Environmental Regulation ; 1981a .<br />
Florida Department of Environmental Regulation . Hazardous waste inventory<br />
1981 . Tallahassee, FL : Florida Department of Environmental Regulation ;<br />
1981b .<br />
Florida Department of Environmental Regulation . Manual of State regulatory<br />
and review procedures for land development in Florida . Tallahassee, FL :<br />
Florida Department of Environmental Regulation ; 1981c .<br />
Florida Department of Environmental Regulation, Office of Economic Analysis .<br />
Economic impact statement for the proposed revisions to Chapter 17-6<br />
Florida Administrative Code . Tallahassee, FL : Florida Department of<br />
Environmental Regulation ; May 1981d .<br />
Florida Department of Health and Rehabilitative Services . Annual statistical<br />
report : 1968-1969 . Tallahassee, FL : Florida Department of Health and<br />
Rehabilitative Services ; ca . 1969 .<br />
Florida Department of Health and Rehabilitative Services . Annual statistical<br />
report : fiscal year 1975-76 . Tallahassee, FL : Florida Department of<br />
Health and Rehabilitative Services ; ca . 1976 .<br />
Florida Department of Health and Rehabilitative Services . Annual statistical<br />
report : fiscal years 1977-78, 1978-79 . Tallahassee, FL : Florida Department<br />
of Health and Rehabilitative Services ; ca . 1979 .<br />
Florida Department of Highway Safety and Motor Vehicles, Division of Motor<br />
Vehicles . Tags and revenue . Tallahassee, FL : Florida Department of<br />
Highway Safety and Motor Vehicles ; 1979 ; 81 p .<br />
Florida Department of Highway Safety and Motor Vehicles, Division of Motor<br />
Vehicles . Tags and revenue . Tallahassee, FL : Florida Department of<br />
Highway Safety and Motor Vehicles ; 1980 .<br />
360
Florida Department of Highway Safety and Motor Vehicles, Division of Motor<br />
Vehicles . Mobile home registrations . Unpublished data, 1981 . Available<br />
from : Florida Department of Highway Safety and Motor Vehicles, Tallahassee,<br />
FL .<br />
Florida Department of Natural Resources, Division of Administration . Unpublished<br />
data on boat registrations, 1980 . Available from : Florida Department<br />
of Natural Resources, Tallahassee, FL .<br />
Florida Department of Natural Resources, Coastal Coordinating Council . Statistical<br />
inventory of key biophysical elements in Florida's coastal zone .<br />
Tallahassee, FL : Florida Department of Natural Resources ; May 1973 .<br />
Available from : Tampa Bay Regional Planning Council, St . Petersburg, FL .<br />
Florida Department of Natural Resources, Division of Law Enforcement, Bureau<br />
of Support Services . Summary of oil spill investigations from 1 January<br />
1975 to 31 August 1980 . Unpublished document, 1980 . Available from :<br />
Florida Department of Natural Resources, Tallahassee, FL .<br />
Florida Department of Natural Resources, Division of Marine Resources, Bureau<br />
of Marine Science and Technology . Summary of Florida commercial marine<br />
landings : 1970. Tallahassee, FL : Florida Department of Natural Resources<br />
; ca . 1971 .<br />
Florida Department of Natural Resources, Division of Marine Resources, Bureau<br />
of Marine Science and Technology . Summary of Florida commercial marine<br />
landings : 1971 . Tallahassee, FL : Florida Department of Natural Resources<br />
; ca . 1972 ; 64 p .<br />
Florida Department of Natural Resources, Division of Marine Resources, Bureau<br />
of Marine Science and Technology . Summary of Florida commercial marine<br />
landings : 1972 . Tallahassee, FL : Florida Department of Natural Resources<br />
; ca . 1973 ; 62 p .<br />
Florida Department of Natural Resources, Division of Marine Resources, Bureau<br />
of Marine Science and Technology . Summary of Florida commercial marine<br />
landings : 1973 . Tallahassee, FL : Florida Department of Natural Resources<br />
; ca . 1974 ; 64 p .<br />
Florida Department of Natural Resources, Division of Marine Resources, Bureau<br />
of Marine Science and Technology . Summary of Florida commercial marine<br />
landings : 1974. Tallahassee, FL : Florida Department of Natural Resources<br />
; ca . 1975 ; 34 p .<br />
Florida Department of Natural Resources, Division of Marine Resources, Bureau<br />
of Marine Science and Technology . Summary of Florida commercial marine<br />
landings : 1975 . Tallahassee, FL : Florida Department of Natural Resources<br />
; ca . 1976 ; 32 p .<br />
Florida Department of Natural Resources, Division of Marine Resources, Bureau<br />
of Marine Science and Technology . Summary of Florida commercial marine<br />
landings : 1976 . Tallahassee, FL : Florida Department of Natural Resources<br />
; ca . 1977 ; 30 p .<br />
361
Florida Department of Natural Resources, Division of Marine Resources, Bureau<br />
of Marine Science and Technology . Summary of Florida commercial marine<br />
landings : 1980 . Unpublished document, ca . 1981 . Available from : Florida<br />
Department of Natural Resources, Tallahassee, FL .<br />
Florida Department of Natural Resources, Division of Recreation and Parks .<br />
Park attendance for various fiscal years . Unpublished document, 1980a .<br />
Available from : Florida Department of Natural Resources, Tallahassee,<br />
FL .<br />
Florida Department of Natural Resources, Division of Recreation and Parks .<br />
Properties under the jurisdiction of the Division . Unpublished document,<br />
1980b . Available from : Florida Department of Natural Resources, Tallahassee,<br />
FL .<br />
Florida Department of Natural Resources, Division of Recreation and Parks .<br />
Public facility inventory . Unpublished computer printout, 1980c . Available<br />
from : Florida Department of Natural Resources, Tallahassee, FL .<br />
Florida Department of Natural Resources, Division of Recreation and Parks .<br />
Demand, supply, and need statistical summary for selected outdoor recreational<br />
activities, 1980-1985-1990 . Unpublished document, 1980d . Available<br />
from : Florida Department of Natural Resources, Tallahassee, FL .<br />
Florida Department of Natural Resources, Division of Resource Management,<br />
Bureau of Coastal Zone Planning . Florida regional coastal zone management<br />
atlas : region 2, Northwest Florida . Tallahassee, FL : Florida Department<br />
of Natural Resources ; September 1975a .<br />
Florida Department of Natural Resources, Division of Resource Management,<br />
Bureau of Coastal Zone Planning . Florida regional coastal zone management<br />
atlas : region 8, Tampa Bay . Tallahassee, FL : Florida Department<br />
of Natural Resources ; September 1975b .<br />
Florida Department of Natural Resources, Division of Resource Management,<br />
Bureau of Geology . Oil and gas drilling permits, 1973-1980 . Unpublished<br />
records, 1980 . Available from : Florida Department of Natural Resources,<br />
Tallahassee, FL .<br />
Florida Department of Professional Regulation . Current health profession<br />
employment statistics . Unpublished computer printout, ca . 1981 . Available<br />
from : Florida Department of Professional Regulation, Tallahassee,<br />
FL .<br />
Florida Department of Public Welfare, State Welfare Board . Twenty-fourth<br />
annual report : 1 July 1960 - 30 June 1961 . Tallahassee, FL : State<br />
Welfare Board ; 1962 .<br />
Florida Department of State, Bureau of Historic Sites and Properties . Number<br />
of assigned historical sites by county as of 4 November 1980 . Unpublished<br />
document, 1980 . Available from : Florida Department of State, Tallahassee,<br />
FL .<br />
362
Florida Department of Transportation . Florida road mileages as of 31 December<br />
1971 . Unpublished document, 1972 ; 1 p . Available from : Florida Department<br />
of Transportation, Tallahassee, FL .<br />
Florida Department of Transportation . Florida aviation system plan . Tallahassee,<br />
FL : Florida Department of Transportation ; 1976a .<br />
Florida Department of Transportation . Florida road mileages as of 31 December<br />
1975 . Unpublished document, 1976b ; 1 p . Available from : Florida Department<br />
of Transportation, Tallahassee, FL .<br />
Florida Department of Transportation . Florida State rail plan : executive<br />
summary and technical report . Tallahassee, FL : Florida Department of<br />
Transportation ; March 1978a .<br />
Florida Department of Transportation . Florida waterport systems study . Tallahassee,<br />
FL : Florida Department of Transportation ; 1978b . 8 Vol .<br />
Florida Department of Transportation . Florida port tonnage . Unpublished document,<br />
1979. Available from : Florida Department of Transportation, Tallahassee,<br />
FL .<br />
Florida Department of Transportation . Florida airports : operational-commercial<br />
history summary . Unpublished computer printout, 1980a . Available from :<br />
Florida Department of Transportation, Tallahassee, FL .<br />
Florida Department of Transportation . Florida pipeline mileages . Unpublished<br />
chart, 1980b . Available from : Florida Department of Transportation, Tallahassee,<br />
FL .<br />
Florida Department of Transportation . Florida pipeline volumes per day and<br />
annually . Unpublished document, 1980c . Available from : Florida Department<br />
of Transportation, Tallahassee, FL .<br />
Florida Department of Transportation . Total revenue freight carried by<br />
class I railroads in Florida . Unpublished document, 1980d . Available<br />
from : Florida Department of Transportation, Tallahassee, FL .<br />
Florida Department of Transportation . Florida road mileages as of 31 December<br />
1979 . Unpublished document, 1980e ; 1 p . Available from : Florida Department<br />
of Transportation, Tallahassee, FL .<br />
Florida Department of Transportation . Airport inventory and inspection record .<br />
Unpublished computer printout, 1981a . Available from : Florida Department<br />
of Transportation, Tallahassee, FL .<br />
Florida Department of Transportation . Florida railroad track mileage . Unpublished<br />
document, 1981b ; 1 p . Available from : Florida Department of<br />
Transportation, Tallahassee, FL .<br />
Florida Department of Transportation, Division of Transportation Planning .<br />
Average daily traffic counts . Unpublished records, ca . 1981c . Available<br />
from : Florida Department of Transportation, Tallahassee, FL .<br />
363
Florida Department of Transportation, Division of Transportation Planning .<br />
Roadway characteristics [taken f rom straight line diagrams] . Unpublished<br />
records, ca . 1981d . Available from : Florida Department of Transportation,<br />
Tallahassee, FL .<br />
Florida Electric Power Coordinating Group . 1980 ten-year plan, State of Florida<br />
: electrical generating facilities, demand and energy, fuels . Florida<br />
Electric Power Coordinating Group ; September 1980 ; 76 p . Available<br />
f rom : Florida Public Service Commission, Tallahassee, FL .<br />
Florida Game and Fresh Water Fish Commission . An analysis of hunting licenses<br />
by county, by series . Unpublished document, ca . 1980a . Available from :<br />
Florida Game and Fresh Water Fish Commission, Tallahassee, FL .<br />
Florida Game and Fresh Water Fish Commission . An analysis of fishing licenses<br />
by county, by series . Unpublished document, ca . 1980b . Available from :<br />
Florida Game and Fresh Water Fish Commission, Tallahassee, FL .<br />
Florida Game and Fresh Water Fish Commission . Legal status of endangered and<br />
potentially endangered species in Florida : 1 October 1980 . Tallahassee,<br />
FL : Florida Game and Fresh Water Fish Commission ; ca . 1980c ; 5 p .<br />
Florida Power and Light Company, Office of Environmental Affairs . Atlas of<br />
environmental jurisdictions in Florida . Miami, FL : Florida Power and<br />
Light Company ; July 1979 .<br />
Florida Public Service Commission, Research and Management Studies Department .<br />
Statistics of the Florida electric industry : 1960-1977 . Tallahassee, FL :<br />
Florida Public Service Commission ; September 1979 ; 205 p .<br />
Florida Public Service Commission, Research and Management Studies Department .<br />
Statistics of the Florida electric industry : supplement 1978 . Tallahassee,<br />
FL : Florida Public Service Commission ; August 1980 89 p .<br />
Florida Public Service Commission . Comparative cost statistics : regulated<br />
utilities, electric, gas, telephone, rail, water, sewer . Tallahassee,<br />
FL : Florida Public Service Commission ; January 1981 ; 67 p .<br />
Florida Resources and Environmental Analysis Center, Florida State University .<br />
Water resources study : Northwest Florida Region . U .S . Army Corps of<br />
Engineers, Mobile District Office ; July 1978 ; 122 p . Available from :<br />
U .S . Army Corps of Engineers, Mobile District Office, Mobile, AL .<br />
Florida State Board of Conservation, Salt Water Fisheries Division . Summary<br />
of Florida commercial marine fish landings : 1955 . Tallahassee, FL :<br />
Florida State Board of Conservation ; 1956 ; 40 p .<br />
Florida State Board of Conservation, Salt Water Fisheries Division . Summary<br />
of Florida commercial marine landings : 1960 . Tallahassee, FL : Florida<br />
State Board of Conservation ; 1961 ; 32 p .<br />
Florida State Board of Conservation, Salt Water Fisheries Division . Summary<br />
of Florida commercial marine landings : 1965 . Tallahassee, FL : Florida<br />
State Board of Conservation ; 1966 ; 61 p .<br />
364
Florida Statistical Abstract 1962 . Tallahassee, FL : Florida Department of<br />
State, Council on Economic Development ; 1962 ; 175 p. Available from :<br />
Florida Department of State, Secretary of State, State Library, Tallahassee,<br />
FL .<br />
Florida Statistical Abstract 1976 . Gainesville, FL : University of Florida,<br />
Bureau of Economic and Business Research ; 1976 ; 643 p . Available from :<br />
The University Presses of Florida, Gainesville, FL .<br />
Florida Statistical Abstract 1977 . Gainesville, FL : University of Florida,<br />
Bureau of Economic and Business Research ; 1977 ; 652 p . Available from :<br />
The University Presses of Florida, Gainesville, FL .<br />
Florida Statistical Abstract 1978 . Gainesville, FL : University of Florida,<br />
Bureau of Economic and Business Research ; 1978 ; 646 p . Available from :<br />
The University Presses of Florida, Gainesville, FL .<br />
Florida Statistical Abstract 1979 . Gainesville, FL : University of Florida,<br />
Bureau of Economic and Business Research ; 1979 ; 653 p . Available from :<br />
The University Presses of Florida, Gainesville, FL .<br />
Florida Statistical Abstract 1980 . Gainesville, FL : University of Florida,<br />
Bureau of Economic and Business Research ; 1980 ; 695 p . Available from :<br />
The University Presses of Florida, Gainesville, FL .<br />
Herndon, R .C . ; Teaf, C . Hazardous waste incidents in the State of Florida .<br />
Tallahassee, FL : Florida Department of Environmental Regulation ; May<br />
1978 ; 48 p .<br />
Industrial Development Research Council . Industrial development reports .<br />
Atlanta, GA : Conway Publications ; bi-monthly reports from 1977 through<br />
mid-1980 . Available from : Conway Publications, Atlanta, GA .<br />
Knight, H .A . ; McClure, J .P . Florida's timber 1970 . Asheville, NC : U .S . Department<br />
of Agriculture, Forest Service ; February 1971 ; Forest Service<br />
Resource Bulletin SE-20 . 48 p .<br />
Larson, G . Florida's timber . Asheville, NC : U .S . Department of Agriculture,<br />
Forest Service ; May 1961 ; Forest Survey Release No . 57 . Available from :<br />
Florida Department of Agriculture, Division of Forestry, Tallahassee, FL .<br />
Leach, S .D . Source, use and disposition of water in Florida, 1975 . Tallahassee,<br />
FL : U .S . Geological Survey ; April 1978 ; Water Resources Investigation<br />
78-17 . 90 p .<br />
Leach, S .D . ; Healy, H .G . Estimated water use in Florida, 1977 . Tallahassee,<br />
FL : U .S . Geological Survey ; 1980 ; Water Resources Investigation 79-112 .<br />
76 p .<br />
McNulty, J .K . ; Lindall, W .N ., Jr . ; Sykes, J .E . Cooperative Gulf of Mexico<br />
estuarine inventory and study, Florida : phase I, area description .<br />
Washington, DC : U .S . Government Printing Affice ; November 1972 ; NOAA<br />
Technical Report NMFS CIRC-368 . 126 p . Available from : Tampa Bay Regional<br />
Planning Council, St . Petersburg, FL .<br />
365
Miller, J .C . Determination of potentially suitable areas for hazardous waste<br />
treatment, storage and disposal facilities in the State of Florida . Tallahassee,<br />
FL : Florida Department of Environmental Regulation ; August<br />
1980 ; 96 p .<br />
Moe, M .A ., Jr . A survey of offshore fishing in Florida . St . Petersburg, FL :<br />
Florida State Board of Conservation Marine Laboratory ; January 1963 ; Professional<br />
papers series no . four . Available from : Florida Department of<br />
Natural Resources, Tallahassee, FL .<br />
National Marine Manufacturers Association . The boating business : 1979 . Chicago,<br />
IL : National Marine Manufacturers Association ; ca . 1980 ; 28 p .<br />
National Oceanic and Atmospheric Administration . Local climatological data,<br />
monthly summary . Asheville, NC : National Climatic Center ; 1956 . Available<br />
from : Library, Florida Department of Environmental Regulation, Tallahassee,<br />
FL .<br />
National Oceanic and Atmospheric Administration . Local climatological data,<br />
monthly summary . Asheville, NC : National Climatic Center ; 1961 ; Available<br />
from : Library, Florida Department of Environmental Regulation, Tallahassee,<br />
FL .<br />
National Oceanic and Atmospheric Administration . Local climatological data,<br />
monthly summary . Asheville, NC : National Climatic Center ; 1966 ; Available<br />
from : Library, Florida Department of Environmental Regulation, Tallahassee,<br />
FL .<br />
National Oceanic and Atmospheric Administration . Local climatological data,<br />
monthly summary . Asheville, NC : National Climatic Center ; 1971 ; Available<br />
from : Library, Florida Department of Environmental Regulation, Tallahassee,<br />
FL .<br />
National Oceanic and Atmospheric Administration . Local climatological data,<br />
monthly summary . Asheville, NC : National Climatic Center ; 1976 ; Available<br />
from : Library, Florida Department of Environmental Regulation, Tallahassee,<br />
FL .<br />
National Oceanic and Atmospheric Administration . Local climatological data,<br />
monthly summary . Asheville, NC : National Climatic Center ; 1981 ; Available<br />
from : Library, Florida Department of Environmental Regulation, Tallahassee,<br />
FL .<br />
New England River Basins Commission ; U .S . Department of the Interior ; RALI<br />
Program . Fact book - onshore facilities related to offshore oil and gas<br />
development . Boston, MA ; New England River Basins Commission ; 1976 ; 300 p .<br />
Northwest Florida Water Management District . Water resources management plan .<br />
Tallahassee, FL : Northwest Florida Water Management District ; 1980 ;<br />
Vol . 1 . 196 p .<br />
Pride, R .W . Estimated use of water in Florida, 1970 . Tallahassee, FL : Florida<br />
Department of Natural Resources, Division of Interior Resources, Bureau<br />
of Geology (for the U .S . Geological Survey) ; August 1973 ; Information circular<br />
no . 83 . 31 p .<br />
366
Pritchard, P .C .H ., editor . Rare and endangered biota of Florida . Gainesville,<br />
FL : University Presses of Florida ; 1978 ; five volumes . Available from :<br />
Florida Game and Fresh Water Fish Commission, Tallahassee, FL .<br />
Sheffield, R .M . Forest statistics for Northwest Florida, 1979 . Asheville, NC :<br />
U .S . Department of Agriculture, Forest Service ; April 1980 ; Forest Service<br />
Resource Bulletin SE-52 . 33 p . Available from : Florida Department of<br />
Agriculture, Division of Forestry, Tallahassee, FL .<br />
Snyder, N .L . ; Knight, H .A . Forest statistics for Central Florida, 1970 .<br />
Asheville, NC : U .S . Department of Agriculture, Forest Service ; September<br />
1970 ; Forest Service Resource Bulletin SE-17 . 35 p . Available from :<br />
Florida Department of Agriculture, Division of Forestry, Tallahassee, FL .<br />
South Florida Regional Planning Council . Environmental review processes in<br />
transportation planning . Miami, FL : South Florida Regional Planning<br />
Council ; 1977 .<br />
Southwest Florida Regional Planning Council . Areawide water quality management<br />
program, section 208 . Fort Myers, FL : Southwest Florida Regional Planning<br />
Council ; August 1978 .<br />
Southwest Florida Regional Planning Council . Agenda item no . 7 . No publication<br />
data available . 18 June 1981 . Available from : Southwest Florida<br />
Regional Planning Council, Fort Myers, FL .<br />
Tampa Bay Regional Planning Council . Technical report : land use, support<br />
services, ownership, population and economics . St . Petersburg, FL :<br />
Tampa Bay Regional Planning Council ; 30 June 1976 .<br />
Tampa Bay Regional Planning Council . Areawide water quality management plan<br />
for the Tampa Bay region . St . Petersburg, FL : Tampa Bay Regional Planning<br />
Council ; June 1978 .<br />
Teaf, C . ; Allen, T . Hazardous waste incidents in the State of Florida . Tallahassee,<br />
FL : Florida Department of Environmental Regulation ; September<br />
1980 ; 51 p .<br />
U .S . Army Corps of Engineers . Waterborne commerce of the United States, calendar<br />
year 1960, Part 2, waterways and harbors, Gulf Coast, Mississippi<br />
River Systems and Antilles . Fort Belvoir, VA : U .S . Army Corps of Engineers,<br />
Water Resources Support Center ; 1962 . Available from : Florida<br />
Department of Transportation, Tallahassee, FL . .<br />
U .S . Army Corps of Engineers . Waterborne commerce of the United States, calendar<br />
year 1965, Part 2, waterways and harbors, Gulf Coast, Mississippi<br />
River Systems and Antilles . Fort Belvoir, VA : U .S . Army Corps of Engineers,<br />
Water Resources Support Center ; 1967 . Available from : Florida<br />
Department of Transportation, Tallahassee, FL .<br />
U .S . Army Corps of Engineers . Waterborne commerce of the United States, calendar<br />
year 1970, Part 2, waterways and harbors, Gulf Coast, Mississippi<br />
River Systems and Antilles . Fort Belvoir, VA : U .S . Army Corps of Engineers,<br />
Water Resources Support Center ; 1972 . Available from : Florida<br />
Department of Transportation, Tallahassee, FL .<br />
367
U .S . Army Corps of Engineers . Waterborne commerce of the United States, calendar<br />
year 1975, Part 2, waterways and harbors , Gulf Coast, Mississippi<br />
River Systems and Antilles . Fort Belvoir, VA : U .S . Army Corps of Engineers,<br />
Water Resources Support Center ; 1977 . Available from : Florida<br />
Department of Transportation, Tallahassee, FL .<br />
U .S . Army Corps of Engineers . Project maps book 19 79 . Mobile, AL : U .S . Army<br />
Corps of Engineers ; 1979 .<br />
U .S . Army Corps of Engineers . Waterborne commerce of the United States, calendar<br />
year 1978, Part 2, waterways and harbors , Gulf Coast, Mississippi<br />
River Systems and Antilles . Fort Belvoir, VA : U .S . Army Corps of Engineers,<br />
Water Resources Support Center ; 1980 . Available from : Florida<br />
Department of Transportation, Tallahassee, FL .<br />
U .S . Department of Commerce, Bureau of the Census . Census of housing : 1950 .<br />
Vol . .1, Part 2 . Washington, DC : U .S . Governm ent Printing Office ; 1953a .<br />
U .S . Department of Commerce, Bureau of the Census . Census of the population :<br />
1950 . Vol . 2, Part 10 . Washington, DC : U .S . Government Printing Office ;<br />
1953b ; 607 p .<br />
U .S . Department of Commerce, Bureau of the Census . Census of agriculture :<br />
1954 . Vol . 1, Part 18 . Washington, DC : U .S . Government Printing Office ;<br />
1957a ; 666 p .<br />
U .S . Department of Commerce, Bureau of the Census . City and county data book :<br />
1956 . Washington, DC : U .S . Government Printi ng Office ; 1957b ; 565 p .<br />
U .S . Department of Commerce, Bureau of the Census . County business patterns<br />
1956 : Part 6 . Washington, DC : U .S . Governme nt Printing Office ; 1958 ;<br />
432 p . .<br />
U .S . Department of Commerce, Bureau of the Census . Census of agriculture :<br />
1959 . Vol . 1, Part 29 . Washington, DC : U .S . Government Printing Office ;<br />
1960 ; 261 p .<br />
U .S . Department of Commerce, Bureau of the Census . County business patterns<br />
1959 : Part 6B . Washington, DC : U .S . Government Printing Office ; 1961 ;<br />
284 p .<br />
U .S . Department of Commerce, Bureau of the Census . City and county data book :<br />
1962 . Washington, DC : U .S . Government Printi ng Office ; 1962a ; 669 p .<br />
U .S . Department of Commerce, Bureau of the Census . Current population reports,<br />
series P-25, No . 7 . Washington, DC : U .S . Gov ernment Printing Office ;<br />
November 1962b ; 90 p .<br />
U .S . Department of Commerce, Bureau of the Census . Census of housing : 1960 .<br />
Vol . 1, Part 3 . Washington, DC : U .S . Government Printing Office ; 1963a .<br />
U .S . Department of Commerce, Bureau of the Census . Census of the population :<br />
1960 . Vol . 1, part 11 . Washington, DC : U .S . Government Printing Office ;<br />
1963b ; 1,112 p .<br />
368
U .S . Department of Commerce, Bureau of the Census . County business patterns<br />
1965 : Florida . Washington, DC : U .S . Government Printing Office ; 1966a ;<br />
105 p .<br />
U .S . Department of Commerce, Bureau of the Census . Housing authorized in<br />
permit-issuing places : 1965 . Washington, DC : U .S . Government Printing<br />
Office ; 1966b ; 294 p .<br />
U .S . Department of Commerce, Bureau of the Census . Census of agriculture :<br />
1964 . Vol . 1, Part 29 . Washington, DC : U .S . Government Printing Office ;<br />
1967a ; 455 p .<br />
U .S . Department of Commerce, Bureau of the Census . City and county data book :<br />
1967 . Washington, DC : U .S . Government Printing Office ; 1967b ; 673 p .<br />
U .S . Department of Commerce, Bureau of the Census . County business patterns<br />
1970 : Florida . Washington, DC : U .S . Government Printing Office ; 1971a ;<br />
126 p .<br />
U .S . Department of Commerce, Bureau of the Census . Current population reports,<br />
series P-25, No . 461 . Washington, DC : U .S . Government Printing Office ;<br />
June 1971b ; 75 p .<br />
U .S . Department of Commerce, Bureau of the Census . Housing authorized by<br />
building permits and public contracts : 1970 . Washington, DC : U .S .<br />
Government Printing Office ; 1971c ; 378 p .<br />
U .S . Department of Commerce, Bureau of the Census . Census of agriculture :<br />
1969 . Vol . 1, Part 29 . Washington, DC : U .S . Government Printing Office ;<br />
1972a ; 528 p .<br />
U .S . Department of Commerce, Bureau of the Census . Census of housing ; 1970 .<br />
Vol . 1, Part 2 . Washington, DC : U .S . Government Printing Office ; 1972b .<br />
U .S . Department of Commerce, Bureau of the Census . Census of the population :<br />
1970 . Vol . 1, Part 11 . Washington, DC : U .S . Government Printing Office ;<br />
1973a ; 2,698 p .<br />
U .S . Department of Commerce, Bureau of the Census . City and county data book :<br />
1972 . Washington, DC : U .S . Government Printing Office ; 1973b ; 1,020 p .<br />
U .S . Department of Commerce, Bureau of the Census . Census of minerals industries<br />
1972 . Washington ; DC : U .S . Government. Printing Office ; 1973c .<br />
U .S . Department of Commerce, Bureau of the Census . Current population reports,<br />
series P-25, No . 517 . Washington, DC : U .S . Government Printing Office ;<br />
May 1974 ; 76 p .<br />
U .S . Department of Commerce, Bureau of the Census . Current population reports,<br />
series P-25, No . 642 .' Washington, DC : U .S . Government Printing Office ;<br />
December 1976a ; 4 p .<br />
U .S . Department of Commerce, Bureau of the Census . Housing authorized by<br />
building permits and public contracts : 1975 . Washington, DC : U .S .<br />
Government Printing Office ; 1976b ; 390 p .<br />
369
U .S . De partment of Commerce, Bureau of the Census . Census of agriculture :<br />
1974 . Vol . 1, Part 9 . Washington, DC : U .S . Government Printing Office ;<br />
1977a ; 395 p .<br />
U .S . Department of Commerce, Bureau of the Census . County business patterns<br />
1975 : Florida . Washington, DC : U .S . Government Printing Office ; 1977b ;<br />
138 p .<br />
U .S . Department of Commerce, Bureau of the Census . Current population reports,<br />
series P-25, No . 657 . Washington, DC : U .S . Government Printing Office ;<br />
May 1977c ; 16 p .<br />
U .S . Department of Commerce, Bureau of the Census . Current population reports,<br />
series P-25, No . 709 . Washington,<br />
September 1977d ; 149 p .<br />
DC : U .S . Government Printing Office ;<br />
U .S . Department of Commerce, Bureau of the Census . City and county data book :<br />
1977 . Washington, DC : U .S . Government Printing Office ; 1978 ; 956 p .<br />
U .S . Department of Commerce, Bureau of the Census . Current population reports,<br />
series P-25, No . 810 . Washington, DC : U .S . Government Printing Office ;<br />
September 1979a ; 99 p .<br />
U .S . Department of Commerce, Bureau of<br />
series P-25, No . 869 . Washington,<br />
November 1979b ; 5 p .<br />
U .S . Department of Commerce, Bureau of<br />
1978 : Florida . Washington, DC :<br />
145 p .<br />
the Census . Current population reports,<br />
DC : U .S . Government Printing Office ;<br />
the Census . County business patterns<br />
U .S . Government Printing Office ; 1980a ;<br />
U .S . Department of Commerce, Bureau of the Census . Current population reports,<br />
series P-25, No . 873 . Washington, DC : U .S . Government Printing Office ;<br />
February 1980b ; 98 p .<br />
U .S . Department of Commerce, Bureau of the Census . Housing authorized by<br />
building permits and public contracts : 1979 . Washington, DC : U .S .<br />
Government Printing Office ; 1980c ; 381 p .<br />
U .S . Department of Commerce, Bureau of the Census . Census of agriculture :<br />
1978 . Washington, DC : U .S . Government Printing Office ; 1981a .<br />
U .S . Department of Commerce, Bureau of<br />
housing : advance report : 1980 .<br />
ing Office ; 1981b .<br />
the Census . Census of population and<br />
Washington, DC : U .S . Government Print-<br />
U .S . Department of Commerce, Bureau of Economic Analysis . Northwest Florida<br />
industrial water supply requirements . Mobile, AL : U .S . Army Corps of<br />
Engineers, Mobile District ; February 1979 ; 44 p .<br />
U .S . Department of Energy, Economic Regulatory Administration, Office of Utility<br />
Systems . The national power grid study, Vol . 1 . Washington, DC :<br />
U .S . Government Printing Office ; 1980 ; 77 p .<br />
370
U .S . Department of Energy, Energy Information Administration . Steam-electric<br />
plant construction costs and annual production expenses : 1975 . Washington,<br />
DC : U .S . Government Printing Office ; 1977 .<br />
U .S . Department of Energy, Energy Information Administration . Gas turbine<br />
electric plant construction costs and annual production expenses : 1975 .<br />
Washington, DC : U .S . Government Printing Office ; 1978a ; 103 p .<br />
U .S . Department of Energy, Energy Information Administration . Statistics of<br />
privately-owned electric utilities in the United States : 1976 . Washington,<br />
DC : U .S . Government Printing Office ; 1978b ; 1,509 p .<br />
U .S . Department of Energy, Energy Information Administration . Gas turbine<br />
electric plant construction costs and annual production expenses : 1977 .<br />
Washington, DC : U .S . Government Printing Office ; 1979a ; 104 p .<br />
U .S . Department of Energy, Energy Information Administration . Statistics of<br />
privately-owned electric utilities in the United States : 1977 . Washington,<br />
DC : U .S . Government Printing Office ; 1979b ; 1,409 p .<br />
U .S . Department of Energy, Energy Information Administration . Statistics of<br />
publicly-owned electric utilities in the United States : 1978 . Washington,<br />
DC; U .S . Government Printing Office ; 1979c ; 164 p .<br />
U .S . Department of Energy, Energy Information Administration . Steam-electric<br />
plant construction costs and annual production expenses : 1978 . Washington,<br />
DC : U .S . Government Printing Office ; 1980 ; 199 p .<br />
U .S . Department of Energy, Office of Utility Systems . The national power grid<br />
study, Vol . 1 . Washington, DC : U .S . Government Printing Office ; 1978 .<br />
U .S . Department of Energy . Statistics of interstate natural gas pipeline companies<br />
: 1976 . Washington, DC : U .S . Government Printing Office ; ca . 1978 .<br />
U .S . Department of Energy . Statistics of interstate natural gas pipeline companies<br />
: 1977 . Washington, DC : U .S . Government Printing Office ; ca . 1979 .<br />
U .S . Department of Energy . Statisti.cs of interstate natural gas pipeline companies<br />
: 1978 . Washington, DC : U .S . Government Printing Office ; ca . 1980 .<br />
U .S . Department of Energy . Statistics of interstate natural gas pipeline companies<br />
: 1979 . Washington, DC : U .S . Government Printing Office ; ca . 1981 .<br />
U .S . Department of Health, Education, and Welfare, Public Health Service .<br />
Health manpower : a county and metropolitan area data book . Rockville,<br />
MD : Public Health Service ; 1971a ; 164 p .<br />
U .S . Department of Health, Education, and Welfare, Public Health Service .<br />
LPN's 1967 : an inventory of licensed practical nurses . Washington, DC :<br />
U .S . Government Printing Office ; 1971b ; 101 p .<br />
U .S . Department of Health, Education, and Welfare, Public Health Service .<br />
Li.censed optometrists in Florida : 1973 . Washington, DC : U .S . Government<br />
Printing Office ; 1974 ; 134 p .<br />
371
U .S . Department of the Interior, Bureau of Land Management . Draft environmental<br />
impact statement for OCS lease sale 66 and A66 . New Orleans, LA :<br />
U .S . Department of the Interior ; 1980 . Available from : U .S . Government<br />
Printing Office, Washington, DC .<br />
U .S . Department of the Interior, Bureau of Mines . Minerals yearbook : 1955 .<br />
Vol . 3 . Washington, DC : U .S . Government Printing Office ; 1958 ; 1,220 p .<br />
U .S . Department of the Interior, Bureau of Mines . The mineral industry of<br />
Florida . Washington, DC : U .S . Government Printing Office ; 1960 .<br />
U .S . Department of the Interior, Bureau of Mines . Minerals yearbook : 1960 .<br />
Vol . 3 . Washington, DC : U .S . Government Printing Office ; 1961 ; 1,161 p .<br />
U .S . Department of the Interior, Bureau of Mines . The mineral industry of<br />
Florida . Washington, DC : U .S . Government Printing Office ; 1965 .<br />
U .S . Department of the Interior, Bureau of Mines . Minerals yearbook : 1965 .<br />
Vol . 3 . Washington, DC : U .S . Government Printing Office ; 1967 ; 928 p .<br />
U .S . Department of the Interior, Bureau of Mines . The mineral industry of<br />
Florida . Washington, DC : U .S . Government Printing Office ; 1970 .<br />
U .S . Department of the Interior, Bureau of Mines . Minerals yearbook : 1970 .<br />
Vol . 3 . Washington, DC : U .S . Government Printing Office ; 1972 ; 807 p .<br />
U .S . Department of the Lnterior, Bureau of Mines . The mineral industry of<br />
Florida . Washington, DC : U .S . Government Printing Office ; 1975 .<br />
U .S . Department of the Interior, Bureau of Mines . Economic impact of the<br />
phosphate industry on selected Florida counties, Florida and the United<br />
States . Washington, DC : U .S . Government Printing Office ; September<br />
1978a . Available from : Florida Resources and Environmental Analysis<br />
Center, Florida State University, Tallahassee, FL .<br />
U .S . Department of the Interior, Bureau of Mines . Minerals yearbook : 1975 .<br />
Vol . 2 . Washington, DC : U .S . Government Printing Office ; 1978b ; 847 p .<br />
U .S . Department of the Interior, Bureau of Mines . Minerals in the economy of<br />
Florida . Pittsburgh, PA : Publications Department, Bureau of Mines ; 1978c ;<br />
18 p .<br />
U .S . Department of the Interior, Bureau of Mines . Minerals in the economy of<br />
Florida . Washington, DC : U .S . Government Printing Office ; 1979 .<br />
U .S . Department of the Interior, Bureau of Mines . Minerals yearbook : 1979 .<br />
Vol . 3 . Washington, DC : U .S . Government Printing Office ; 1981 .<br />
U .S . Department of the Interior, Heritage Conservation and Recreation Service .<br />
National Register of historic properties, 18 March 1979 . Federal Register<br />
45(54) :17451-17452 .<br />
U .S . Department of the Interior, U .S . Geological Survey . Map of the State of<br />
Florida . No publication data available ; 1967 . Available from : U .S .<br />
Geological Survey, Tallahassee, FL .<br />
372
U .S . De partment of the Interior, Geological Survey, Conservation Division .<br />
OCS statistics . Washington, DC : U .S . Government Printing Office ; ca .<br />
1981 ; Open file report 80-864 .<br />
U .S . Environmental Protection Agency . Draft areawide environmental impact<br />
statement ; Central Florida phosphate industry . Atlanta, GA : U .S . Environmental<br />
Protection Agency ; ca . 1978 . Available from : Tampa Bay Regional<br />
Planning Council, St . Petersburg, FL .<br />
U .S . Federal Energy Regulatory Commission, Office of Electric Power Regulation .<br />
Power pooling in the Southwest region . Washington, DC : U .S . Government<br />
Printing Office ; August 1980 ; 191 p .<br />
U .S . Federal Power Commission . Statistics of privately-owned electric utilities<br />
in the United States : 1955 . Washington, DC : U .S . Government Printing<br />
Office ; ca . 1956a .<br />
U .S . Federal Power Commission . Statistics of publicly-owned electric utilities<br />
in the United States : 1955 . Washington, DC : U .S . Government Printing<br />
Office, ca . 1956b .<br />
U .S . Federal Power Commission . Steam-electric plant construction costs and<br />
annual production expenses : 1955 . Washington, DC : U .S . Government Printing<br />
Office ; ca . 1956c .<br />
U .S . Federal Power Commission . Statistics of privately-owned electric utilities<br />
in the United States : 1960 . Washington, DC : U .S. Government Printing<br />
Office ; ca . 1961a .<br />
U .S . Federal Power Commission . Statistics of publicly-owned electric utilities<br />
in the United States : 1960 . Washington, DC : U .S . Government Printing<br />
Office ; ca . 1961b .<br />
U .S . Federal Power Commission . Steam-electric plant construction costs and<br />
annual production expenses : 1960. Washington, DC : U .S. Government Printing<br />
Office ; ca . 1961c .<br />
U .S . Federal Power Commission . Steam-electric plant construction costs and<br />
annual production expenses : 1965 . Washington, DC : U .S . Government<br />
Printing Office ; 1966a ; 175 p .<br />
U .S . Federal Power Commission . Statistics of privately-owned electric utilities<br />
in the United States : 1965. Washington, DC : U .S . Government Printing<br />
Office ; ca . 1966b .<br />
U .S . Federal Power Commission . Statistics of privately-owned electric utilities<br />
in the United States : 1970. Washington, DC : U .S . Government Printing<br />
Office ; 1971a .<br />
U .S . Federal Power Commission . Statistics of publicly-owned electric utilities<br />
in the United States : 1970 . Washington, DC : U .S . Government Printing<br />
Office ; 1971b .<br />
U .S . Federal Power Commission . Statistics of publicly-owned electric utilities<br />
in the United States : 1970 . Washington, DC : U .S . Government Printing<br />
Office ; 1972a .<br />
373
U .S . Federal Power Commission . Statistics of publicly-owned electric utilities<br />
in the United States : 1971 . Washington, DC : U .S . Government Printing<br />
Office ; 1972b .<br />
U .S . Federal Power Commission . Steam-electric plant construction costs and<br />
annual production expenses : 1970 . Washington, DC : U .S . Government<br />
Printing Office ; 1972c ; 171 P•<br />
U .S . Federal Power Commission .<br />
annual production expenses :<br />
Printing Office ; 1972d ; 145<br />
Steam-electric plant construction costs and<br />
1971 . Washington, DC : U .S . Government<br />
P•<br />
U .S . Federal Power Commission . Statistics of privately-owned electric utilities<br />
in the United States : 1972 . Washington, DC : U .S . Government Printing<br />
Office ; 1973a .<br />
U .S . Federal Power Commission . Statistics of publicly-owned electric utilities<br />
in the United States : 1972 . Washington, DC : U .S . Government<br />
Printing Office ; 1973b .<br />
U .S . Federal Power Commission . Steam-electric plant construction costs and<br />
annual production expenses : 1972 . Washington, DC : U .S . Government<br />
Printing Office ; ca . 1973c ; 145 p .<br />
U .S . Federal Power Commission . Statistics of interstate natural gas pipeline<br />
companies : 1972 . Washington, DC : U .S . Government Printing Office ; ca .<br />
1973d .<br />
U .S . Federal Power Commission . Steam-electric plant construction costs and<br />
annual production expenses : 1973 . Washington, DC : U .S . Government<br />
Printing Office ; ca . 1974a ; 145 p .<br />
U .S . Federal Power Commission . Statistics of privately-owned electric utilities<br />
in the United States : 1973 . Washington, DC : U .S . Government Printing<br />
Office ; 1974b .<br />
U .S . Federal Power Commission . Statistics of publicly-owned electric utilities<br />
in the United States : 1973 . Washington, DC : U .S . Government Printing<br />
Office ; ca . 1974c .<br />
U .S . Federal Power Commission . Statistics of interstate natural gas pipeline<br />
companies : 1973 . Washington, DC : U .S . Government Printing Office ; ca .<br />
1974d .<br />
U .S . Federal Power Commission . Statistics of privately-owned electric utilities<br />
in the United States : 1974 . Washington, DC : U .S . Government Printing<br />
Office ; ca . 1975a .<br />
U .S . Federal Power Commission . •Statistics of publicly-owned electric utilities<br />
in the United States : 1974 . Washington, DC : U .S . Government Printing<br />
Office ; ca . 1975b .<br />
U .S . Federal Power Commission . Steam-electric plant construction costs and<br />
annual production expenses : 1974 . Washington, DC : U .S . Government<br />
Printing Office ; ca . 1975c ; 145 p .<br />
374
U .S . Federal Power Commission . Statistics of interstate natural gas pipeline<br />
companies : 1974 . Washington, DC : U .S . Government Printing Office ; ca .<br />
1975d .<br />
U .S . Federal Power Commission . Statistics of privately-owned electric utilities<br />
in the United States : 1975 . Washington, DC : U .S . Government Printing<br />
Office ; ca . 1976a .<br />
U .S . Federal Power Commission . Statistics of publicly-owned electric utilities<br />
in the United States : 1975 . Washington, DC : U .S . Government Printing<br />
Office ; ca . 1976b .<br />
U .S . Federal Power Commission . Statistics of interstate natural gas pipeline<br />
companies : 1975 . Washington, DC : U .S . Government Printing Office ; ca .<br />
1976c .<br />
U .S . Federal Power Commission . Statistics of privately-owned electric utilities<br />
in the United States : 1976 . Washington, DC : U .S . Government Printing<br />
Office ; 1977 .<br />
University of Florida, Bureau of Economic and Business Research, Division of<br />
Population Studies . Age, race, and sex components of Florida's population<br />
. Gainesville, FL : The University Presses of Florida ; April 1979 ;<br />
Bulletin 47 . Available from : University of Florida, Bureau of Economic<br />
and Business Research, Gainesville, FL .<br />
University of Florida, Institute of Food and Agricultural Sciences . Agricultural<br />
growth in an urban age . Gainesville, FL : University of Florida,<br />
Institute of Food and Agricultural Sciences ; ca . 1975 .<br />
Veri, A . ; Jenna, W . ; Bergamaschi, D . Environmental quality by design : South<br />
Florida . Miami, FL : University of Miami Press ; September 1975 .<br />
Whitfield, W .K ., Jr . Mining of submerged shell deposits : history and status<br />
of regulation and production of the Florida industry . St . Petersburg,<br />
FL : Florida Department of Natural Resources, Marine Research Laboratory ;<br />
1975 ; Fla . Mar . Res . Publ . 11 . 49 p . Available from : Florida Department<br />
of Natural Resources, Tallahassee, FL .<br />
Wood, R . ; Fernald, E . The new Florida atlas . Tallahassee, FL : Trend Publications<br />
; 1974 . Available from : Florida Resources and Environmental Analysis<br />
Center, Florida State University, Tallahassee, FL .<br />
Zellars-Williams, Inc . Evaluation of the phosphate deposits of Florida using<br />
the minerals availability system : final report . Lakeland, FL : June<br />
1978 .<br />
* U .S . GOVERNMENT PRINTING OFFICE : 1983-769-627<br />
375
0<br />
.<br />
,<br />
,<br />
,~<br />
~<br />
-li1'' --<br />
~. . .<br />
. ~<br />
- ~<br />
Hawaifan Islands `<br />
.<br />
.<br />
~ Headquarters, Division of Biological<br />
Services, Washington, DC<br />
X Eastern Energy and Land Use Team<br />
Leetown, WV<br />
* National Coastal Ecosystems Team<br />
Slidell, LA<br />
• Western Energy and Land Use Team<br />
Ft . Collins, CO<br />
~ Locations of Regional Offices<br />
REGION 1<br />
Regional Director<br />
U .S . Fish and Wildlife Service<br />
Lloyd Five Hundred Building, Suite 1692<br />
500 N .E . Multnomah Street<br />
Portland, Oregon 97232<br />
REGION 4<br />
Regional Director<br />
U .S . Fish and Wildlife Service<br />
Richard B. Russell Building<br />
75 Spring Street, S .W .<br />
Atlanta, Georgia 30303<br />
REGION 2<br />
Regional Director<br />
U.S . Fish and Wildlife Service<br />
P .O . Box 1306<br />
Albuquerque, New Mexico 87103<br />
REGION 5<br />
Regional Director<br />
U .S . Fish and Wildlife Service<br />
One Gateway Center<br />
Newton Corner, Massachusetts 02158<br />
REGION 7<br />
Regional Director<br />
U .S . Fish and Wildlife Service<br />
1011 E . Tudor Road<br />
Anchorage, Alaska 99503<br />
'0<br />
5<br />
ue o CO an<br />
c:::,- :<br />
Vir in Islands<br />
REGION 3<br />
Regional Director<br />
U .S . Fish and Wildlife Service<br />
Federal Building, Fort Snelling<br />
Twin Cities, Minnesota 55111<br />
REGION 6<br />
Regional Director<br />
U .S . Fish and Wildlife Service<br />
P .O . Box 25486<br />
Denver Federal Center<br />
Denver, Colorado 80225
~~ N s y ~~~ ~<br />
~ .<br />
DEPARTMENT OF THE INTERIOR<br />
~.~ U .S . fISN AND WILDIIEE SERYICE 4<br />
.<br />
As the Nation's principal conservation agency, the Department of the Interior has respon•<br />
sibiiity for most of our .nationaly owned public lands and natural resources . This inciudes<br />
fostering the wisest use of our land and water resources, protecting our fish and wildlife,<br />
preserving ths.environmental and cultural values of our national parks and historical piaces,<br />
and providing for the enjoyment of life through outdoor recreation . The Department assesses<br />
our energy and mineral resources and works to assure that their development is in<br />
the best interests of all our people . The Department also has a major responsibility for<br />
American Indian reservation communities and for people who iive in island territories under<br />
U .S . administration .